Article

Is There a Kuznets Curve Effect for China’s Land-Driven Development Mode?

1
School of Management Science and Engineering, Central University of Finance and Economics, Beijing 100081, China
2
Department of City and Regional Planning, The University of North Carolina at Chapel Hill, Chapel Hill, NC 27599, USA
*
Author to whom correspondence should be addressed.
Sustainability 2019, 11(16), 4446; https://doi.org/10.3390/su11164446
Submission received: 18 July 2019 / Revised: 9 August 2019 / Accepted: 12 August 2019 / Published: 16 August 2019
(This article belongs to the Section Economic and Business Aspects of Sustainability)

Abstract

:
This paper empirically investigates whether the contribution of land-driven development to economic growth has declined along with the Kuznets curve hypothesis by using a nonlinear dynamic model. Over the past 40 years, Chinese local governments have raised commercial–residential land prices, mortgaged reserve land to gain valuable funds to facilitate urban construction and then improve urbanization, and driven down industrial land prices to attract foreign direct investment (FDI) and promote industrialization. By controlling the land market, this typical land-driven development mode has played a significant role in the process of local industrialization and urbanization. However, with the change in cities’ internal and external conditions, many problems hidden in this mechanism have begun to emerge. The results from the dynamic panel data method reveal that, at the national level, the effect of land supply on local economies initially indicates an increase and then a drop, which is an inverted U-shaped curve, or the Kuznets curve effect. The impact of land-driven development has declined in China’s economic transformation period, but at the regional level, in the eastern and mid-western regions, there is a different reason.

1. Introduction

Since the 1990s, land has played an important role in China’s local economic development, especially in urbanization and industrialization. This was due to taxation system reforms in 1994 and heavy competition between local officials looking for promotion. For China’s local governments, land resources are their key means of production. Through a monopoly of land expropriation and land supply, Chinese local governments, on the one hand, have sold commercial–residential land at a high price and mortgaged reserve land to gain valuable funds to facilitate urban construction and then improve urbanization, and on the other hand, have set up industrial parks and sold industrial land at a low price to attract investment and promote industrialization [1]. This unique land-driven development mode was first started in the eastern local governments; after 2000, this development mode gradually became nationwide since China’s development of the central and western region. [2] By far, although this unique development mode has led to land resource misallocation, this mode has also made a significant contribution to local industrialization and urbanization. China’s economy has maintained rapid growth for more than 30 years, and the urbanization rate increased from 26.4% in 1990 to 58.5% by the end of 2017.
However, the potential problems of land supply and the misallocation of land resources began to emerge with China’s reduction in economic growth and economic structural changes, leading to a change in the land supply and demand structure. The existing literature includes a lot of research on the effect of land supply and economic growth from many perspectives. Most of this research holds the positive point of view that, although China has a land resource allocation problem, this has stimulated economic growth. However, today, because of high local debt, an aging population, environmental degradation, and trade frictions, China is trying to transform its economic development from a foreign export-oriented to a domestic demand-oriented mode, and economic growth has declined from high-speed to medium-high-speed growth as the “new normal” [3], but local governments still want to stimulate the economy by having a large supply of land. By far, whether land will be available for transfer, whether land will still provide with local revenue source, whether the contribution of land-driven development to economic growth has an inverted U-shaped or Kuznets curve effect, whether the effect of land-driven development on local economic growth has declined or passed the turning point of the curve and changed from positive to negative, whether local governments can still use this land-driven development mode, all the above considerations are defined as the sustainability of this mode, i.e., the sustainability of this mode has not yet answered. What is more, there is big economic gap between the eastern region and mid-western region, but both the eastern and mid-western regions adopt the same development mode, no research has ever answered whether the mode has a different effect in the eastern region and mid-western region, and whether there is land oversupply in China’s cities. This paper focuses on the influence of the change of land supply on local industrialization and urbanization, studies whether or not land-driven development is still a viable option, and fills the research gap in whether this development mode is still sustainable in this economic transformation period. It is of great significance to China’s land policy reform and future transformation.
There are three main contributions of this study. First, it gathers and summarizes the theoretical problems that local governments have had with land-driven development within China’s economic transformation. Second, based on the sequence of the effects of the process of transmitting the land supply to the local economy, this study uses a nonlinear dynamic model to empirically test the research questions. According to the theoretical and empirical results of this study, the contribution of land supply to economic growth has gradually declined and there is an oversupply of land in many cities. Third, this paper discusses the reason why the contribution of land-driven development to economic growth has declined in different regions of China. These results and discussions will give ideas to local governments for future transformation and help China to reduce its high local financial risks, attract more foreign direct investment (FDI) under the backdrop of increasingly fierce international trade friction, improve the relationship between economic development and land use policy, and achieve stable and sustainable growth. Meanwhile, the sustainability of this typical land-driven development mode can provide important and beneficial lessons for other developing countries.
The remainder of this paper is organized as follows. The next section presents a literature review and basic features of the influence path of land-driven development. Section 3 describes the main problems and risks of this development mode and a theoretical analysis of its decline. Section 4 outlines the research methodology and data. The results are presented in Section 5. Finally, Section 6 discusses conclusions and policy recommendations, together with some limitations and recommendations for further research.

2. Literature Review on the Land-Driven Development Mode

2.1. Reasons Why Land Resources Can Become Important for Local Governments

China’s unique public fiscal system and land system explain why land has become an important driving force in urban development and forms the typical land-driven development mode [4], having many typically Chinese characteristics. After the 1980s, in order to motivate local governments to promote reform and develop the economy, the central government formulated a performance evaluation mechanism for local officials, with the gross domestic product (GDP) growth rate of their jurisdictions as the core evaluation index. Local government officials had to do everything they possibly could to integrate their economic and political resources in order to promote rapid economic growth in the region. Hence, promoting urban infrastructure construction and industrial development and growing local economies became the top priority of local governments [5]. However, the tax sharing reform in 1994 greatly reduced the fiscal revenue of local governments and a large amount of revenue was handed over to the central government. How to get huge funds for city development is a problem faced by all local governments, which could only find extrabudgetary sources of revenue. According to China’s national land ownership system and land management law, local governments have absolute control over land expropriation and supply, they can expropriate rural collective-owned land and change the land ownership to state-owned urban land; meanwhile, land is an important resource for economic development. Therefore, land resources have first been an important tool of local governments in the eastern region since the 1990s; in 2000, with the mid-western development of China, the local governments in the mid-western region started to imitate the eastern region, then land resource became a nationwide tool [6]. China’s land management law endows land with property and production factor characteristics [7]. Property characteristics of land make local governments raise land prices to gain capital [8]. Production characteristics result in local governments using land as an important production factor to attract FDI.

2.2. Main Features of Land-Driven Development Mode

The impact of local governments on the economy through land supply is mainly seen in urbanization and industrialization [9]. The main features of land-driven development can be summarized as follows.
First, local governments acquire rural collective-owned land, then change the land ownership to state-owned urban land with low compensation. Rural collective-owned land includes cultivated land, forests, mountain land, etc. Among these, cultivated land accounts for the highest proportion, Rong [10] calculates that because of local governments’ power of land expropriation, they expropriate rural collective-owned land from farmers and compensate them with 6–10 years of farming income that they could earn from this land. Then the local governments transform the land ownership to state-owned urban land for urban construction and divide that urban construction land into industrial, commercial, and residential land and land for other uses, based on location and potential use [11].
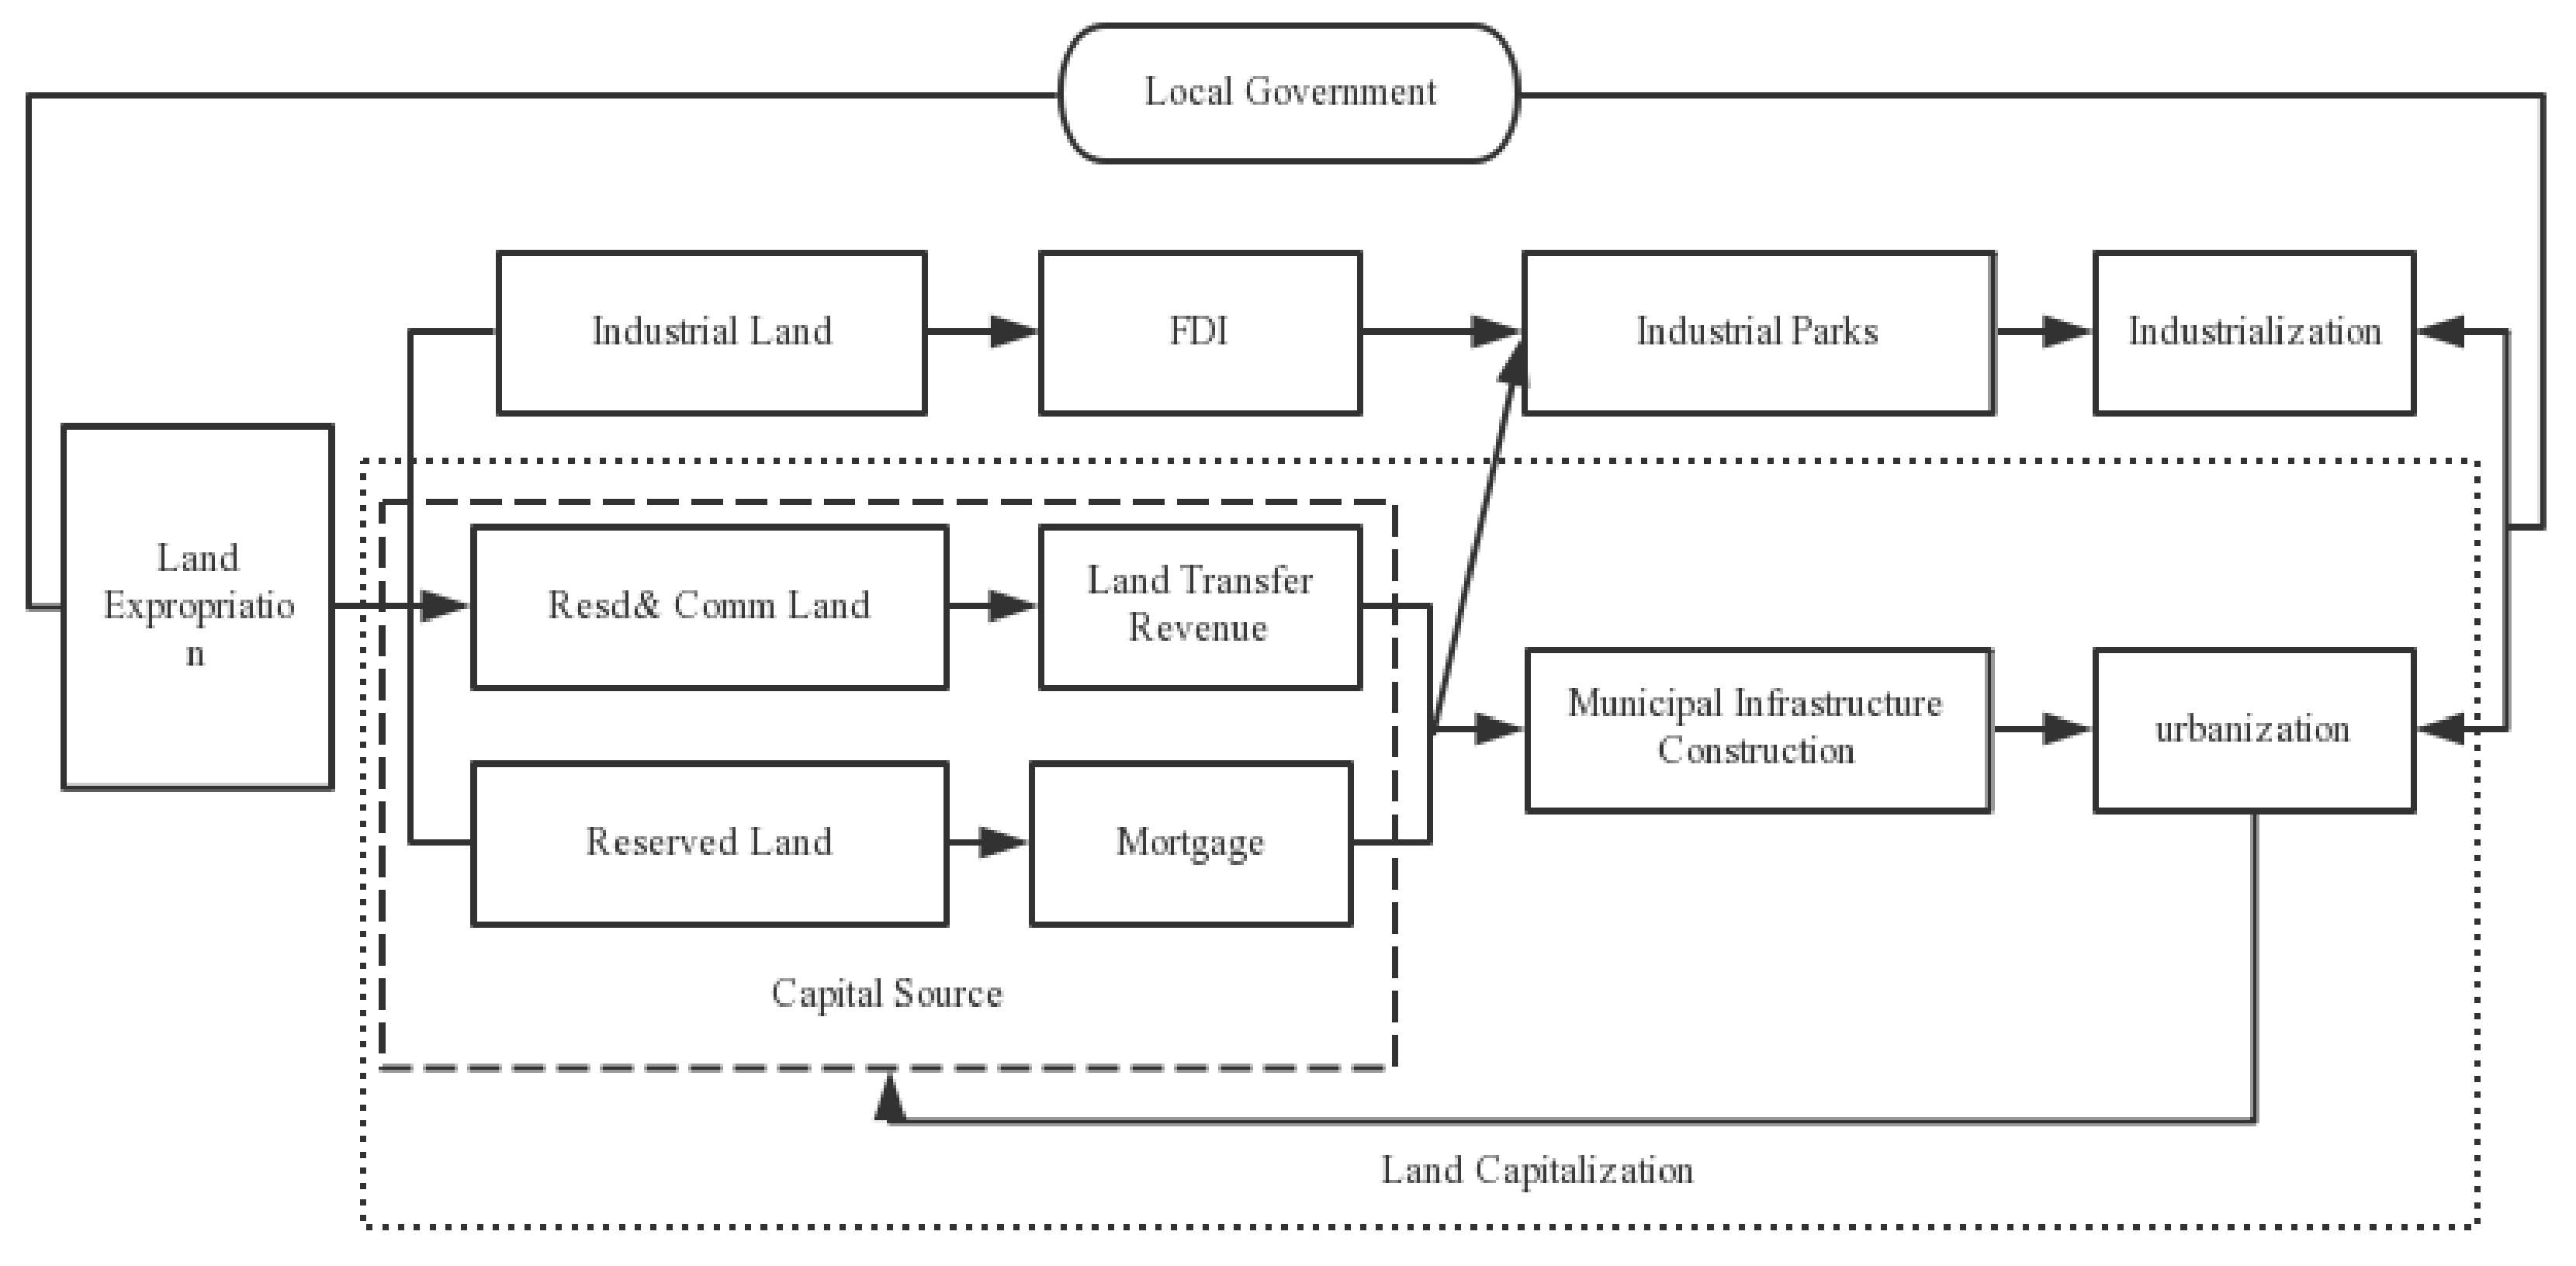
Second, because of the property characteristics of land, local governments drive up the price of commercial–residential land and then sell it to get high land transfer fees. The price of commercial and residential land has risen quickly since 2000 (Figure 1). According to the Ministry of Finance of China [12], from 1998 to 2016, the cumulative land transfer fees reached 35,000 billion yuan. According to the land management law, the land transfer fees have tight spending limits, which can only be used in urban infrastructure [13]. Meanwhile, China implemented the Measures for Land Reserve Administration in 2007, clearly pointing out that local governments can apply for loans from financial institutions with reserve land as a mortgage. Since then, local governments set up land banking mechanisms, mortgaging the reserve land they previously expropriated to banks for loans and using these land mortgage loans for urban infrastructure construction [14]. Through land transfer fees and land mortgage financing, this capitalization process ensures that local governments have enough capital to improve municipal infrastructure construction and develop further industrial park facilities [15].
Third, local governments sell the industrial land at a low price to attract FDI to promote industrialization. Although urbanization by commercial–residential land promotes the construction of urban infrastructure facilities and fixed asset investments, this only provides short-term development momentum. Industry is the core driving force of long-term economic development [16]. Local governments in China have been under political and economic pressure to compete fiercely to attract foreign direct investment for decades. In contrast with Western countries, China’s local governments do not have legislative power to tax and tax competition does not apply, but land is an important resource for local governments. By using discretionary power over land, local governments sell industrial land at prices that are far lower than the cost of land expropriation, or even give away industrial land for free to attract FDI [17]. Fierce competition has made the average price of industrial land in every city remain at a low level and constant for years (Figure 1). However, low prices for industrial land are very tempting because they can relieve funding pressure on companies. It turned out to be a great success: from 2000 to 2017, China attracted $1628.01 billion in FDI, and annual FDI is still increasing [18].
The land-driven development mode is indicated in Figure 2.

2.3. Sustainability of Land-Driven Development Mode

The sustainability of land-driven development mode means that, currently, this mode still provides a local revenue source, has a positive impact on China’s economic growth, and local governments can use this mode in the future to develop local economy. There are many studies on the relationship of land supply and China’s economic growth, but currently, China has entered the transitional period, economic growth has declined from high-speed to medium-high-speed growth as the “new normal,” and this mode has also accumulated some problems and risks; very few focus on the sustainability of this mode.
Some studies hold that there is a positive relationship between land and economic development. Through the endogenous growth model, Barro [19] extended the endogenous economic growth model to incorporate a government sector. He holds that, in both developed and developing countries, land resources contribute a lot to economic development and that governments can promote long-term economic growth by providing public facilities such as infrastructure. Demetriades et al. [20] utilise an intertemporal optimisation framework to study the impacts of public infrastructure capital on output supply and input demands in 12 Organisation for Economic Co-operation and Development (OECD) countries, and state that infrastructure as a public good provided by the governments further promotes overall economic development by improving the investment environment and influencing the cost of enterprises. Tao and Yuan [21] base is on the regional economic gap in China; they point out that local governments release budget constraints by controlling land resources, but different regions have different results. In the eastern region, this not only achieves regional economic growth, but also meets their promotion objectives; however, in the mid-western region, because of low economic level, land resource does not bring significant fiscal revenue to local governments. Li and Luo [22], using a dynamic model, found that low industrial land prices and high commercial–residential land prices are the main reasons for land resource allocation problems; the impact of land resource misallocation on the eastern region is positive and can improve industrial upgrading, while the impacts on the mid-western region are significantly negative.
However, many scholars believe that the impact of land on economic growth is nonlinear. Egert et al. [23] found a strong nonlinear relationship between infrastructure investment and economic growth from OECD countries. The effect of infrastructure investment varies over time, and in some cases does not promote increased per capita output, and even has a negative impact on economic growth. Through an empirical analysis of the data of developed countries, Bougheas [24] introduced infrastructure as a cost-reducing technology in endogenous growth model, and stated that the relationship between infrastructure and economic growth presents an inverted U-shaped curve. At present, infrastructure investment in most developing countries is insufficient and still on the rising part of the curve.
From the literature review, we can see that previous research was mainly focused on the features of land-driven development and its contributions to economic growth. Most studies hold the view that there is a positive relationship between land and economic growth in both China and other countries. In China, although it is a kind of land resource allocation problem, it provides strong support for China’s rapid urbanization and industrialization, especially in the eastern region. Only some scholars have pointed out that infrastructure investment has an inverted U-shaped curve in developed countries. Few scholars focus their attention on the sustainability of land supply in local economic development in China. However, with China’s internal and external conditions changing, does this unique mechanism still have positive incentives for China’s economic development? Below, theoretical and empirical analysis are used to answer the following research questions:
  • At the national level, does the impact of the land-driven development on economic growth have the Kuznets effect? Since the impact of local government on the economy through land supply is mainly seen in urbanization and industrialization, has the impact of land supply on urbanization and industrialization passed the turning point and gone from positive to negative? Is this mechanism still sustainable?
  • Do local governments have an oversupply of land at present?
  • At the regional level, the local governments in the mid-western region adopt the same development mode as the eastern region; however, there is a big economic gap between the eastern region and the mid-western region. Has the mid-western region achieved the same results as the eastern region? Are there significant regional differences, and what are the underlying mechanisms?

3. Theoretical Analysis of the Problems and Decline of Land-Driven Development Mode

Although the land dependence of China’s local government has never changed and there has been great success, many potential problems of land resource misallocation and dependence have emerged as China’s internal and external conditions have changed. These are mainly as follows.

3.1. Land Expropriation Is Unsustainable

China’s arable land resources are not as abundant as those of many other countries of similar size, such as the United States, Brazil, and Australia [25]. According to World Bank estimates, the cultivated land area of China was only 0.09 hectares per person, ranking 126th in the world by the end of 2016, far below the world average level of 0.2 hectares per person.
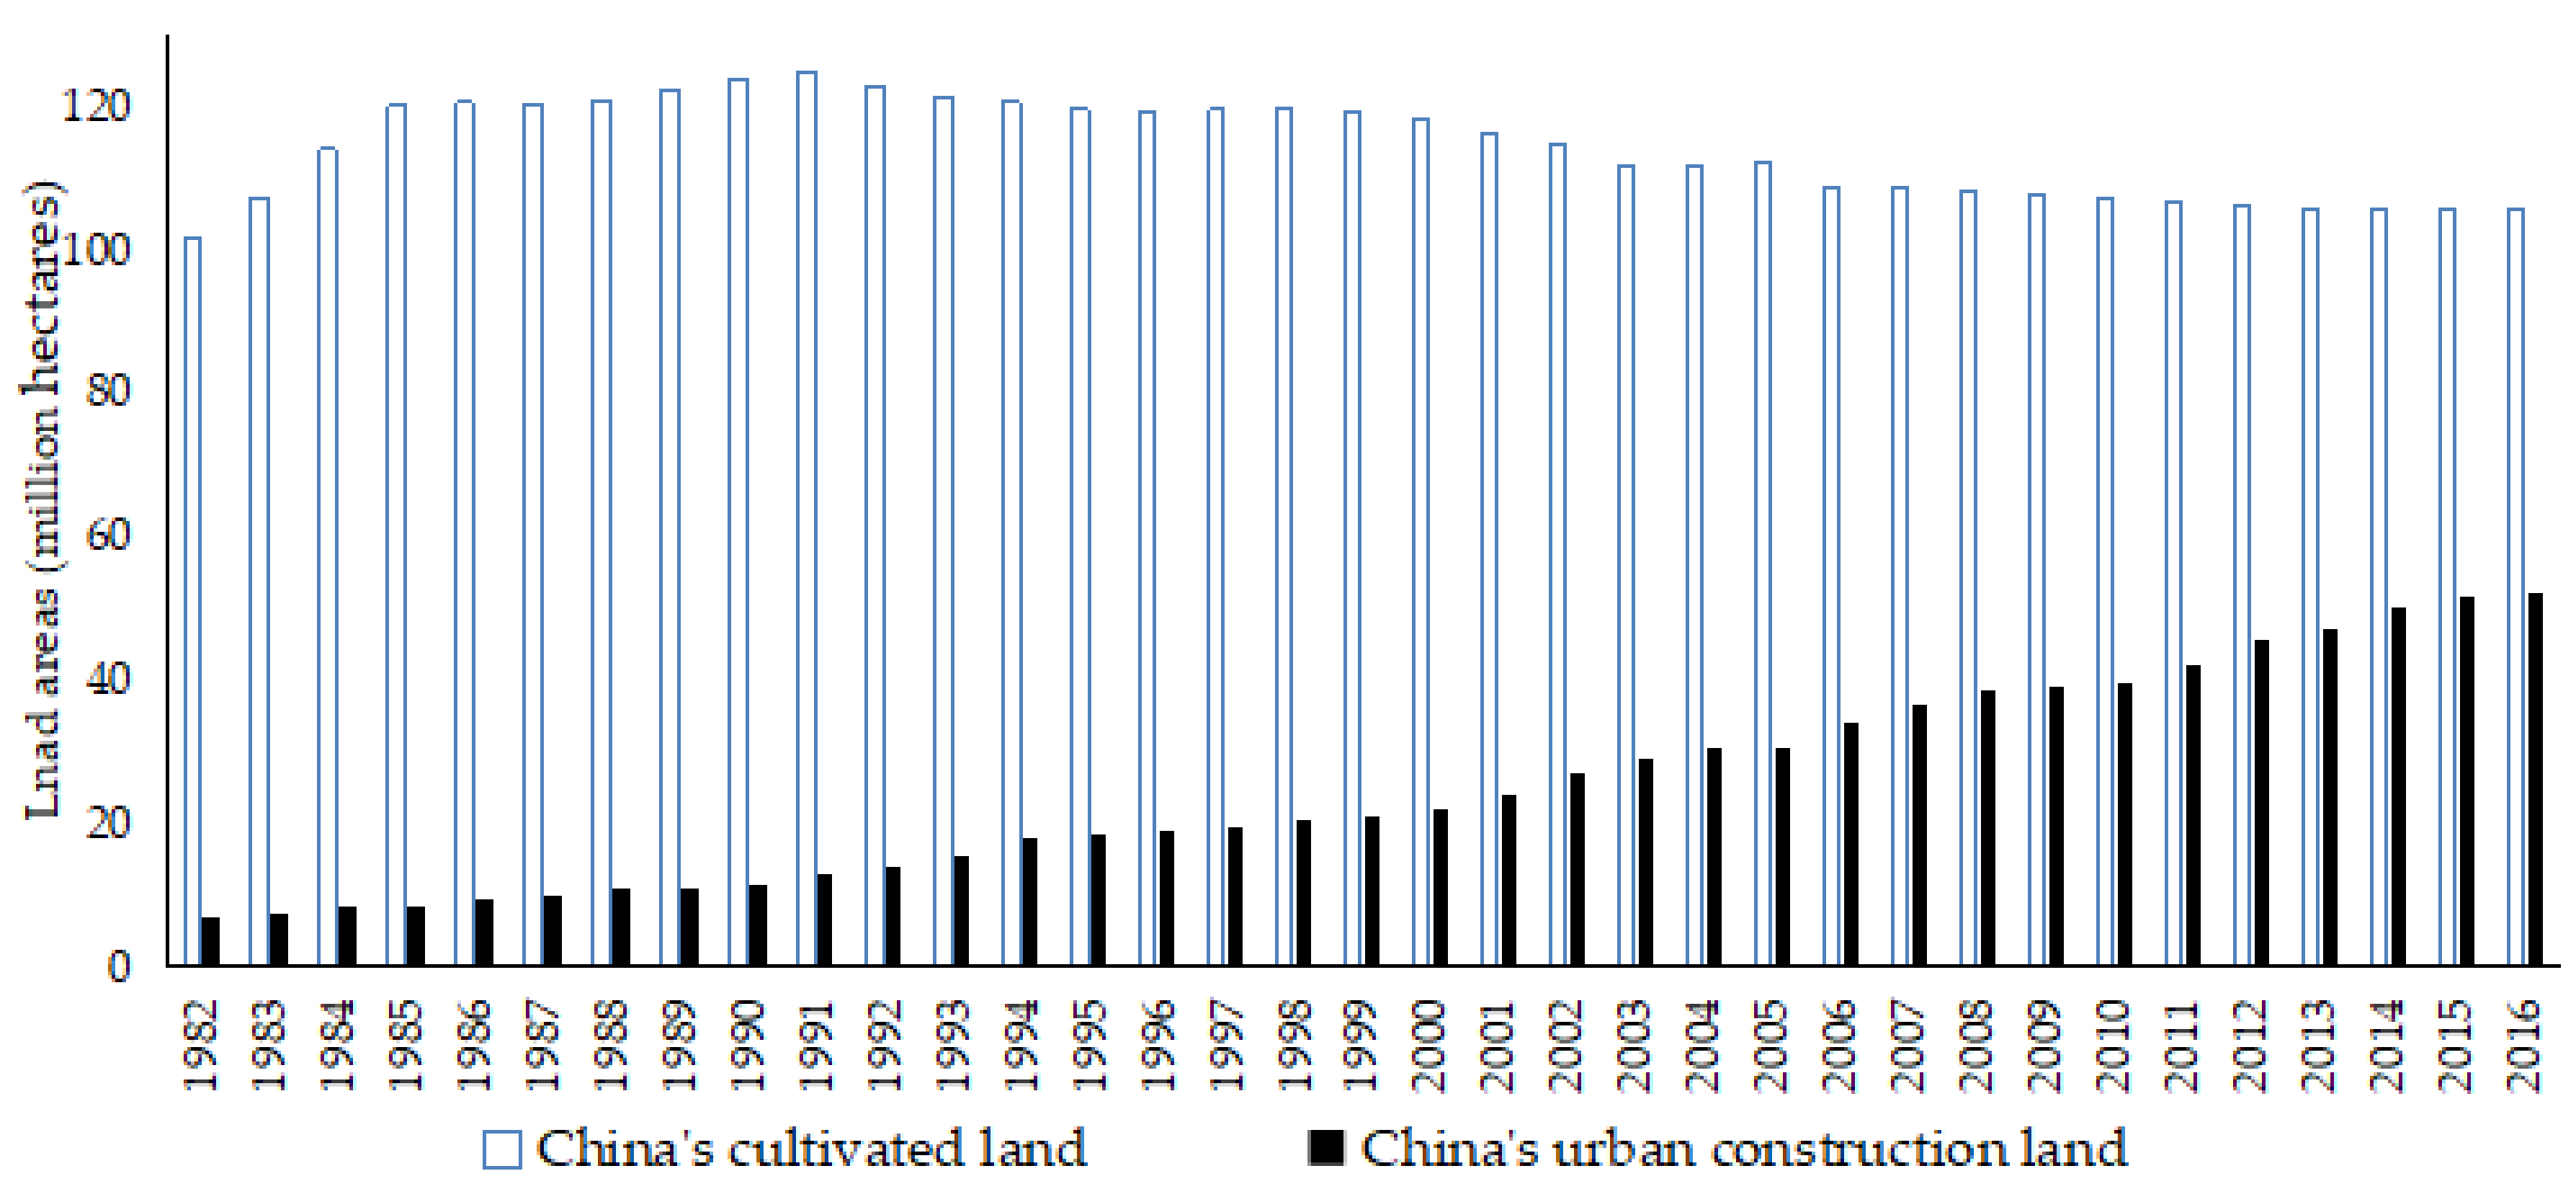
The amount of cultivated land in China increased from the 1960s to the 1980s, and then decreased mainly due to land expropriation and urban expansion since the 1990s. Since the 1960s, in order to guarantee food security, China started to create new cultivated land by reclaiming wasteland, forest land, and pasture land. This made the cultivated land area grow quickly, reaching more than 124 million hectares in 1991. However, after tax sharing reforms in 1994, local governments gradually started to use land as an important resource to develop cities. In order to increase state-owned urban construction land, especially industrial and commercial land and the residential land supply, local governments enforced eminent domain laws to expropriate rural collective-owned land, mostly cultivated land, then change the land ownership to state-owned urban construction land [26]. As shown in Figure 3, from 1990 to 2016, the urban construction land area quintupled from 11.61 million hectares to 52.10 hectares. However, although cultivated land expropriation made great contributions to China’s urban expansion and economic development, this also led to a decline in the area of total cultivated land. The cultivated land area was reduced by 12.9%, from its highest amount of 124.88 million hectares in 1991 to 108.49 million hectares in 2007. Having realized the magnitude of cultivated land loss, central government proposed minimum cultivated area requirements in every province [27]. After that, the downward trend eased due to an array of measures designed to protect the cultivated land [28]. However, due to better location and quality compared with other kinds of rural collective-owned land, after having changed land ownership to state-owned urban land, cultivated land is easier to attract better FDI or get land transfer fees. So, although the central government put forward strict laws to prevent the cultivated land area from reducing, cultivated land is still the local governments’ best choice of land expropriation. Some local governments expropriated cultivated land in good locations and reclaimed some wastelands elsewhere for cultivated land in order to keep the total cultivated land area constant to meet the land protection requirements of the central government [29]. However, the quality of wasteland is far inferior to the original cultivated land. As a result, although the cultivated land area has stayed the same in recent years, the high-quality cultivated land area was significantly reduced, which was only 30% of the total cultivated land area by the end of 2016, according to the Ministry of Natural Resources of China.
Hence, the decrease in the area and quality of cultivated land has become a threat to food security, since China’s population is still growing. Further, this limits the urban construction land supply and the sustainability of land-driven development.

3.2. Serious Debt and Financial Risk Result from Land-Driven Urbanization

Selling commercial–residential land at a high price and using land mortgage financing were the most important capital methods for local governments to improve urban infrastructure construction. These land capitalization processes were the main reasons why China could maintain a long period of urbanization since the 1990s. However, this also resulted in serious land dependence and financial risks.
First, the net revenue from land is shrinking. Land transfer fees were a very important source of revenue for local governments, because they could sell commercial–residential land at a high price. This money was mainly applied to infrastructure construction [30]. However, as China began to protect cultivated land and farmers started to safeguard their own interests, the cost of land expropriation also rose quickly. In some regions, land acquisition costs account for more than half the revenue of land transfer fees [31]. According to the Ministry of Natural Resources of China, the annual revenue from land supply has plummeted since 2014. In 2016, the net revenue of land supply after deducted costs was only 20%. In addition, selling residential land at a high price and charging land transfer fees have also pushed up real estate prices, creating lots of bubbles in China’s real estate market.
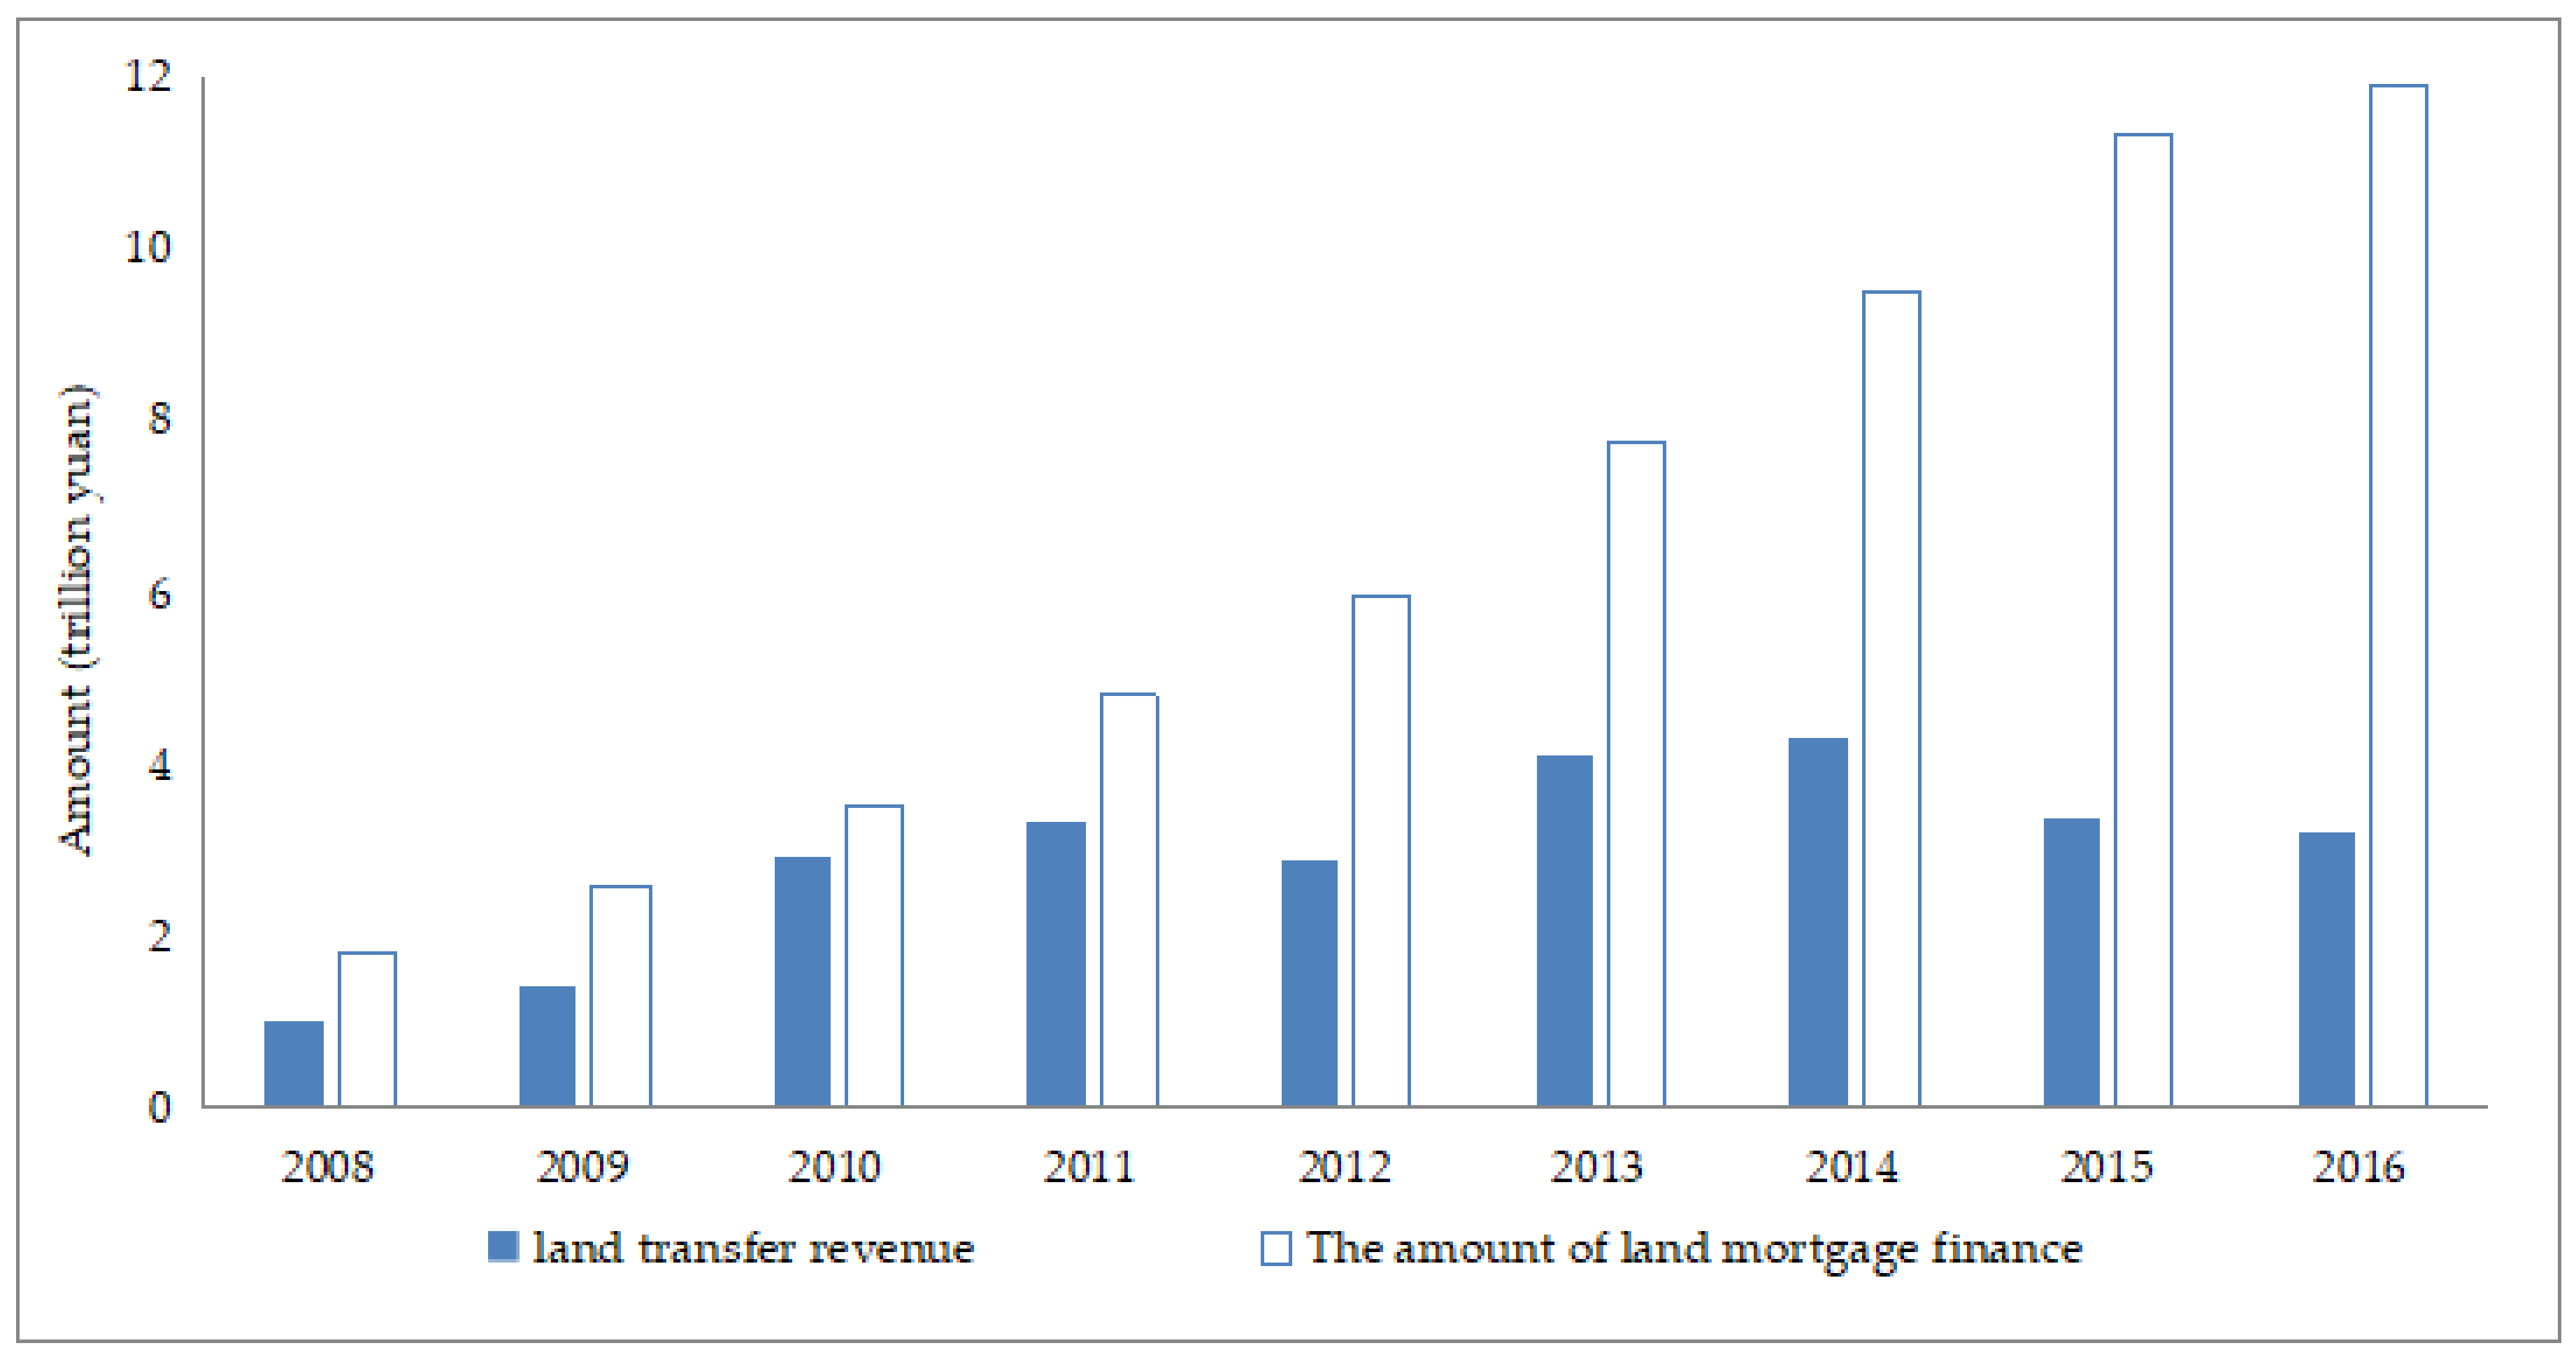
What is worse is the risk of land mortgage financing. Land transfer fees alone cannot satisfy local governments’ insatiable hunger for urbanization. Therefore, land mortgage financing has played a vital role since 2007. Local governments mortgage their reserve land to banks to make up the funding gap in urban construction. This has made a significant contribution to China’s urbanization, but also resulted in serious financial risks [32]. The annual amount of land mortgage financing reached 11,900 billion yuan in 2016, up from 1810 billion in 2008 (Figure 4). However, the main purpose of reserve land mortgage loans is to undertake infrastructure construction and other projects with low profitability. It is difficult to repay mortgage loans with the proceeds from these projects. So, the repayment of government reserve land mortgage loans also mainly relies on land transfer revenue [33]. Local governments have created a cycle of land capitalization—acquisition of commercial–residential land transfer revenue and land mortgage finance—development of urban infrastructure—mortgage loan repayment with transfer revenue—land value appreciation—land capitalization. However, this cycle depends on land prices and there is a lot of uncertainty. If there are price fluctuations in the land market, the debts of local governments will easily become problem loans for the banks [34]. At present, China’s real estate market has cooled down and the price of commercial–residential land has decreased. Meanwhile, land mortgage financing amounts are rising year by year. Local government debt has become a big problem and an unrelenting pressurized situation for China, and outstanding land mortgage loans are the biggest part of this problem. This has not only led to big financial risks, but has also had a negative effect on the sustainability of urbanization.

3.3. Industrial Upgrading is Inhibited Caused by Low-Price Land-Driven Industrialization

Underselling industrial land did attract a lot of FDI and contributed a lot to make China “the world’s factory” over the past three decades [35]. However, as China’s conditions have changed, the demand for industrial land has gone down and potential problems of underselling industrial land to propel industrialization have emerged. This has been mainly caused by a rise in production costs and industrial upgrading.
From the perspective of rising production costs over the years, industrial land prices remain stable and are low under the control of local governments. However, other production costs, such as labor costs, are rising rapidly, especially in eastern China. Preliminary World Bank estimates suggest that the average hourly wage of a Chinese manufacturing laborer almost tripled to $3.60 between 2005 and 2016, surpassing all of the Latin American countries and reaching about 70% of the income of weaker Eurozone member countries. This increased the production costs of labor-intensive industrial enterprises. In eastern China, due to rising production costs, the industrialization stage that relied on low-cost and high-factor input has ended. The attraction of underselling land has diminished and companies in the eastern region have taken the initiative to transform from being labor-intensive to capital- and technology-intensive [36]. Meanwhile, although central and western China have plenty of land and the number of industrial parks has exceeded that in the eastern region, they are troubled by traffic problems, labor quality, and small market scales. The results of FDI there have always been unsatisfactory, with more than 30% of the industrial parks in central and western China reporting losses in 2016.
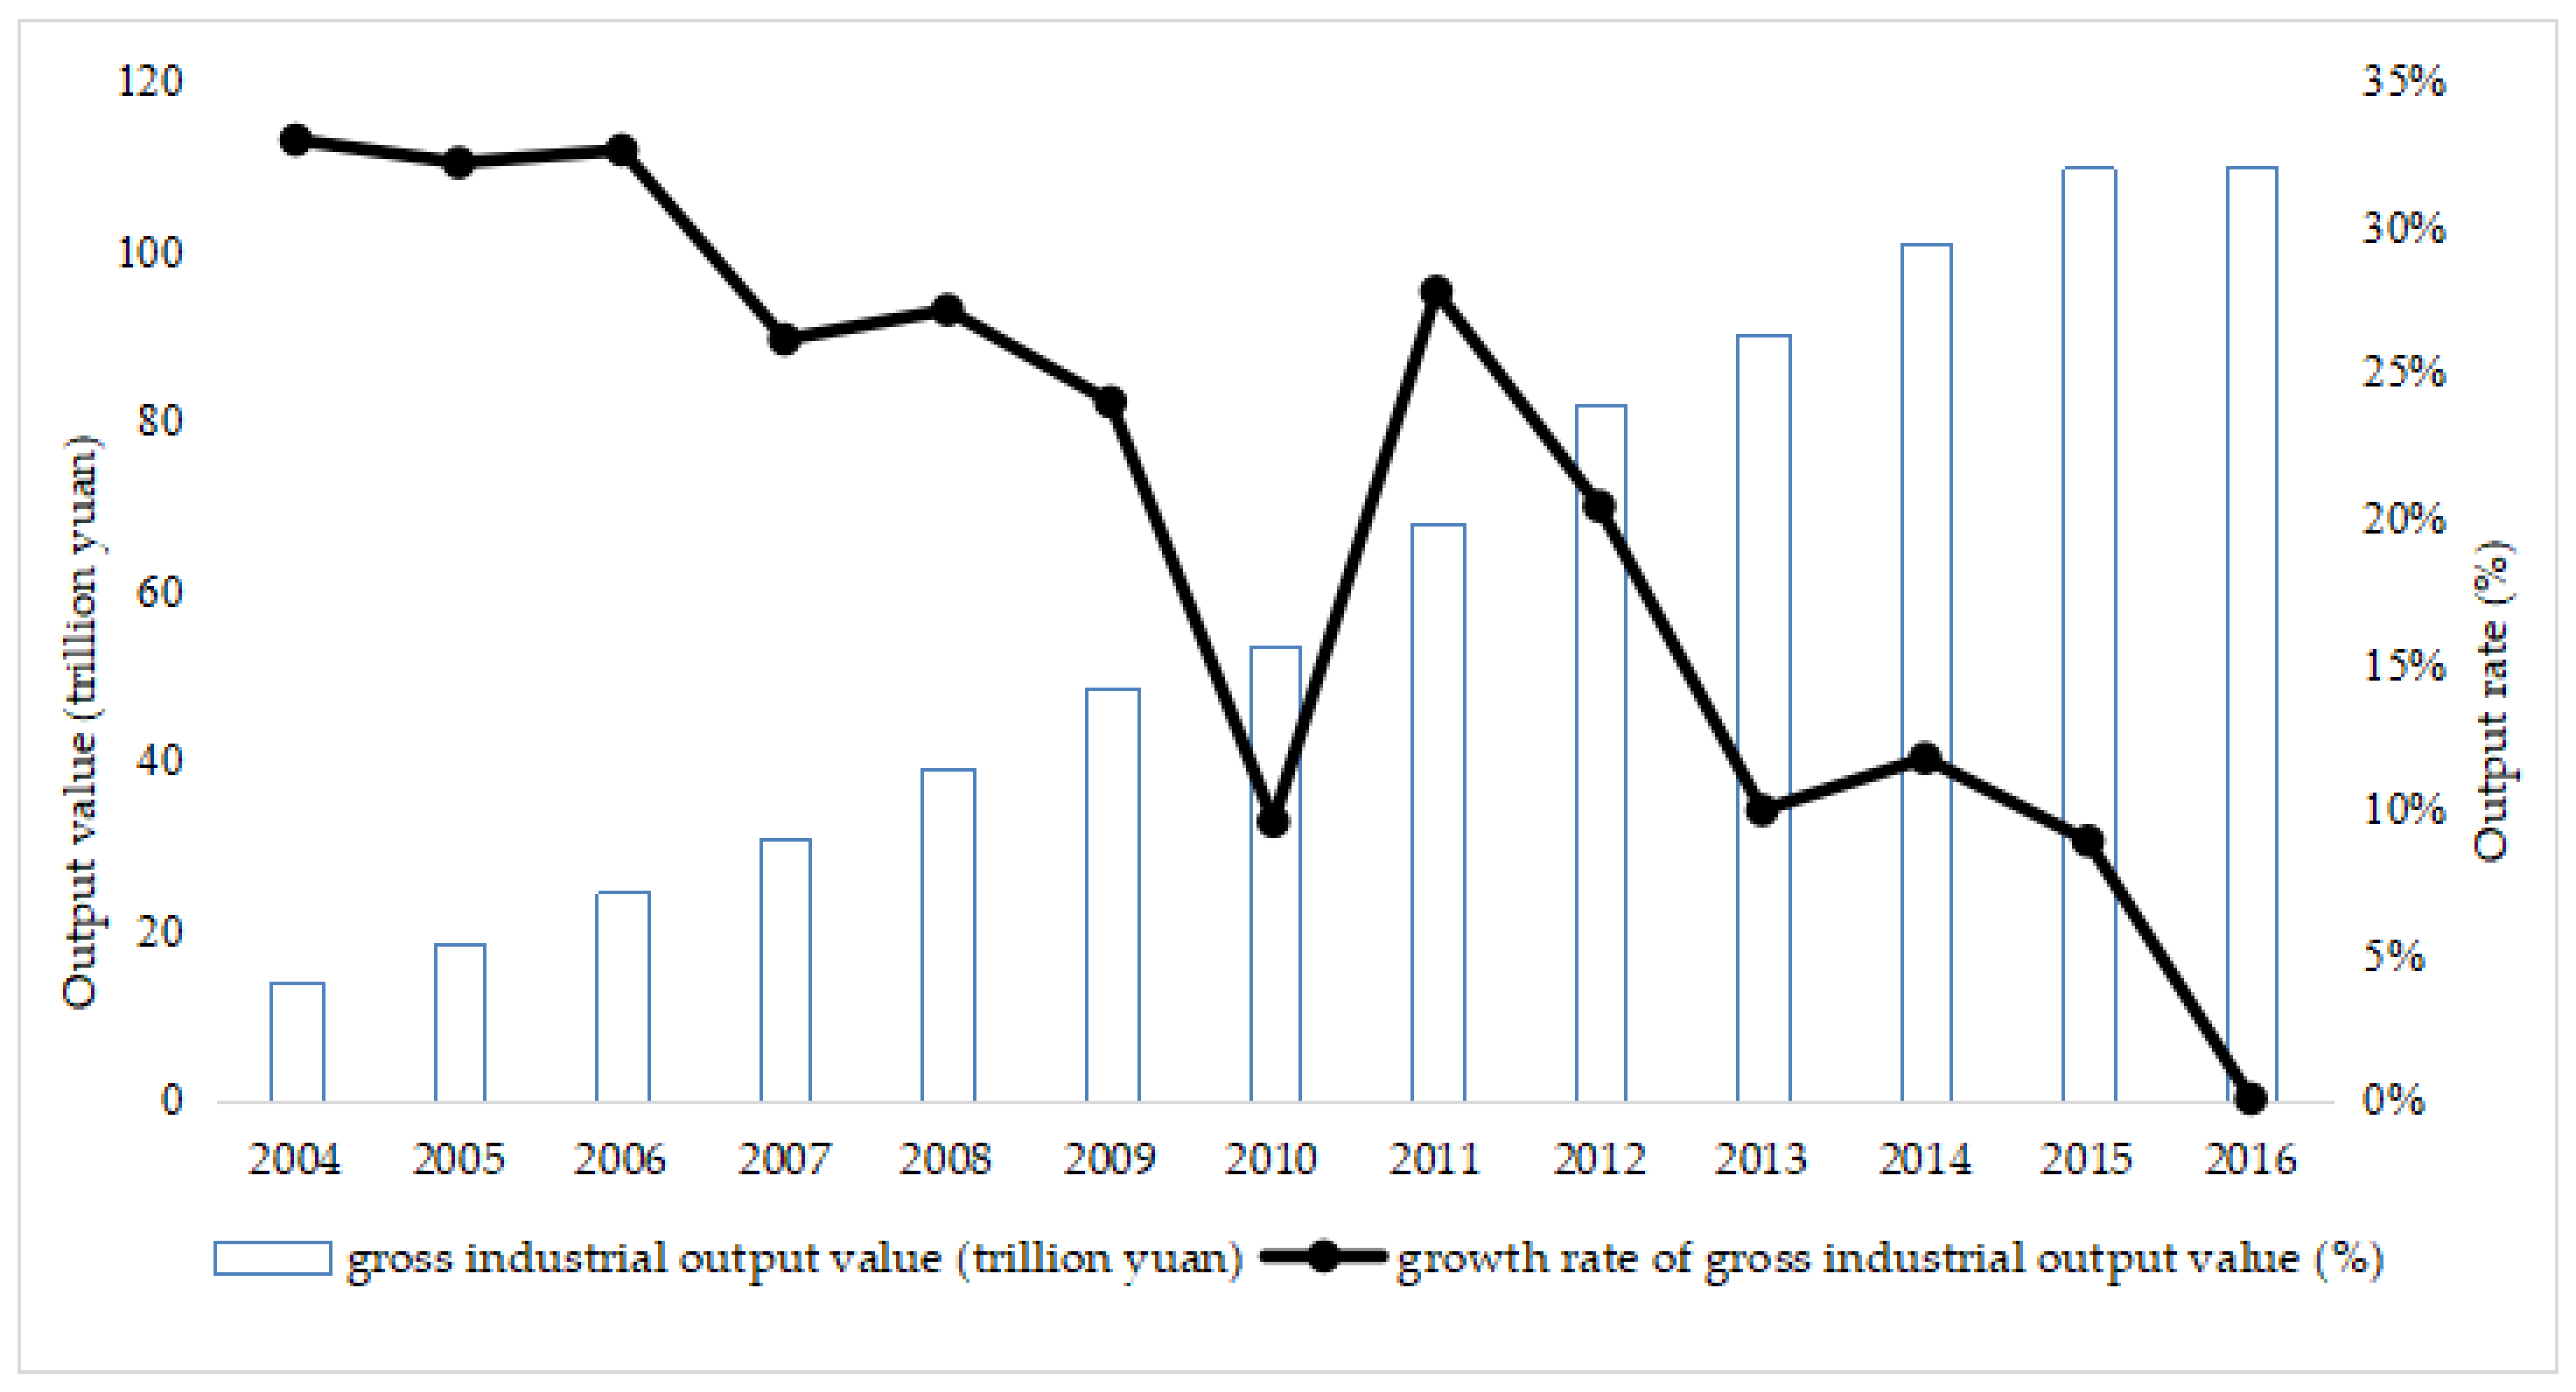
From the perspective of industrial upgrading, the transformation and upgrading of enterprise products and industries increases the effectiveness of attracting FDI with low industrial land prices. Different enterprises tend to have different sensitivities to land prices. At the early stage of FDI, local governments might only attract labor-intensive industries because of a low-quality labor force and poor market competitiveness of the region. These kinds of industries always need a large amount of industrial land for factory buildings. Low industrial land prices are very attractive to those enterprises, and the price might be the determining factor for these enterprises to decide where to stay [37]. However, today China is in the critical stage of industrial upgrading and local governments need to attract more capital- and skill-intensive industries. These enterprises need very little industrial land; what they really need is the ability to innovate, low transaction costs, and a high-quality labor force. Therefore, continuing to attract skill- and capital-intensive enterprises with low industrial land prices has become inadequate [38]. Industry upgrading takes a long time, but local government officials care more about their promotions. Therefore, low-quality but brief FDI benefit projects and short-term GDP growth are always their top priorities [39]. In this vicious circle, competition for low-quality FDI by using low-priced industrial land has become more common among local governments. This means that underselling industrial land to propel industrialization is not currently working in China (Figure 5); low-level industries not only hinder the growth of gross industrial output value, but also result in environment pollution.

4. Model Specifications and Variables, Materials, and Methods

In this paper, we hypothesize a nonlinear dynamic model to empirically test the Kuznets effect and investigate the sustainability of land-driven development for industrialization and urbanization. Since the dynamic model has a lagged dependent variable, we also analyze the Kuznets effect from the long run through the estimated coefficient on the lag-dependent variable.

4.1. Database and Descriptive Statistics

The Kuznets effect between land supply, urbanization, and industrialization is evaluated using data from the World Bank database, the Finance Yearbook of China, and the China Land and Resources Statistical Book [40,41,42]. The database includes data on 255 prefecture-level cities of China from 2009 to 2016. Nine variables are used for this analysis, consisting of two dependent variables, two core independent variables, and five control variables (Table 1).
(1) Dependent Variables
Two dependent variables are chosen to represent urbanization and industrialization: (1) Completed investment in fixed assets (completed_inv) is used to measure urbanization. According to the National Bureau of Statistics of China, completed_inv is represented by the investment in infrastructure and fixed assets of a region in one year; in other words, it reflects how much a city uses municipal construction in one year. Most previous research uses a population variable to reflect the level of urbanization, but that cannot reflect the impact of land on urbanization. As most of the completed_inv is gathered by local governments through land transfer and mortgaging, compared with the population variable, which directly reflects the level of urbanization, completed_inv is more closely related to land and indirectly reflects the level of urbanization. Thus, it is used in this paper for the level of urbanization; (2) Gross industrial output value (gross_ind) is taken as the dependent variable to measure the industrialization level. It is represented by the total value of industrial output of a region in a year and reflects the industrial level in a region.
(2) Core Independent Variables
Based on the Kuznets curve theory and its associated problems, we chose the urbanized and industrial land supply areas of one city in one year as core independent variables to test the sustainability of land-driven urbanization and industrialization, respectively: (1) The area of urbanized land (urb_land) is the aggregation of commercial, residential, and reserve land, which is vital for local governments to obtain land transfer fees and mortgage loans to promote urbanization. According to the Kuznets curve theory, the linear and quadratic terms of urb_land are the core independent variables influencing completed investment in fixed assets (completed_inv) and urbanization; (2) The area of industrial land (ind_land) is the core independent variable to test the inverted U-shaped relationship between gross industrial output value and industrialization.
(3) Control Variables
To minimize any estimation bias and endogeneity problems due to an omitted variable, we include a series of control variables that influence land supply and local development. Data availability is taken into consideration to choose the proper control variables. (1) Trade dependence (TD) is an effective index to show the correlation between city and international economy, and can also reflect the composition of output in one city. It is the proportion of total export and import volumes converted into RMB (¥) in the regional GDP. (2) Foreign direct investment (FDI) reflects conditions under which foreign capital is utilized. (3) For urban population density (UPD), high UPD is a strong indicator that the city has a bigger market than others, and is used to control for the effect of city size. (4) The financial interrelations ratio (FIR) is the proportion of total loans and deposits in the regional GDP, which represents the degree of financial intensity of an economic system. (5) Industrial structure (IS) is the proportion of GDP made up by tertiary sector industries at a city level, and is used to measure the industrial structure of one city, controlling for the composition of output.

4.2. Methods

We employed a nonlinear dynamic model to investigate the Kuznets curve effect of land supply on economic growth.
First, Equation (1) shows the traditional Kuznets curve model. It is used first to describe the inverted U-shaped relationship between economic inequality and per capita income, then to describe the relationship between environmental degradation and economic growth since 1991, usually assuming the inverted U-shape:
Y = A 0 + A 1 X + A 2 X 2 + ε
The objective of this study is to identify whether the effect of land supply on economic growth follows an inverted U-shaped curve, and whether the land-driven development mode is still sustainable. Since the impact of land supply on economic growth is mainly reflected in the urbanization and industrialization of a region, based on the Kuznets curve, in order to test the sustainability of land-based development, the following two static models were hypothesized to test the influence of land supply on urbanization and industrialization:
c o m p l e t e d _ i n v i t = α 0 + α 1 u r b _ l a n d i t + α 2 u r b _ l a n d i t 2 + β X i t + γ i + ε i t
g r o s s _ i n d i t = φ 0 + φ 1 i n d _ l a n d i t n + φ 2 i n d _ l a n d i t n 2 + η X i t + γ i + ε i t
Equation (2) represents the Kuznets effect between land supply and urbanization, that is, the relationship between urbanized land supply and completed investment in fixed assets. In this equation, c o m p l e t e d _ i n v is the completed investment in fixed assets, which represents the urbanization level of a city, and u r b _ l a n d is the area of urbanized land. Equation (3) represents the Kuznets effect of industrialization; g r o s s _ i n d is the gross industrial output value, which represents the industrialization level of one city, and i n d _ l a n d is the area of industrial land. In these two equations, X is the control variable, including trade dependence, foreign direct investment, urban population density, financial interrelations ratio, and industrial structure; i represents one of the 255 prefecture-level cities; t represents the period 2009–2016; γ i captures the city’s fixed effects (due to the cross-city difference in culture, industrial structure, climate, etc.); ε i t is the disturbance; and n is the time lag in years, which reflects the transmission delay of the impact of industrial land supply on industrialization.
It is worth noting that once FDI enterprises acquire industrial land from the local government, a construction period of 1 to 2 years is required, which means that the effect of industrial land supply on gross industrial output always has a two-year lag. In the industrialization equation, we decided to use the area of industrial land with a two-year lag in Equation (3) and then test it in the model to solve the endogeneity problem between industrial land supply and output value. However, unlike the effect of industrial land supply on industrialization, once urbanized land is transferred or mortgaged, local governments can obtain land transfer fees or loans directly, and there is no time lag, so the current area of urbanized land without lag in Equation (2) is chosen.
The urbanization and industrialization in the previous period can directly influence the current urbanization and industrialization level; considering that there might be a reaction lag concerning the impact of current urbanization and industrialization, we included the lagged term of the dependent variable (i.e., c o m p l e t e d _ i n v i t 1 and g r o s s _ i n d i t 1 ) in our empirical model, so that Equations (2) and (3) are modified into a dynamic panel data model as follows:
c o m p l e t e d _ i n v i t = α 0 + α 1 c o m p l e t e d _ i n v i t 1 + α 2 u r b _ l a n d i t + α 3 u r b _ l a n d i t 2 + β X i t + γ i + ε i t
g r o s s _ i n d i t = φ 0 + φ 1 g r o s s _ i n d i t 1 + φ 2 i n d _ l a n d i t n + φ 3 i n d _ l a n d i t n 2 + η X i t + γ i + ε i t
Under the dynamic specification in Equations (4) and (5), both | α 1 | and | φ 1 | should be less than 1 for the stationarity of the dynamic system; the Kuznets curve effect of land supply to urbanization and industrialization is supported if α 2 > 0 and α 3 < 0. Since our model is a dynamic model and the specifications include lagged endogenous variables, there are long-term effects through the estimated coefficient on the lagged dependent variables. In Equations (4) and (5), α 2 , α 3 , and φ 2 , φ 3 measure the instantaneous Kuznets curve effect of land supply on urbanization and industrialization, respectively. Apart from that, we can also describe the long-run effects. Since E ( c o m p l e t e d _ i n v i t ) , E ( g r o s s _ i n d i t ) and E ( u r b _ l a n d i t ) , E ( i n d _ l a n d i t ) are constant over time, we can rewrite our Equation (4) as: E ( c o m p l e t e d _ i n v i t ) = α 0 1 α 1 + α 2 1 α 1 E ( u r b _ l a n d i t ) + α 3 1 α 1 E ( u r b _ l a n d i t 2 ) + β 1 α 1 X i t + γ i + ε i t , where the long-term Kuznets curve relationship between urbanized land supply and urbanization are thus given by α 2 1 α 1 and α 3 1 α 1 . Similarly, Equation (5) can be rewritten as: E ( g r o s s _ i n d i t ) = φ 0 1 φ 1 + φ 2 1 φ 1 E ( i n d _ l a n d i t n ) + φ 3 1 φ 1 E ( i n d _ l a n d i t n 2 ) + η 1 φ 1 X i t + γ i + ε i t , where the long-term Kuznets curve relationship between industrial land supply and industrialization are given by φ 2 1 φ 1 and φ 3 1 φ 1 .
Because the lagged dependent variable in the above equations will cause endogeneity, which will lead to a deviation in coefficient estimation, we employed the generalized method of moments (GMM) approach to solve this problem. GMM can be divided into difference GMM (DIF-GMM) and system GMM (SYS-GMM). The difference GMM was first refined by Arellano and Bond in 1991 [43], but Arellano and Bover [44], Blundell and Bond [45] point out that the difference GMM might perform poorly and has bias and imprecise finite sample properties when the time series are persistent because, as persistency increases, lagged levels become less correlated with the endogenous variables and they turn out to be weak instruments. This is a concern in economic growth studies since some variables, such as GDP and stock prices, display high levels of persistency even after controlling for time trends.
Hence, as an alternative to the difference estimator, the system GMM estimator proposed by Arellano and Bover, Blundell and Bond is more plausible. They estimate a system of equations formed by the equation in first-differences and the equation in levels. Blundell and Bond show that, under mild conditions, the system GMM estimation results in a lower finite sample bias and a substantial increase in precision than the straightforward first-differences GMM estimator when the panel units are large and the time periods are moderately small. However, system GMM might cause a proliferation of instruments that may overfit endogenous variables.
This paper applies the system GMM estimation method to estimate the dynamic Kuznets curve effect in Equations (4) and (5). In order to test the validity of the instruments in our GMM estimation, we applied the Arellano–Bond test for the serial correlation to test whether there is a second-order serial correlation in the differenced residuals; it provides the evidence that the GMM estimator is consistent. Also, we used the Hansen test to test the instrument validity.

5. Empirical Results

The transmission mechanism of the effect of land supply on urbanization and industrialization is as follows. After the transfer of land in one year, local governments can obtain land transfer fees and mortgage loans to improve infrastructure construction through the transfer of urbanized land immediately. However, after enterprises obtain the right to use industrial land from local governments, it takes at least one or two years for them to construct factory buildings and start production, which affects the total industrial output value and regional industrialization. In other words, after land supply, the impact on local urbanization will show up in the same year, and the impact on industrialization and local economic development will have a one- or two-year lag.
Following this transmission mechanism, we utilize the two-step system GMM method and first explain the regression results of the Kuznets effect of urbanized land on complete investment in fixed assets and urbanization (Equation (4)). Then we explain the regression results of the Kuznets effect on industrial land with a two-year lag on gross industrial output value and industrialization (Equation (5)). In each subsection, we first report the estimation results with 255 prefecture-level cities at the national level, then we split the data of 255 prefecture-level cities into the eastern and mid-western regions on the basis of their location, and report the estimation results of eastern and mid-western regions as a robustness test and discuss the regional differences in the relationship between land supply and economic growth.

5.1. The Kuznets Curve Effect for Urbanization

Table 2 displays the system GMM results of the Kuznets effect of urbanized land supply on urbanization (Equation (4)) at the national level. We also list the fixed effect (FE) and difference GMM results in order to make a comparison with the result of system GMM and the robustness results.
In Table 2, column (1) shows the results of FE and leaves out the lagged dependent variable term (L.complete_inv), which is included in columns (2) and (3). Columns (2) and (3) refer to the regression results of difference GMM and system GMM, respectively.
The estimations of both difference GMM in column (2) and system GMM in column (3) pass the effectiveness test. The p-values of AR(2) are 0.958 and 0.896 in columns (2) and (3), respectively, which shows that there is no autocorrelation in the idiosyncratic disturbance term. The p-values of the Hansen test in columns (2) and (3) are 0.207 and 0.266, suggesting that the overidentification restriction is satisfied and all instruments applied in these regressions are valid. The coefficients of lagged dependent variables in both columns (2) and (3) are less than 1, showing that the dynamic systems are stationarity.
Based on the system GMM result in column (3), the lagged dependent variable of L.complete_inv is positive and statistically significant, indicating that urbanization in the previous period has a direct impact on urbanization in the current period. The quadratic coefficient of urb_land is significantly negative and the linear coefficient of urb_land is significantly positive, and are −0.0003 and 0.184, respectively. This illustrates that urbanized land supply has an inverted U-shaped curve relationship for urbanization and the turning point of urb_land to complete_inv would be 307 hectares. That is, if the area of urbanized land transferred by a city is less than 307 hectares in a year, increasing the urbanized land supply will stimulate urbanization. However, if the supply of urbanized land surpasses 307 hectares in one year, the increased supply, in turn, will have a negative effect on urbanization. This is possible because the increased urbanized land supply means that local governments are more dependent on land transfer revenue and land mortgages, which would not only increase land acquisition costs and decrease the net land supply revenue, but also lead to significant local debt risk. Therefore, instead of promoting urbanization, having too much urbanized land supply is counterproductive. In addition to the instantaneous effects, according to the dynamic system, in the long run, the quadratic coefficient of urb_land is −0.0027 and the linear coefficient is 1.673, the Kuznets curve effect of urbanized land on urbanization still exists in the long term.
Next, we carried out regional level robustness tests (Table 3), and the system GMM was used to empirically test the Kuznets effect of urbanized land supply on urbanization in the eastern and mid-western regions.
As can be seen from the results in Table 3, columns (1) and (2) show the robustness test results of the Kuznets curve effect for urbanization in the eastern and mid-western regions, respectively. The system GMM in the eastern region has a significantly negative coefficient of quadratic coefficient of urb_land and significantly positive linear coefficient of urb_land, which shows that an inverted U-shaped curve exists for the eastern region. The turning point of urbanized land supply to urbanization for the eastern region is 342 hectares, very similar to the turning point of the whole country. In 2016, the area of urbanized land supply in more than 78% of China’s eastern region cities passed the turning point, suggesting that many eastern cities are overly dependent on land to develop urbanization and might have significant local debt risks, which, in turn, harm the urbanization development. However, in the mid-western region, the quadratic coefficient of urb_land is not significant at all, and only the linear coefficient is significant and positive. This means that urbanized land still has a significant positive effect in the mid-western region and there is no Kuznets curve effect. However, this does not mean that mid-western cities have the potential to promote urbanization by urbanized land transfer revenue and mortgage; on the contrary, it is because the mid-western region is less developed and has a low demand for land, that it is hard for mid-western local governments to obtain a large amount of funds for urbanization from land transfer and mortgages. Thus, the urbanized land supply stays at a low level in the mid-western region, which is unlikely to use this land-driven development mode to promote urbanization. Hence, the estimated system GMM result shows that the land-driven urbanization development is hard to sustain without any adjustment, and that different regions have different reasons.

5.2. The Kuznets Curve Effect for Industrialization

Table 4 reports the two-step system GMM results of the Kuznets effect of industrial land supply on urbanization (Equation (5)) at the national level. Similarly, FE and the two-step difference GMM results are also listed as the robustness results.
In Table 4, column (1) displays the result of FE, omitting the lagged dependent variable term (L.gross_ind). Columns (2) and (3) report the regression results of difference GMM and system GMM. It is worth noting that ind_land has a time lag of two years (n = 2).
The AR(2) and Hansen test results in columns (2) and (3) show that there is no autocorrelation in the idiosyncratic disturbance term and no overfitting problem of having too many instruments. The dynamic systems are stable because the coefficients of lagged independent variables in columns (2) and (3) are less than 1. According to the system GMM result in column (3), the quadratic coefficient of ind_land is −0.0009 and the linear coefficient is 0.385. They both pass the relevant significance test, which means that the area of industrial land supply has a significant Kuznets effect on industrialization and the turning point would be 214 hectares. This suggests that if the area of industrial land a city transfers is less than 214 hectares in a year, the industrial land supply will have a positive effect on gross industrial output value in general. However, if the area of industrial land a city transfers is more than 214 hectares, then the effect of industrial land supply will become negative. This is mainly because China has entered a period of economic transformation and local governments need to improve the comprehensive conditions of cities to guide industrial upgrading. The policy of attracting FDI with low industrial land prices may lead to the entry of low-quality enterprises, resulting in overcapacity and industrial similarity in China. As a result, this has blocked industrialization and hindered industrial upgrading. In the long run, the quadratic coefficient and linear coefficient of ind_land are −0.0105 and 4.476, which means that there is Kuznets curve effect between ind_land and industrialization in the long-term equilibrium.
Table 5 reports the robustness test of the Kuznets curve effect for industrialization in different regions. The two-step system GMM is used in these two columns, and ind_land also has a time lag of two years (n = 2).
The system GMM in the eastern region (column (1)) has a significantly negative quadratic coefficient of ind_land and a significantly positive linear coefficient of ind_land. The turning point of industrial land supply to industrialization for the eastern region is 252 hectares, very similar to the turning point of the national level. The industrial land supply in 83% of eastern cities passed this level in 2016, which shows that eastern China has serious problems with excessive industrial land supply. This might have already caused a lot of low-quality FDI. Meanwhile, in mid-western regions, results do not confirm a Kuznets curve relationship, as the estimated quadratic coefficient of ind_land is statistically insignificant. This is mainly because the mid-western region has inconvenient transportation, low labor quality, and small market scale problems, and it is difficult to attract good FDI by low-price land supply. Thus, according to the results of system GMM, although the eastern and mid-western regions have different problems, the land-driven development mode is hard to sustain in both regions without any reform. Meanwhile, many eastern cities have land oversupply problems.

6. Conclusions

Based on theoretical analysis and prefecture-level panel data from 2009 to 2016, this paper establishes a nonlinear dynamic model and carries out rigorous robustness tests to analyze the sustainability of the land-driven development mode of China’s local governments.
Previous empirical studies on land-driven development confirmed that, since the 1990s, this mechanism has played a major role in promoting China’s economic development. By controlling and utilizing land resources, local governments have significantly promoted industrialization and urbanization. However, with China’s economic development entering a “new normal,” the problems of this mechanism have gradually emerged. This paper focuses on the sustainability of this mechanism through theoretical and empirical analysis, the following conclusions are drawn.
First, at the national level, the effect of land supply on local economies indicates an initial increase and then a drop, i.e., inverted U-sharped curve. Currently, the impact of land supply on urbanization and industrialization has passed the turning point and gone from positive to negative in many cities; this mechanism is unsustainable without reform.
Second, most of the eastern cities have passed the turning point and have an oversupply of land today. The land oversupply and dependence have not only harmed cultivated land resources, but also caused poor-quality FDI and increased regional financial debt risk problems, which, in turn, might inhibit local economic growth. The contribution of the land-driven development to economic growth is now in decline.
Moreover, at the regional level, the reasons why this mechanism can no longer be used in the eastern and mid-western regions are different. Most cities in the east have passed the turning point, which means that the eastern region is overly dependent on land and faces serious financial risks. Meanwhile, there is no clear Kuznets curve effect of land-driven development on economics in the mid-western region, but this does not mean that land-driven development there will continue to work properly either. On the contrary, the mid-western region has enforced many policies, but there is still a smaller supply of both industrial and commercial–residential land than in the eastern region. This is because the mid-western region has traffic problems and a weak development environment. The mid-western region always tries to replicate the land-driven development mode used by the eastern region, and the effects are not ideal. Thus, this mechanism is hard to sustain in both regions.
In conclusion, with the transformation of China’s economic development, the function of the land-driven development mode has declined and many cities have land oversupply problems. The central government must make it clear that it should no longer rely on land for development or for macroeconomic regulation and should accelerate land system reforms to create new sources of power for local economic development, such as introducing property tax [46]. Local governments must change the role of land as an engine for economic growth and keep the land supply within reasonable limits. They should improve the regions’ level of integration to attract FDI to promote industrial upgrading [47] and reduce the financial risks associated with the real estate market and land mortgages, gradually removing the land-driven development mode. Furthermore, other developing countries can learn from China’s land-driven development mode experience, that is, land can be used as an effective tool to attract FDI and get revenue from land transfer, but looked at the other way, this might also cause serious problems if governments are too dependent on it.

Author Contributions

Conceptualization, W.Z. and Y.S.; Methodology, W.Z.; Software, W.Z.; Validation, W.Z. and Y.S.; Formal Analysis, W.Z.; Investigation, W.Z.; Resources, W.Z.; Data Curation, W.Z.; Writing-Original Draft Preparation, W.Z.; Writing-Review and Editing, W.Z.; Visualization, W.Z.; Supervision, Y.S.; Project Administration, W.Z. and Y.S.

Funding

This research received no external funding.

Acknowledgments

The authors are grateful to the editors and the anonymous reviews for their insightful comments and suggestions.

Conflicts of Interest

The authors declare no conflict of interest.

References

  1. Zheng, S.Q.; Sun, W.Z.; Wu, J.; Yun, W. Infrastructure investment, land leasing and real estate price: A unique financing and investment channel for urban development in Chinese cities. Econ. Res. J. 2014, 8, 75–81. [Google Scholar]
  2. Zhang, X.; Zhang, A.L.; Deng, C. Study on land resources distorted allocation and economic efficiency loss. China Popul. Resour. Environ. 2017, 3, 170–176. [Google Scholar]
  3. Jin, W.F.; Zhou, C.S.; Luo, L.J. Impact of Land Input on Economic Growth at Different Stages of Development in Chinese Cities and Regions. Sustainability 2018, 10, 2847. [Google Scholar] [CrossRef]
  4. Liu, S.Y. Land institutional reform and structural transformation in china: An economic interpretation for China’s 40 years development experience. China Land Sci. 2018, 1, 1–10. [Google Scholar]
  5. Liu, T.; Cao, G.; Yan, Y.; Wang, R.Y. Urban land marketization in China: Central policy, local initiative, and market mechanism. Land Use Policy 2016, 57, 265–276. [Google Scholar] [CrossRef]
  6. Wang, X.B.; Zhang, L.; Xu, X.X. local government land lease, infrastructure investment and local economic growth. China Ind. Econ. 2014, 7, 31–43. [Google Scholar]
  7. Peng, L.; Thibodeau, T.G. Government interference and the efficiency of the land market in China. J. Real Estate Financ. Econ. 2012, 45, 919–938. [Google Scholar] [CrossRef]
  8. Ge, Y.; Cen, S.T. Land contributions to the supernormal development of infrastructure in China. Econ. Res. J. 2017, 2, 35–51. [Google Scholar]
  9. Buxton, M.; Taylor, E. Urban land supply, governance and the pricing of land. Urban Policy Res. 2011, 29, 5–22. [Google Scholar] [CrossRef]
  10. Rong, Z. Tudi Tiaokong Zhong de Zhongyang Yu Difang Boyi: Zhengce Bianqian de Zhengzhi Jingjixue Fenxi [Central Local Gaming in the Regulation and Control of Land: A Political Economic Analysis of Policy Change]; Zhongguo shehui kexue chubanshe: Beijing, China, 2010. [Google Scholar]
  11. Broitman, D.; Koomen, E. Residential density change: Densification and urban expansion. Comput. Environ. Urban Syst. 2015, 54, 32–46. [Google Scholar] [CrossRef]
  12. Ministry of Finance of the People’s Republic of China. Available online: http://www.mof.gov.cn/was5/web/czb/wassearch.jsp (accessed on 31 October 2018).
  13. Ye, L.; Wu, A.M. Urbanization, Land Development, and Land Financing: Evidence from Chinese Cities. J. Urban Aff. 2014, 36, 354–368. [Google Scholar] [CrossRef]
  14. He, C.; Zhou, Y.; Huang, Z. Fiscal decentralization, political centralization, and land urbanization in China. Urban Geogr. 2016, 37, 436–457. [Google Scholar] [CrossRef]
  15. Zhang, L.; Nian, Y.W.; Liu, J.J. Land market fluctuations and local government debts: Evidence from the municipal investment bonds in China. China Econ. Q. 2018, 3, 1103–1126. [Google Scholar]
  16. Lichtenberg, E.; Ding, C.R. Land and urban economic growth in China. J. Reg. Sci. 2011, 51, 299–317. [Google Scholar]
  17. Huang, Z.; Du, X. Strategic interaction in local governments’ industrial land supply: Evidence from China. Urban Stud. 2017, 54, 1328–1346. [Google Scholar] [CrossRef]
  18. Report on Foreign Investment in China (2018). Available online: http://images.mofcom.gov.cn/wzs/201810/20181009090547996.pdf (accessed on 12 January 2019).
  19. Barro, R.J. Government spending in a simple model of endogenous growth. J. Political Econ. 1990, 98, S103–S125. [Google Scholar] [CrossRef]
  20. Demetriades, P.O.; Mamuneas, T.P.; Mamuneas, T. Intertemporal Output and Employment Effects of Public Infrastructure Capital: Evidence from 12 OECD Economies. Econ. J. 2000, 110, 687–712. [Google Scholar] [CrossRef]
  21. Tao, R.; Yuan, F.; Cao, G.Z. Regional competition, land transfer and local finance effect. J. World Econ. 2007, 10, 15–27. [Google Scholar]
  22. Li, Y.G.; Luo, H.Y. Does land resource misallocation hinder the upgrading of industrial structure? Empirical evidence from Chinese 35 large and medium-sized cities. J. Financ. Econ. 2017, 9, 110–121. [Google Scholar]
  23. Égert, B.; Koźluk, T.; Sutherland, D. Infrastructure and Growth: Empirical Evidence. CESIFO 2009. [Google Scholar]
  24. Bougheas, S.; Demetriades, P.O.; Mamuneas, T.P. Infrastructure, specialization, and economic growth. Can. J. Econ./Rev. Can. D’économique 2000, 33, 506–522. [Google Scholar] [CrossRef]
  25. Seto, K.C.; Fragkias, M.; Güneralp, B.; Reilly, M.K. A Meta-Analysis of Global Urban Land Expansion. PLoS ONE 2011, 6, e23777. [Google Scholar] [CrossRef] [PubMed]
  26. Huang, Z.J.; He, C.F.; Zhu, S.J. Do China’s economic development zones improve land use efficiency? The effects of selection, factor accumulation and agglomeration. Landsc. Urban Plan. 2017, 162, 145–156. [Google Scholar] [CrossRef]
  27. Lin, L.; Ye, Z.; Gan, M.; Shahtahmassebi, A.R.; Weston, M.; Deng, J.; Lu, S.; Wang, K. Quality Perspective on the Dynamic Balance of Cultivated Land in Wenzhou, China. Sustainability 2017, 9, 95. [Google Scholar] [CrossRef]
  28. Liu, L.; Xu, X.; Chen, X. Assessing the impact of urban expansion on potential crop yield in China during 1990–2010. Food Secur. 2014, 7, 33–43. [Google Scholar] [CrossRef]
  29. Tan, R.; Qu, F.; Heerink, N.; Mettepenningen, E. Rural to urban land conversion in China—How large is the over-conversion and what are its welfare implications? China Econ. Rev. 2011, 22, 474–484. [Google Scholar] [CrossRef]
  30. Feng, X. Local Government Debt and Municipal Bonds in China: Problems and a Framework of Rules. Cph. J. Asian Stud. 2014, 31, 23. [Google Scholar] [CrossRef]
  31. Du, J.; Peiser, R.B. Land supply, pricing and local governments’ land hoarding in China. Reg. Sci. Urban Econ. 2014, 48, 180–189. [Google Scholar] [CrossRef]
  32. He, C.F.; Huang, Z.J.; Wang, R. Land use change and economic growth in urban China: A structural equation analysis. Urban Stud. 2014, 51, 2880–2898. [Google Scholar] [CrossRef]
  33. Liu, S.Y. Risks and reform of land-based development model. Int. Econ. Rev. 2012, 2, 92–109. [Google Scholar]
  34. Yan, J.H. Land mortgage, bank loans and financial risks: Theoretical, empirical and policy analysis. China Land Sci. 2007, 1, 17–23. [Google Scholar]
  35. Woo, W.T. The Necessary Demand-Side Supplement to China’s Supply-Side Structural Reform: Termination of the Soft Budget Constraint. SSRN Electron. J. 2016, 1, 139. [Google Scholar] [CrossRef]
  36. Wang, Y.L.; Zou, X.Q. Land transfer in China: To obtain land revenue or attract business and investment? Econ. Rev. 2016, 5, 68–82. [Google Scholar]
  37. Yang, Q.J.; Zhuo, P.; Yang, J.D. Industrial land supply and FDI quality bottom line competition. Manag. World 2014, 11, 24–34. [Google Scholar]
  38. Zhang, S.H.; Yu, Y.Z. Land lease, resource misallocation and total factor productivity. J. Financ. Econ. 2019, 2, 73–85. [Google Scholar]
  39. Deng, X.; Huang, J.; Rozelle, S.; Uchida, E. Growth, population and industrialization, and urban land expansion of China. J. Urban Econ. 2008, 63, 96–115. [Google Scholar] [CrossRef]
  40. World Bank. China Data. Available online: https://data.worldbank.org/indicator/AG.LND.AGRI.K2?locations=CN (accessed on 17 December 2018).
  41. China Land and Resources Statistical Yearbook. Available online: http://tongji.cnki.net/kns55/Navi/HomePage.aspx?id=N2015050178&name=YGTTJ&floor=1 (accessed on 3 February 2019). (In Chinese).
  42. China City Statistical Yearbook. Available online: http://tongji.cnki.net/kns55/Navi/HomePage.aspx?id=N2010042092&name=YZGCA&floor=1 (accessed on 3 February 2019). (In Chinese).
  43. Arellano, M.; Bond, S. Some Tests of Specification for Panel Data: Monte Carlo Evidence and an Application to Employment Equations. Rev. Econ. Stud. 1991, 58, 277. [Google Scholar] [CrossRef] [Green Version]
  44. Arellano, M.; Bover, O. Another look at the instrumental variable estimation of error-components models. J. Econ. 1995, 68, 29–51. [Google Scholar] [CrossRef] [Green Version]
  45. Blundell, R.; Bond, S. Initial conditions and moment restrictions in dynamic panel data models. J. Econ. 1998, 87, 115–143. [Google Scholar] [CrossRef] [Green Version]
  46. Zhang, L.; Wang, X.B.; Xu, X.X. Fiscal incentive, political incentive and local officials’ land supply. China Ind. Econ. 2011, 4, 35–43. [Google Scholar]
  47. Liu, S.Y. China’s Two-Stage Land Reform. Int. Econ. Rev. 2017, 5, 29–56. [Google Scholar]
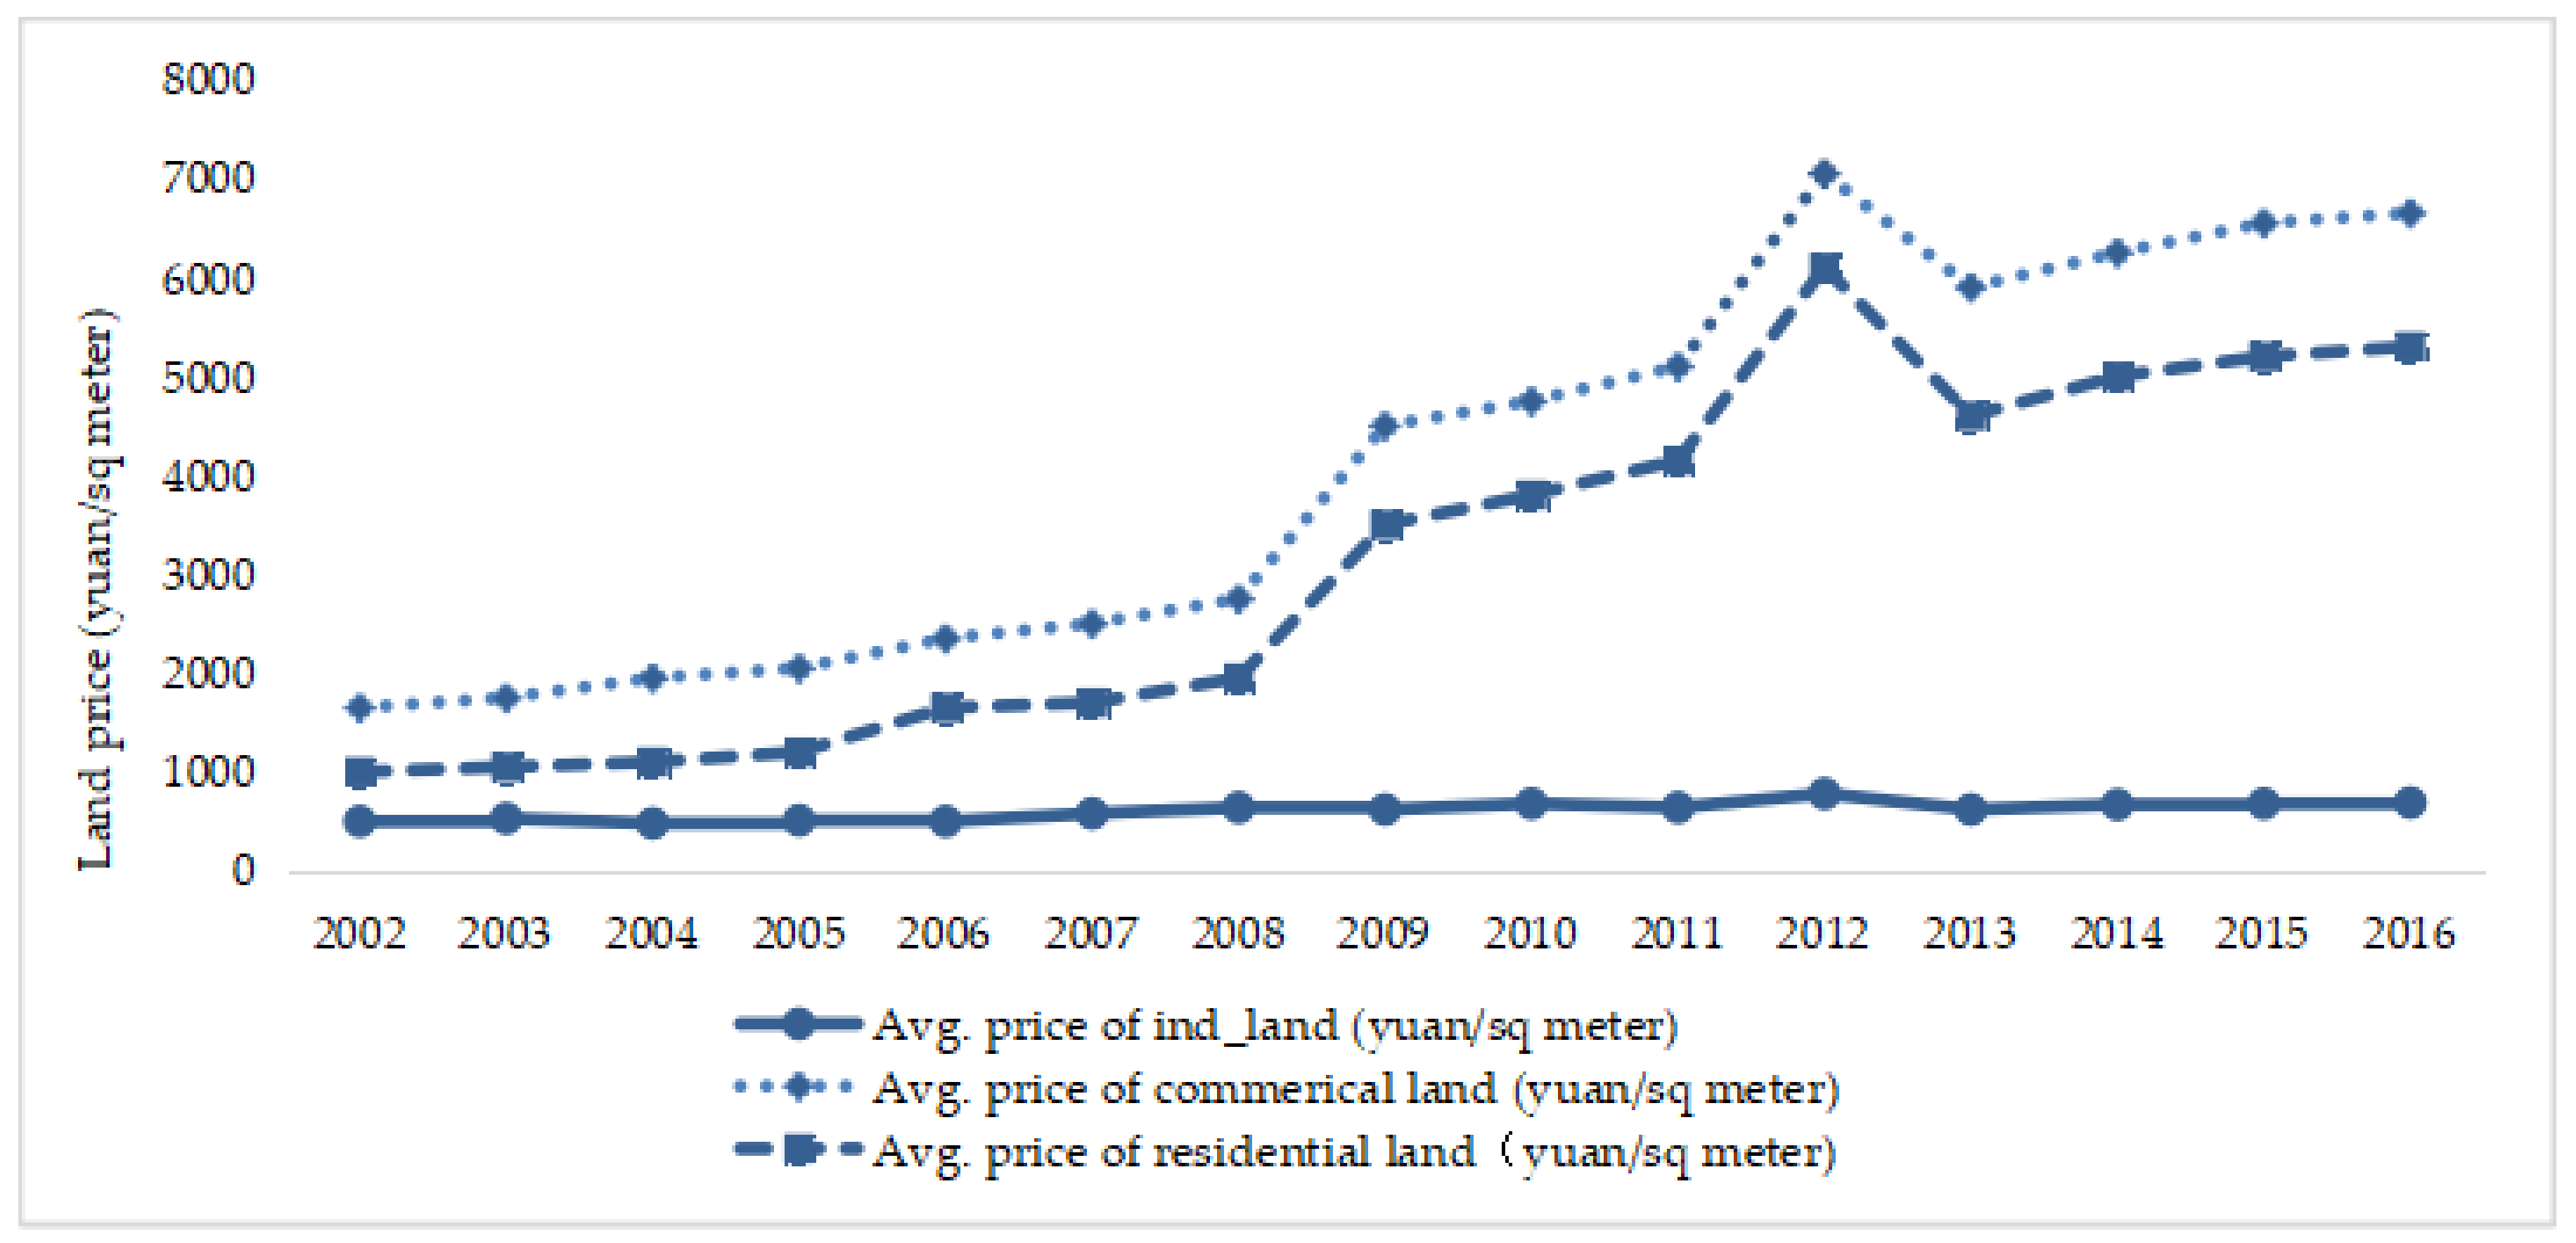
Figure 1. Variation in prices of industrial, commercial, and residential land over time.
Sustainability 11 04446 g001
Figure 2. Land-driven development mode. FDI: foreign direct investment.
Sustainability 11 04446 g002
Figure 3. China’s cultivated and urban construction land areas.
Sustainability 11 04446 g003
Figure 4. Land transfer fees and mortgage amounts.
Sustainability 11 04446 g004
Figure 5. Gross industrial output value and growth rate.
Sustainability 11 04446 g005
Table 1. Descriptive statistics.
VariablesVariable DescriptionUnitMeanSD
Dependent variablesCompleted investment in fixed assets (completed_inv)Billion yuan48.70112.4
Gross industrial output value (gross_ind)Billion yuan316.25426.26
Core independent variablesUrbanized land (urb_land)Hectare/year406.74604.66
Industrial land (ind_land)Hectare/year281.184511.83
Control variablesTrade dependence (TD) 0.2070.339
Foreign direct investment (FDI)Billion yuan5.6112.38
Urban population density (UPD)Population/hectare458.58330.49
Financial interrelations ratio (FIR) 2.011.01
Industrial structure (IS)%36.678.79
Table 2. Results of Kuznets effect of urbanized land supply on urbanization.
VariablesComplete_inv (Urbanization)
FEDIF-GMMSYS-GMM
(1)(2)(3)
L.complete_inv 0.376 **
(2.28)
0.890 ***
(19.09)
urb_land0.567 *
(1.84)
0.176 **
(2.35)
0.184 ***
(2.71)
urb_land2−0.001 ***
(−2.87)
−0.00027 **
(1.99)
−0.0003 **
(−2.46)
TD−28.54 *
(−1.69)
−2.856 **
(−2.01)
−7.56 **
(−2.23)
FDI2.88 ***
(3.92)
0.641 **
(2.31)
0.524 **
(2.47)
UPD0.012 **
(2.46)
0.0101 *
(1.71)
0.0086 *
(1.88)
FIR10.23 *
(1.85)
1.636
(1.52)
1.794
(1.58)
IS0.35
(0.443)
0.053
(0.91)
0.103
(0.81)
Constant6.79 **
(2.00)
7.38 **
(2.57)
Overall R20.54
AR(2) test 0.9580.896
Hansen test 0.2070.266
Sample size204020402040
Note: *, **, and *** correspond to significance levels of 1%, 5%, and 10%, respectively. Values in parentheses are t-values. In both DIF-GMM and SYS-GMM, the key variables Complete_inv, urb_land, and urb_land2 are treated as endogenous and other control variables as exogenous; the 2nd- and the 3rd-order lag terms of the endogenous variables are included as instruments in the transformed difference equation, whereas the first-order lag terms are included in the level equation in the system GMM estimation. The number of overall instruments used in DID-GMM and SYS-GMM are 38 and 57, respectively.
Table 3. The system GMM results of the Kuznets curve effect for urbanization in the eastern and mid-western regions.
VariablesComplete_inv (Urbanization)
EastMid-West
(1)(2)
L.complete_inv0.886 ***
(20.02)
0.875 ***
(6.71)
urb_land0.164 ***
(3.35)
0.222 ***
(2.89)
urb_land20.00024 ***
(4.10)
0.00027
(0.08)
TD−10.55 **
(−2.50)
−3.828 **
(−2.65)
FDI0.720 **
(2.06)
0.353 ***
(3.20)
UPD0.0651 *
(1.77)
0.026 **
(2.29)
FIR4.04
(1.40)
1.77
(1.11)
IS0.15
(1.20)
0.14
(1.41)
Constant12.33 **
(2.61)
9.652 ***
(3.23)
AR(2) test0.9720.900
Hansen test0.5300.421
Sample size6561384
Note: *, **, and *** correspond to significance levels of 1%, 5%, and 10%, respectively. Values in parentheses are t-values. In both DIF-GMM and SYS-GMM, the key variables Complete_inv, urb_land, and urb_land2 are treated as endogenous and other control variables as exogenous; the 2nd- and the 3rd-order lag terms of the endogenous variables are included as instruments in the transformed difference equation, whereas the first-order lag terms are included in the level equation in the system GMM estimation. The number of overall instruments used in columns (2) and (3) are both 57.
Table 4. Results of the Kuznets effect of industrial land supply on industrialization.
VariablesGross_ind (Industrialization)
FEDIF-GMMSYS-GMM
(1)(2)(3)
L.gross_ind 0.804 ***
(12.47)
0.914 ***
(24.25)
Ind_land−20.903 **
(2.13)
0.349
(1.10)
0.385 **
(2.19)
Ind_land−22−0.0018 ***
(−2.99)
−0.00069 ***
(−3.01)
−0.0009 ***
(−3.41)
TD−15.87 **
(−2.35)
10.044 **
(1.99)
10.367 **
(2.12)
FDI10.36 ***
(5.26)
2.62 **
(2.30)
2.04 *
(1.83)
UPD0.0739 ***
(3.04)
0.0442 *
1.73)
0.021 *
(1.89)
FIR−10.36
(−1.00)
−1.974
(−0.71)
−0.95
(−0.67)
IS10.28 ***
(5.78)
−2.83 ***
(−4.75)
−2.03 ***
(−3.21)
Constant39.270 ***
(3.28)
39.86 ***
(3.49)
Overall R20.52
AR(2) test 0.4140.439
Hansen test 0.5450.605
Sample size153015301530
Note: *, **, and *** correspond to significance levels of 1%, 5%, and 10%, respectively. Values in parentheses are t-values. In both DIF-GMM and SYS-GMM, the key variables Gross_ind, Ind_land−2, and Ind_land−22 are treated as endogenous and other control variables as exogenous, the 2nd- and the 3rd-order lag terms of the endogenous variables are included as instruments in the transformed difference equation, whereas the first-order lag terms are included in the level equation in the system GMM estimation. The number of overall instruments used in DID-GMM and SYS-GMM are 26 and 39, respectively.
Table 5. The system GMM results of the Kuznets effect for industrialization in eastern and mid-western regions.
VariablesGross_ind (Industrialization)
EastMid-west
(1)(2)
L.gross_ind0.931 ***
(42.22)
0.793 ***
(7.15)
Ind_land−20.554 **
(2.19)
0.651 **
(2.15)
Ind_land−22−0.0011 ***
(−3.44)
0.0017
(0.01)
TD10.191 ***
(3.56)
12.241 **
(2.19)
FDI1.49 **
(2.23)
5.065 **
(2.35)
UPD0.0142 **
(1.97)
0.029 *
(1.81)
FIR−0.558
(−1.08)
−1.198
(−0.96)
IS−2.356 **
(−2.30)
−1.357 ***
(−3.96)
Constant109.43 ***
(3.25)
65.883***
(4.02)
AR(2) test0.4260.315
Hansen test0.6040.403
Sample size4921038
Note: *, **, and *** correspond to significance levels of 1%, 5%, and 10%, respectively. Values in parentheses are t-values. In both DIF-GMM and SYS-GMM, the key variables Gross_ind, Ind_land−2, and Ind_land−22 are treated as endogenous and other control variables as exogenous, the 2nd- and the 3rd-order lag terms of the endogenous variables are included as instruments in the transformed difference equation, whereas the first-order lag terms are included in the level equation in the system GMM estimation. The number of overall instruments used in columns (2) and (3) are both 39.