Article

A Network Modelling Approach to Flight Delay Propagation: Some Empirical Evidence from China

1
College of Civil Aviation, Nanjing University of Aeronautics and Astronautics, Nanjing 210016, Jiangsu, China
2
Department of Geography, Ghent University, Krijgslaan 281/S8, B9000 Gent, Belgium
3
Department of the Built Environment, Eindhoven University of Technology, 5600MB Eindhoven, The Netherlands
4
Department of Geography, University of Tartu, Vanemuise 46, 51014 Tartu, Estonia
*
Author to whom correspondence should be addressed.
Sustainability 2019, 11(16), 4408; https://doi.org/10.3390/su11164408
Submission received: 24 June 2019 / Revised: 29 July 2019 / Accepted: 31 July 2019 / Published: 15 August 2019

Abstract

:
This paper examines flight delay propagation in air transport networks. Delays add to additional costs, inefficiencies, and unsustainable development. An integrated flight-based susceptible-infected-susceptible (FSIS) model was developed to analyse the flight delay process from a network-based perspective. The probability of flight delay propagation was determined using a translog model. The model was applied to an airline network consisting of thirty-three routes involving three airlines. The results show that the propagation probability is network-related and varies across different routes. The variation is related to the flight frequencies at airports, route distances, scheduled buffer times, and the propagated delay time. Whereas buffer time has a greater impact on smaller airports, flight movement has a greater impact on larger airports. Having a better understanding of how delays happen can help the development of strategies to avoid them. This will lead to less costs, higher efficiencies, and more sustainable airport and airline development.

1. Introduction

The global aviation industry has experienced unprecedented growth in terms of supply and demand. By 2024, global air traffic volume will reach 7.2 billion passenger movements, which represents an average annual growth rate of 3.7%. In this global aviation market, China is expected to become the largest player, with both the expansion of airlines and its airport infrastructure [1]. In 2016, the market share of China’s civil aviation industry was 50.4%, exceeding the global market by 50% for the first time [2]. However, China’s exceptional growth in the aviation sector has also resulted in a number of unwanted consequences. One of the most prominent consequences is flight delays. Flight delays have become an increasing problem in China, which will not only lead to considerable inconvenience to passengers, but also negative economic impact [3]. Therefore, delay control solutions will benefit the entire (Chinese) society [4].
Delay is normally reflected as the late arrival or departure of inbound or outbound flights. It has the feature that delays on one flight can have an effect on subsequent flights and the airline network as a whole. In general, the delays of upstream flights are the main cause of the delays in downstream flights. According to the data from China Airline in 2017, nearly half of their sequence flights suffered from propagated delays. The problems induced by aircraft, passengers [5], crew and/or airport resources in early flights may directly or indirectly affect other connecting flights [6]. Consequently, a congested airport may propagate delays to its connecting airports through the delayed flights, which eventually has an impact on a significant part of the entire network performance [7,8].
Modelling the process of delay propagation, however, is complicated because it involves factors related to multiple dimensions. Furthermore, there are different conditional settings at the level of airports and airlines (i.e., different routes, distances, flight frequencies and scheduling of buffer times). Existing studies on the propagation of flight delays primarily focused on the perspective of single airport operation [9], traffic management [10] and flight re-schedule [11]. However, recent works found that delays can magnify when it is examined in multi-airport networks [12]. Simaiakis and Pyrgiotis [13] proposed an approximate delay model based on a queuing engine and a delay propagation algorithm to examine the complex phenomenon of delay propagation between airports. Their model was applied to a network with 34 of the busiest airports in the United States. The results show that in some major airports, especially in hub airports, the propagated delay tends to reduce traffic demand.
Besides the delay propagation between airports, the sequence of flights and their controlling methods also play an important role. For example, AhmadBeygi et al. [14] analysed the slack between subsequent flights in a schedule when a delay occurs and showed how delay propagation can be reduced by redistributing the existing slack in the planning process. In addition, the econometric analysis conducted by Kafle and Zou [6] revealed the effects of various influencing factors on the initiation and progression of propagated delays and quantified how much-propagated delay will be generated from newly formed delays that occur in each sequence of flights. Takeichi [15] optimized the nominal flight time through the estimation of delay accumulation and demonstrated the possibility of estimating delay accumulation using traffic arrival statistics. Realizing the importance of flight delays, Montlaur and Delgado [16] proposed two optimization strategies—on-ground delay at origin and the airborne delay close to the destination airport—to minimize flight delays and passenger delays. In their case study using data from Charles de Gaulle Airport in Paris, passengers were reassigned and the minimum aircraft turnaround time was estimated.
To the best of our knowledge, most if not all studies have been focused on the ground operation between sequence flights when flight delays are propagated. However, the process of delay propagation needs to be analysed from a broader and network perspective because flight scheduling of airlines and airport operations are increasingly synchronized from the perspective of network operation. Nikolas et al. [17] constructed an Approximate Network Delays (AND) model to compute the delays in a congested individual airport and captured the “ripple effect” that leads to the propagation of these delays. Baspinar et al. [18] then constructed an airport-based queuing network model for simulating delay propagation and analysed the total network delay. Airport-specific critical capacity values were observed and airports that are operating below these critical values will significantly contribute to the value of the total delay. In spite of the fact that these recent studies have focused on the propagation processes between sequence flights and congestion in airports, they have ignored the effects of network structure and airport properties. Moreover, the factors used to analyse delay propagation are often limited in the sense that the delay time is calculated directly from the flight schedule and actual flight time, or analysed from delay airports and airline networks separately [19,20].
To further understand the effects of delay propagation, in this paper we attempt to propose a network-based approach to modelling delay propagation. The Susceptible-Infected-Susceptible (SIS) model, which is normally used to simulate the process of how diseases, information or rumours spread, is introduced and extended to include a network structure, and to account for the direction of the transmission. More specifically, the SIS model is utilised to understand the process of flight delay propagation in the context of an air transport network and explain the spreading characteristics between different routes in the entire network. In this regard, the paper sheds lights on the modelling and further understanding of flight delay propagations in the following three aspects: (i) Introducing and extending the SIS model to a flight SIS (FSIS) network model; (ii) estimating the delay propagation probabilities, and (iii) testing the model at the level of airports and airline networks by proposing delay control solutions.
The remainder of the paper is organised as follow. In Section 2, the FSIS model is developed based on the mechanisms of epidemic spreading in the SIS model. The flight delay spreading rules and the actual delay propagation probability are redefined for flight delay propagation in the context of an air transport network. Then in Section 3, a translog model for delay propagation probability is presented. This model analyses the factors that impact the delay propagation probabilities. Based on the FSIS model, Section 4 analysed the process of delay propagation at specific airports as well as the whole network. A scenario of adjusted flight scheduling as a control measure for flight delay is simulated. The paper ends with the main findings and directions for future research.

2. Delay Propagation Model

2.1. Delay Propagation Process

In a typical epidemic SIS model [21,22] there are two components: Susceptible ( S ) and infected ( I ). S represents the healthy individuals who are susceptible to being infected, and I presents the infected individuals who are able to recover. Transmission can only occur when a susceptible actor has been in contact with an infected actor. Because of the dynamic interaction in the population (or the network), healthy and infected individuals come into contact with each other, thus infected individuals I can become S with recovery rate δ , and healthy individuals can become I with infection rate β . This cyclical relationship between flights can be depicted in Figure 1.

2.2. Flight-Based Susceptible-Infected-Susceptible Model

The flight delay spreading process in an air transport network can be understood in a similar manner. A delayed flight may propagate delays to the next flight through shared resources, such as aircraft, crew, and passengers [23]. This, in turn, may also lead to new delays to other flights through shared airport resources during the ground phase [24]. Baspinar and Koyuncu [25] have successfully applied the SIS model into an air transportation network to study the spreading of flight delay. In their work, delayed flights causes an infection, and the infection may spread through the network when more infected delayed flights are generated.
However, there are differences between delay propagation and disease spreading:
First, at the “origin of the infection”. In disease spreading, the propensity of a person catching a disease or illness increases when this person comes into contact with more (sick) people, and this without considering his/her initial physical health and other external interferences. In the situation of flight delays, the propagation delay only occurs between subsequent flights. In other words, the process is linear in that the preceding flight is the only infection source that can propagate delays on the next flight.
Second, at the level of the “meaning of the infection rate”. Again, in disease spreading, suppose a person A gets in contact with just one sick person B, and as a result, A gets ill. In such a case, we can say that the probability that B has infected A equals 100%. In delay propagation analysis, this is different. Suppose that a delay occurs and that flight j is delayed. We then cannot conclude that the delay of flight j is 100% attributed to the propagation delay from the upstream flight i . While in disease spreading, the infection rate tells us with how much probability the disease will be “successfully” propagated (whether the receptor will be infected is unknown), whereas in flight delay propagation, both the downstream flight delay and propagated delay are happening at the same time; hence, the infection rate only represents how much it is impacted by the upstream propagated delay. Therefore, the infection rate in flight delay is more likely when propagated delay occurs, and what its impact will be downstream. In other words, if a downstream flight is delayed, it is possible to be impacted by the propagated delay from its upstream flight.
Even so, flight delay propagation and epidemic spreading still have common features. In the process of delay propagation for resource-shared flights, delays are propagated from an upstream flight at the departure airport. The propagated delay will last until the current flight reaches the arrival airport and may propagate the delay to the subsequent flight if there is any arrival delay. If there is sufficient scheduled buffer time, then a flight with departure delay may have an early arrival. Conversely, if the schedule was too tight or if there is a lack of available airport resources, then a flight with an early or on time arrival may still have a delayed departure. As a result, a stochastic process applies to all flights, given that flights affect and are affected in probability. That is the infection rate β i j t between sequence flights i and j , and the recovery rates δ i t of upstream flight i . Suppose there are only two kinds of flights in the network at time t : Non-delayed flights S ( t ) and delayed flights I ( t ) , the dynamics of the SIS model can then be written as [26]:
I ( t ) t = i = 1 N j = 1 N β i j t I ( t ) S ( t ) i = 1 N δ i t I ( t )
S ( t ) t = i = 1 N j = 1 N β i j t I ( t ) S ( t ) + i = 1 N δ i t I ( t )
where I ( t ) is the total infected flights in the network and N is the total number of flights in the network. The total number of non-delayed flights is given as S ( t ) = N I ( t ) .
In China, most domestic flights are scheduled before midnight and the flights operated after midnight are rare and often for cargo and international flights. Besides, it can be found from the data that flights departing near midnight are often the last flight among its entire flight leg. If a flight as such is delayed late to midnight, its subsequent flight will often be cancelled. Therefore, at the end of each day, the last flight in airports has minor impact on delay propagation and cannot be seen as an infected flight. In other words, at the end of each day, delay propagation is considered to be ended, which means that all delayed flights in the network will become non-delayed again the next day. Moreover, the recovery rate δ i t only affects the time scale of spreading [27], therefore, the recovery rate δ i t is set to 1, because we only focus on the delays propagation in daytime (i.e., characteristics of spreading such as speed and scale). There are also other reasons to follow this assumption: (1) At the end of a day, all delay propagations are considered to have ended. The network returns to a non-delayed network. If a flight is delayed to the next day, we call this flight a “supplementary flight” but not a new, original flight. It can be seen, all flights can be recovered in a limited time (which includes our examining time); (2) when analysing the data statistics, we found that propagated delays often have an impact within 1–2 h. If a flight is delayed more than 2 h, it often is attributed to aircraft breakdown, airport closure, or weather conditions, but not so with propagated delay. As we focus on the effects of this kind of delay, we considered the recovery rate to be 1.
Under the condition of δ i t = 1 , delay propagation is mainly affected by the value of β i j t . As S ( t ) = N I ( t ) the fraction of delayed flights at time t can be translated into the following form:
I ( t ) t = i = 1 N j = 1 N β i j t I ( t ) ( N I ( t ) ) I ( t )
The first part in Equation (3) i = 1 N j = 1 N β i j t I ( t ) ( N I ( t ) ) means that the total of non-delayed flights j can be infected with a probability of β i j t through all the upstream delayed flights i .
An air transport network can be abstracted as a directed graph with nodes and edges similar to the epidemic network model. Individual flights can be shown as nodes and the connectivity between sequence flights as edges. The delay propagation between connected flights can be investigated in this flight-based network. Given that the Civil Aviation Administration of China (CAAC) considers all flights with a delay greater than 15 min to be delayed, we defined the infected (or delayed) flights as those with the arrival or departure delays exceeding the threshold. The following data-driven algorithm was used to construct the FSIS model, which allows us to estimate the fraction of the infected flights I ( t + 1 ) through statistical analysis, with the input of I ( t ) at time t. To better understand the behaviour of flight-propagation, we utilised historical flight data, which was later validated using known flight delays.
The information from the historical flight data consists of two parts: A scheduled flight dataset F s , including the scheduled departure/arrival time; and an actual flight dataset F a , which includes the actual arrival/departure time. The total number of times of aircrafts taking off and landing in an airport during a certain period of time (we use flight movement in subsequent sections) was also used. From the dataset F s and F a , the state of each individual flight could be calculated, and consequently, we obtained the fractions of I ( t ) at time t . Then, fractions of I ( t + 1 ) were calculated using I ( t ) and β i j t following the flight delay propagation process of Equation (3). Note that in Section 3, the infection rate β i j t will be constructed using a translog model.
Given the available data, the whole simulation process with the FSIS and translog models can be described as follows:
Algorithm 1 FSIS model simulation process
1: Input: I ( t ) F s F a
2: Output: I ( t + 1 )
3: for i do
4:   for j do
5: Generate β i j t from the translog model;
6:   Calculate I ( t + 1 ) using Equation (3);
7:   end for
8: end for

3. The Translog Model of Delay Propagation

3.1. Delay Propagation Probability

To further explain how a propagated delay occurs, we first confirmed the propagated delay using the following definition [28]: A delay occurs when the aircraft to be used for a flight leg is delayed on its prior flight leg. In other words, three conditions should be met when P D exists [12]: (1) Flight i departs late at original airport; (2) flight i arrives late in the subsequent flight leg at destination airport; and (3) the downstream flight (flight j ) of flight i arrives late at the next destination. Then the method proposed by Jetzki [19] can be used to calculate the the propagated delay, where the calculation of propagated delay is simplified as PD = MAX {0, departure delay-ground buffer time-airborne buffer time}.
Since both the ground and block phase of flights are considered, the propagated delay may be magnified or absorbed during the entire delay propagation process. For instance, propagated delays from upstream may be exacerbated due to a congested departure/arrival airport. On the other hand, the propagated delay could be mitigated because the effects are dampened out through the buffer time in the schedule to allow for uncertainty factors [15]. Therefore, with scheduled buffer time and adjusted block time during the flight, an infected flight is considered to be in the process of recovery. If the departure delay is totally absorbed and there is no arrival delay, then the “infected” flight is no longer infectious. Therefore, the propagated delay does not propagate to the next flight.
As delays will eventually be eliminated with infinite time, we focus on the impact of upstream propagated delay and the propagating process. Therefore, the infection rate β i j t enables us to identify the amplifying or mitigating factors that have an impact on the propagated delay between sequence flights i and j . As discussed above, a flight delay may be due to the congestion of airports, the scheduling of airlines, and/or the block time of flights. Therefore, the infection rate is related to not only the propagated delay, but also other route attributes, such as flight movement, planned buffer time, and route distance.
Therefore, the general infection rate β i j t function between flight j and its upstream flight i during the time period t can be specified as follows:
β i j t = f ( P D i j t , B T j t , M o v e m e n t D j t , D i s t a n c e i j , K i j t )  
where D j is the departure airport of flight j , M o v e m e n t D j t is the flight movements in the airport D j at time t . D i s t a n c e i j is the route distance between flight i and j . B T j t is the total scheduled buffer time of flight j . P D i j t is the propagated delay between sequence flight i and j . Thus, B T j t P D i j t can estimate the redundancy of scheduled buffer time. K i j t is an individual stochastic term with respect to other stochastic factors that are not considered in this model.
Following Kondon [12], the multiplier used to measure the influence of upstream flights, and combined with the three conditions that propagated delay should be met, the infection rate is defined as a percentage of propagated delay between flight i and j giving the total departure delay of flight j :
β i j t = min { P D i j t D T j t ,   1 }
where D T j t is the departure delay time of flight j during a period t ; P D i j t is the total arrival delay time in the airport D j . Infection rate is a probability such that it cannot exceed 1. As the infection rate in flight delay is more likely when propagated delay occurs—and given that we want to know how much it will influence downstream—we take the form of a ratio. That can be measured as whether the propagated delay from upstream flight i is magnified or absorbed during the propagation process and the degree it is impacted can be both captured.
A de-mean translog model is used to specify the infection rate function, in which all the dependent and independent variables are in deviation forms. The general form of this model is
ln ( P D i j t D T j t ) = ln ( P D i j t ) ln ( D T j ) ¯ = p = 1 4 α p [ ln ( X i j t p ) ln ( X p ) ¯ ] + p = 1 4 l p 4 λ p l [ ln ( X i j t p ) ln ( X p ) ¯ ] [ ln ( X i j t l ) ln ( X i ) ¯ ] +   K i j t
where ln ( D T j ) ¯ is the sample mean of the log of departure delay time of flight j . X i j t p is the value of the independent variable p , ln ( X p ) ¯ is the sample mean of the log of the independent variable p . α p , λ p l and K i j t are coefficients to be estimated.
There are two main advantages of the de-mean translog model. First, since it can be regarded as a second-order Taylor approximation of a general function about the mean values of the data, it proves to be better in data forecasting [29] and dealing with heterogeneous data. Secondly, it can reflect the interaction of variables. Thus, it is more flexible than Cobb–Douglas models and has been widely used in estimation.
The quantified infection rate β i j t is updated during each time period. It enables us to identify which factors in flight delay propagation should be given more attention and adjusted. In addition, the propagation of delays occurs only if the propagation probability is larger than a threshold β measured as β = k / k 2 , where k is the average degree of the network and β is a constant equal to 0.4 throughout the paper. As all infected rates β i j t calculated from the trans-log model in this paper are larger than 0.4, it can be concluded that the threshold β is appropriate to the FSIS model even with the modified β i j t , and the flight delay can be propagated in the entire network.

3.2. Elastic Analysis of Delay Propagation

In this section, we used a translog model to analyse the factors related to the probability of delay propagation. The dependent variables include flight movement, route distance, planned buffer time and propagated delay time. The data used were collected from China Eastern Airline (MU Airline) from September to November 2016 in the airports of Beijing Capital International (PEK), Pudong International (PVG) and Shanghai Hongqiao International (SHA) (Data from supplementary materials). Thirty-three routes were selected from the three departure airports, which connects to 11 arrival airports.
Statistical results from the least squares are shown in Table 1. Note that the signs of the estimated coefficients for movement, distance and the ratio of buffer time to propagated delay time are all as expected and significant at the 5% level. The adjusted R2 is 0.85. The movement and propagated delay coefficient are the positive value (1.55 and 1.27, respectively), and the coefficient for distance and buffer time are negative. This indicates that the probability of delay propagation β i j t increases with higher flight movement and more upstream propagated delay time and decreases with a longer route distance and/or longer buffer time.
Due to the interaction terms in the above translog models, the elasticity of infection rate with respect to the related variables, and therefore whether there are relationships between these variables as well as the infection rate, depends on the values of all explanatory variables. At the mean values of the data, however, the elasticities are simply the values of the first order coefficients (the   α p   s). The first order coefficient on movement is 1.89, implying that at the mean values, the probability of delay propagation is affected by flight movement, with a 1% increase in movement resulting in a 1.89% increase in the infection rate. Similarly, the infection rate would decrease by 0.32 and 1.76 respectively with 1% increase of the travel distance and the scheduled buffer time.
The second-order coefficient on movement is 0.45, which implies that the elasticity of delay propagation probability with respect to flight movement increases with the movement. On the other hand, the second-order coefficient on the interaction between movement and buffer time is −1.06. This means that as scheduled buffer time increases, the infection rate elasticity decreases—that is, buffer time plays a more important role in reducing flight delay in busy airports. Meanwhile, the second-order coefficient on the interaction between distance and propagated delay is −1.39, which indicates that the propagated delay is often absorbed in a long distance.
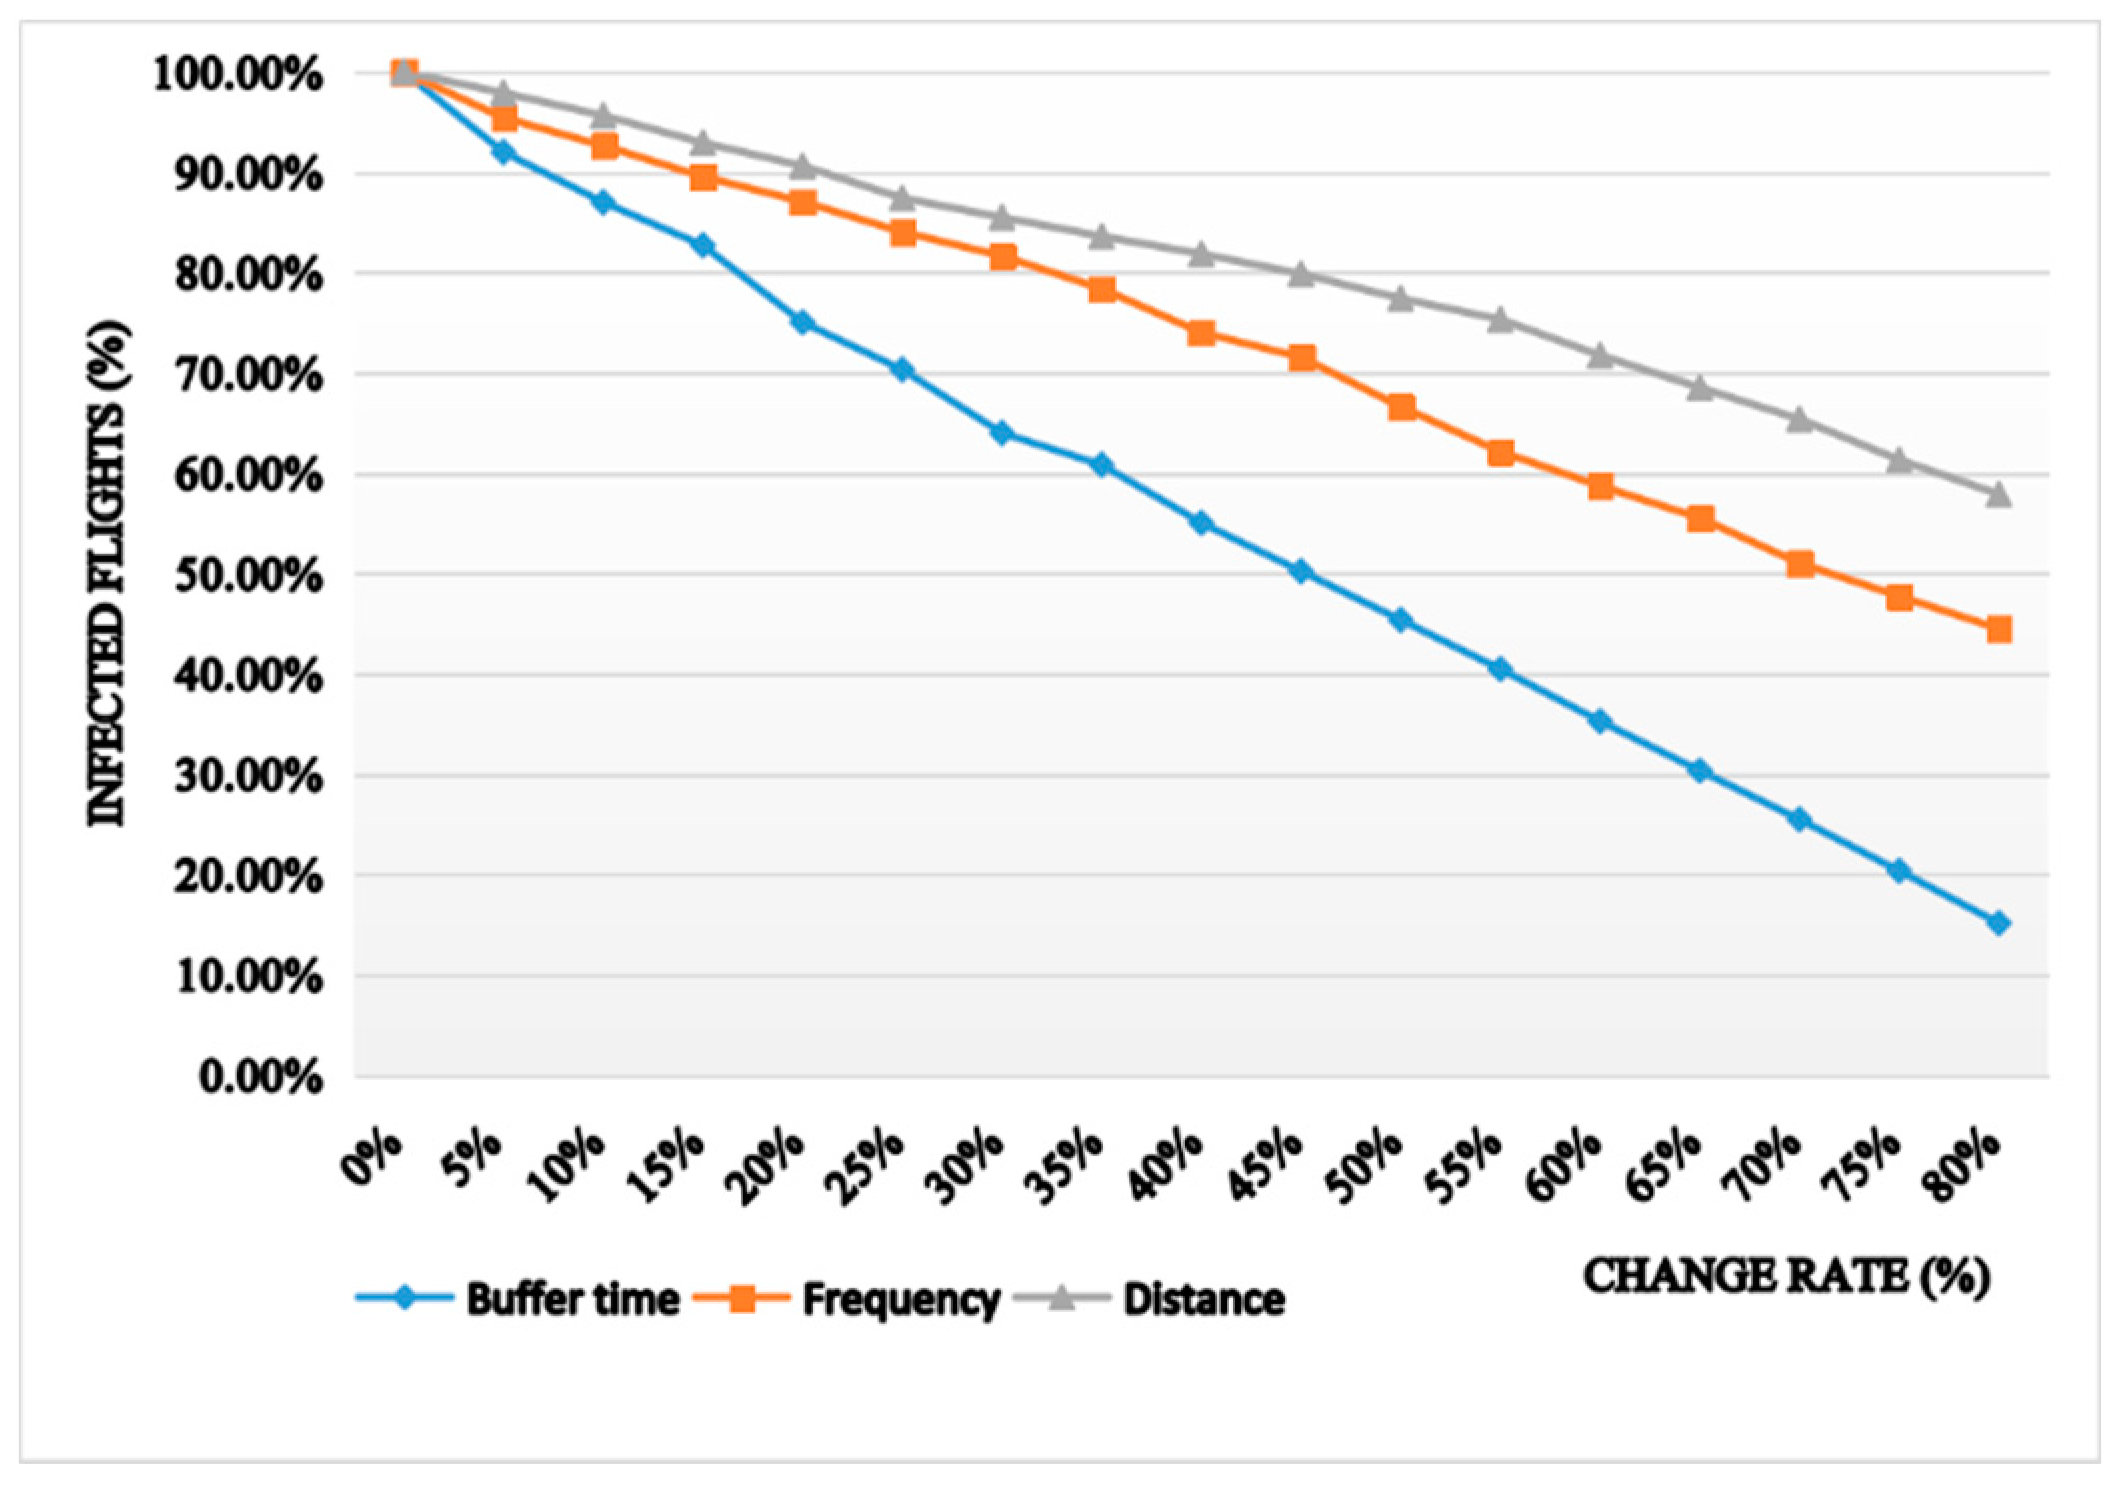
From the estimation results in Table 1, the explanatory variables are found to be more dependent on the values of their first-order terms. Therefore, three variables which have more impact on flight delay are selected to examine the sensitivity of the models where all variables remain the same as the base data on the 33 routes, except for the changing variable in each condition. The conditions include: (1) Decreasing movement from 80% to 10%; (2) increasing distance from 10% to 80%; and (3) increasing buffer time from 10% to 80%. Figure 2 shows how β i j t changes in the three circumstances. It is evident that β i j t decreases much faster in case of increasing buffer time relative to decreasing flight movement or increasing distance.
Note that curves of β i j t are linearly decreasing in all conditions, where delay propagation probability is more sensitive to movement and buffer time, and far less sensitive to distance. These results indicate that flight movement in the departure airport and the scheduled buffer time play an important role in a flight delay. This is because more flight movements may increase congestion at an airport, which may lead to aircraft queuing on the runway and increasing the ground-waiting time of a flight. The scheduled buffer time can also help decrease β i j t . However, airline operators often schedule limited buffer time to maximize aircraft utilization, which results in a higher probability of delay propagation and an increased number of delayed flights.

3.3. Flight Delay Analysis of Airlines

In this section, the probability of delay propagation was determined by comparing the evaluated delayed flight rates with the actual delay profile. Again, we used MU Airline as an example. The characteristics of the delay profile are also analysed.
As flight delays in a network often involve time delays due to the actual flight time, the distribution of flight times of MU Airline was calculated. It was observed that 79.48% of all flights have flight times between 1 to 3 h, and the average flight time is 122 min. Therefore, a 2 h time window was chosen to be the delay spreading period to observe the effect of the complete transition on the dynamics of the network. This means that I ( t + 2 ) is the fraction of delayed flights calculated from I ( t ) two hours later and can be approximated from the updated infection rate β i j t by solving the data-driven algorithm presented in Section 2.
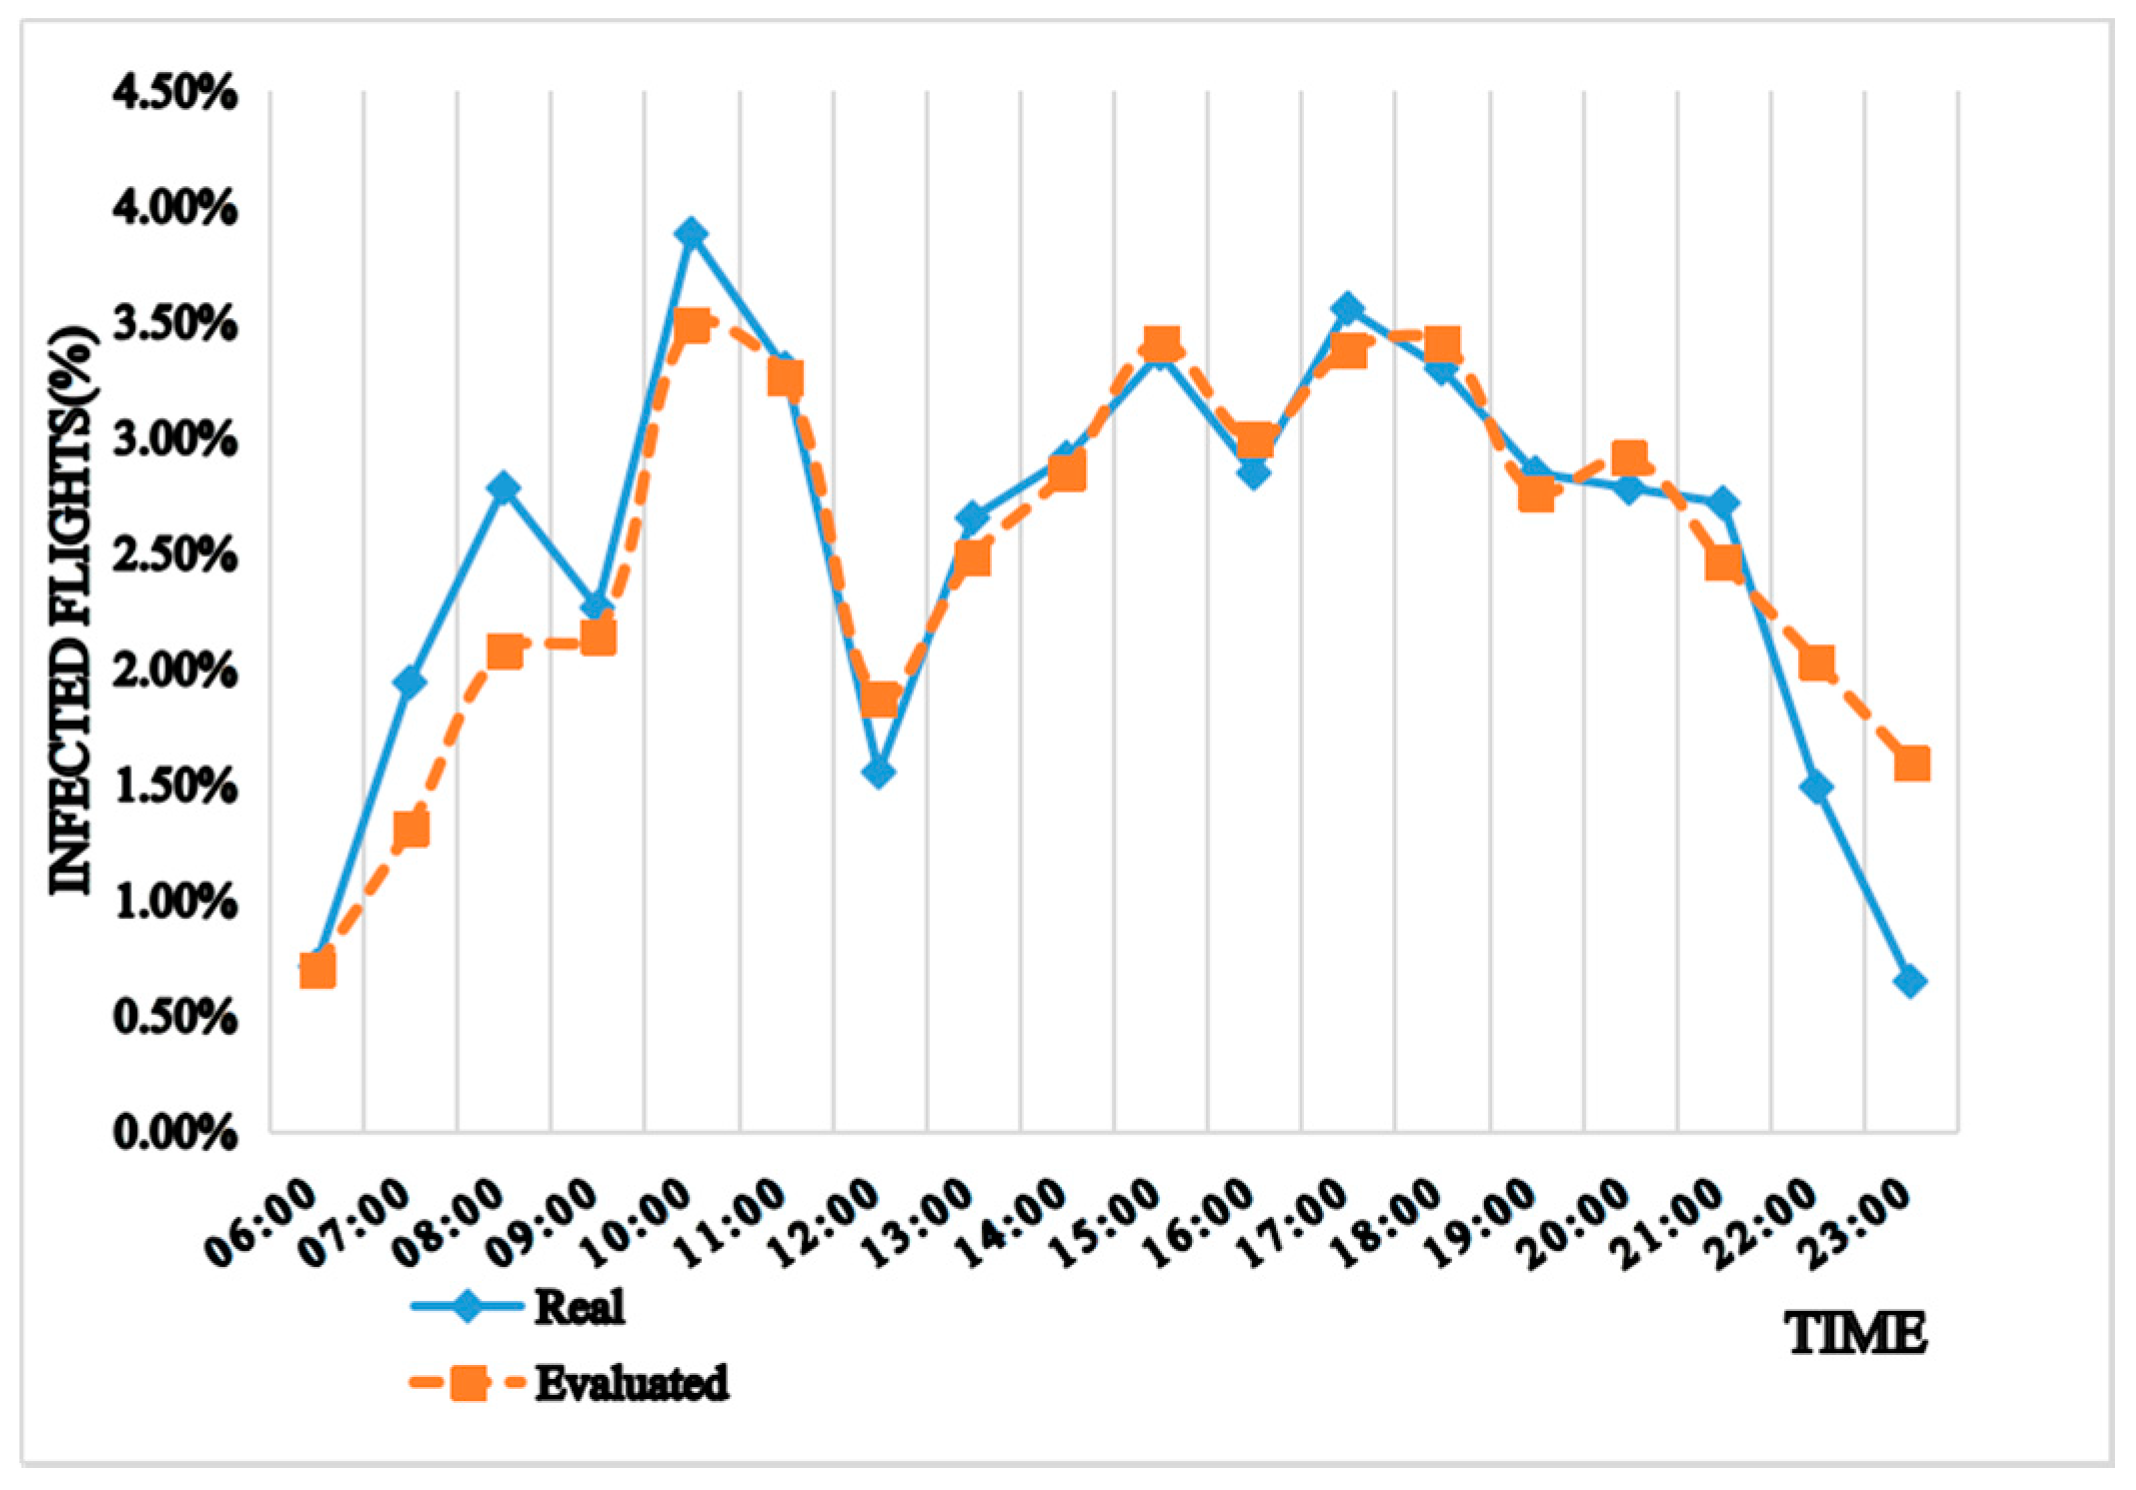
The actual and calculated rates of flight delay of MU Airline are shown in Figure 3. In the initial time of delay propagation, both two curves have the same number of delayed flights. However, as time passed, the real curve shows the real fraction of delayed flights during each period, while evaluated curve presents the calculated fraction estimated by the FSIS model. From the analogous profile of the two curves, it can be noted that the model provides a reliable approximation of the spreading of the flight delay. However, two noticeable differences were found. In the bold line (actual rates), there are two obvious peaks at 8:30 and 10:30 in the morning (we refer to this 2 h interval as a “flight bank”, see Section 4.3). By contrast, the dashed line (calculated rates) does not have these obvious peaks in the morning. Both curves fluctuate but remain high in the afternoon. Then during the evening period, the curve of the calculated rates does not decrease as sharply as the curve of the actual rates. This is because the propagated delays absorbed in the afternoon is less than the propagated delays absorbed in the morning, which leads to a high proportion of delayed flights. However, the results show that the impact of propagated delay is lower in the afternoon due to the lower rotational movement. Furthermore, a primary propagated delay from morning flights had a lower impact on afternoon flight delays.
Jetzki [19] argued that airline operators place a high emphasis on schedule adherence, and therefore tend to schedule buffer time to ensure on-time performance of flights. In particular, more attention is given to flight connectivity in the afternoon. This is also shown by the updating value of β i j t in the FSIS model, which is on average higher in the afternoon.

4. Flight Delay Propagation Based on the FSIS Model

Since the probability of delay propagation is closely related to both the characteristics of the airport (node) in the network and the network structure, flight delays at different airports and the propagation process of flight delays in the entire network will be examined in this section. Data from MU Airline and Spring Airline (9C Airline) were used. As a typical Low-Cost Carrier in China, Spring Airline was used in this analysis to observe the impact of different network structures. The impact that these factors have on delay propagation probability was verified, and the calculated flight delay rates were presented based on the FSIS model to analyse the process of delay propagation in the entire network.

4.1. Airport Operation

In order to perform a more detailed airport-specific analysis, we focus on two airports: Shanghai Pudong International Airport (PVG) and Qingdao Liuting International Airport (TAO). The latter is the main airport serving the city of Qingdao in the Shandong Province. Both airports were selected on the basis of their capacities. PVG is the base airport of MU Airline, and captures the largest proportion of flight movement, while TAO only captured 15% of all flight frequencies in 2016. Based on the definition of delay propagation probability, the impact of flight movement and scheduled buffer time on these two different airports are firstly examined by flights of MU Airline. Based on data from Figure 3, as the flight movement and the scheduled buffer time of each flight were increased, respectively, the rate of delayed flights could be calculated based on the FSIS model. The results are presented in Figure 4, where “T” means traffic, and “B” means buffer time.
It can be observed that the effect of flight movement is opposite to the scheduled buffer time. The proportion of delayed flights decrease with increased buffer time but increase as flight movement is increased at both airports. Furthermore, smaller airports are more sensitive to buffer time, as the curves in Figure 4a show that TAO has greater fluctuation when buffer time is extreme while PVG decreased in an approximately linear manner. However, flight movement has a greater impact on larger airports, since the curve of PVG shows a greater positive slope in Figure 4b.
From the results, it can be concluded that the increasing flight movement in smaller airports during the peak period may not lead to more flight delays and larger delay propagation. This is because there is sufficient scheduled buffer time for each flight. By contrast, larger airports tend to have shorter buffer time to improve the aircraft utilisation.
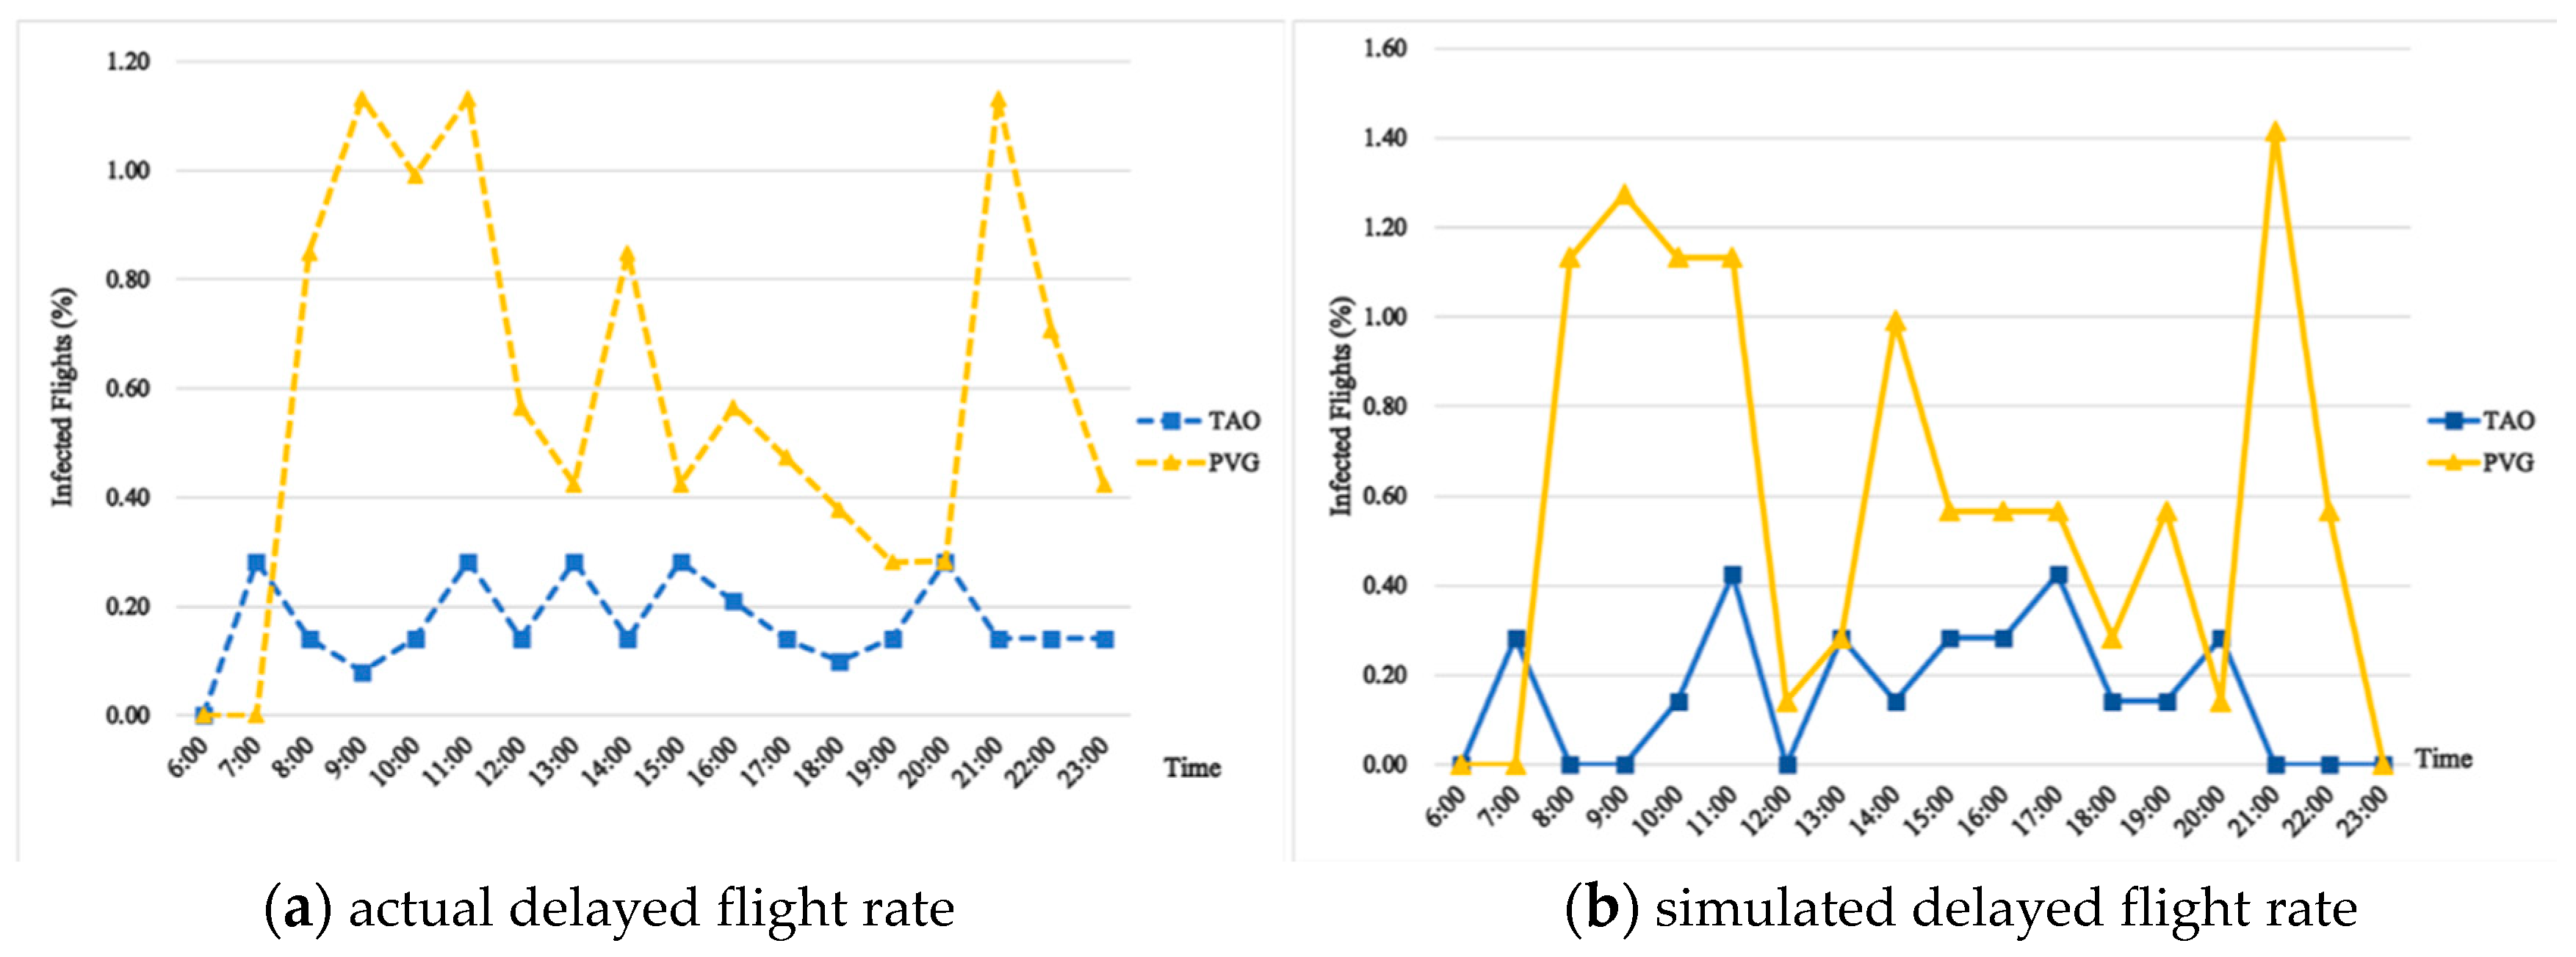
Since the FSIS model is time-related, it would be important to examine how delays are propagated over time. The rate of delayed flights for MU Airline in the above two airports was simulated and is shown in Figure 5. For the same company, the trends of delay propagation are different due to different airports. Overall, the rate is higher in PVG, especially in the morning. This is because that PVG is the base airport of MU Airline, where a high number of departure flights are scheduled. However, the scheduled buffer time of each flight remains the same as it is in the afternoon. Therefore, the delay propagation probability is higher and resulted in more delayed flights. On the other hand, high rates of infected flights are concentrated in the afternoon at TAO. This may be because, with more arrival flights, the flight movement increases and more downstream flights with larger propagated delays arrive in the afternoon. Therefore, the average infected flight rate is higher in the afternoon for TAO. The actual fraction of delayed flight of MU Airline at TAO and PVG airports are calculated to evaluate the simulation results from the FSIS model, as shown in Figure 5b. It can be seen that the curve fluctuation between the two figures is basically consistent. Similar to what we discussed previously, the actual curve presents a more obvious fluctuation from peaks to troughs with flight banks, while the simulated curve is smoother.

4.2. Network Effects

We now focus on the networks of MU and 9C airlines to investigate how delays propagate in different network structures. Both MU and 9C Airlines are typical airlines in China and the data from these airlines is relatively representative and comprehensive. Therefore, the conclusion can represent most situations in China’s domestic flight network. The network structures of Airline MU and 9C are presented in Figure 6 (the number of each route corresponds to the maximum number of roundtrip flights per day). It can be seen that in MU network, the routes with the largest number of flights are Guangzhou–Shanghai, Guangzhou–Beijing and Shenzhen–Shanghai, respectively, while the flights of 9C Airline are mainly concentrated on the routes extending outward from Shanghai, followed by the regional route around the secondary-hub Shijiazhuang Airport, which located in a provincial capital city nearby Beijing.
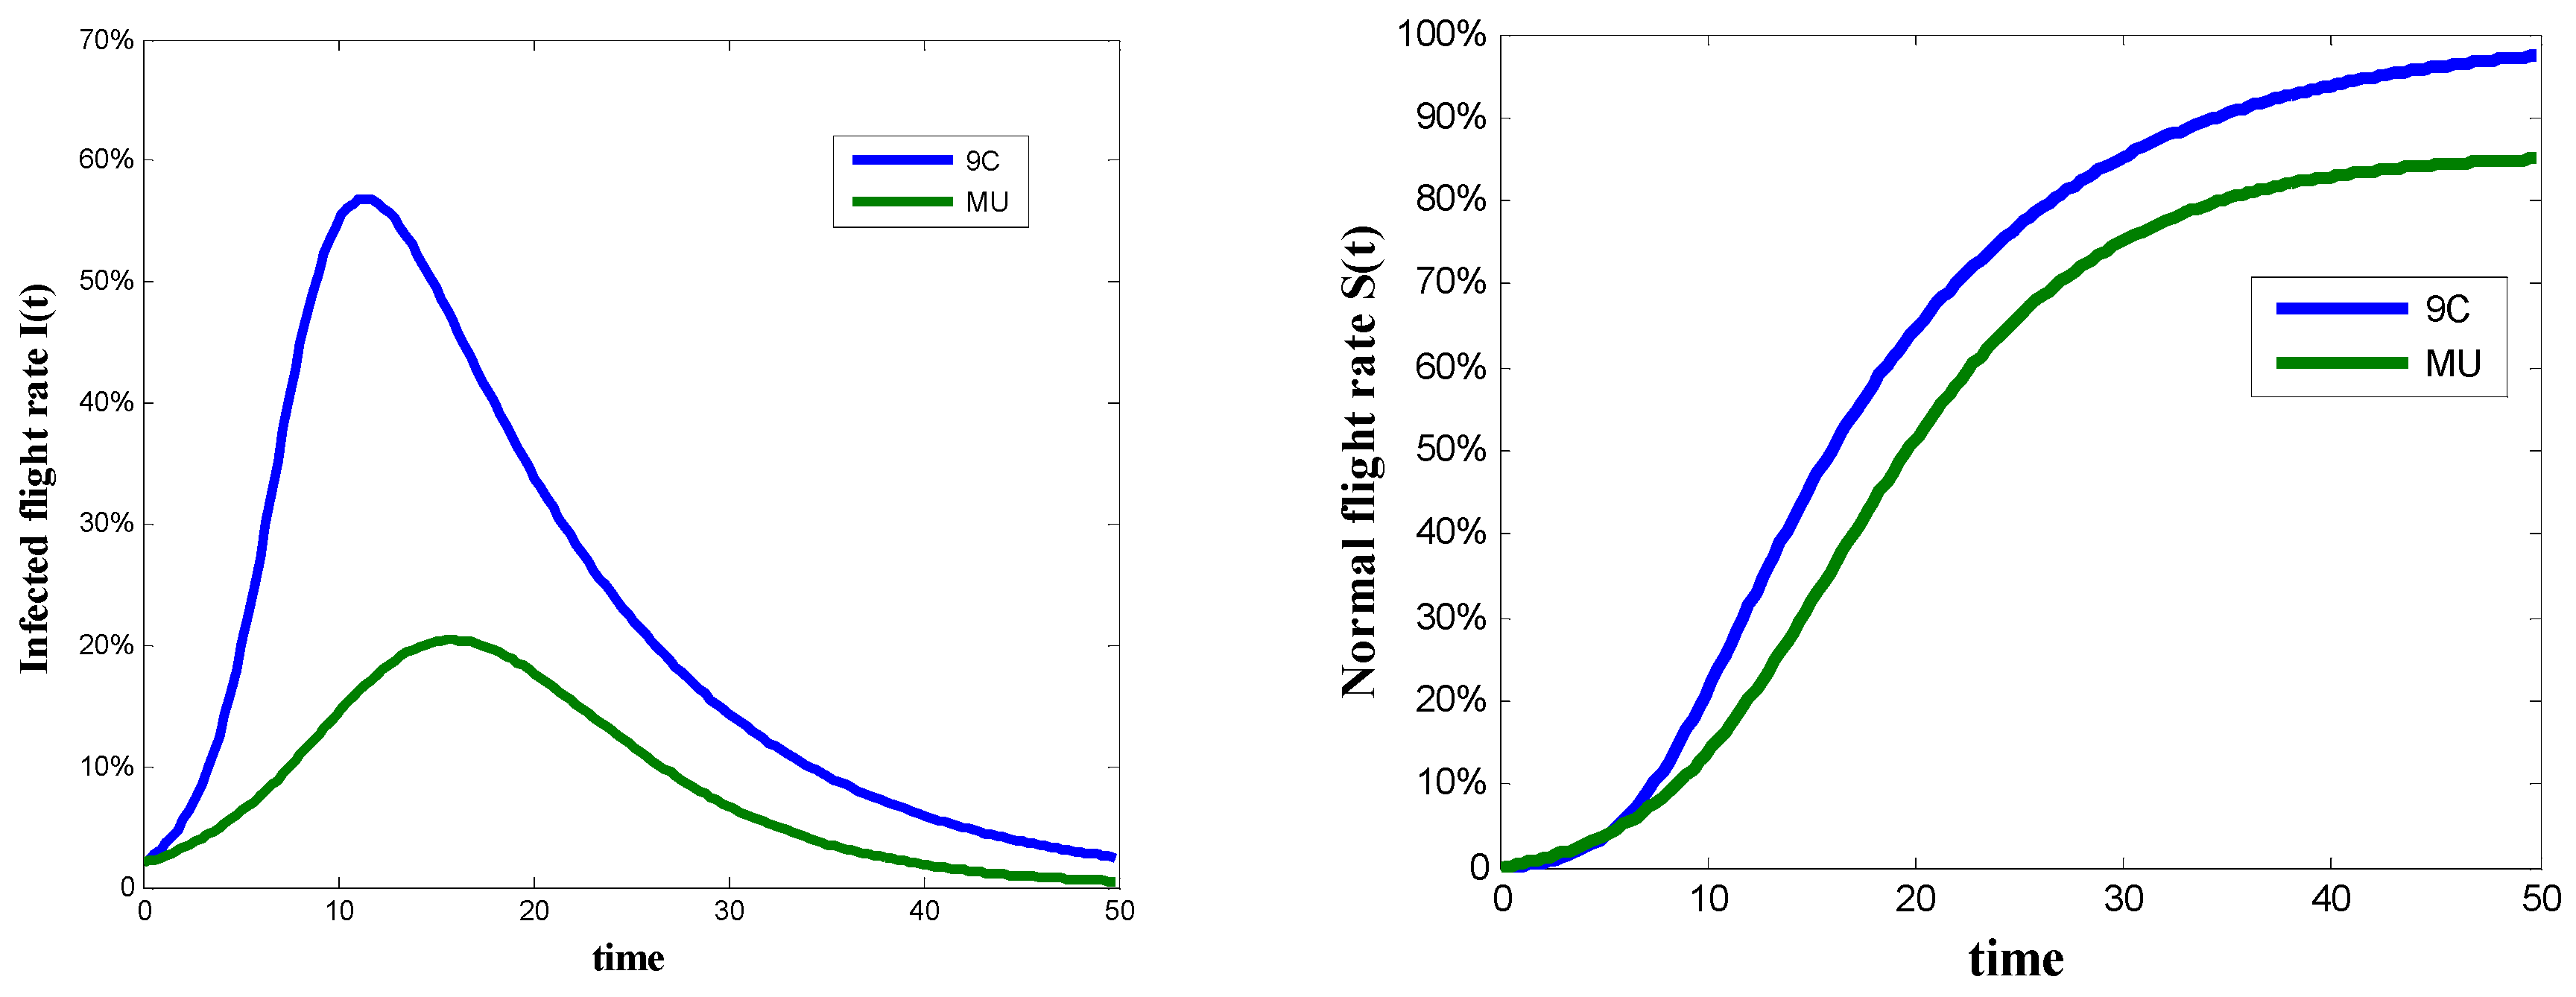
PVG is also the base airport of 9C Airline, thus their service routes are similar at PVG airport. However, as a Low-Cost Carrier, the service pattern of 9C is different from that of MU, which results in different network structures. PVG is the base airport of the two airlines and was selected as the airport with the initial flight delay. Based on the FSIS model, we simulated I ( t ) and S ( t ) of the two airlines respectively. Notice that since it is a simulation curve, the x-axis time is a time scale but does not fit a real daytime.
According to the simulation results in Figure 7, the rate of delayed flights I ( t ) and spreading speed are strongly impacted by different network structures. Although these networks have the same initial delayed airports, the network of 9C Airline resulted in a larger spread scope (a higher peak in I ( t ) , a curve) and a faster propagation speed than that of MU Airline. As time is needed for the flight to propagate their delays, there is no recovered flight in the initial time, and since delay is propagated, flights begin to be infected as well as recovered at the same time in the network. Thus flight delay can rapidly reach more non-delayed airports in the 9C Airline network, and the longer recovery time in the S ( t ) curve indicates that this is a long-lasting spreading effect.
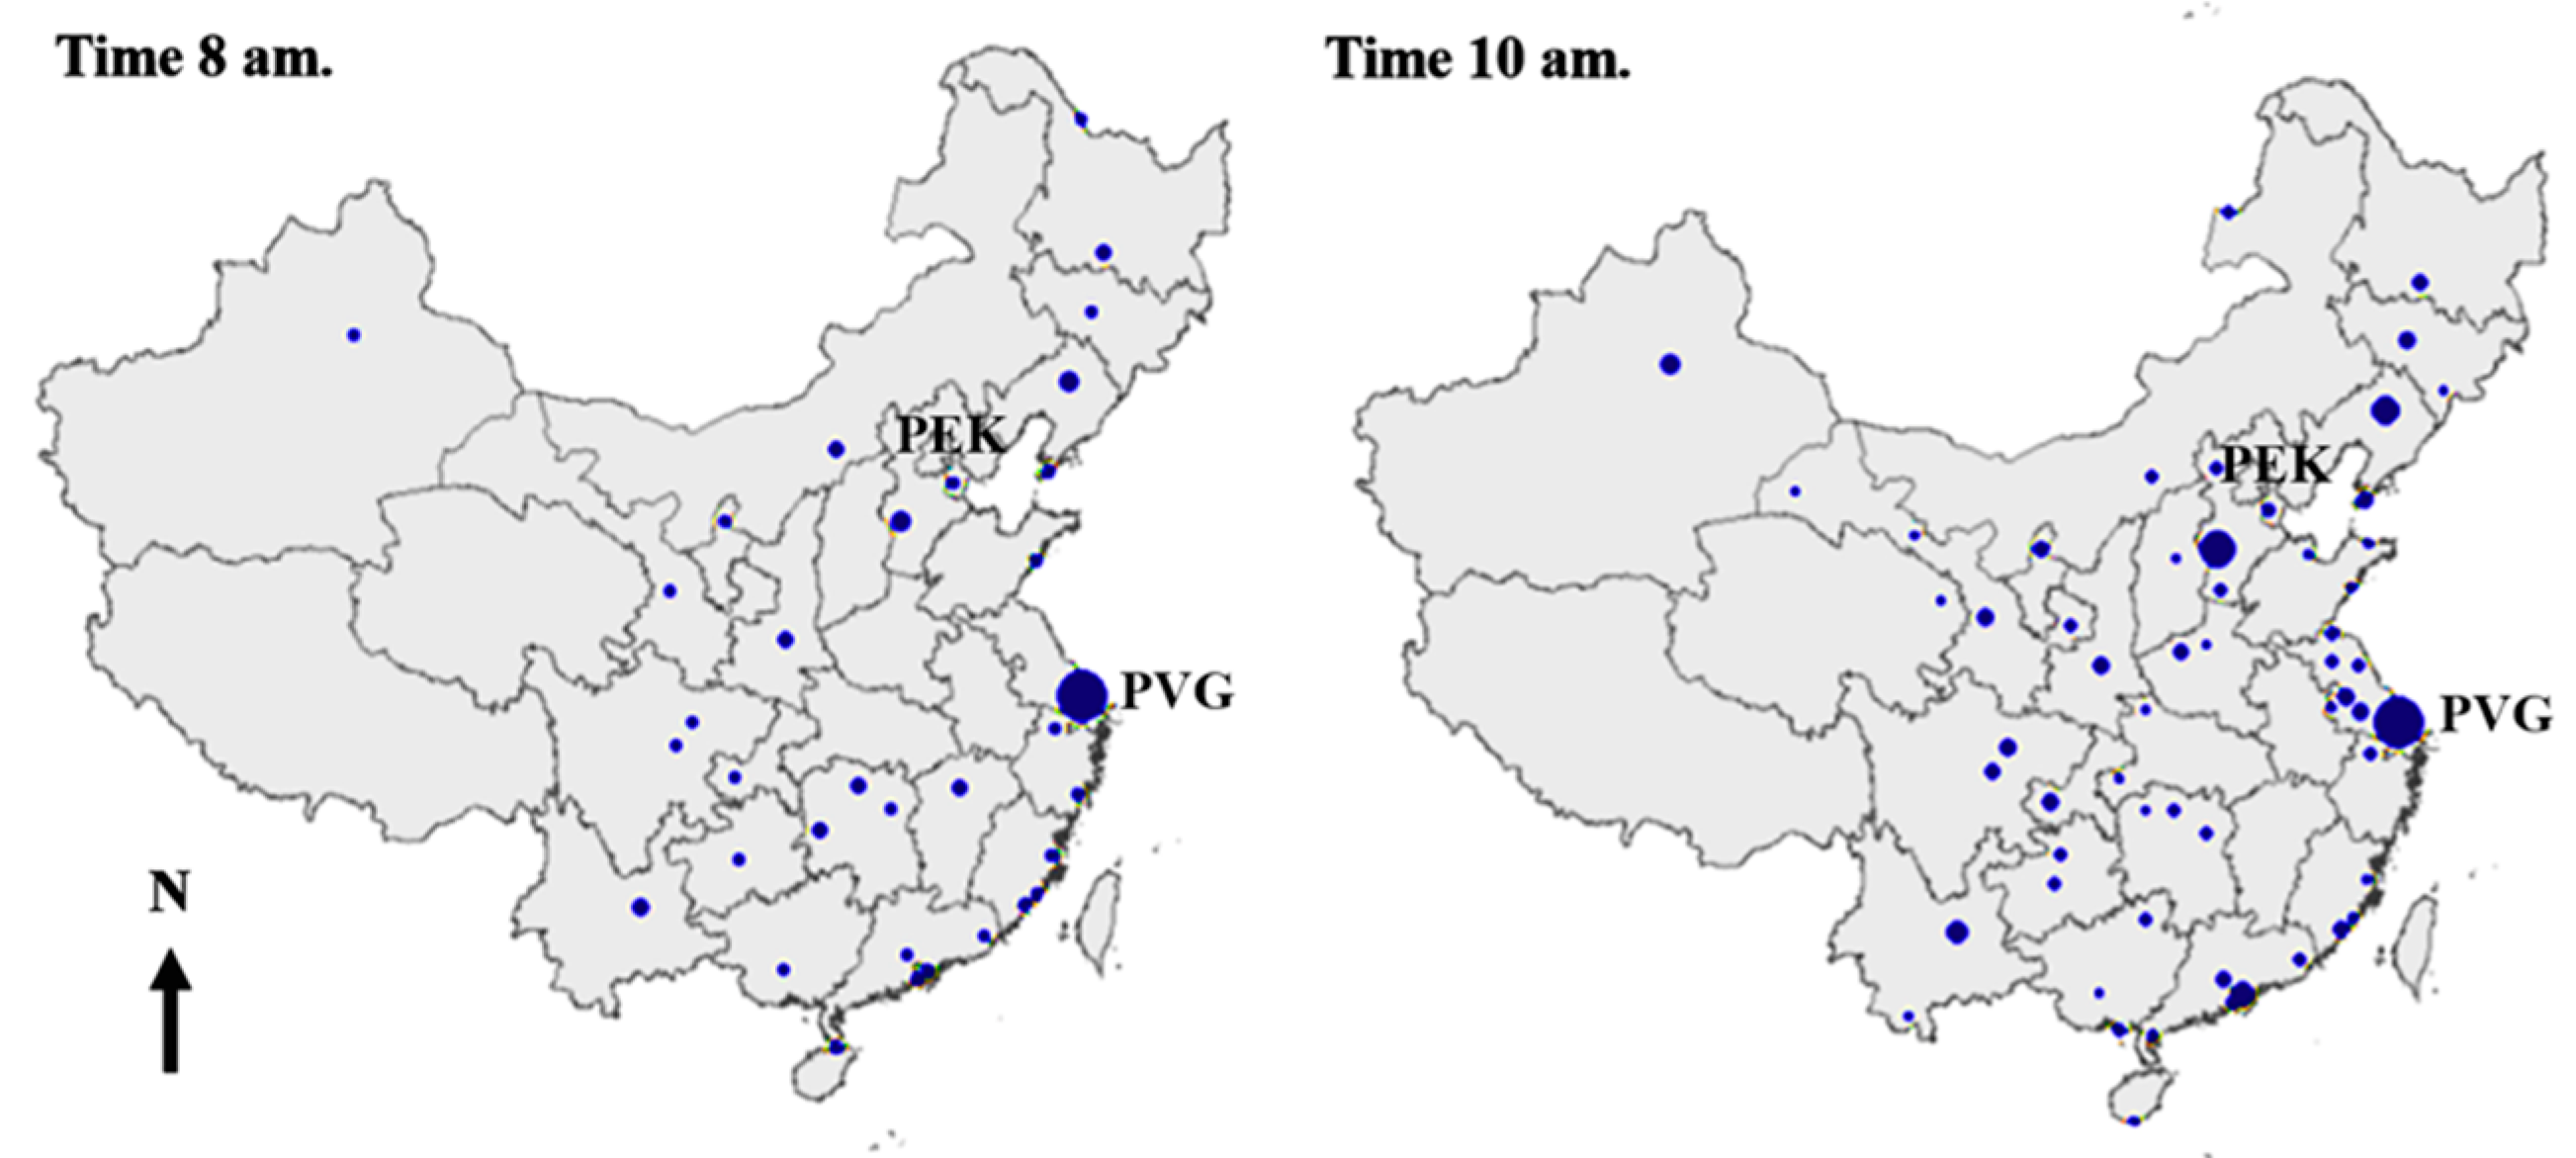
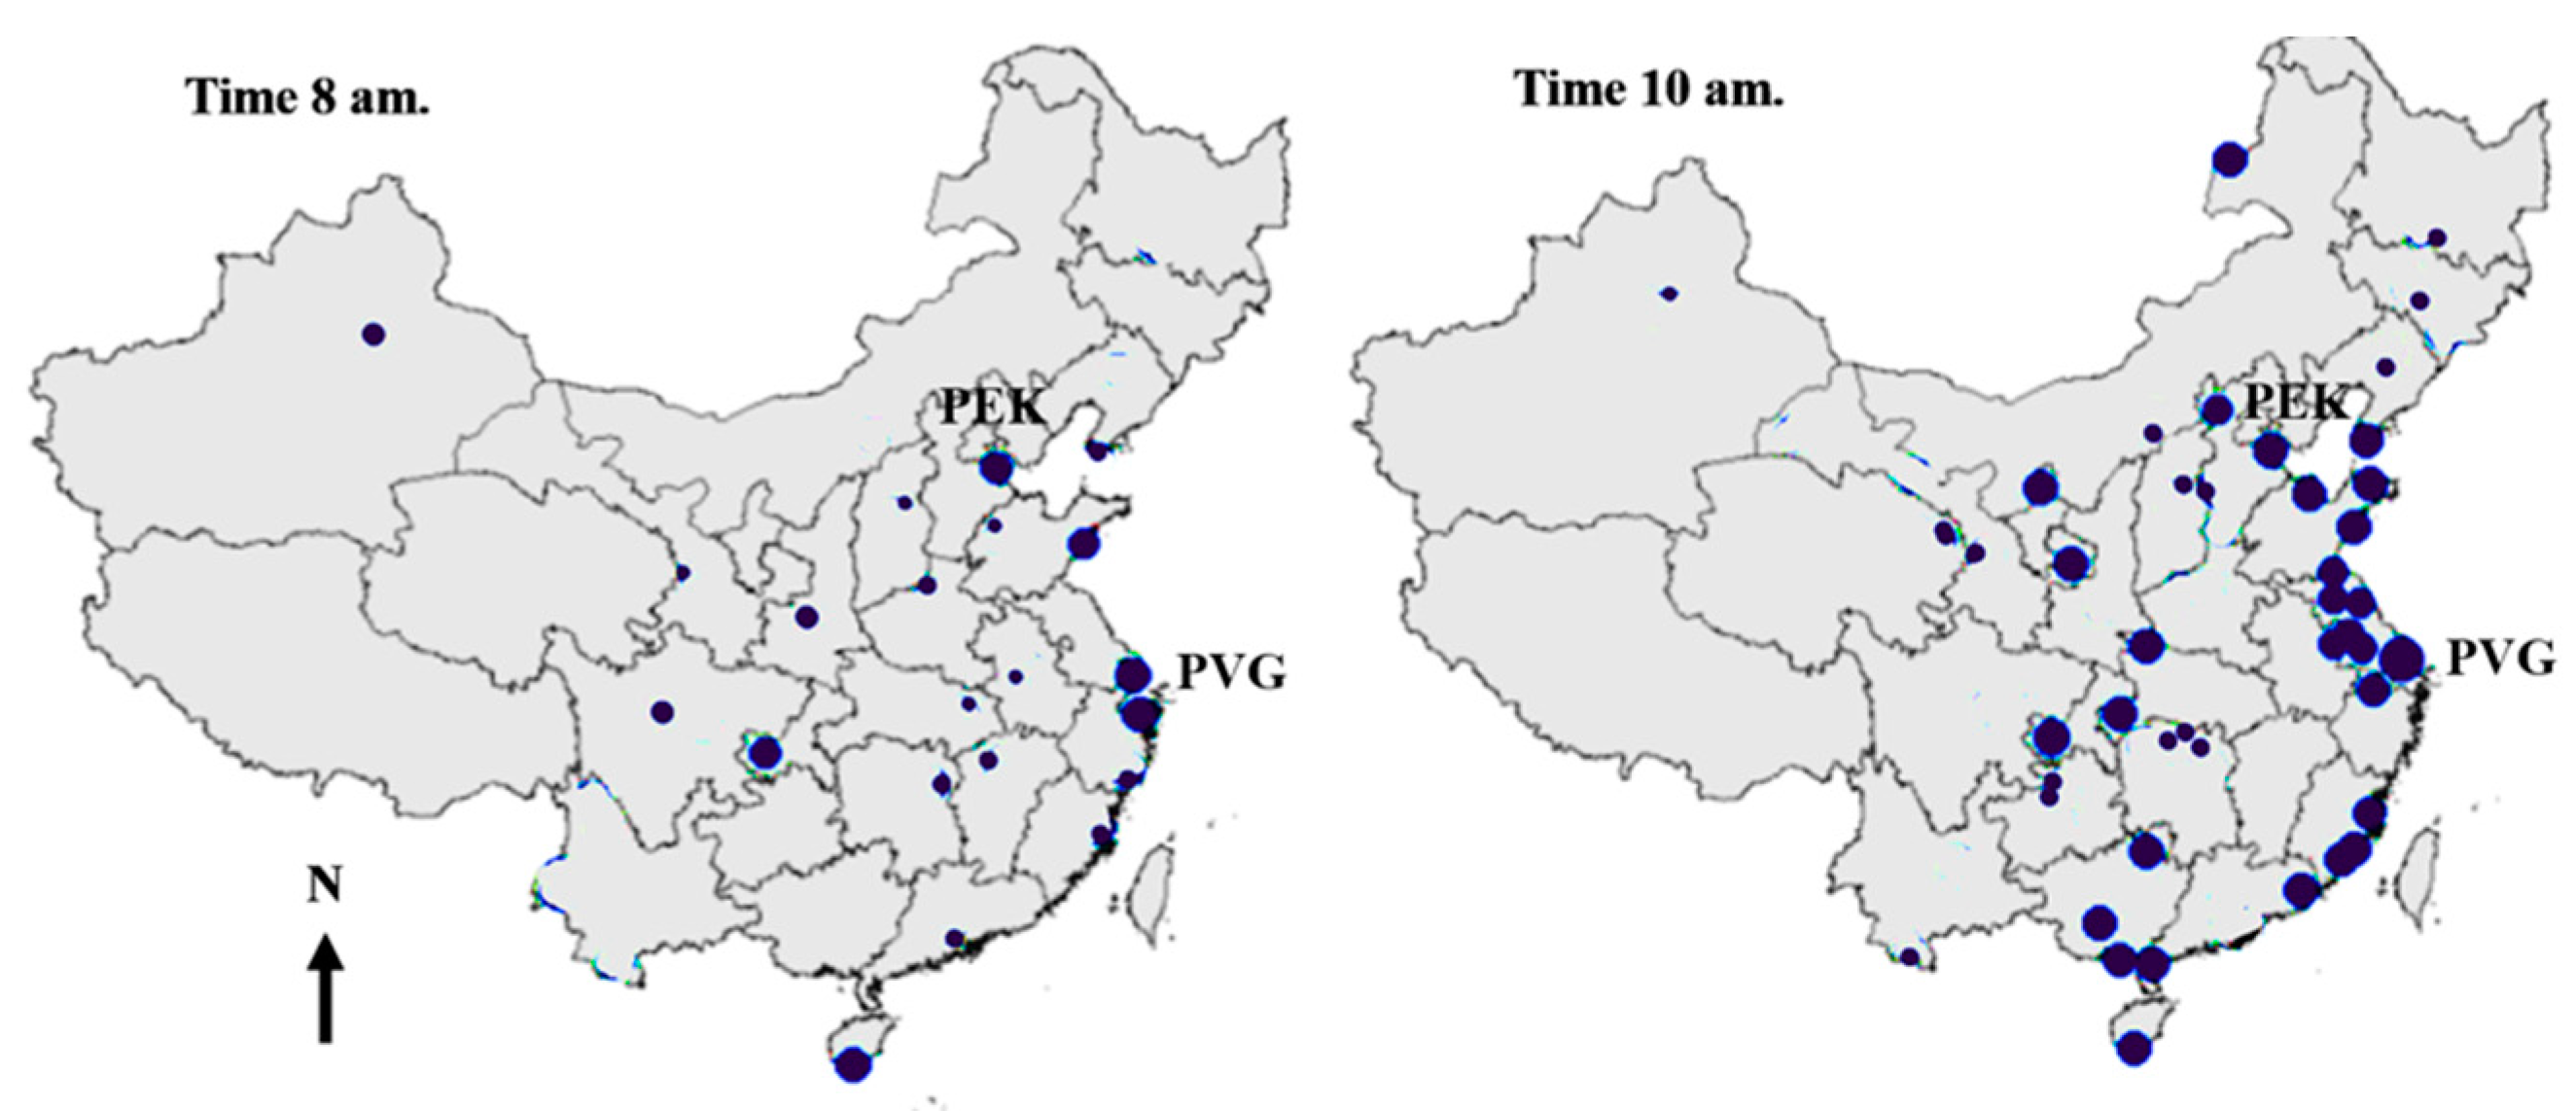
The delay propagation processes of both two airlines from 8 a.m. to 10 a.m. are specified in Figure 8 and Figure 9. The size of the nodes presents the quantity of delayed flights. It can be seen that most of the delayed flights in the two airline networks are concentrated in PVG due to the morning peak hour (8 a.m.). However, two hours later, more delayed flights in MU network are propagating to PEK Airport, which is another major base of MU Airline. The rate of infected flights in other airports is not evidently increased. While in the network of 9C, delayed flights scatter to more airports and the rate of infected flights are almost equally distributed in hub and secondary hub airports.
This can be explained by the different network structures of the two airlines. For the traditional MU Airline, a large number of flights are concentrated on the edges between the base airports in the morning. Therefore, delayed flights are restrained between these hub airports and are less likely to spread. By contrast, for the low-cost 9C Airline, because of its dense network structure, flights are scattered to more airports in the network, which enable delays to propagate more easily through the network.

4.3. Controlling Delay

Scheduled buffer time plays an important role in absorbing and reducing primary and subsequent propagated delays for airlines. As stated earlier, the obvious “flight bank” in the morning in Figure 3 indicates that propagated delay has a greater impact on morning flights, especially on the first affected flight leg.
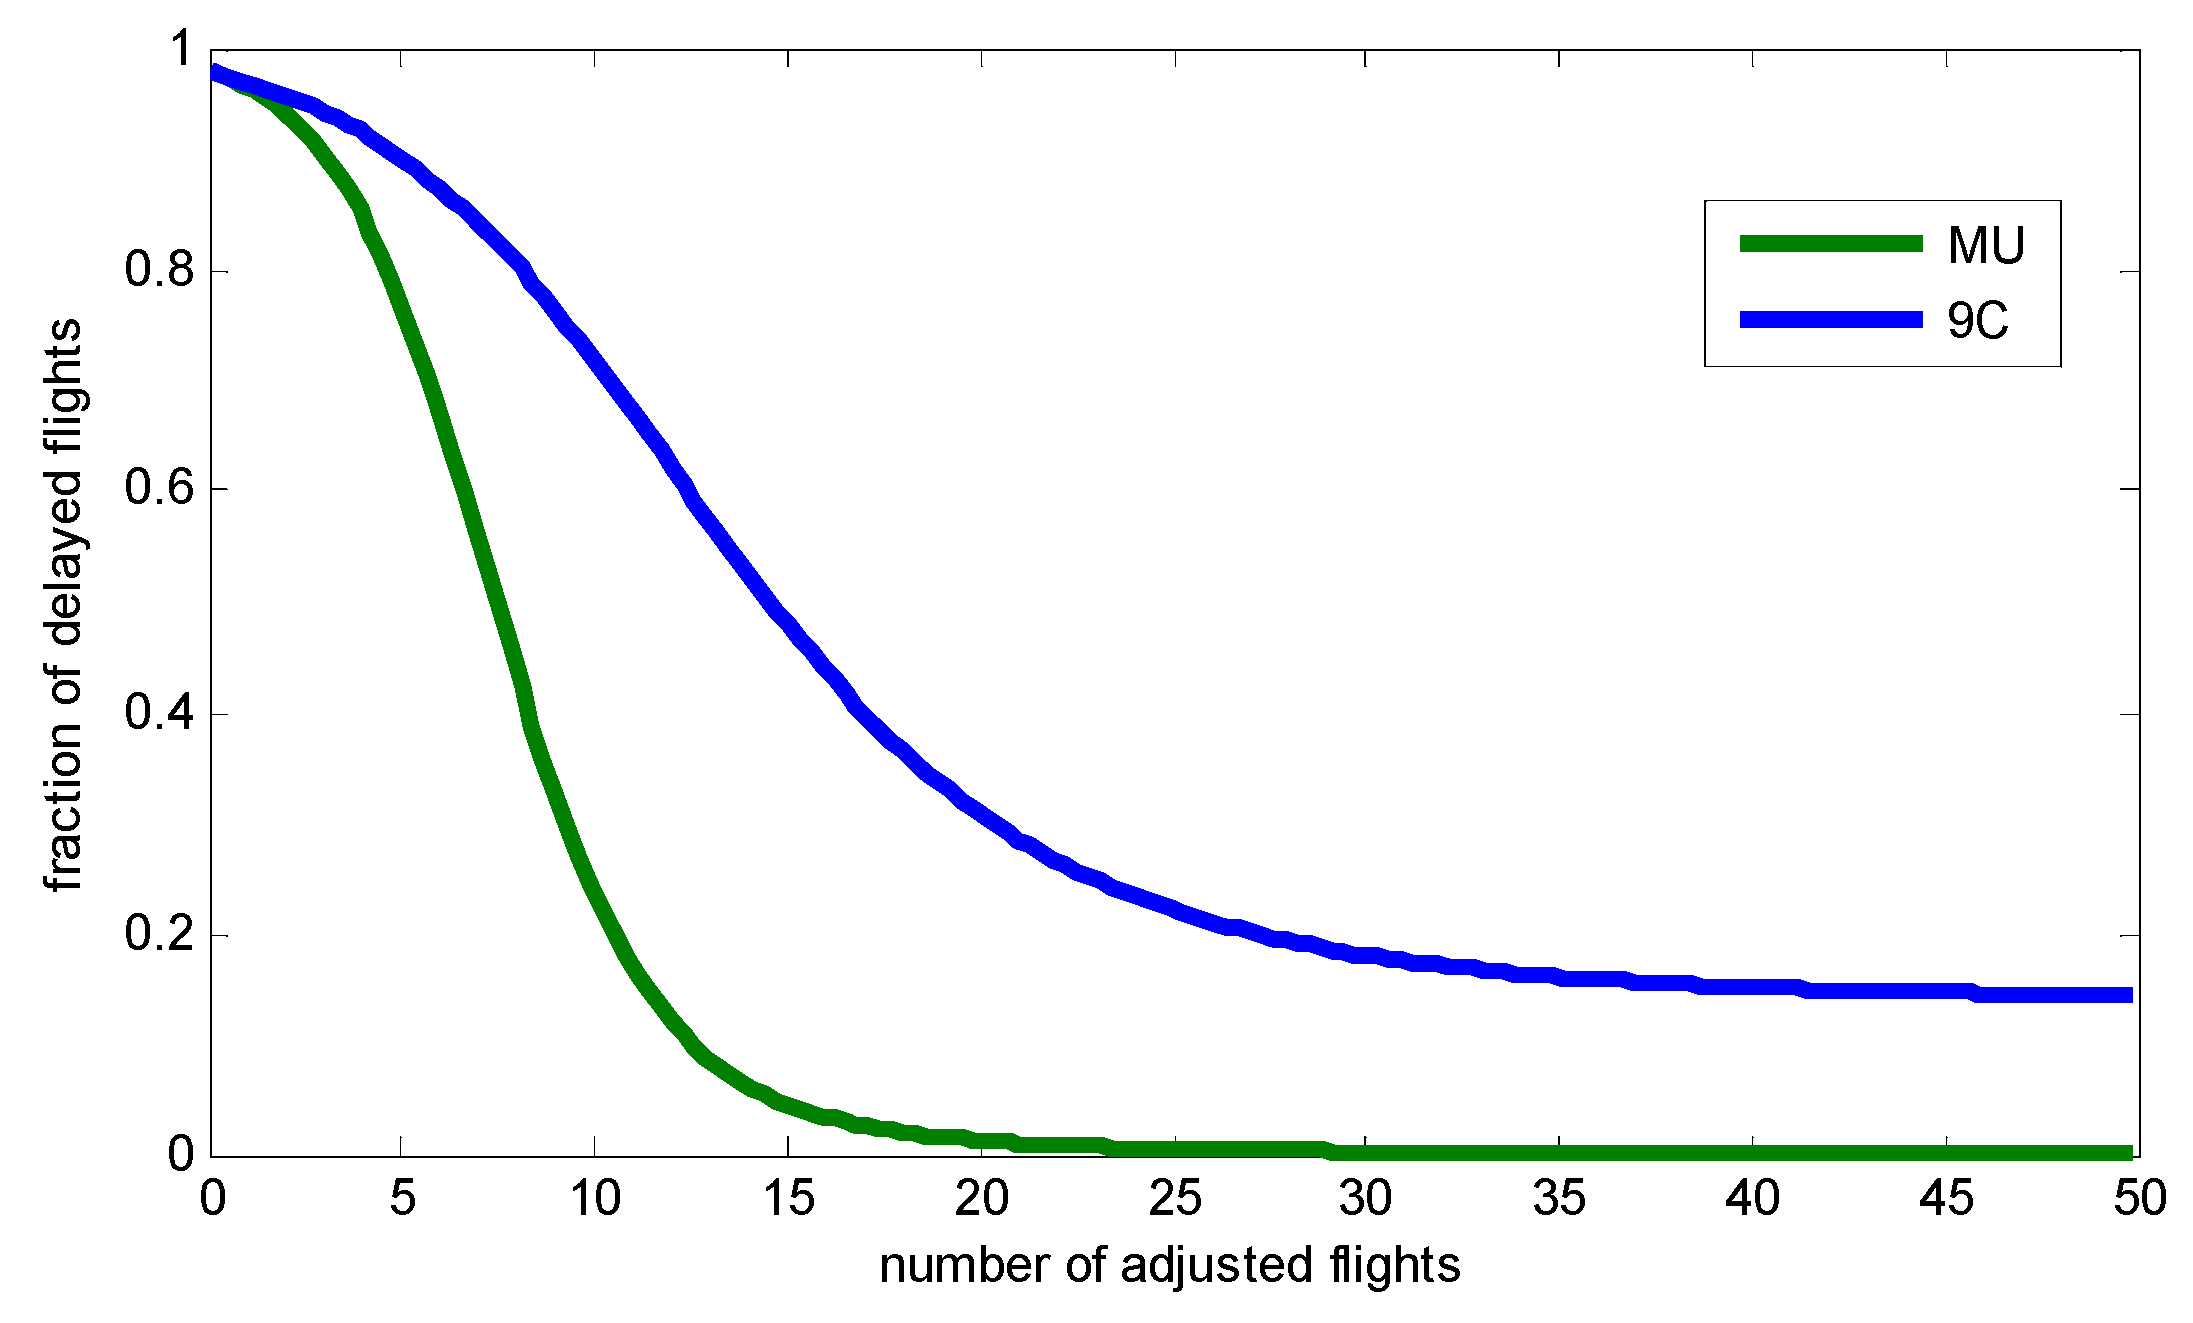
In this calculation, we increased the buffer time of departure flights in the initial departure airport (PVG) by 10% to protect these flights from delays. As shown in Figure 10, the MU Airline network experiences a rapid decrease in the I ( t ) curve when more flights were initially protected. However, the 9C Airline network displays a smoother change. In other words, more delayed flights should be protected in the 9C Airline network to improve the on-time performance of the entire network.
We also increased the scheduled buffer time of the first delayed flight leg to decrease its primary propagated delays. This is considered to be an effective way to restrain delay propagation.
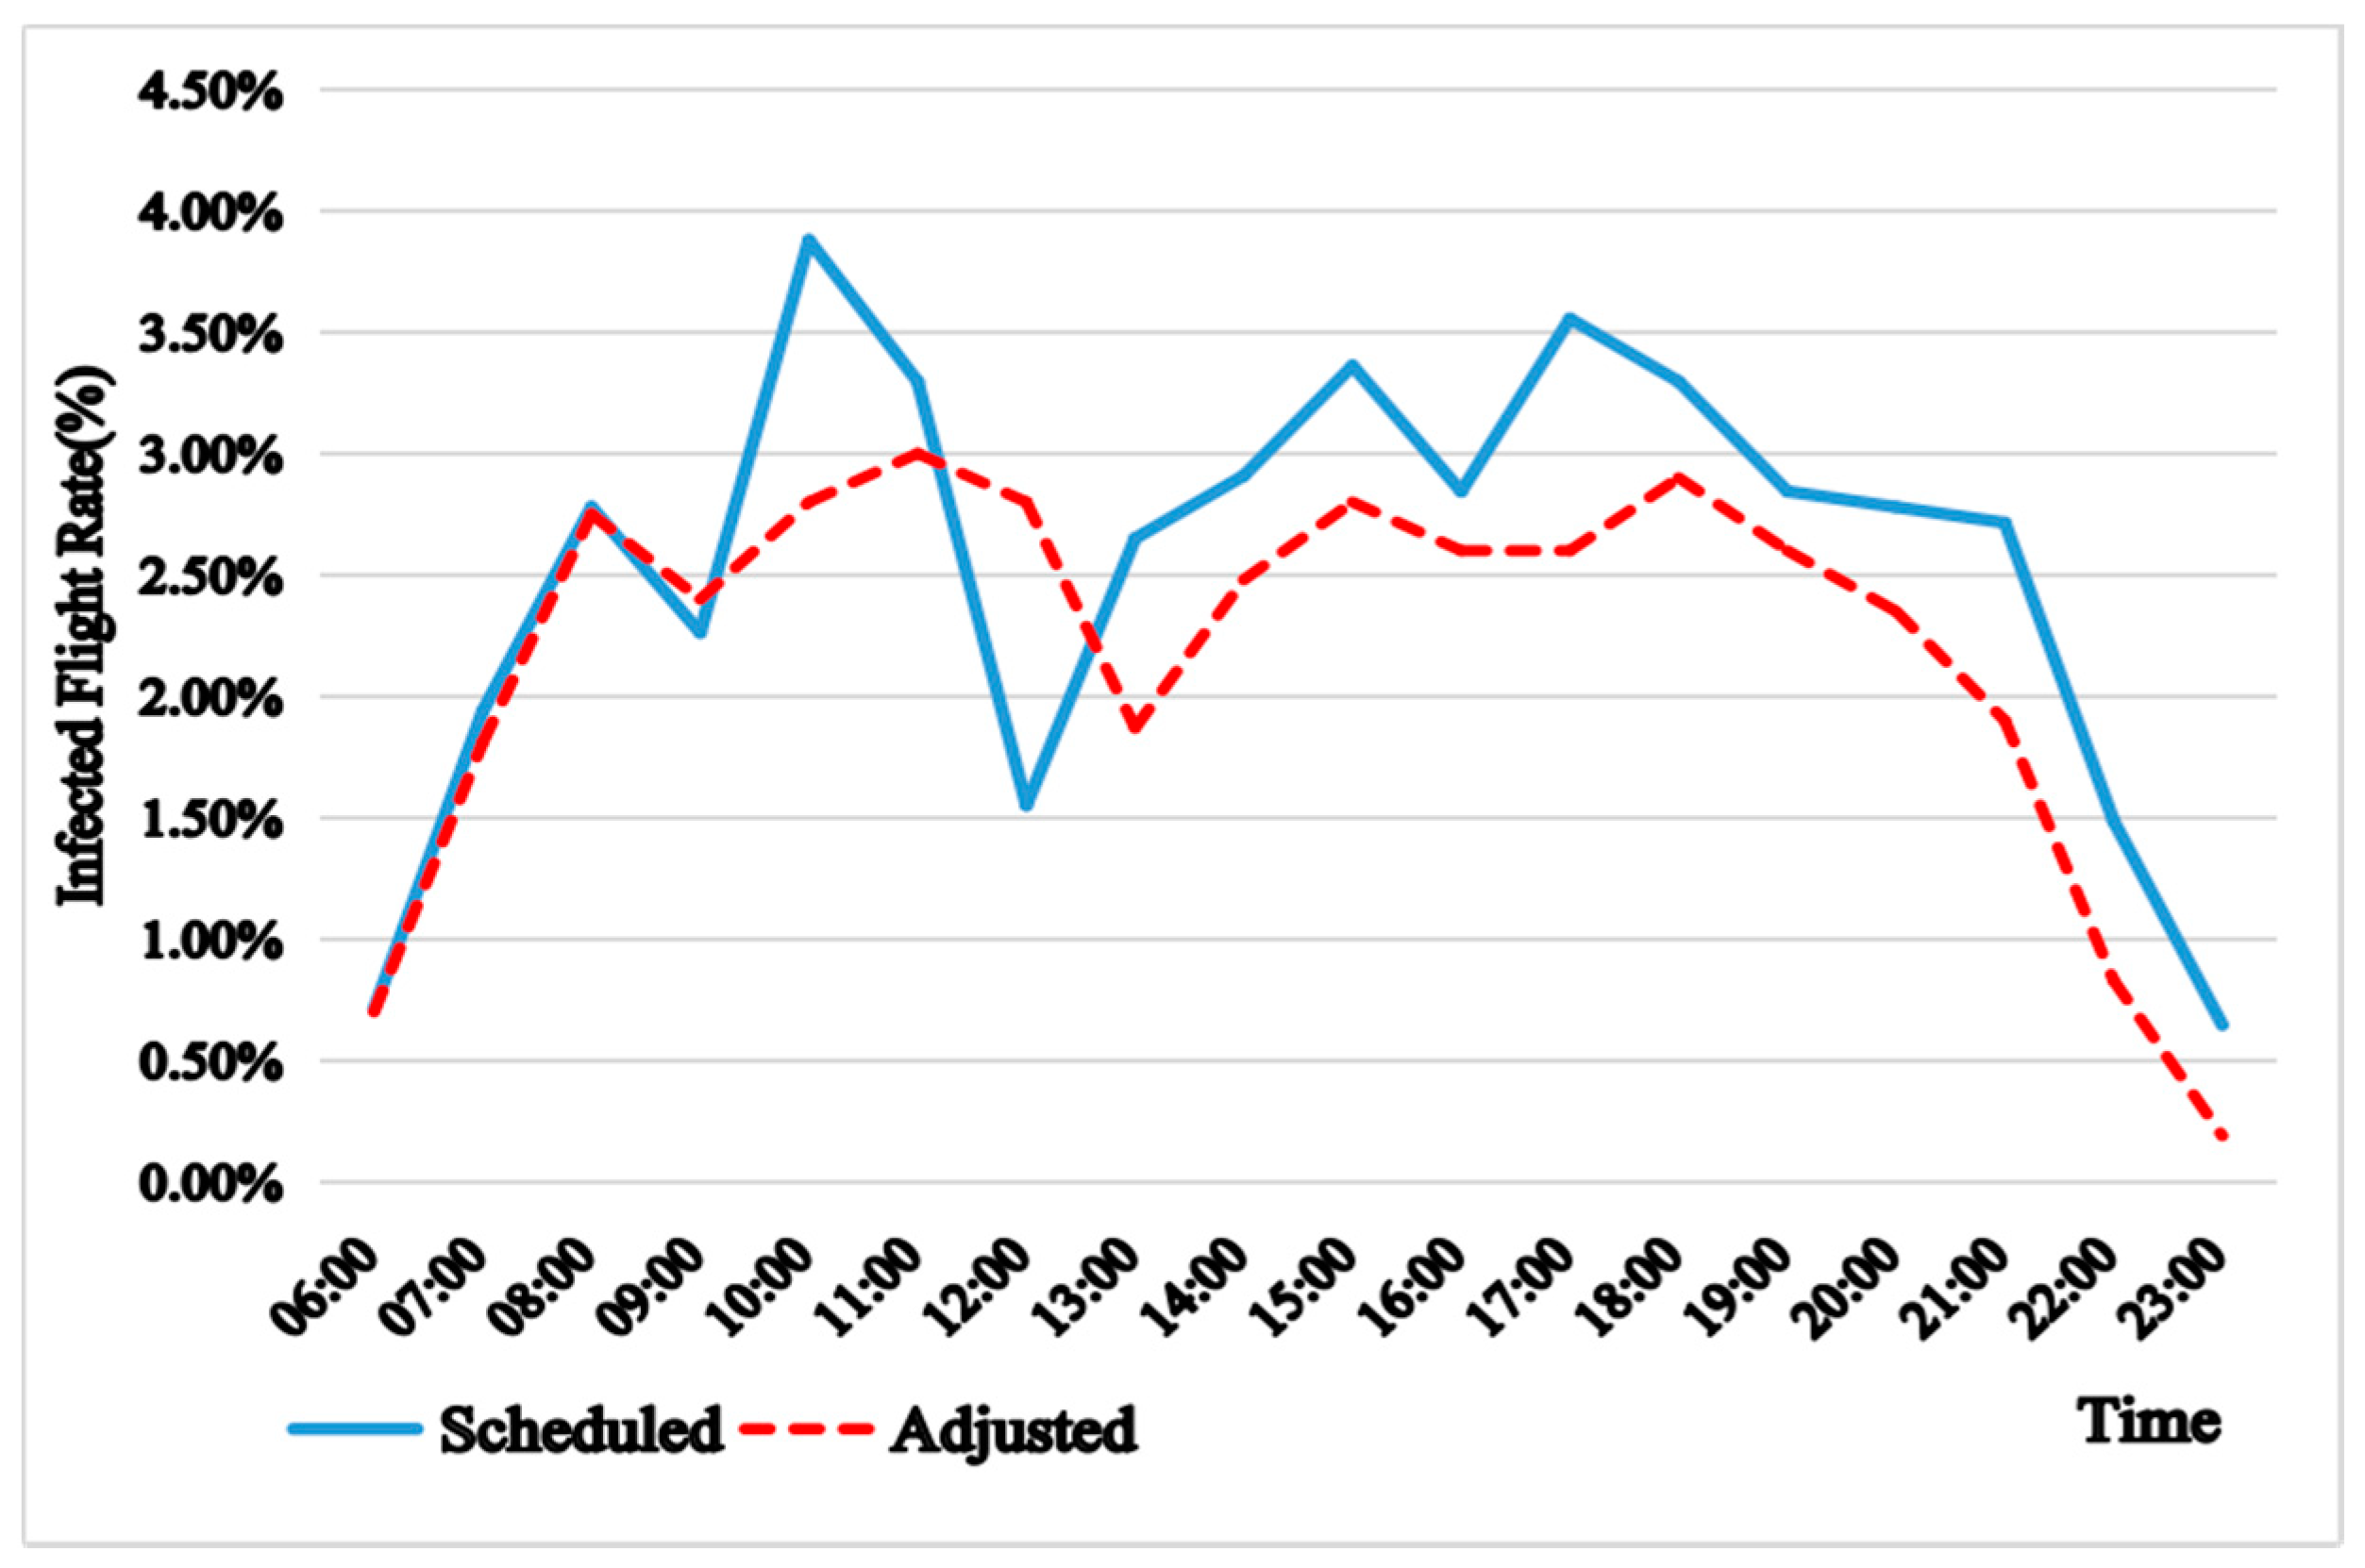
In Figure 11, the first leg of all subsequent flight arrivals at PVG was scheduled with 10% buffer time. Firstly, for the “adjusted” curve and the “scheduled” curve, delay profiles coincide during the early part of the day until roughly 10:00. From then on, however, the adjusted delay shifts noticeably to the right compared to the scheduled delay. As a result of more scheduled buffer time on the first flight leg, primary propagated delays were reduced. Consequently, the number of affected morning flights was reduced, which in turn reduced the overall rate of delayed flights, especially towards the end of the day, where most of the peaks were “evened out” and below the scheduled curve.

5. Conclusions

Flight delays, in general, have a broad consequence for both airports and airlines regarding performance and time/monetary loss, and even the loss of passenger loyalty in the long run. When an aircraft arrives late at its destination, the delayed inbound flight may not only propagate the delay to the next flight leg but also affect other flights within the network through shared resources. Analysing and reducing the propagation effects of flight delays are of high importance for airport operation, airline management and flight control. A better understanding of the delay propagation on a network scale is needed.
In such a circumstance, this paper models the processes and characteristics of flight delay propagation in air transport networks and identifies the factors which amplify or mitigate delay propagation. The FSIS model was developed based on the mechanisms of epidemic spreading from the original SIS model. The FSIS model adapts the spreading rules from the SIS model and presents the probability of delay propagation to describe flight delay propagation in an air transport network. A translog model was constructed to investigate the probability of delay propagation, and to examine how the infectious delayed flight is impacted by different airports and routes. Using actual flight data of airlines, the performance of the model was examined. Simulation results show a reliable approximation of delay propagation, and also provide useful insights into controlling flight delay.
It is found that delay propagation probabilities vary across routes and is related to the flight movement of airports, route distances, scheduled buffer times, and propagated delay time. Morning flights are more sensitive to primary propagated delays compared to afternoon flights. Thus, scheduling longer buffer time on the first sequential flight leg is an effective way to restrain delay propagation in the entire network.
Moreover, the network connectivity is found a significant factor. Delayed flights disperse to more edges (thus reaching more airports) resulting in more delayed flights in the whole network compared to those concentrated on fewer edges. Thus, lower network connectivity leads to more flights/airports being protected but lowers aircraft utilisation.
In addition, the effect of flight movement is opposite to the effect of scheduled buffer time on flight delays. Buffer time has a greater impact on smaller airports, whereas flight movement has a greater impact on larger airports. This means in some secondary airports with abundant facilities and sufficient resources, traffic can be increased without leading to a large flight delay. On the other hand, the flight delay situation is overestimated in busy airports, which leads to a longer scheduled buffer time. Therefore, buffer time should be shortened properly to maximize aircraft utilization.
The FSIS model proposed in this paper can provide many insights into the network-induced delay propagation considering the impact of airport and route characteristics. The model is generalizable to other cases. As flight delay is a worldwide problem, the methodology and conclusions obtained from this paper may also benefit to other regions and airlines with similar situations. It should be noted that the networks considered in this study are static. However, air transportation networks are evolving over a long timescale. Different network configurations can lead to different networks properties, therefore influencing the characteristics of delay propagation. To study how network evolution impacts on flight delay propagation, more research is necessary to further investigate flight delay propagation dynamically.

Supplementary Materials

The numeric data used to support the findings of this study are available from author Haoyu Zhang (Email: [email protected]) upon request. The data sheets are saved in EXCEL which is collected from the historical data on website: https://zh.flightaware.com.

Author Contributions

H.Z. wrote the manuscript; H.Z., W.W. and F.W. provided the case study and idea; and H.Z., W.W., T.F. and F.W. revised the manuscript.

Funding

Financial support from the National Natural Science Foundation of China (71201081, 71731001) and the National Key Research and Development Project (2018YFB1601200) are gratefully acknowledged. The research leading to these results received funding from the Estonian Research Council (PUT PRG306).

Conflicts of Interest

The authors declare no conflict of interest.

References

  1. Xiong, C.; Beckmann, V.; Tan, R. Effects of Infrastructure on Land Use and Land Cover Change (LUCC): The Case of Hangzhou International Airport, China. Sustainability 2018, 10, 2013. [Google Scholar] [CrossRef]
  2. IATA Annual Report. Available online: https://www.iata.org/publications/economics/pages/index.aspx (accessed on 15 January 2017).
  3. Wu, W.; Zhang, H.; Wei, W. Optimal Design of Hub-and-Spoke Networks with Access to Regional Hub Airports: A Case for the Chinese Regional Airport System. Transportmetrica A. 2018, 1–28. [Google Scholar] [CrossRef]
  4. Chen, Y.; Yu, J.; Tsai, S.B.; Zhu, J. An Empirical Study on the Indirect Impact of Flight Delay on China’s Economy. Sustainability 2018, 10, 357. [Google Scholar] [CrossRef]
  5. Schultz, M.; Schmidt, M. Advancements in Passenger Processes at Airports from Aircraft Perspective. Sustainability 2018, 10, 3877. [Google Scholar] [CrossRef]
  6. Kafle, N.; Zou, B. Modeling flight delay propagation: A new analytical-econometric approach. Transp. Res. Part B Methodol. 2016, 93, 520–542. [Google Scholar] [CrossRef]
  7. Sternberg, A.; Carvalho, D.; Murta, L.; Soares, J.; Ogasawara, E. An analysis of Brazilian flight delays based on frequent patterns. Transp. Res. Part E Logist. Transp. Rev. 2016, 95, 282–298. [Google Scholar] [CrossRef]
  8. Zou, B.; Hansen, M. Flight delays, capacity investment and social welfare under air transport supply-demand equilibrium. Transp. Res. Part A Policy Pract. 2012, 46, 965–980. [Google Scholar] [CrossRef]
  9. Wu, W.; Wu, C.L.; Feng, T.; Zhang, H.; Qiu, S. Comparative Analysis on Propagation Effects of Flight Delays: A Case Study of China Airline. J. Adv. Transport. 2018, 1915, 1–10. [Google Scholar] [CrossRef]
  10. Yan, S.; Wang, C. The planning of aircraft routes and flight frequencies in an airline network operations. J. Adv. Transport. 2010, 35, 33–46. [Google Scholar] [CrossRef]
  11. Bolić, T.; Castelli, L.; Corolli, L.; Rigonat, D. Reducing ATFM delays through strategic flight planning. Transp. Res. Part E Logist. Transp. Rev. 2017, 98, 42–59. [Google Scholar] [CrossRef] [Green Version]
  12. Kondo, A. Delay Propagation and Multiplier. In Proceedings of the Forum in its Series 51st Annual Transportation Research Forum, Arlington, Virginia, 11–13 March 2010. [Google Scholar]
  13. Simaiakis, I.; Pyrgiotis, N. An Analytical Queuing Model of Airport Departure Processes for Taxi Out Time Prediction. In Proceedings of the 10th AIAA Aviation Technology, Integration, and Operations (ATIO) Conference, Fort Worth, TX, USA, 13–15 September 2010. [Google Scholar]
  14. AhmadBeygi, S.; Cohn, A.; Lapp, M. Decreasing airline delay propagation by re-allocating scheduled slack. IIE Trans. 2010, 42, 478–489. [Google Scholar] [CrossRef] [Green Version]
  15. Takeichi, N. Nominal flight time optimization for arrival time scheduling through estimation/resolution of delay accumulation. Transp. Res. Part C Emerg. Technol. 2017, 77, 433–443. [Google Scholar] [CrossRef]
  16. Montlaur, A.; Delgado, L. Flight and passenger delay assignment optimization strategies. Transp. Res. Part C Emerg. Technol. 2017, 81, 99–117. [Google Scholar] [CrossRef] [Green Version]
  17. Pyrgiotis, N.; Malone, K.M.; Odoni, A. Modelling delay propagation within an airport network. Transp. Res. Part C Emerg. Technol. 2013, 27, 60–75. [Google Scholar] [CrossRef]
  18. Baspinar, B.; Ure, N.K.; Koyuncu, E.; Inalhan, G. Analysis of Delay Characteristics of European Air Traffic through a Data-Driven Airport-Centric Queuing Network Model. IFAC Papers Online 2016, 49, 359–364. [Google Scholar] [CrossRef]
  19. Jetzki, M. The Propagation of Air Transport Delays in Europe. Ph.D. Thesis, RWTH Aachen University, Aachen, Germany, 2009. [Google Scholar]
  20. Marín, A.G. Airport Taxi Planning: Lagrangian Decomposition. J. Adv. Transport. 2013, 47, 461–474. [Google Scholar] [CrossRef]
  21. Dietz, K.; Heesterbeek, J. Daniel Bernoulli’s epidemiological model revisited. Math. Biosci. 2002, 180, 1–21. [Google Scholar] [CrossRef]
  22. Nicolas, B. A Short History of Mathematical Population Dynamics; Springer: London, UK, 2011; Volume 4, pp. 820–821. [Google Scholar]
  23. Asfe, M.K.; Zehi, M.J.; Tash, M.N.S.; Yaghoubi, N.M. Ranking different factors influencing flight delay. Manag. Sci. Lett. 2014, 4, 1397–1400. [Google Scholar] [CrossRef]
  24. Zámková, M.; Prokop, M. The Evaluation of Factors Influencing Flights Delay at Czech International Airports. Acta Univ. Agric. Silvic. Mendel. Brun. 2015, 63, 2187–2196. [Google Scholar] [CrossRef]
  25. Baspinar, B.; Koyuncu, E. A Data-Driven Air Transportation Delay Propagation Model Using Epidemic Process Models. Int. J. Aerosp. Eng. 2016, 2016, 1–11. [Google Scholar] [CrossRef]
  26. Nowzari, C.; Preciado, V.M.; Pappas, G. Analysis and Control of Epidemics: A Survey of Spreading Processes on Complex Networks. IEEE Control Syst. 2016, 36, 26–46. [Google Scholar] [Green Version]
  27. Yang, X.H.; Wang, B.; Chen, S.Y.; Wang, W.L. Epidemic dynamics behavior in some bus transport networks. Phys. A Stat. Mech. Appl. 2012, 391, 917–924. [Google Scholar] [CrossRef]
  28. Lan, S.; Clarke, J.P.; Barnhart, C. Planning for Robust Airline Operations: Optimizing Aircraft Routings and Flight Departure Times to Minimize Passenger Disruptions. Transp. Sci. 2006, 40, 15–28. [Google Scholar] [CrossRef]
  29. Altunbas, Y.; Chakravarty, S. Frontier cost functions and bank efficiency. Econ. Lett. 2001, 72, 233–240. [Google Scholar] [CrossRef]
Figure 1. Cyclical epidemic processes between SIS model components S and I .
Sustainability 11 04408 g001
Figure 2. Changes in β i j t based on changes in buffer time, movement, and distance.
Sustainability 11 04408 g002
Figure 3. Comparison between actual and calculated rates of flight delay using the flight-based susceptible-infected-susceptible (FSIS) model.
Sustainability 11 04408 g003
Figure 4. Delayed flight profiles under increasing flight movement and buffer time.
Sustainability 11 04408 g004
Figure 5. Actual and simulated delayed flight rate of China Eastern Airline (MU Airline) at Qingdao Liuting International Airport (TAO) and Shanghai Pudong International Airport (PVG).
Sustainability 11 04408 g005
Figure 6. Network structures of Airlines MU and 9C.
Sustainability 11 04408 g006
Figure 7. Delayed and non-delayed flight rate profiles based on the airline networks of MU and 9C.
Sustainability 11 04408 g007
Figure 8. Delay propagation process in MU Airline network.
Sustainability 11 04408 g008
Figure 9. Delay propagation process in 9C Airline network.
Sustainability 11 04408 g009
Figure 10. Delayed flight rates with more adjusted flights.
Sustainability 11 04408 g010
Figure 11. Infected flight rates under scheduled and adjusted buffer time.
Sustainability 11 04408 g011
Table 1. Estimation results for delay propagation.
Explanatory VariableInfection Rate Function
Estimated Coefficientst-Statistic
Movement1.8931.53
Distance−0.32−10.25
Buffer time−1.76−44.37
Propagated delay1.8120.03
Movement * Movement0.459.22
Movement * Distance1.479.57
Movement * Buffer time−1.06−11.63
Movement * Propagated delay1.646.01
Distance * Distance0.2411.09
Distance * Buffer time−5.14−12.44
Distance * Propagated delay−1.39−6.10
Buffer time * Buffer time−0.72−4.97
Buffer time * Propagated delay−2.86−8.04
Propagated delay * Propagated delay1.951.05
Note: All variables measure deviations of their logarithms from their sample mean logarithms. For example, “Movement” represents the coefficient of ln ( M o v e m e n t i j t ) ln ( M o v e m e n t ) ¯ in Equation (6).