Article

Analysis of the Wind Environment to Improve the Thermal Comfort in the Colonnade Space of a Qilou Street Based on the Relative Warmth Index

1
College of Civil Engineering and Architecture, Guangxi University, Nanning 530004, China
2
Guangxi Key Laboratory of Disaster Prevention and Engineering Safety, Guangxi University, Nanning 530004, China
*
Author to whom correspondence should be addressed.
Sustainability 2019, 11(16), 4402; https://doi.org/10.3390/su11164402
Submission received: 23 July 2019 / Revised: 10 August 2019 / Accepted: 12 August 2019 / Published: 14 August 2019
(This article belongs to the Section Sustainable Urban and Rural Development)

Abstract

:
By analyzing measurements of the thermal environment of a qilou (arcade building) street, this study used the relative warmth index (RWI) to evaluate the thermal comfort in the colonnade space of a qilou. The analysis of the influence of the temperature, humidity, and wind speed on the thermal comfort in the colonnade space of a qilou street was conducted, and it was shown that the ambient wind speed had a strong influence on the RWI, indicating that a proper increase in the wind speed positively affected thermal comfort in this space. Then, this study also analyzed the effects of different forms of qilou streets on the wind environment by employing computational fluid dynamics (CFD) and summarized the architectural design measures that can improve the thermal comfort, including adopting back chamfer, street gaps, and the appropriate sizing of building components. It was concluded that the wind environment of a qilou could be optimized in terms of these measures, and the average RWI value decreased by 0.06, effectively enhancing the thermal comfort in the colonnade space. The research findings are applicable toward designing a thermally comfortable environment in the transitional space.

1. Introduction

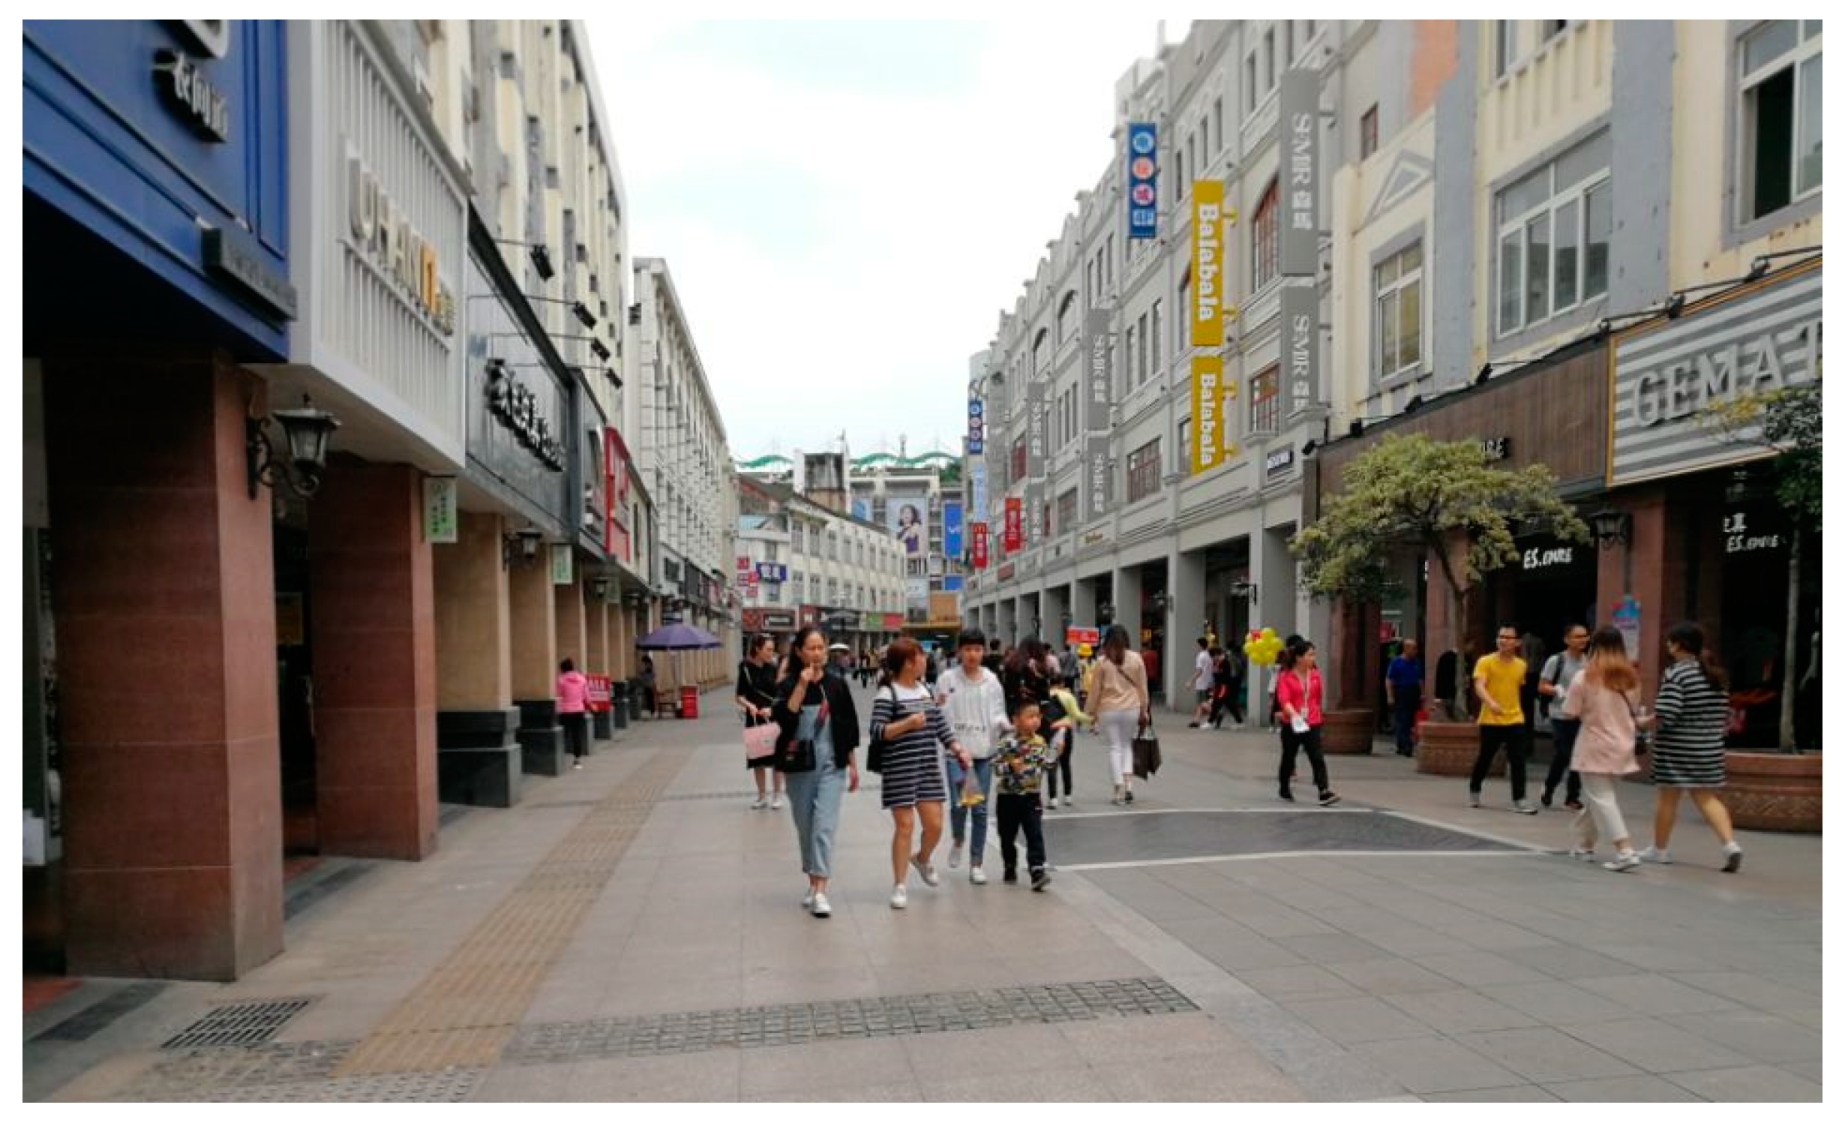
The early prototype of the qilou was the arcade building. As an urban house model, this design first appeared in Singapore and Hong Kong. In 1822, Sir Stamford Raffles launched the Urban Development Program in Singapore. To meet the needs of pedestrians and for a uniform street appearance, a five-foot wide recess was developed for walking that was promoted in the Chinese business district. In 1878, the Hong Kong Government released qilou regulations in the hope of improving overcrowded residential situations. This style soon became the main form of urban commercial buildings. In the early 20th century, the qilou became the main form of building in Chinese neighborhoods in Hong Kong and Southeast Asia. A qilou combines the characteristics of ancient Chinese traditional veranda architecture and Western classical architecture. A qilou street, by definition, is a street connected by multiple qilous. In China, qilou streets are largely located in the southern coastal cities. This design is a typical architectural form developed against the background of commercial development.
The prominent characteristic of qilou commercial streets is the colonnade. The whole street is connected by colonnades, which exhibits an integrated appearance. The colonnade is a transitional space in the architecture. Chun et al. [1] defined this type of transitional space as the space between the outdoors and indoors. The thermal environment of the transitional space is generally affected by natural ventilation. Because of the effect of heat transfer and mass transfer, the thermal environments of both indoor and outdoor spaces have an impact on this space and present a certain pattern. Unlike an outdoor space, a transitional space is enclosed to a certain extent, which reduces the impact of external factors on the thermal environment of the transitional space. Meanwhile, the architectural structure and spatial characteristics create a unique environment. The transitional space plays a connecting role between the indoor and outdoor spaces in the thermal environment, that is, this space is affected by the outdoor environmental factors, and in turn, influences the indoor spaces.
Because the thermal environment of the transitional space is different from that of the indoor environment, the thermal comfort evaluation of the transitional space is also different from that of the indoor space, thus attracting the interest of researchers. Gagge et al. [2] analyzed human thermal sensation in the transitional space and found that the variation of human thermal sensation exhibited leads and lags with the transformation of the transition space. Hwang et al. [3] studied the relationship between the lingering behavior and thermal sensation of people in the transitional space and concluded that there was a significant difference between the thermal comfort sensations of people who stayed in the transition space for a long time and those who visited the space temporarily, verifying the conclusion of Gagge from another perspective. To reveal the differences between the thermal environments of different transitional spaces, Chun et al. [1] measured the thermal comfort index of three transitional spaces, including a hotel lobby, corridor, and pavilion. Based on an analysis of the predicted mean vote (PMV) and standard effective temperature (SET) data measured, these researchers concluded that there was an obvious deviation when the PMV indicator was applied to describe the thermal comfort in the transitional space, indicating that Fanger’s predicted mean vote and percentage people dissatisfied (PMV-PPD) model is not adequate for the evaluation of the thermal environment of a transitional space [4]. Therefore, the American Society of Heating, Refrigerating, and Air-Conditioning Engineers (ASHRAE) [5] proposed two indicators, the relative warmth index (RWI) and the heat deficit rate (HDR), for evaluating the thermal comfort in transitional spaces such as subway platforms and station halls.
A series of studies have shown that the RWI and HDR are suitable for evaluating the thermal environment of transitional spaces. For example, in terms of a subway station environment, Abbaspour et al. [6] used the RWI to analyze and evaluate the thermal environment of Tehran Metro stations and determined the acceptable range of thermal environment parameters. Jiang et al. [7] used the HDR to analyze the design temperature of winter HVAC (Heating Ventilation and Air Conditioning) equipment in the waiting areas of subway stations in four Chinese cities and obtained the corresponding temperature ranges. Liu et al. [8] used the RWI to describe the changes in the thermal sensations of subway passengers and consequently found effective measures to improve thermal comfort and reduce the energy consumption of air-conditioning systems in subway stations. Wang et al. [9] employed both RWI and HDR in transitional areas to evaluate the thermal comfort level under the air-condition airflow and the coupling airflow, and found that the comfort level under the air-condition airflow is more favorable than that of the coupling airflow. Then, they [10] applied RWI to predict the comfort level with dynamic coupling airflows in the subway, and concluded that wind speed can be increased to compensate the supplying air temperature increasing without depressing human thermal sensations with an RWI within 0–0.15. Therefore, RWI is adopted to assess human thermal comfort level with a dynamic wind environment in transitional space. Liu et al. [11] compared and analyzed three different kinds of ventilation schemes (mixed, stratified, and air curtain) for a subway platform by using the RWI theory model, and revealed that an air curtain showed an appropriate air speed and temperature distribution, which offers a more comfortable environment.
The unique thermal environment of a qilou colonnade, which is also a transitional space, has attracted the attention of several native researchers [12,13,14]. In terms of the effects of thermal environment parameters on the thermal comfort in a qilou space, Xue et al. [15] measured and analyzed the variation of parameters, such as air temperature, relative humidity, black bulb temperature, wind speed, and solar radiation, taking the qilou streets in Quanzhou as the subject of study; these researchers found that solar radiation could directly affect the temperature and humidity and thus could influence human thermal sensations. Therefore, solar radiation was considered to be a major factor affecting the thermal comfort in a qilou area. For a specific qilou street, the wind environment is another important factor affecting the thermal environment, as has been confirmed in the research of Ma [16] and Luo [17]. Kwong et al. [18] found that airflow speed is important for enhancing thermal comfort in an urban environment in a tropical climate (Malaysia). A recent study by Wen [19] found that designing semi-open spaces, such as qilou colonnades in cities, can effectively improve the wind environment in these spaces, suggesting that the thermal environment of qilou spaces still needs further exploration.
Currently, research on the analysis and evaluation of thermal comfort in commercial qilou streets is scarce, and guidance on spatial layout based on thermal comfort is lacking. Therefore, based on the RWI, this study analyzed the influences of different qilou street styles and building scales on the thermal comfort in the colonnade space through field measurements and numerical simulations using computational fluid dynamics (CFD) software. The current study provides a reference for the quantitative analysis of the thermal environment of such a space and offers guidance and a basis for the design and construction of a thermal environment in a qilou colonnade space.

2. Field Measurements and RWI Data Analysis

2.1. Objects of Research and Measurement Results

This study took the Minsheng Road pedestrian street in Nanning, a city in southern China, as an example (Figure 1) to investigate the thermal environment of the colonnade space in this qilou street. Nanning is located to the south of the Tropic of Cancer and has a humid subtropical monsoon climate. This area has a long summer period and a short winter time, with an average annual temperature of approximately 21.6 °C. January is the coldest month in winter, with an average temperature of 12.8 °C, and July and August are the hottest months in summer, with an average temperature of 28.2 °C. The annual rainfall is 1304.2 mm, and the average relative humidity is 79%. In a typical meteorological year, the wind direction data are as follows. The predominant wind direction in spring is southeastern, with an average wind speed of 1.29 m/s; the prevailing wind direction in summer is southeastern, with an average wind speed of 1.4 m/s; the prevailing wind direction in fall is northeastern, with an average wind speed of 0.97 m/s; and the prevailing wind direction in winter is northeastern, with an average wind speed of 1.03 m/s. Local wind directions and wind speeds may deviate from the prevailing wind direction and wind speed in the area. This effect is mainly caused by changes in the airflow due to uneven heating in local areas. The wind also changes in direction and speed when flowing around barriers. Therefore, the environmental conditions near buildings also greatly impact the wind environment, producing high-rise building-induced winds and alley-induced winds. In summer, due to the hot climate, appropriate cool airflow can enhance the human sensation of thermal comfort.
To analyze the thermal environment in the colonnade space of a qilou, measurement points were designated at the east end, west end, and middle of the Minsheng Road pedestrian street. That is, the measurement points were selected in a colonnade space with a northwest-facing opening in the qilou on the south side of the street for the collection of data and comparative analysis. The variations in the environmental parameters at each point was observed to investigate the impact of the colonnade space of the qilou on the thermal comfort. The measurement points are shown in Figure 2, and the locations and detailed information of these points are given in Table 1. The pavement along the qilou colonnade and the pillar finish were dark red tile, and the wall façade was decorated with a dim color ceramic tile, which had low reflection.
The key thermal parameters measured were the air temperature, relative humidity, and wind speed. The measurement period ranged from August 1–10, 2018, and the measurement time in each day was from 9:00 to 18:00 in the hottest month in this area. The instruments were placed at a height of 1.5 m from the ground. The measurement instrument was a TES-1341 hot-wire anemometer (TES Electrical Electronic Corp., Taipei, Taiwan, China), and the parameters of the instrument are shown in Table 2.
Figure 3 shows a 3D model of the solar radiation incident on the Minsheng Road. The temperature, relative humidity, and wind speed curves of measurement points 1, 2, and 3 are shown in Figure 4. The average temperature of the measurement points 1, 2, and 3 were 33.62 °C, 32.76 °C, and 32.87 °C, respectively, with the maximum temperature appearing between 15:00 and 16:00. In the colonnades with the same orientation, the west end (measurement point 1) received a higher solar radiation in the afternoon, causing thermal discomfort. Baffle shading can be suitably used to reduce solar radiation. The temperatures at the middle and east end of the qilou colonnade were close (Figure 4a). In the humidity curve of Figure 4b, the humidity at measurement points 1 and 3 fluctuated slightly due to the solar movement. Measurement point 2 in the qilou colonnade was not exposed to overly strong radiation (Figure 3), and hence, the humidity at this point remained stable in the afternoon. In the wind speed curve shown in Figure 4c, because the wind was directed from measurement point 1 to point 3, the average wind speed of the upwind location in the colonnade was the highest, the average wind speed in the middle gradually decreased, and the average wind speed of the downwind location was the lowest. Therefore, the ventilation at the downwind location of the qilou colonnade should be improved.

2.2. Calculation of RWI

The indexes for evaluating the thermal comfort in a transitional space included the RWI, which is suitable for warm environments, and the HDR, which is appropriate for cold environments. For a qilou colonnade space in the hot summers and warm winters region, the RWI is an appropriate indicator for the evaluation of dynamic thermal comfort. The RWI is dimensionless and is based on the relative thermal stress index. Combined with the relevant thermal sensation scales provided by ASHRAE, the RWI is used to evaluate the thermal comfort in a warm environment [20]. When the vapor pressure in the air P < 2269 Pa, the RWI is calculated using:
R W I = M ( τ ) [ I c w ( τ ) + I a ] + 6 . 42 ( t a 35 ) + R I a 234
When P ≥ 2269 Pa, the RWI is calculated using:
R W I = M ( τ ) [ I c w ( τ ) + I a ] + 6 . 42 ( t a 35 ) + R I a 65 . 2 ( 5858 . 44 P a ) / 1000
where ta is the dry bulb temperature of the ambient air (°C) and Ia is the thermal resistance of the air boundary layer outside of clothing (clo). The fitting formula between Ia and the relative air velocity induced by human movement, Va, is:
I a = 0 . 3923 V a 0 . 4294
In Equation (4), τ is the time in the transition process, M is the metabolic rate, and Icw(τ) is the thermal resistance of sweat-wet clothing. Icw, similar to M, is a linear function of time τ between two states within the first 6 min of the change in the active state. That is, when τ < 360 s,
I c w ( τ ) = I c w 1 + ( I c w 2 I c w 1 ) τ 360 M ( τ ) = M 1 + ( M 2 M 1 ) τ 360
When τ > 360 s:
I c w ( τ ) = I c w 2 M ( τ ) = M 2
In Equation (6), Pa is the vapor pressure (Pa) around the human body and can be calculated using the relative humidity:
P a = φ P s
where φ is relative humidity and Ps is the saturated vapor pressure:
P s = e ln 611 . 12   + 17 . 62 t a 243 . 12 + t a
In Equation (8), R is the average radiant heat gain (W/m2) per unit area of skin and can be expressed in the following formula:
R = ε f c l f e f f σ ( T c l 4 T ¯ r 4 )
where ε is the emissivity of the surface of the human body, which is greater than 0.95; σ is the Stefan–Boltzmann constant, 5.67 × 10⁻⁸; feff is the correction coefficient for the effective surface area influenced by body posture, which is 0.70 for sitting and 0.72–0.78 for standing; Tcl is the surface temperature of the human body; and T ¯ r is the average radiation temperature of the environment.
The relationship between the RWI and the ASHRAE thermal sensation scale is shown in Table 3. Given the thermal parameters of the continuous transitional space, human clothing, and the active state of humans after entering this kind of space, the RWI value of each continuous transitional space can be calculated according to Equations (1) and (2) to obtain the comfort degree in the space.
The variation of the thermal environmental parameters of the colonnade space of the pedestrian street of Nanning in summer showed a certain pattern. The corresponding RWI values were calculated based on these parameters of the three measurement points (Figure 5). Analysis of the RWI and various thermal parameters reveals that the variation in the RWI was similar to that of the wind speed in the qilou colonnade space. Note that the wind speed had the most significant effect on the RWI, and the environmental wind field was closely related to the building microenvironment. Therefore, optimizing the layout and form of qilou buildings may result in a favorable wind environment and thus improve the RWI of the colonnade space.

3. Wind Field Optimization of Colonnade Space

The building information of a qilou was described and simplified to establish the corresponding simulation model. Based on the building and component scales, this study predicted the wind environment of a qilou colonnade space and summarized the corresponding patterns, providing guidance for improving the thermal environment of the qilou colonnade space.

3.1. Establishment of the Turbulence Model

The methods for studying the building wind environment mainly included field measurements, wind tunnel tests, and numerical analyses. CFD, which has the advantages of high efficiency, time savings, and low cost [21], was used to carry out the simulations and calculations for numerical analysis. PHOENICS (CHAM, London, UK) is a numerical simulation software for predicting wind fields and heat transfer in building environments [22] and provides a variety of turbulence models. In this study, the k-ε model was used to analyze the influence of the building form and component scale of a qilou street on the wind environment of the colonnade space [23]. The kinetic energy equation of turbulence (k) is:
( ρ k ) t + ( ρ k u i ) x i = x j [ ( μ + μ i σ k ) k x j ] + G k + G b ρ ε
The dissipation equation (ε) of turbulence is:
( ρ ε ) t + ( ρ k ε ) x i = x j [ ( μ + μ i σ ε ) ε x j ] + C 1 E ε k ( C k + C 3 E C b ) C 2 E ρ ε 2 k
where Gk and Gb are the generation terms for kinetic energy k, caused by the average speed gradient and buoyancy, respectively; C1E, C2E, and C3E are empirical constants; σk is the Prandtl number for k; and σε is the Prandtl number for ε.
The details of a qilou pedestrian street model are shown in Figure 6. Boundary and model parameter settings are described below.
(1) Computational boundary: The density of the mesh and the size of the computational domain considerably impact the accuracy and time of the calculations. Therefore, it is vital to choose the appropriate boundary. The size of the computational domain and method for mesh generation adopted in this study are as follows.
Computational domain: On the windward side, the building blocking ratio was no greater than 4% of the computational domain area, and the distance from the building to the boundary of the computational domain was not less than 2H, where H is the building height. The distance from the boundary of the target building to the exit was at least six times the length of the recirculation zone calculated. The distance from the boundary of the building to the entrance was 2/3 of the length of the computational domain behind the building to ensure a smooth backflow and outflow. The calculation formula for the length of the recirculation zone is as follows:
R = B s 0 . 67 B 1 0 . 33
where Bs and B1 are the short and long side lengths, respectively, of the windward side of the building. After calculation, the dimensions of the computational domain were set to a length × width × height of 185 m × 185 m × 31.7 m.
Meshing: The mesh size of the key observation domain was approximately 1/10 of the average scale of the target building in the computational domain, and the length ratio of the adjacent mesh cells in the high gradient region was no more than 1.3.
Number of iterations: After multiple trials and comprehensive consideration of computer resources, time cost, and the required accuracy and convergence, the number of iterations was set to 1000.
(2) Environmental boundary: The typical meteorological parameters of summer in Nanning were used as the simulated environmental boundary, as shown in Table 4. The research objects in this study were surrounded by mostly low-rise traditional building complexes, so the wind profile index was set to 0.2. The actual field investigation found that the alley wind in the qilou street was prominent, so the wind direction was set along the street.
(3) Model parameters: The model parameters could be obtained from specifications and data or selected according to the actual situation (Table 5) [24].
Simulation of the qilou pedestrian street model in Figure 6 was carried out, and the results are shown in Figure 7. As seen in Figure 7, the ranking of the wind speeds in the street space was downwind wind speed > upwind wind speed > middle wind speed. The ranking of the wind speeds in the qilou colonnade space was upwind wind speed > middle wind speed > downwind wind speed. The predicted trend of the wind speed was consistent with the measured trend.

3.2. Influence of Type of Street Intersection on the Wind Environment

Generally, the street corners in a city are right-angle intersections (cross streets or T-shaped streets) for connections with buildings, forming a standard cross intersection. As urban streets become denser and diverse architectural forms are used, the intersection of streets need to take the form of a chamfer to meet the visual requirements of pedestrians. Additionally, appropriate expansion of street intersection space is beneficial for creating an open traffic space. Qilou colonnades are built along streets with diverse styles. The form of a street corner significantly impacts the wind environment of a qilou space. According to the local wind rose, the side facing the Yongjiang River is the windward side in summer. Taking the windward side as the front side of qilou, the qilou street model was divided into a front chamfer, front and back chamfer, back chamfer, and right-angle corner. Wind environment simulations were carried out for each of the models. As shown in Figure 8, the wind was directed from point 10 to point 1, and as a consequence, the wind speed of the right-angle corner street model gradually attenuated with the length of the street, and most points (except point 10) in the other three models also exhibited the same trend due to the chamfers generating variations of the wind field at point 10. The variations in the wind speed at each calculation point using models with different types of street intersections are also shown in 
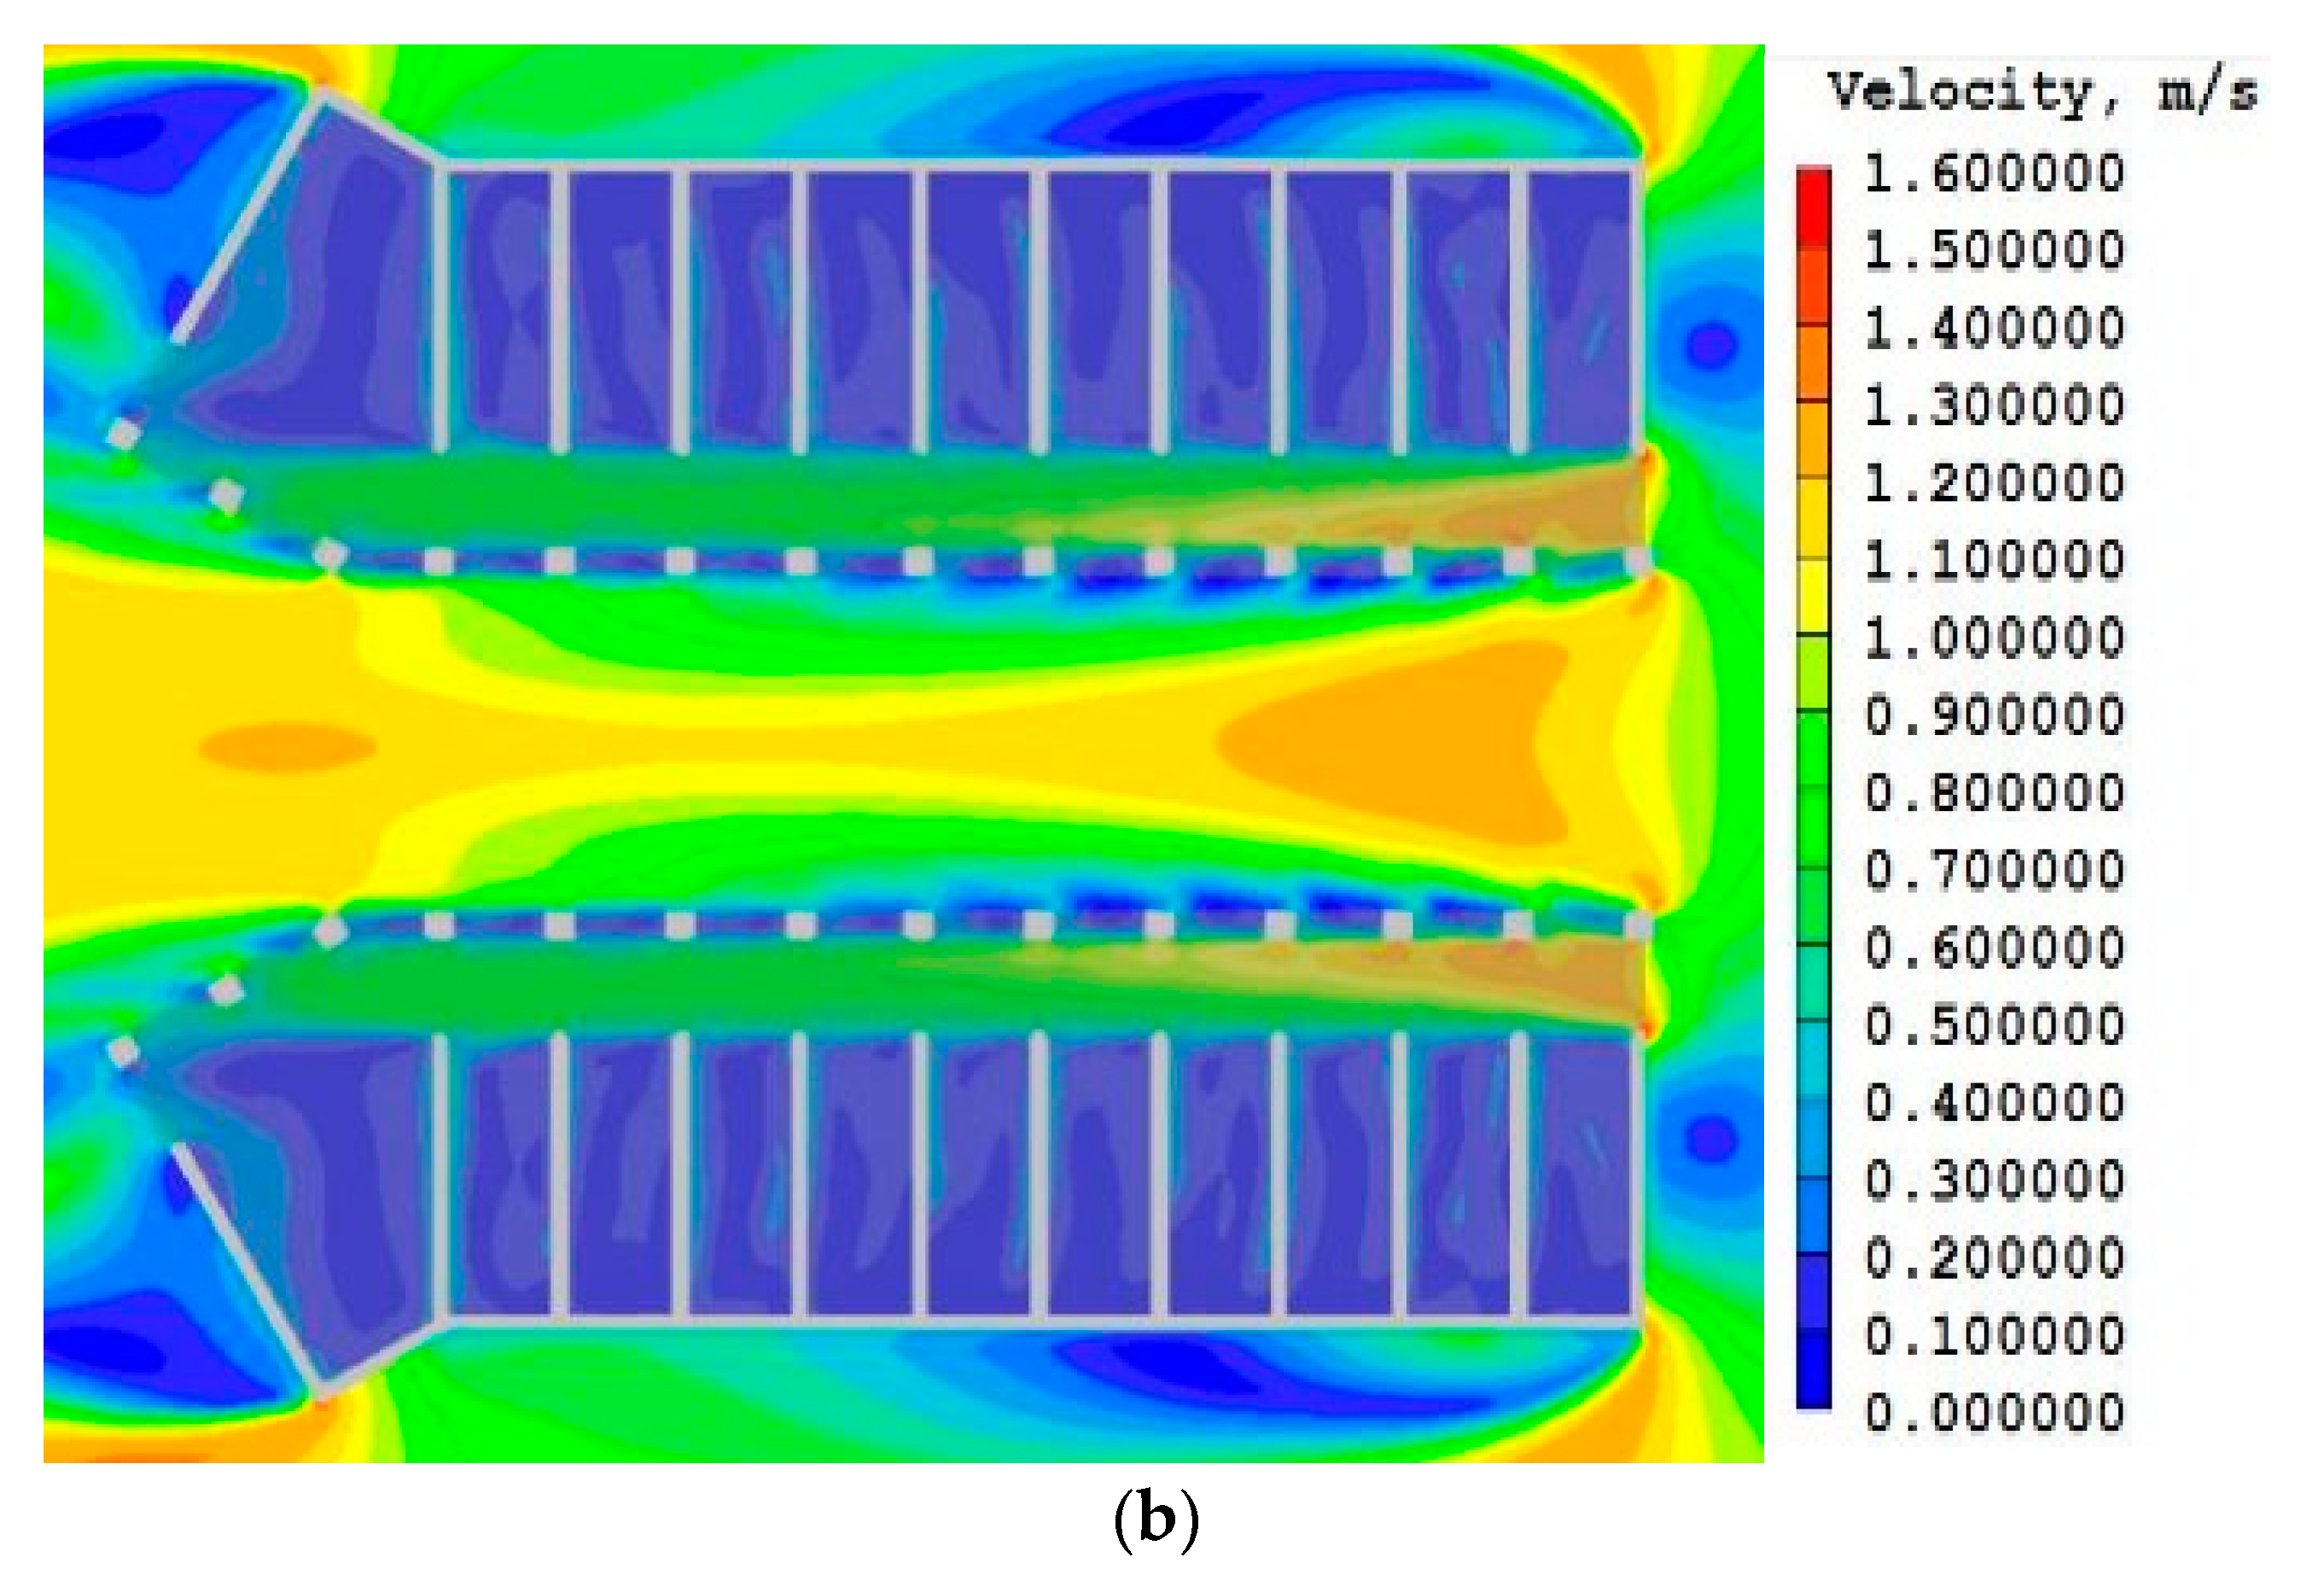
Figure 8, where the wind speed variations of colonnade spaces with different street intersection types are displayed. From high to low, the wind speeds were ranked as follows: back chamfer > front and back chamfer > front chamfer > right-angle corners. Therefore, an intersection with a back chamfer was the most conducive to a wind environment with improved thermal comfort in terms of the RWI indicator.
Figure 9 shows the results for the wind environment simulation using the intersection with a back chamfer. The calculation points were the intersections of the centerline of the colonnade and the centerline of the shops. The points were numbered 1–10 from left to right. Because the wind field had a uniform distribution with a higher wind speed, the wind environment of this type of intersection was ideal. Thus, the type of the intersection of a qilou significantly impacted the wind environment of the qilou colonnade.

3.3. Influence of Street Mode on Wind Environment

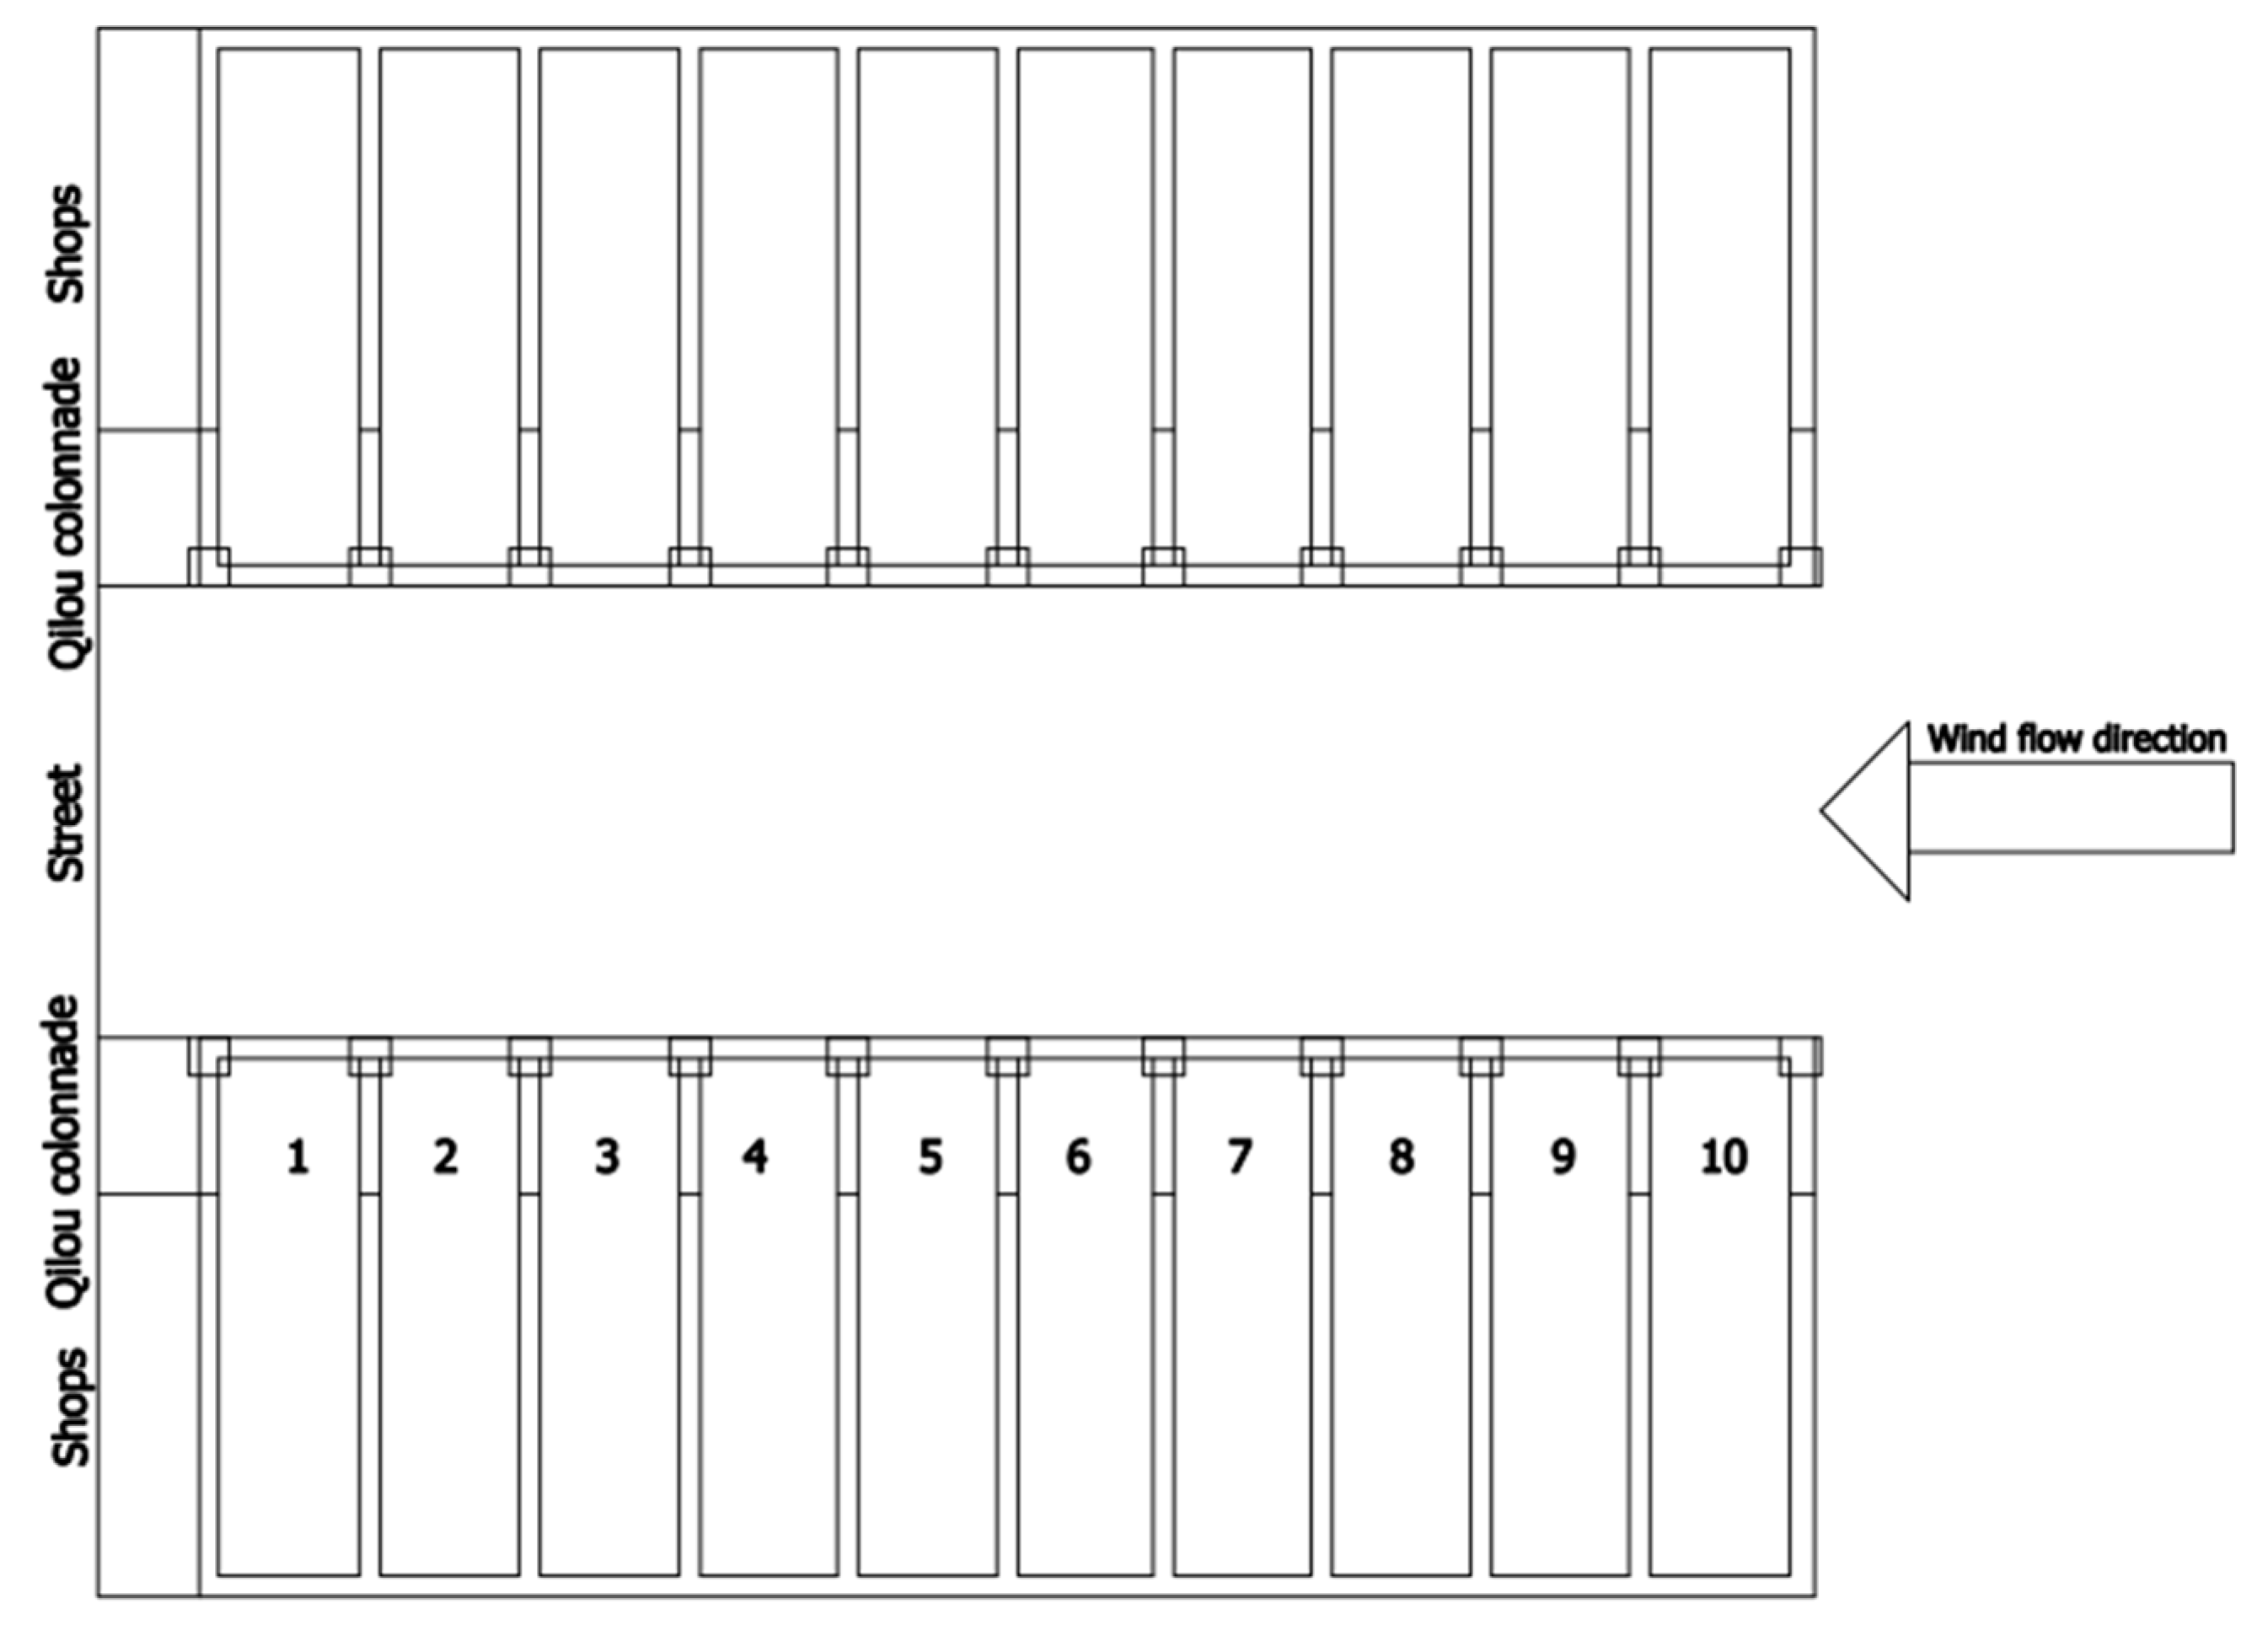
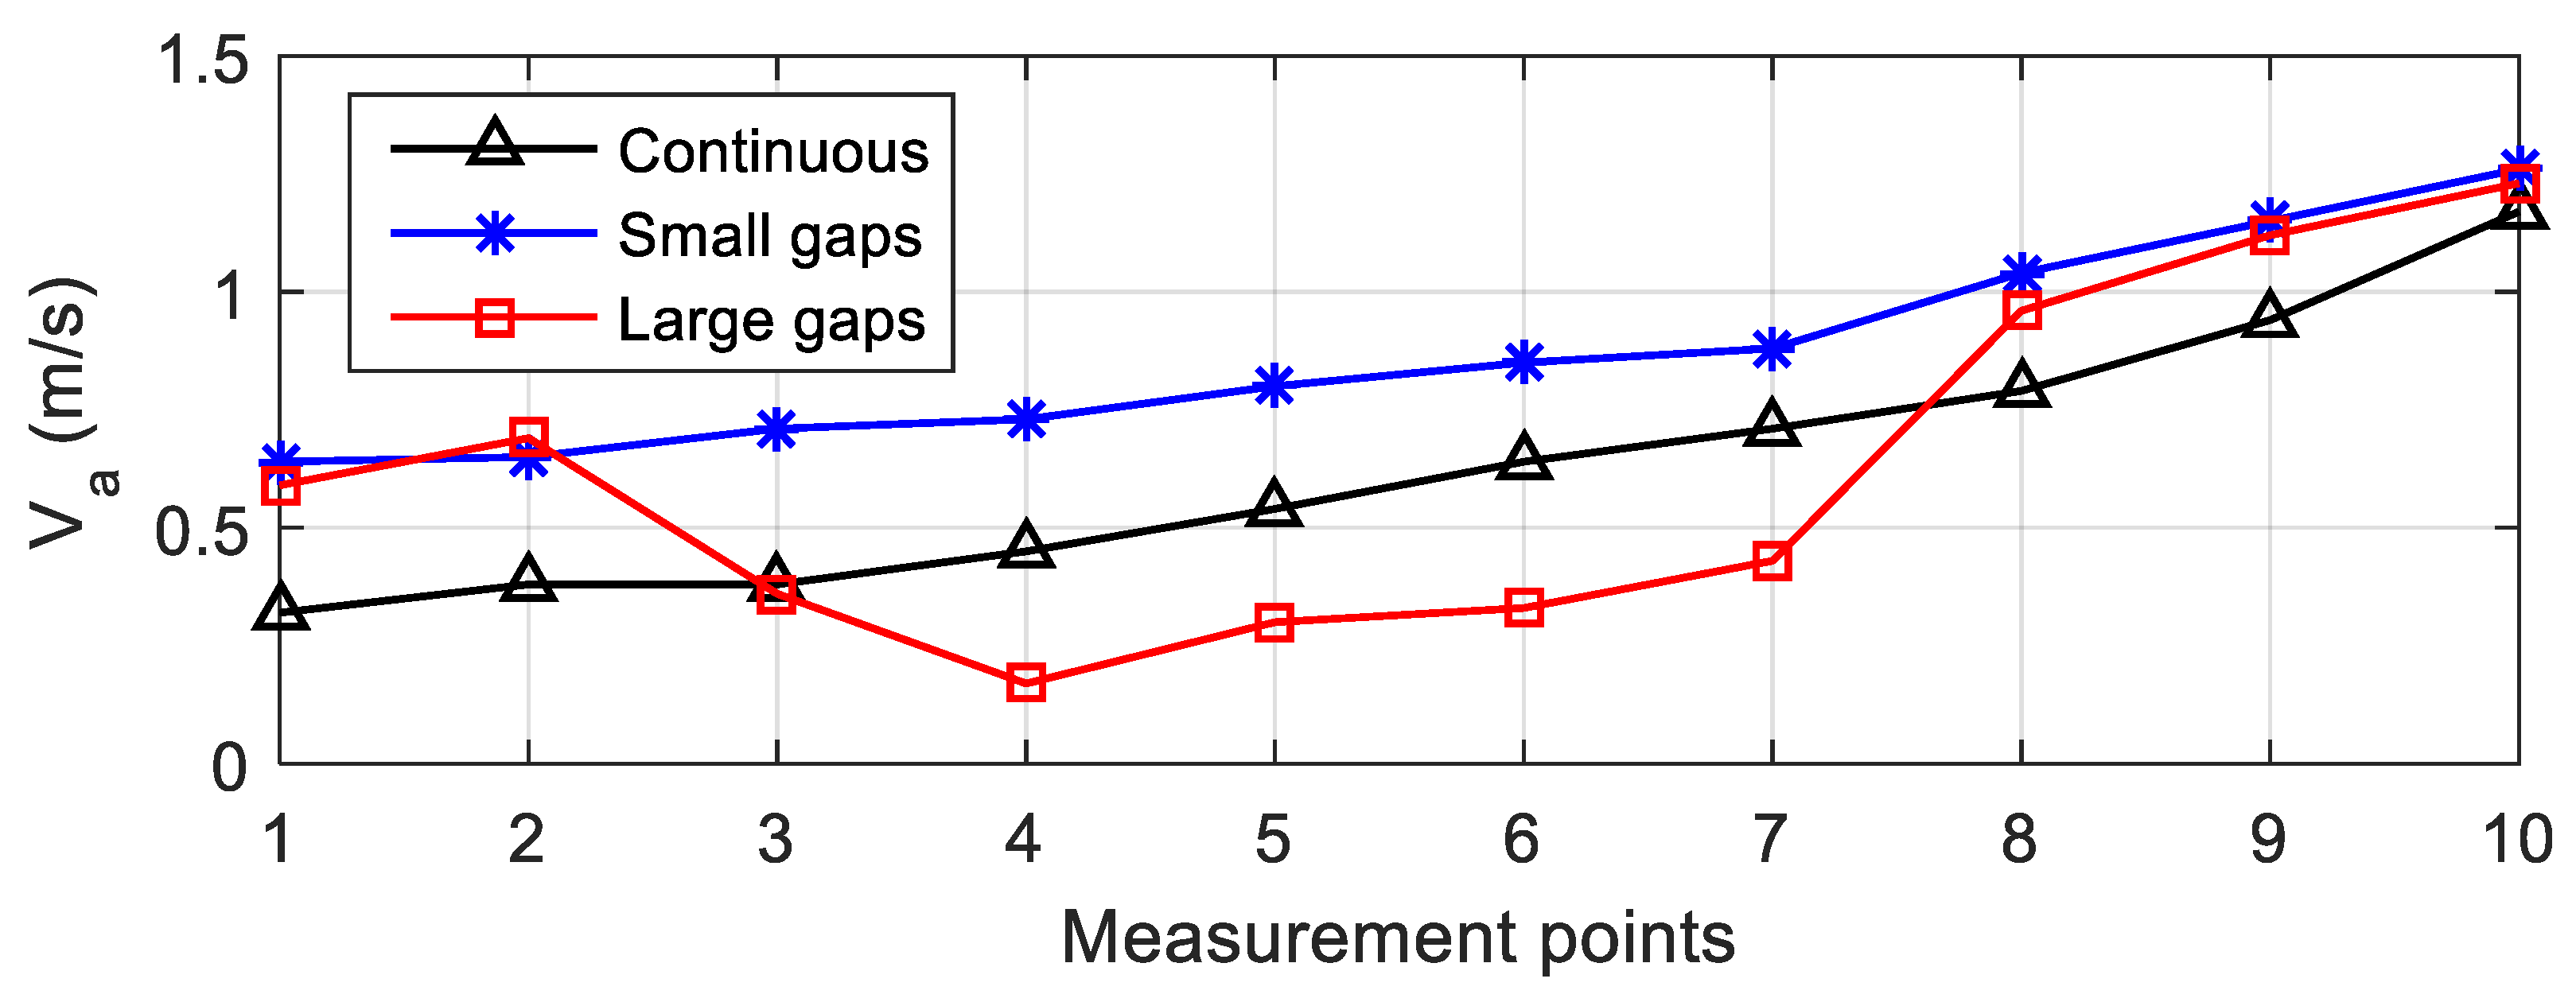
As a pedestrian street, due to historical reasons and functional needs, a qilou street is equipped with freight alleys and small squares for visitors, creating certain gaps in the qilous. When wind flows into a narrow space from an open space, the Venturi effect occurs. In this study, the qilou streets were divided into three modes: continuous qilous, qilous with small gaps, and qilous with large gaps, to explore the influence of the form of the street on the wind environment of a qilou colonnade. A qilou with small gaps means alleys as wide as the breadth of the qilou were present in the qilou street. A qilou with large gaps indicates that there were squares present that were as wide as the total width of several qilous along the street. Figure 10 compares the wind environments of the three forms of qilou streets and reveals that due to the Venturi effect, the wind speeds of the qilou colonnades of the two street forms with gaps were higher than that of a continuous qilou colonnade. In particular, the wind environment in the qilou colonnade with small gaps was the most favorable.
The simulation of the wind environment of a qilou street with small gaps is shown in Figure 11. The calculation points were the intersections of the centerline of the colonnade and the centerline of the shops. The points were numbered 1–10 from left to right. To improve the wind speed in the qilou colonnade space, a qilou street with gaps was used as needed to create a desirable wind environment, increasing the wind speed in the colonnade or expanding the range of the wind field distribution.

3.4. Influence of Building Structure on Wind Environment

The spatial elements that constitute the transitional space of a qilou, such as the floor height, qilou width (depth of the colonnade), and column cross-section (Figure 12) all noticeably influenced the appearance and enclosure of a qilou. There is a direct relationship between the spatial scale of and the wind environment in a qilou. In this study, the influence of component scales on the wind environment of a qilou was investigated. Meanwhile, the “shape” of architectural elements, such as the shape of the column section and roof style, also had an effect on the wind environment of a qilou. However, as a traditional architectural form, qilou has its own style: rectangle cross-section of the column and flat roof.
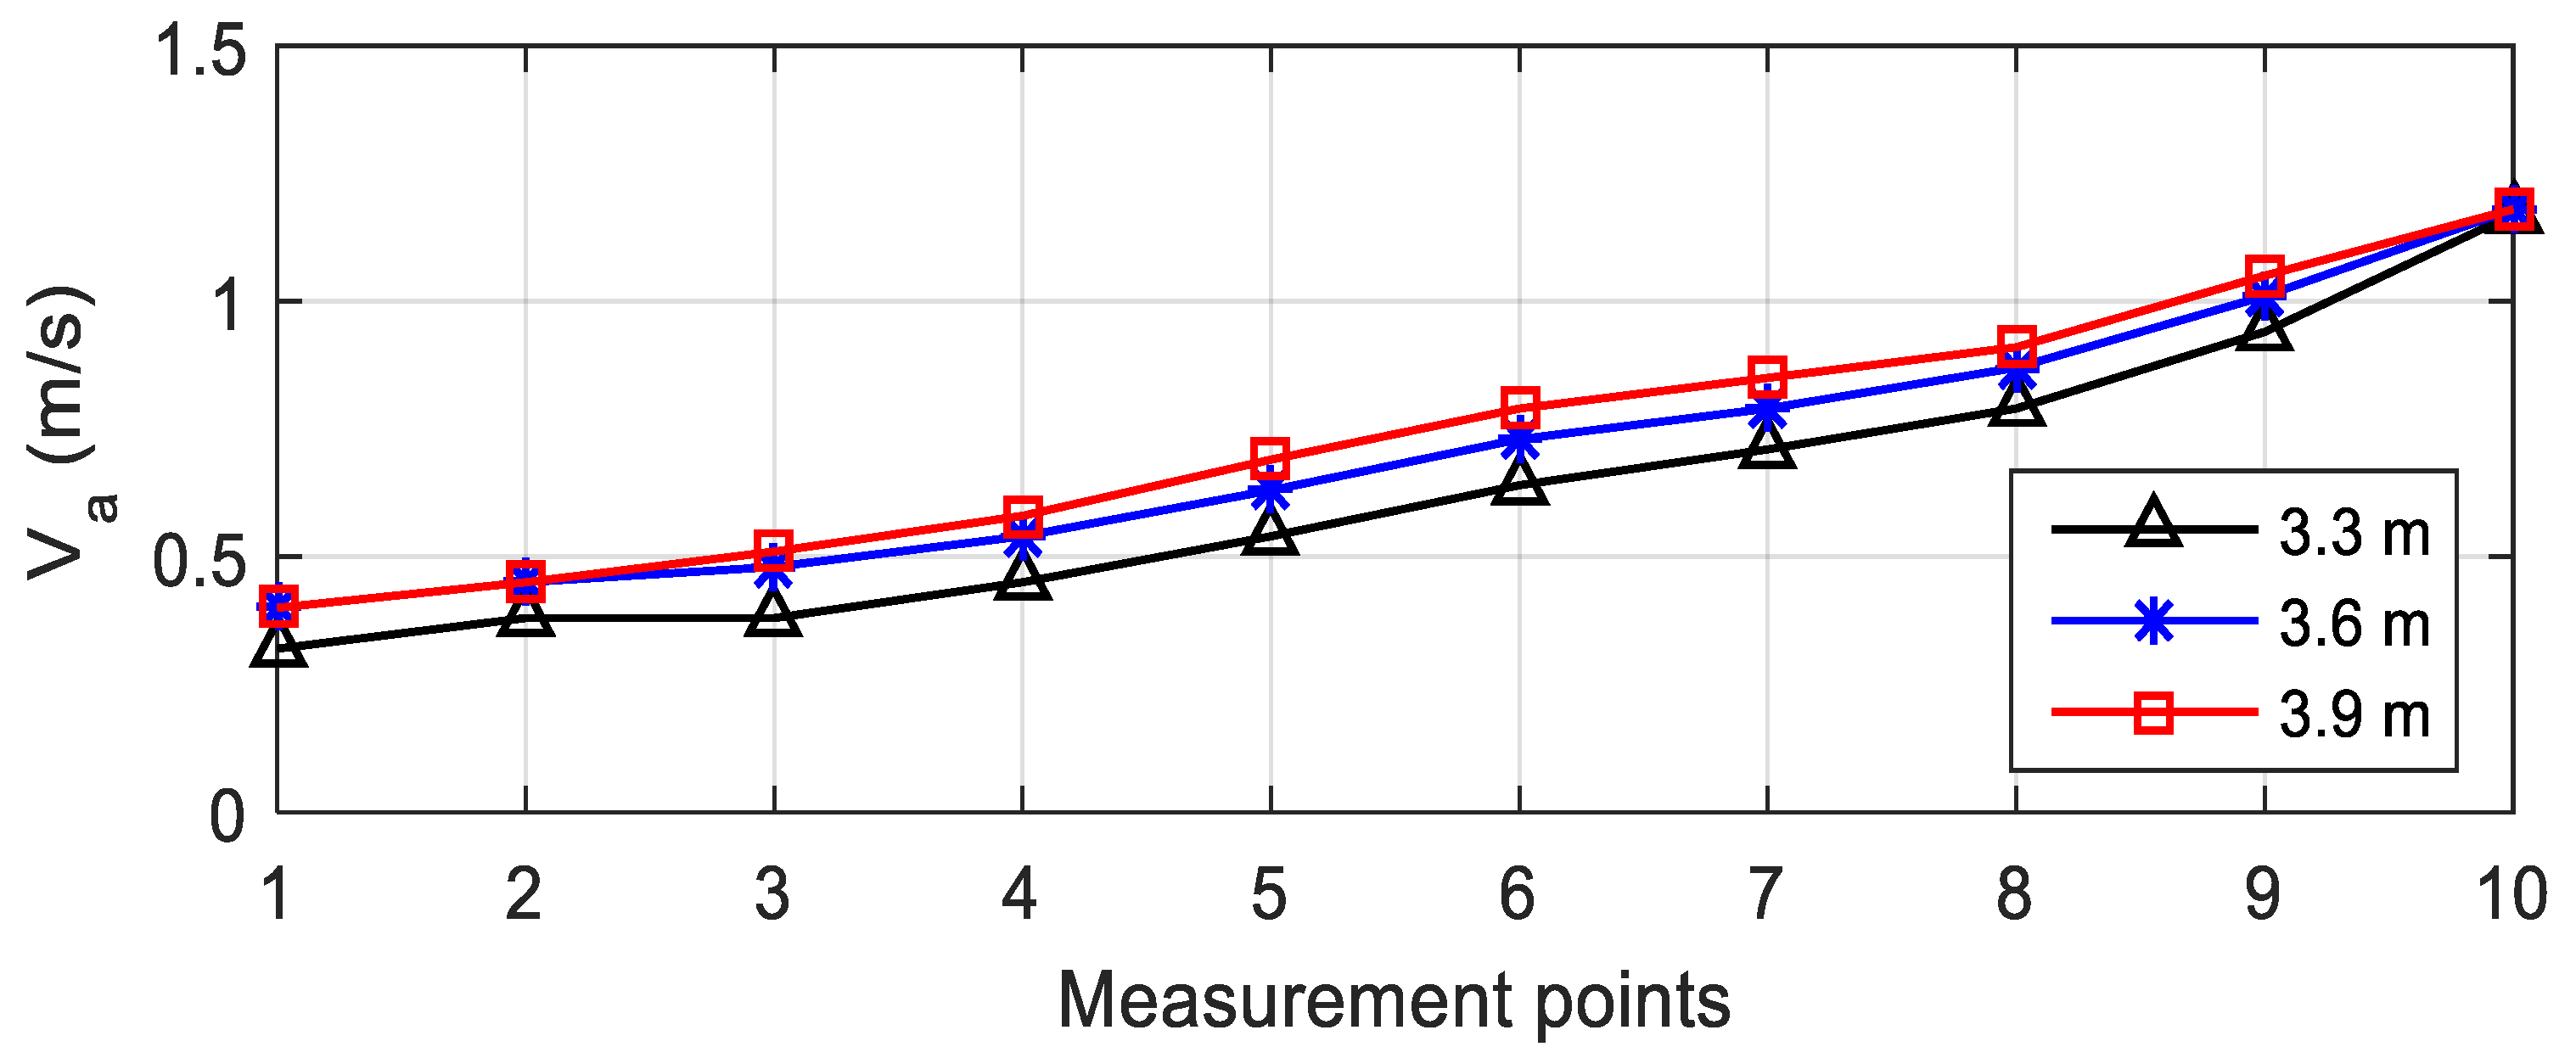
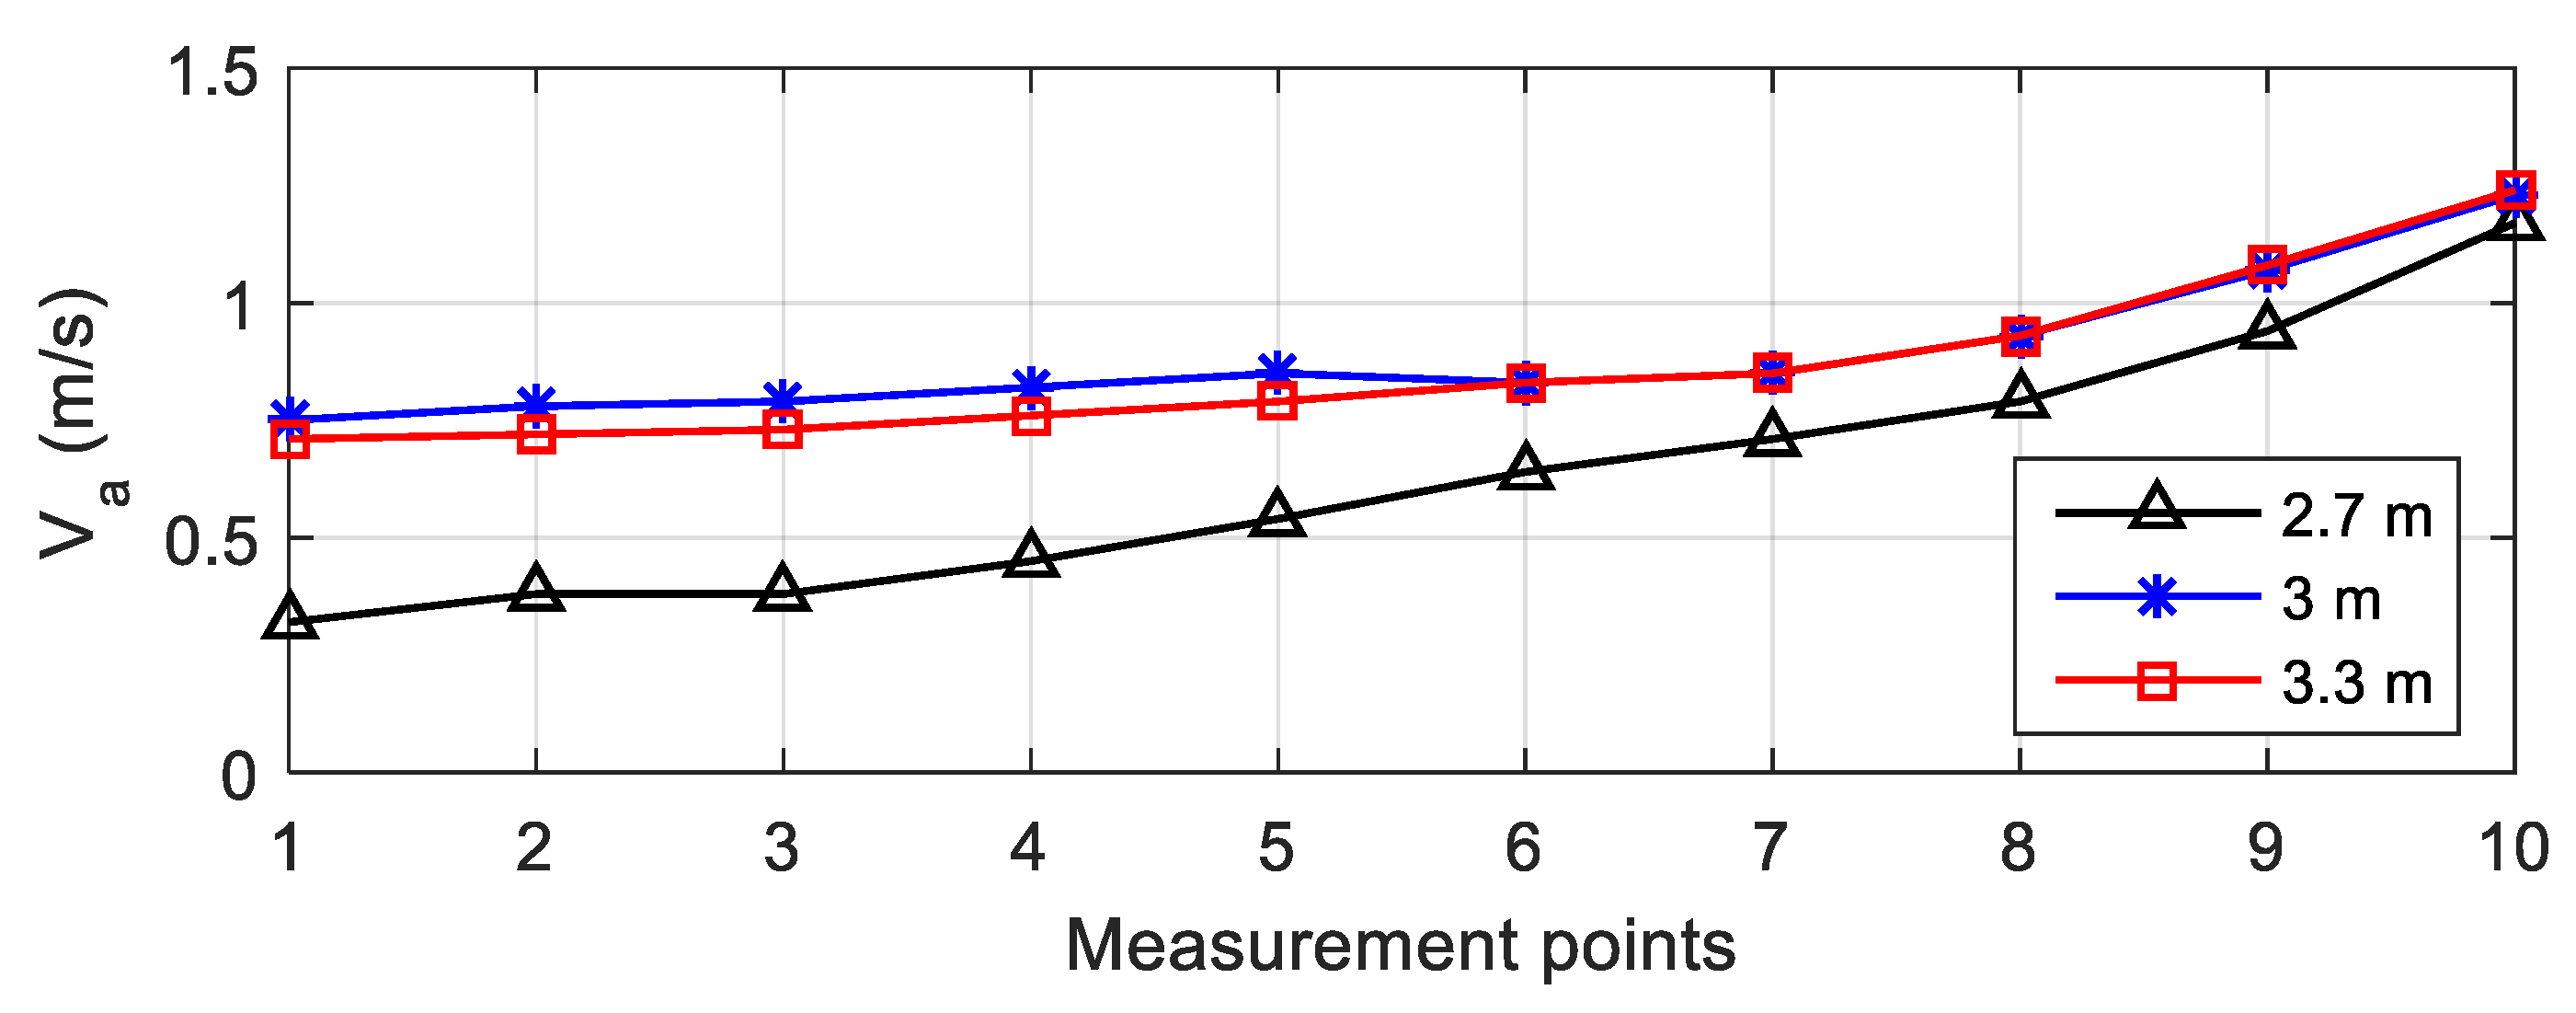
Taking a continuous qilou as an example, the floor height, qilou width, and column cross-section size of a qilou were used as the three structural parameters that influenced the wind environment. The parameters ranged as follows. The floor heights were 3.3 m, 3.6 m, and 3.9 m; the qilou widths were 2.7 m, 3.0 m, and 3.3 m; and the column cross-section sizes were 900 mm × 900 mm, 1200 mm × 900 mm, and 1500 mm × 900 mm. By changing the values of these three parameters, the wind environment was simulated and calculated. The average wind speeds are shown in Figure 13, Figure 14 and Figure 15, showing the influences of these structural parameters on the wind environment of a qilou colonnade.
An analysis of Figure 13, Figure 14 and Figure 15 found that as the floor height of a qilou increased at an increment of 300 mm, the wind speed in the qilou colonnade trended upward. The larger the floor height of the qilou colonnade, the higher the wind speed was. Increasing the floor height of the qilou was beneficial to the natural ventilation of the qilou space. The depth of the colonnade was also increased at an increment of 300 mm. The wind speeds in the colonnade were ranked as follows: 2.7-m-wide qilou < 3.3-m-wide qilou < 3-m-wide qilou. The wind speed curves in Figure 13, Figure 14 and Figure 15 show the component sizes that were the most beneficial to improve the ventilation in a qilou space. For example, in the continuous qilou model, the floor height of the qilou was approximately 3 m. As the column width increased at an increment of 300 mm, the wind speed trended upward in most areas of the qilou colonnade. That is, the larger the width of the column, the higher the wind speed in most areas of the colonnade space. However, wider columns affected the view and weakened the connection between the colonnade space and the street area. How to reasonably take these two factors into account is a question that designers need to consider when designing or reconstructing a colonnade.
In addition, the depth and width of the shops, the spacing of the columns, the height of the building, the width of the street, advertisement boards, roofs, and other elements were also simulated. The results showed that these elements were weakly correlated with the wind environment in the qilou colonnade space, so these elements did not significantly affect the wind speed in the colonnade.

4. Comprehensive Optimization for an Improved Wind Environment

The above measurements and numerical simulation results indicated that the wind environment directly affected the thermal comfort in a qilou colonnade space. The distribution of the wind field could be changed by adjusting the layout of the buildings to improve the thermal comfort in the qilou colonnade space. In this study, aiming at improving the wind environment and obtaining satisfied thermal comfort in a qilou space, the wind environment of the existing qilou colonnade space was optimized and modified by comprehensively considering factors such as the type of street intersection, the street mode, and the qilou structure. The modified form of the qilou is shown in Table 6. A wind simulation diagram of the optimized qilou is shown in Figure 16. The wind speeds in the qilou colonnade before and after optimization are compared in Figure 17a. The RWI for each point was calculated to analyze the changes in thermal comfort in the qilou colonnade space after optimization, with the results shown in Table 7 and Figure 17b. The comparison shows that the thermal comfort at each point clearly improved due to optimization. The average improvement of the RWI was 0.06. The maximum improvement occurred at point 1, that is, the downwind position, decreasing by 0.12. Point 10 experienced a weak improvement in thermal comfort. These results show that the wind environment of the upwind position was already satisfactory and thus difficult to improve further via optimization; for other positions, optimization could significantly improve the thermal comfort.
After the optimization, the RWI of each point in the qilou colonnade space considerably decreased, from warm to nearly slightly warm, showing that the qilou colonnade space was more comfortable for summer after optimization.

5. Discussion

In the light of the aforementioned analysis, the following significant results were obtained:
(1)
From the perspective of the efficacy in improving the wind environment in a qilou colonnade by changing the form of street intersection, adoption of a street intersection with a back chamfer was beneficial to the ventilation of the colonnade space.
(2)
A qilou street with small gaps was better than other kinds of continuous qilou street in creating a favorable wind environment.
(3)
The higher floor height of a qilou might ameliorate ventilation.
(4)
The appropriate depth of the colonnade (3.0 to 3.3 m) facilitated ventilation of a qilou space.
(5)
A relatively large column cross-section could increase the wind speed in most areas of a qilou space. According to the above results and considering various influencing factors, the wind environment of an actual qilou colonnade space was comprehensively optimized. In the optimized qilou colonnade space, the quality of the summer wind environment was significantly improved, in that the RWI value in the colonnade significantly decreased. Specifically, the average improvement was from 0.26 to 0.20, and the maximum improvement was from 0.33 to 0.21, indicating that the thermal sensations varied from warm to nearly slightly warm, and hence, the summer thermal comfort within a qilou colonnade space was improved.
Future studies are required to further explore the thermal sensation in the colonnade space of a qilou, for example, by considering the variation of human clothing and metabolic rate in different seasons.

6. Conclusions

In this study, the RWI values of the qilou colonnade spaces were calculated by using measured data. Then, the wind environment of the qilou colonnade space was simulated and predicted, and a series of factors affecting the wind environment of the colonnade space were analyzed. The results revealed that the wind speed significantly influenced thermal comfort within a qilou colonnade space in summer. By comprehensively modifying factors such as the type of street intersection, the street mode, and the qilou structure, the wind environment of the existing qilou colonnade space was optimized. Subsequently, adequate improvement of the wind environment could effectively enhance the thermal comfort in a qilou colonnade. These findings are beneficial to design a comfortable environment in the transitional space.

Author Contributions

Conceptualization, X.H.; Methodology, X.H.; Investigation, X.H., Z.L., and Z.Z.; writing, X.H., Z.L., and Z.Z.; Project administration, X.H.; Funding acquisition, X.H.

Funding

This research was funded by National Natural Science Foundation of China, grant number 51568003.

Conflicts of Interest

The authors declare no conflict of interest.

References

  1. Chun, C.; Kwok, A.; Tamura, A. Thermal comfort in transitional spaces-basic concepts: Literature review and trial measurement. Build. Environ. 2004, 39, 1187–1192. [Google Scholar] [CrossRef]
  2. Gagge, A.P.; Stolwijk, A.J.; Hardy, J.D. Comfort and thermal sensations and associated physiological responses at various ambient temperatures. Environ. Res. 1976, 1, 1–20. [Google Scholar] [CrossRef]
  3. Hwang, R.L.; Yang, K.H.; Chen, C.P.; Wang, S.T. Subjective responses and comfort reception in transitional spaces for guests versus staff. Build. Environ. 2008, 43, 2013–2021. [Google Scholar] [CrossRef]
  4. Hoof, J.V. Forty years of Fanger’s model of thermal comfort: Comfort for all. Indoor Air 2008, 18, 182–201. [Google Scholar] [CrossRef]
  5. Zhu, Y. Building Environment, 3rd ed.; China Architecture & Building Press: Beijing, China, 2010; pp. 154–196. [Google Scholar]
  6. Abbaspour, M.; Jafari, M.J.; Mansouri, N.; Moattar, F.; Nouri, N.; Allahyari, M. Thermal comfort evaluation in Tehran metro using Relative Warmth Index. Int. J. Environ. Sci. Technol. 2008, 5, 297–304. [Google Scholar] [CrossRef] [Green Version]
  7. Jian, Y.; Zhu, Y. Design temperature of underground stations in winter. J. HVAC 2002, 32, 20–22. [Google Scholar]
  8. Liu, W.; Liang, C.; Ling, S.; Huang, T. Research on optimization of controlling parameters for subway stations in summer. Build. Sci. 2017, 33, 135–141. [Google Scholar]
  9. Wang, L.; Li, Z.; Du, X.; Tang, D.; Shen, L. A measurement analysis of subway thermal environment characteristic of the coupling airflow between air-conditioning air supply and piston wind. J. Chongqing Univ. 2011, 34, 116–122. [Google Scholar]
  10. Wang, L.; Du, Z.; Zhang, J.; Chen, R.; Yua, S.; Qua, M. Study on the thermal comfort characteristics under the vent with supplying air jets and cross-flows coupling in subway stations. Energy Build. 2016, 131, 113–122. [Google Scholar] [CrossRef]
  11. Liu, C.; Li, A.; Yang, C.; Zhang, W. Simulating air distribution and occupants’ thermal comfort of three ventilation schemes for subway platform. Build. Environ. 2017, 125, 15–25. [Google Scholar] [CrossRef]
  12. Yin, S. Study on Spatial Scale of the Traditional Arcade Street in Lingnan Area Based on Climate Adaptation. Master’s Thesis, South China University of Technology, Guangzhou, China, 2015. [Google Scholar]
  13. Chen, J.; Wang, L.; Liu, J.; Wang, Y. Experimental study on indoor thermal environment in traditional qilou building in Haikou in summer. Build. Sci. 2011, 27, 42–47. [Google Scholar]
  14. Zhihong, C. Research of modern qilou in south of Fujian. Huazhong Archit. 2006, 11, 189–192. [Google Scholar]
  15. Xue, J.; Ran, M.; Wu, Y. Test and comparison analysis on summer thermal environment of qilou veranda with different orientations in Quanzhou. Build. Sci. 2011, 27, 17–23. [Google Scholar]
  16. Ma, Y. Research on Evaluation of Residential Street Space in Harbin Based on Microclimate Thermal Comfort. Master’s Thesis, Harbin Institute of Technology, Harbin, China, 2013. [Google Scholar]
  17. Luo, D. Studies of the Urban Leisure Blocks Microclimate Environment. Master’s Thesis, Southwest Jiaotong University, Chengdu, China, 2013. [Google Scholar]
  18. Kwong, Q.J.; Adam, N.M. Energy efficiency potential in tropical buildings—Perspective of an enclosed transitional zone. Int. Energy J. 2010, 11, 111–122. [Google Scholar]
  19. Wen, C.; Juan, Y.; Yang, A. Enhancement of city breathability with half open spaces in ideal urban street canyons. Build. Environ. 2017, 112, 322–336. [Google Scholar] [CrossRef]
  20. Ampofo, F.; Maidment, G.; Missenden, J. Underground railway environment in the UK Part 1: Review of thermal comfort. Appl. Therm. Eng. 2004, 24, 611–631. [Google Scholar] [CrossRef]
  21. Zhuang, Z.; Yu, Y.; Ye, H.; Tan, H.; Xie, J. Review on CFD simulation technology of wind environment around buildings. Build. Sci. 2014, 30, 108–114. [Google Scholar]
  22. Huang, Z.; Li, L.; Zhao, L.; Zhao, X. Quantitively analysis for impact of first floor overhead on natural ventilation under different building densities and plot ratios. HVAC 2016, 49, 124–127. [Google Scholar]
  23. Zahid Iqbal, Q.M.; Chan, A.L.S. Pedestrian level wind environment assessment around group of high-rise cross-shaped buildings: Effect of building shape, separation and orientation. Build. Environ. 2016, 101, 45–63. [Google Scholar] [CrossRef]
  24. JGJ286-2013. Design Standard for Thermal Environment of Urban Residential Areas; China Architecture & Building Press: Beijing, China, 2013. [Google Scholar]
Figure 1. Street view of Minsheng Road pedestrian street in Nanning.
Sustainability 11 04402 g001
Figure 2. Arrangement of measurement points 1, 2, and 3: (a) 3D model (b) sketch (c) plan.
Sustainability 11 04402 g002
Figure 3. Solar radiation intensity on Minsheng Road.
Sustainability 11 04402 g003
Figure 4. (a) Temperature, (b) relative humidity, and (c) wind speed at different measurement point.
Sustainability 11 04402 g004
Figure 5. RWI values of different measurement points in the colonnade space.
Sustainability 11 04402 g005
Figure 6. Details of a qilou pedestrian street model.
Sustainability 11 04402 g006
Figure 7. Wind environment simulation.
Sustainability 11 04402 g007
Figure 8. Wind speeds of a qilou colonnade with different types of intersections.
Sustainability 11 04402 g008
Figure 9. Model results from an intersection with a back chamfer and its wind environment: (a) plan (b) wind environment simulation.
Sustainability 11 04402 g009aSustainability 11 04402 g009b
Figure 10. Wind speeds under different qilou street modes.
Sustainability 11 04402 g010
Figure 11. Qilou street with small gaps and its wind environment: (a) plan (b) wind environment simulation.
Sustainability 11 04402 g011
Figure 12. The architecture detail of the qilou colonnade in Minsheng Road.
Sustainability 11 04402 g012
Figure 13. Wind speeds in qilou colonnades with different floor heights.
Sustainability 11 04402 g013
Figure 14. Wind speeds in qilou colonnades with different qilou widths.
Sustainability 11 04402 g014
Figure 15. Wind speeds in qilou colonnades with different column sizes.
Sustainability 11 04402 g015
Figure 16. Wind environment of the qilou colonnade space after optimization.
Sustainability 11 04402 g016
Figure 17. (a) Wind speed and (b) RWI of the qilou colonnade before and after optimization.
Sustainability 11 04402 g017
Table 1. Measurement points.
No.LocationPavement Material and ColorOpening Orientation
1West end of colonnade on the south side of Minsheng RoadPavement tiles, dark redNorthwest
2Middle of colonnade on the south side of Minsheng RoadPavement tiles, dark redNorthwest
3East end of colonnade on the south side of Minsheng RoadPavement tiles, dark redNorthwest
Table 2. Anemometer parameters.
Measurement ParametersMeasurement RangeResolution
Wind speed0.1–30.0 m/s0.01 m/s
Wind volume0–999900 m3/min0.001 m3/min
Relative humidity10–95% RH0.1% RH
Temperature−10 to 60 °C0.1 °C
Table 3. Relationship between the RWI value and the thermal sensation scale.
Thermal ComfortThermal Sensation ScaleRWI
Warm20.25
Slightly warm10.15
Neutral00.08
Slightly cool−10.00
Table 4. Environment parameters selected for the wind environment simulation.
Dry-Bulb TemperatureHorizontal Direct Radiation IlluminanceHorizontal Scattered Radiation IlluminanceWind SpeedWind DirectionEffective Sky TemperatureSoil Temperature
28.3 °C247 W/m2216 W/m21.4 m/sEast13.03 °C24.1 °C
Table 5. Model parameters.
Model ParametersBuildingGround
Density1900 kg/m31800 kg/m3
Specific heat capacity1050 J/(kg °C)1050 J/(kg °C)
Thermal conductivity1.08 W/m °C0.93 W/m °C
Thermal (long wave) radiation coefficient0.950.95
Solar radiation absorption coefficient0.500.70
Table 6. RWI calculated in the qilou colonnade space before and after optimization.
Working ConditionsBefore OptimizationAfter Optimization
Type of intersectionRight-angle cornerBack chamfer
Continuous or with gapsContinuousWith gaps
Floor height3.3 m3.9 m
Colonnade width2.7 m3.0 m
Column cross-section900 mm × 900 mm900 mm × 1500 mm
Table 7. Relationship between the RWI value and the thermal sensation scale.
Measurement PointRWI before OptimizationRWI after Optimization
10.330.21
20.310.21
30.310.21
40.290.22
50.270.22
60.250.21
70.240.21
80.230.19
90.210.19
100.190.18
Average RWI0.260.20

