Modelling the Spatial Distribution of Asbestos—Cement Products in Poland with the Use of the Random Forest Algorithm


Abstract
1. Introduction
Related Work
2. Materials and Methods
2.1. Data Collection
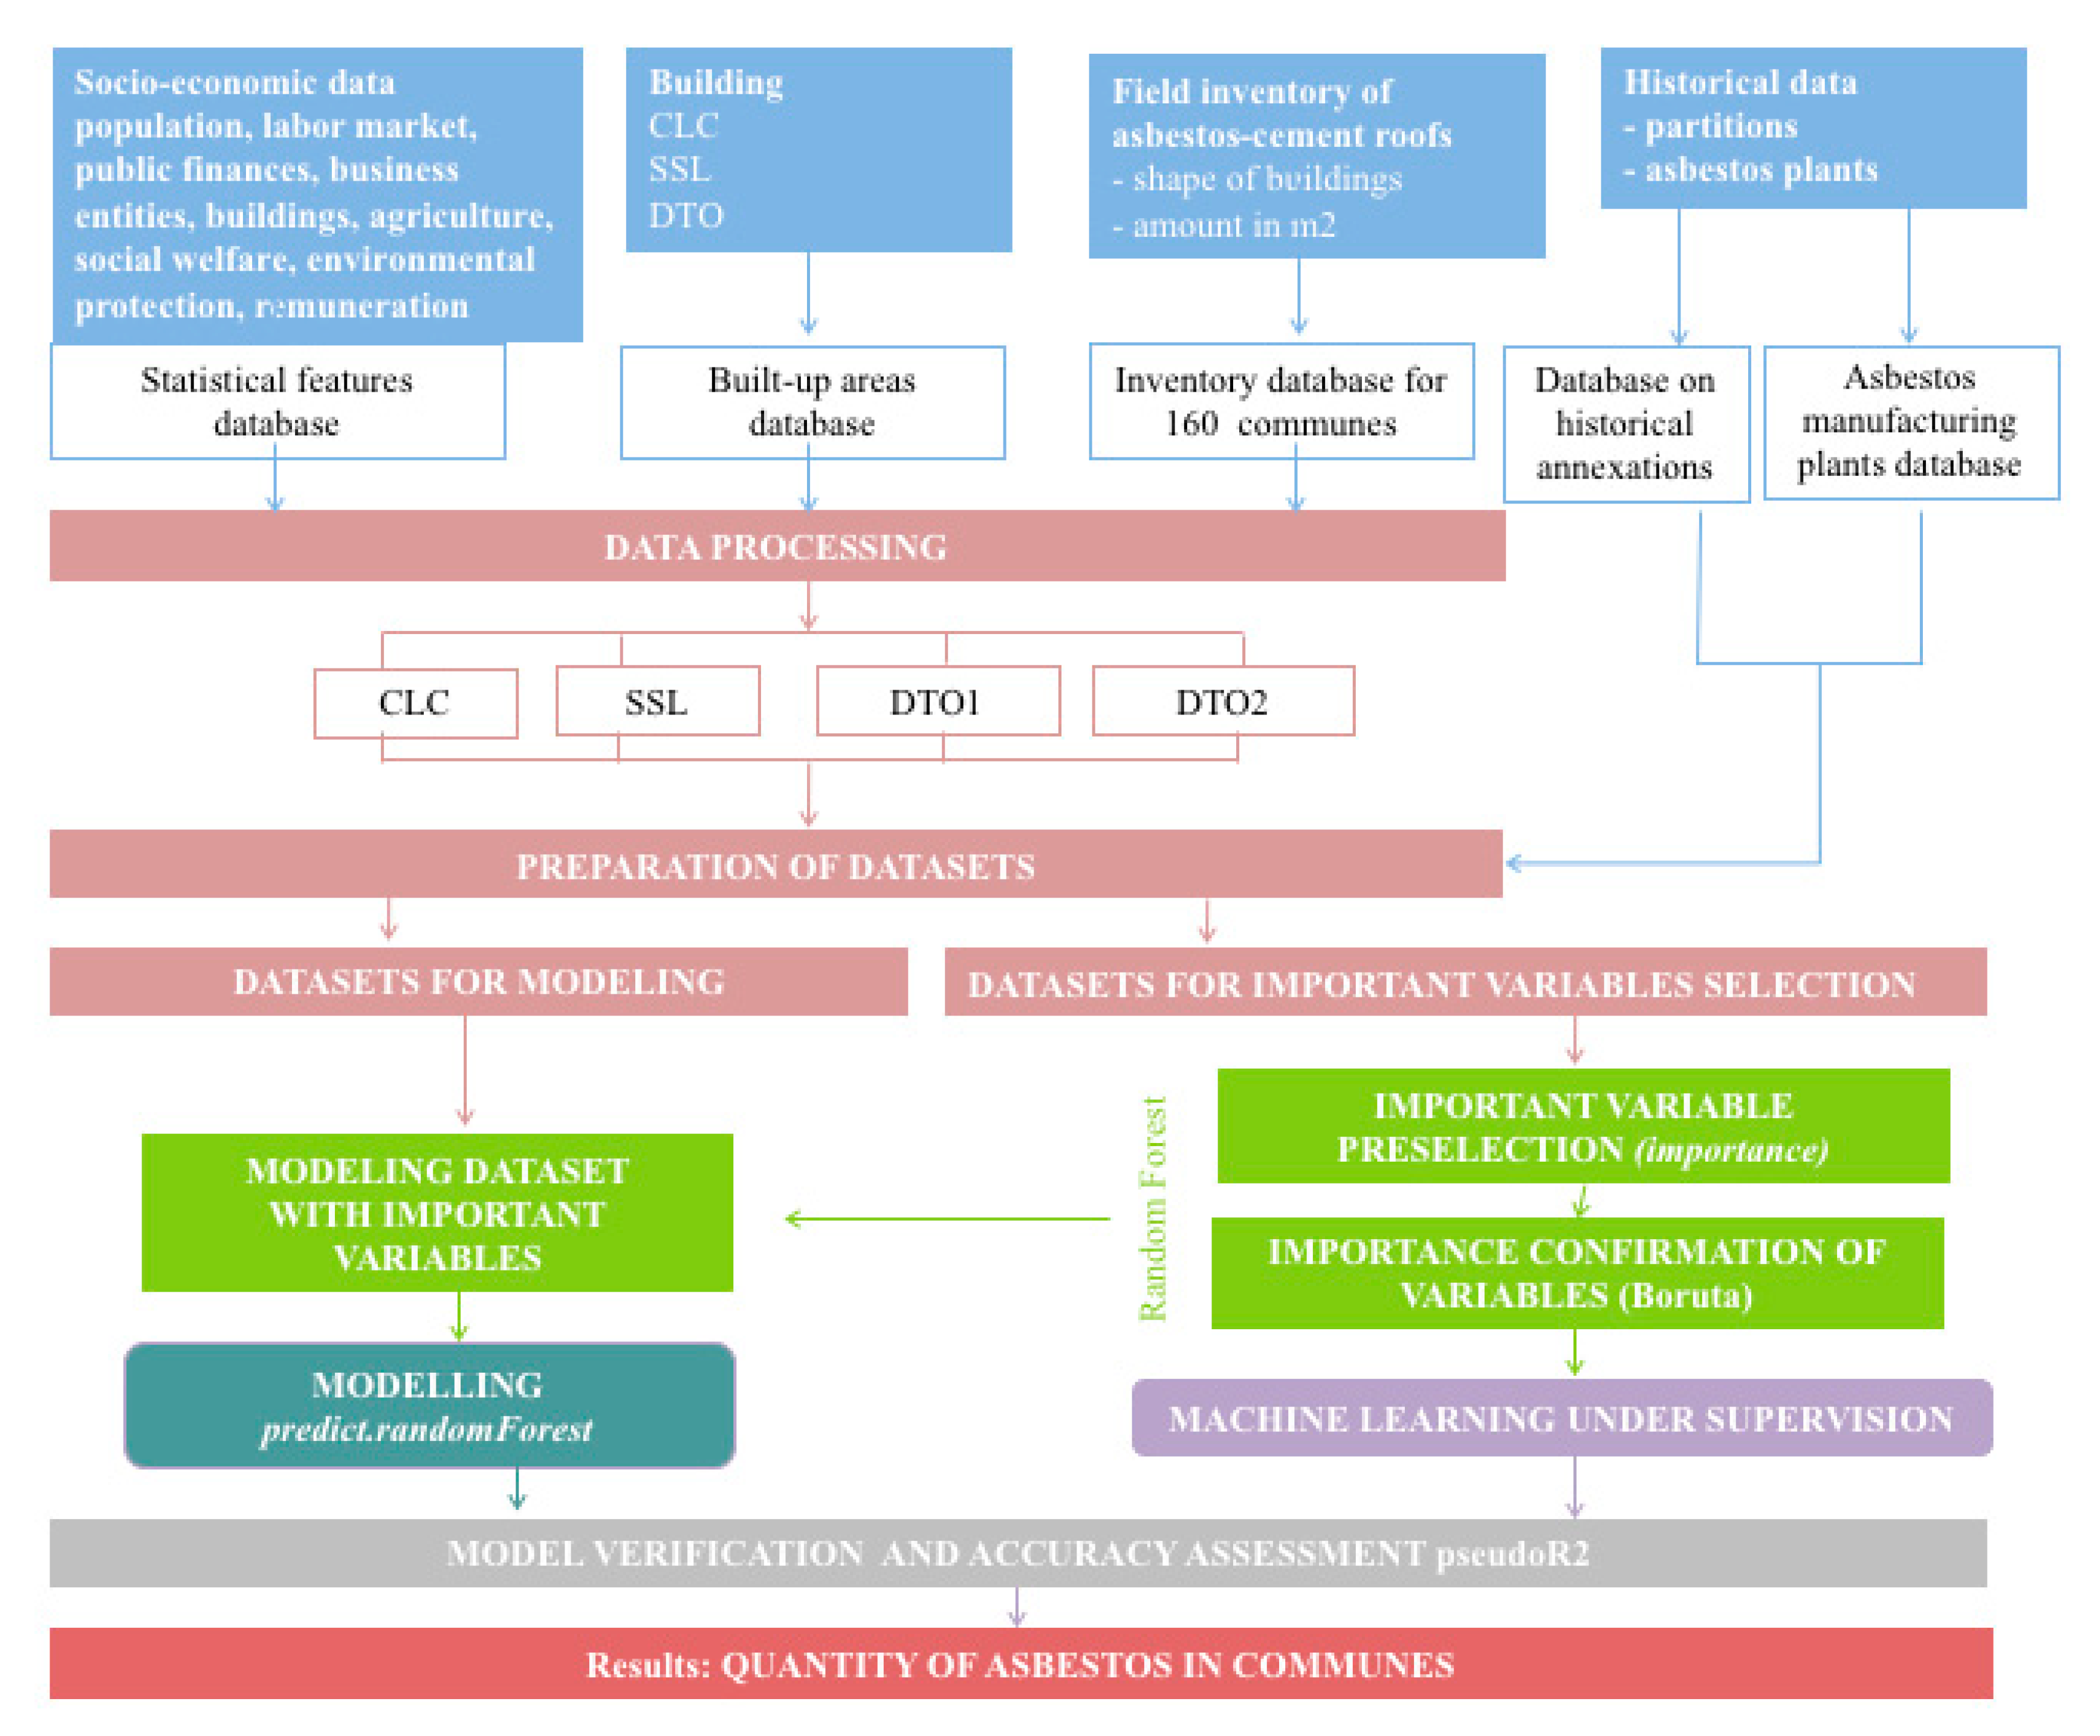
2.2. Data Processing
2.3. Selection of Important Variables
2.4. Supervised Machine Learning
2.5. Random Forest Prediction
2.6. Accuracy Assessment
2.7. Spatial Autocorrelation
3. Results
4. Discussion and Conclusions
Author Contributions
Funding
Acknowledgments
Conflicts of Interest
References
- Virta, R. Worldwide Asbestos Supply and Consumption Trends from 1900 through 2003, U.S. Geological Survey Circular 1298. 2006. Available online: http://pubs.usgs.gov/circ/2006/1298/c1298.pdf (accessed on 20 March 2017).
- Krówczyńska, M.; Wilk, E. Asbestos Exposure and the Mesothelioma Incidence in Poland. Int. J. Environ. Res. Public Health 2018, 15, 1741. [Google Scholar] [CrossRef] [PubMed]
- Programme for Asbestos Abatement in Poland 2009–2032; Ministry of Economy: Warsaw, Poland, 2010. Available online: https://www.gov.pl/web/przedsiebiorczosc-technologia/usuwanie-azbestu (accessed on 11 April 2019).
- Rake, C.; Gilham, C.; Hatch, J.; Darnton, A.; Hodgson, J.; Peto, J. Occupational, domestic and environmental mesothelioma risks in the British population: A case control study. Br. J. Cancer 2009, 100, 1175–1183. [Google Scholar] [CrossRef] [PubMed]
- Krówczyńska, M.; Wilk, E. Aerial imagery and geographic information systems used in the asbestos removal process in Poland. In Proceedings of the 33th EARSeL Symposium Towards Horizon 2020: Earth Observation and Social Perspectives; Lasaponara, R., Masini, N., Biscione, M., Eds.; Matera, Italy, 2013; pp. 823–828. [Google Scholar]
- Fiumi, L.; Tocci, S.; Meoni, C. Remote sensing and GIS for land use planning: An application for mapping asbestos–cement roofing in Tiburtina, Rome, Italy. Int. J. Remote Sens. Geosci. 2014, 3, 1–9. [Google Scholar]
- Krówczyńska, M.; Wilk, E. Geoazbest serwis do monitorowania procesu usuwania wyrobów azbestowych. Rocz. Geomatyki 2016, 14, 477–486. [Google Scholar]
- Peto, J.; Hodgson, J.T.; Matthews, F.E.; Jones, J.R. Continuing increase in mesothelioma mortality in Britain. Lancet 1995, 345, 535–539. [Google Scholar] [CrossRef]
- Nelson, H.H.; Kelsey, K.T. The molecular epidemiology of asbestos and tobacco in lung cancer. Oncogene 2002, 21, 7284–7288. [Google Scholar] [CrossRef] [PubMed]
- Van der Borre, L.; Deboosere, P. Asbestos in Belgium: An understimated health risk. The evolution of mesothelioma mortality rates (1969–2009). Int. J. Occup. Environ. Health 2014, 20, 134–140. [Google Scholar] [CrossRef] [PubMed]
- Krówczyńska, M.; Wilk, E. Spatial analysis of the exposure to asbestos and health care in Poland in 2004–2013. Geospat. Health 2018, 13. [Google Scholar] [CrossRef] [PubMed]
- Pan, X.L.; Day, H.W.; Wang, W.; Beckett, L.A.; Schenker, M.B. Residential Proximity to Naturally Occurring Asbestos and Mesothelioma Risk in California. Am. J. Respir. Crit. Care Med. 2005, 172, 1019–1025. [Google Scholar] [CrossRef] [PubMed]
- Koronacki, J.; Ćwik, J. Statystyczne Systemy Uczące Się; Akademicka Oficyna Wydawnicza EXIT: Warszawa, Poland, 2015; p. 327. [Google Scholar]
- Breiman, L. Random Forests. Mach. Learn. 2001, 45, 5–32. [Google Scholar] [CrossRef]
- Strobl, C.; Boulesteix, A.; Zeileis, A.; Hothorn, T. Bias in random forest variable importance measures: Illustrations, sources and a solution. BMC Bioinform. 2007, 8, 25. [Google Scholar] [CrossRef] [PubMed]
- Prasad, A.M.; Iverson, L.R.; Liaw, A. Newer classification and regression tree techniques: Bagging and random forests for ecological prediction. Ecosystems 2006, 9, 181–199. [Google Scholar] [CrossRef]
- Ballings, M.; Poel, D.V.D.; Hespeels, N.; Gryp, R. Evaluating multiple classifiers for stock price direction prediction. Expert Syst. Appl. 2015, 42, 7046–7056. [Google Scholar] [CrossRef]
- Breiman, L.; Cutler, A. Random Forests. 2007. Available online: https://www.stat.berkeley.edu/~breiman/RandomForests/ (accessed on 15 April 2017).
- Lehmann, C.; Koenig, T.; Jelic, V.; Prichep, L.; John, R.E.; Wahlund, L.O.; Dodge, Y.; Dierks, T. Application and comparison of classification algorithms for recognition of Alzheimer’s disease in electrical brain activity (EEG). J. Neurosci. Methods 2007, 161, 342–350. [Google Scholar] [CrossRef] [PubMed]
- Pierce, A.D.; Farris, C.A.; Taylor, A.H. Use of random forests for modeling and mapping forest canopy fuels for fire behavior analysis in Lassen Volcanic National Park, California, USA. For. Ecol. Manag. 2012, 279, 77–89. [Google Scholar] [CrossRef]
- Wei, C.; Rowe, G.T.; Escobar-Briones, E.; Boetius, A.; Soltwedel, T.; Caley, J.M.; Soliman, Y.; Huettmann, F.; Qu, F.; Yu, Z.; et al. Global Patterns and Predictions of Seafloor Biomass using Random Forests. PLoS ONE 2010, 5, e15323. [Google Scholar] [CrossRef]
- Leutner, B.F.; Reineking, B.; Muller, J.; Bachmann, M.; Beierkuhnlein, C.; Dech, S.; Wegmann, M. Modelling Forest α-Diversity and Floristic Composition—On the Added Value of LiDAR plus Hyperspectral Remote Sensing. Remote Sens. 2012, 4, 2818–2845. [Google Scholar] [CrossRef]
- Obidziński, A.; Pabjanek, P.; Medrzycki, P. Determinants of badger Meles melessett location in Białowieża Primeval Forest, northeastern Poland. Wildl. Biol. 2013, 19, 48–68. [Google Scholar] [CrossRef]
- Vincenzi, S.; Zucchetta, M.; Franzoi, P.; Pellizzato, M.; Pranovi, F.; De Leo, G.A.; Torricelli, P. Application of a Random Forest algorithm to predict spatial distribution of the potential yield of Ruditapes philippinarum in the Venice lagoon, Italy. Ecol. Model. 2011, 222, 1471–1478. [Google Scholar] [CrossRef]
- Local Data Bank. Available online: https://bdl.stat.gov.pl/ (accessed on 17 July 2017).
- Corine Land Cover. 2006. Available online: http://clc.gios.gov.pl/ (accessed on 15 March 2014).
- SSL. Copernicus Land Monitoring Service. 2009. Available online: http://land.copernicus.eu/pan-european/high-resolution-layers/imperviousness/imperviousness-2009/view (accessed on 29 March 2014).
- DTO. Database of Topographic Objects BDOT10k. 2011 Head Office of Geodesy and Cartography, Warsaw, Poland. Available online: http://www.gugik.gov.pl/projekty/gbdot/produkty (accessed on 5 January 2017).
- Szołtysek, M.; Gruber, S. Mosaic: Recovering surviving census records and reconstructing the familial history of Europe. Hist. Fam. 2016, 21, 38–60. [Google Scholar] [CrossRef]
- MPIDR Population History GIS Collection. Max Planck Institute for Demographic Research & Chair for Geodesy and Geoinformatics. In Grundriß der Deutschen Verwaltungsgeschichte; Hubatsch, W., Klein, T., Eds.; University of Rostock: Rostock, Germany, 1975. [Google Scholar]
- The Mosaic Project MPIDR Population History GIS Collection. Max Planck Institute for Demographic Research & Chair for Geodesy and Geoinformatics, University of Rostock, Rostock. Available online: https://censusmosaic.demog.berkeley.edu/data/historical-gis-files (accessed on 17 July 2017).
- Wilk, E.; Krówczyńska, M.; Pabjanek, P. Determinants influencing the amount of asbestos-cement roofing in Poland. Misc. Geogr. 2015, 19, 82–86. [Google Scholar] [CrossRef]
- Wilk, E.; Krówczyńska, M.; Zagajewski, B. Asbestos manufacturing plants in Poland. Misc. Geogr. 2014, 18, 53–58. [Google Scholar] [CrossRef]
- R Core Team. R: A Language and Environment for Statistical Computing; R Foundation for Statistical Computing: Vienna, Austria, 2014. [Google Scholar]
- Kuhn, M. A Short Introduction to the Caret Package. 2016. Available online: https://CRAN.R-project.org/package=caret (accessed on 28 June 2017).
- Liaw, A. Package ‘Randomforest’. Breiman and Cutler’s Random Forests for Classification and Regression. 2015. Available online: https://cran.r-project.org/web/packages/.randomForest/randomForest.pdf (accessed on 13 March 2017).
- Kursa, M.B.; Rudnicki, W.R. Feature Selection with the Boruta Package. J. Stat. Softw. 2010, 36, 1–13. [Google Scholar] [CrossRef]
- Kursa, M.B.; Jankowski, A.; Rudnicki, W.R. Boruta—A system for feature selection. Fundam. Inform. 2010, 101, 271–285. [Google Scholar]
- Rudnicki, W.R.; Wrzesień, M.; Paja, W. All relevant feature selection methods and applications. Stud. Comput. Intell. 2015, 584, 11–28. [Google Scholar]
- Liaw, A.; Wiener, M. Classification and Regression by randomForest. R News 2002, 2, 18–22. [Google Scholar]
- Moran, P.A.P. Notes on Continuous Stochastic Phenomena. Biometrika 1950, 37, 17–23. [Google Scholar] [CrossRef] [PubMed]
- Li, H.; Calder, C.A.; Cressie, N. Beyond Moran’s I: Testing for Spatial Dependence Based on the Spatial Autoregressive Model. Geogr. Anal. 2007, 39, 357–375. [Google Scholar] [CrossRef]
- Veall, M.R.; Zimmermann, K.F. Pseudo-R2 Measures for Some Common Limited Dependent Variable Models. J. Econ. Surv. 1996, 10, 241–259. [Google Scholar] [CrossRef]
- Oliveira, S.; Oehler, F.; San-Miguel-Ayanz, J.; Camia, A.; Pereira, J.M.C. Modeling spatial patterns of fire occurrence in Mediterranean Europe using Multiple Regression and Random Forest. For. Ecol. Manag. 2012, 275, 117–129. [Google Scholar] [CrossRef]
- Pang, H.; Lin, A.; Holford, M.; Enerson, B.E.; Lu, B.; Lawton, M.P.; Floyd, E.; Zhao, H. Pathway analysis using random forest classification and regression. Bioinformatics 2006, 22, 2028–2036. [Google Scholar] [CrossRef] [PubMed]
- Krówczyńska, M.; Wilk, E.; Zagajewski, B. The Electronic Spatial Information System—Tools for the monitoring of asbestos in Poland. Misc. Geogr. 2014, 18, 59–64. [Google Scholar] [CrossRef]
- Wilk, E.; Krówczyńska, M.; Pabjanek, P.; Mędrzycki, P. Estimation of the amount of asbestos–cement roofing in Poland. Waste Manag. Res. 2017, 35, 491–499. [Google Scholar] [CrossRef] [PubMed]
- Krówczyńska, M.; Wilk, E. Environmental and Occupational Exposure to Asbestos as a Result of Consumption and Use in Poland. Int. J. Environ. Res. Public Health 2019, 16, 2611. [Google Scholar] [CrossRef] [PubMed]


| Dataset | Pseudo-R2 (%) | The Amount of Asbestos–Cement Products (tons) |
|---|---|---|
| Corine Land Cover (CLC) | 54.05 | 9,271,099 |
| Database of Topographic Object (DTO) 2 | 68.80 | 7,579,424 |
| Database of Topographic Object (DTO) 1 | 70.39 | 7,398,852 |
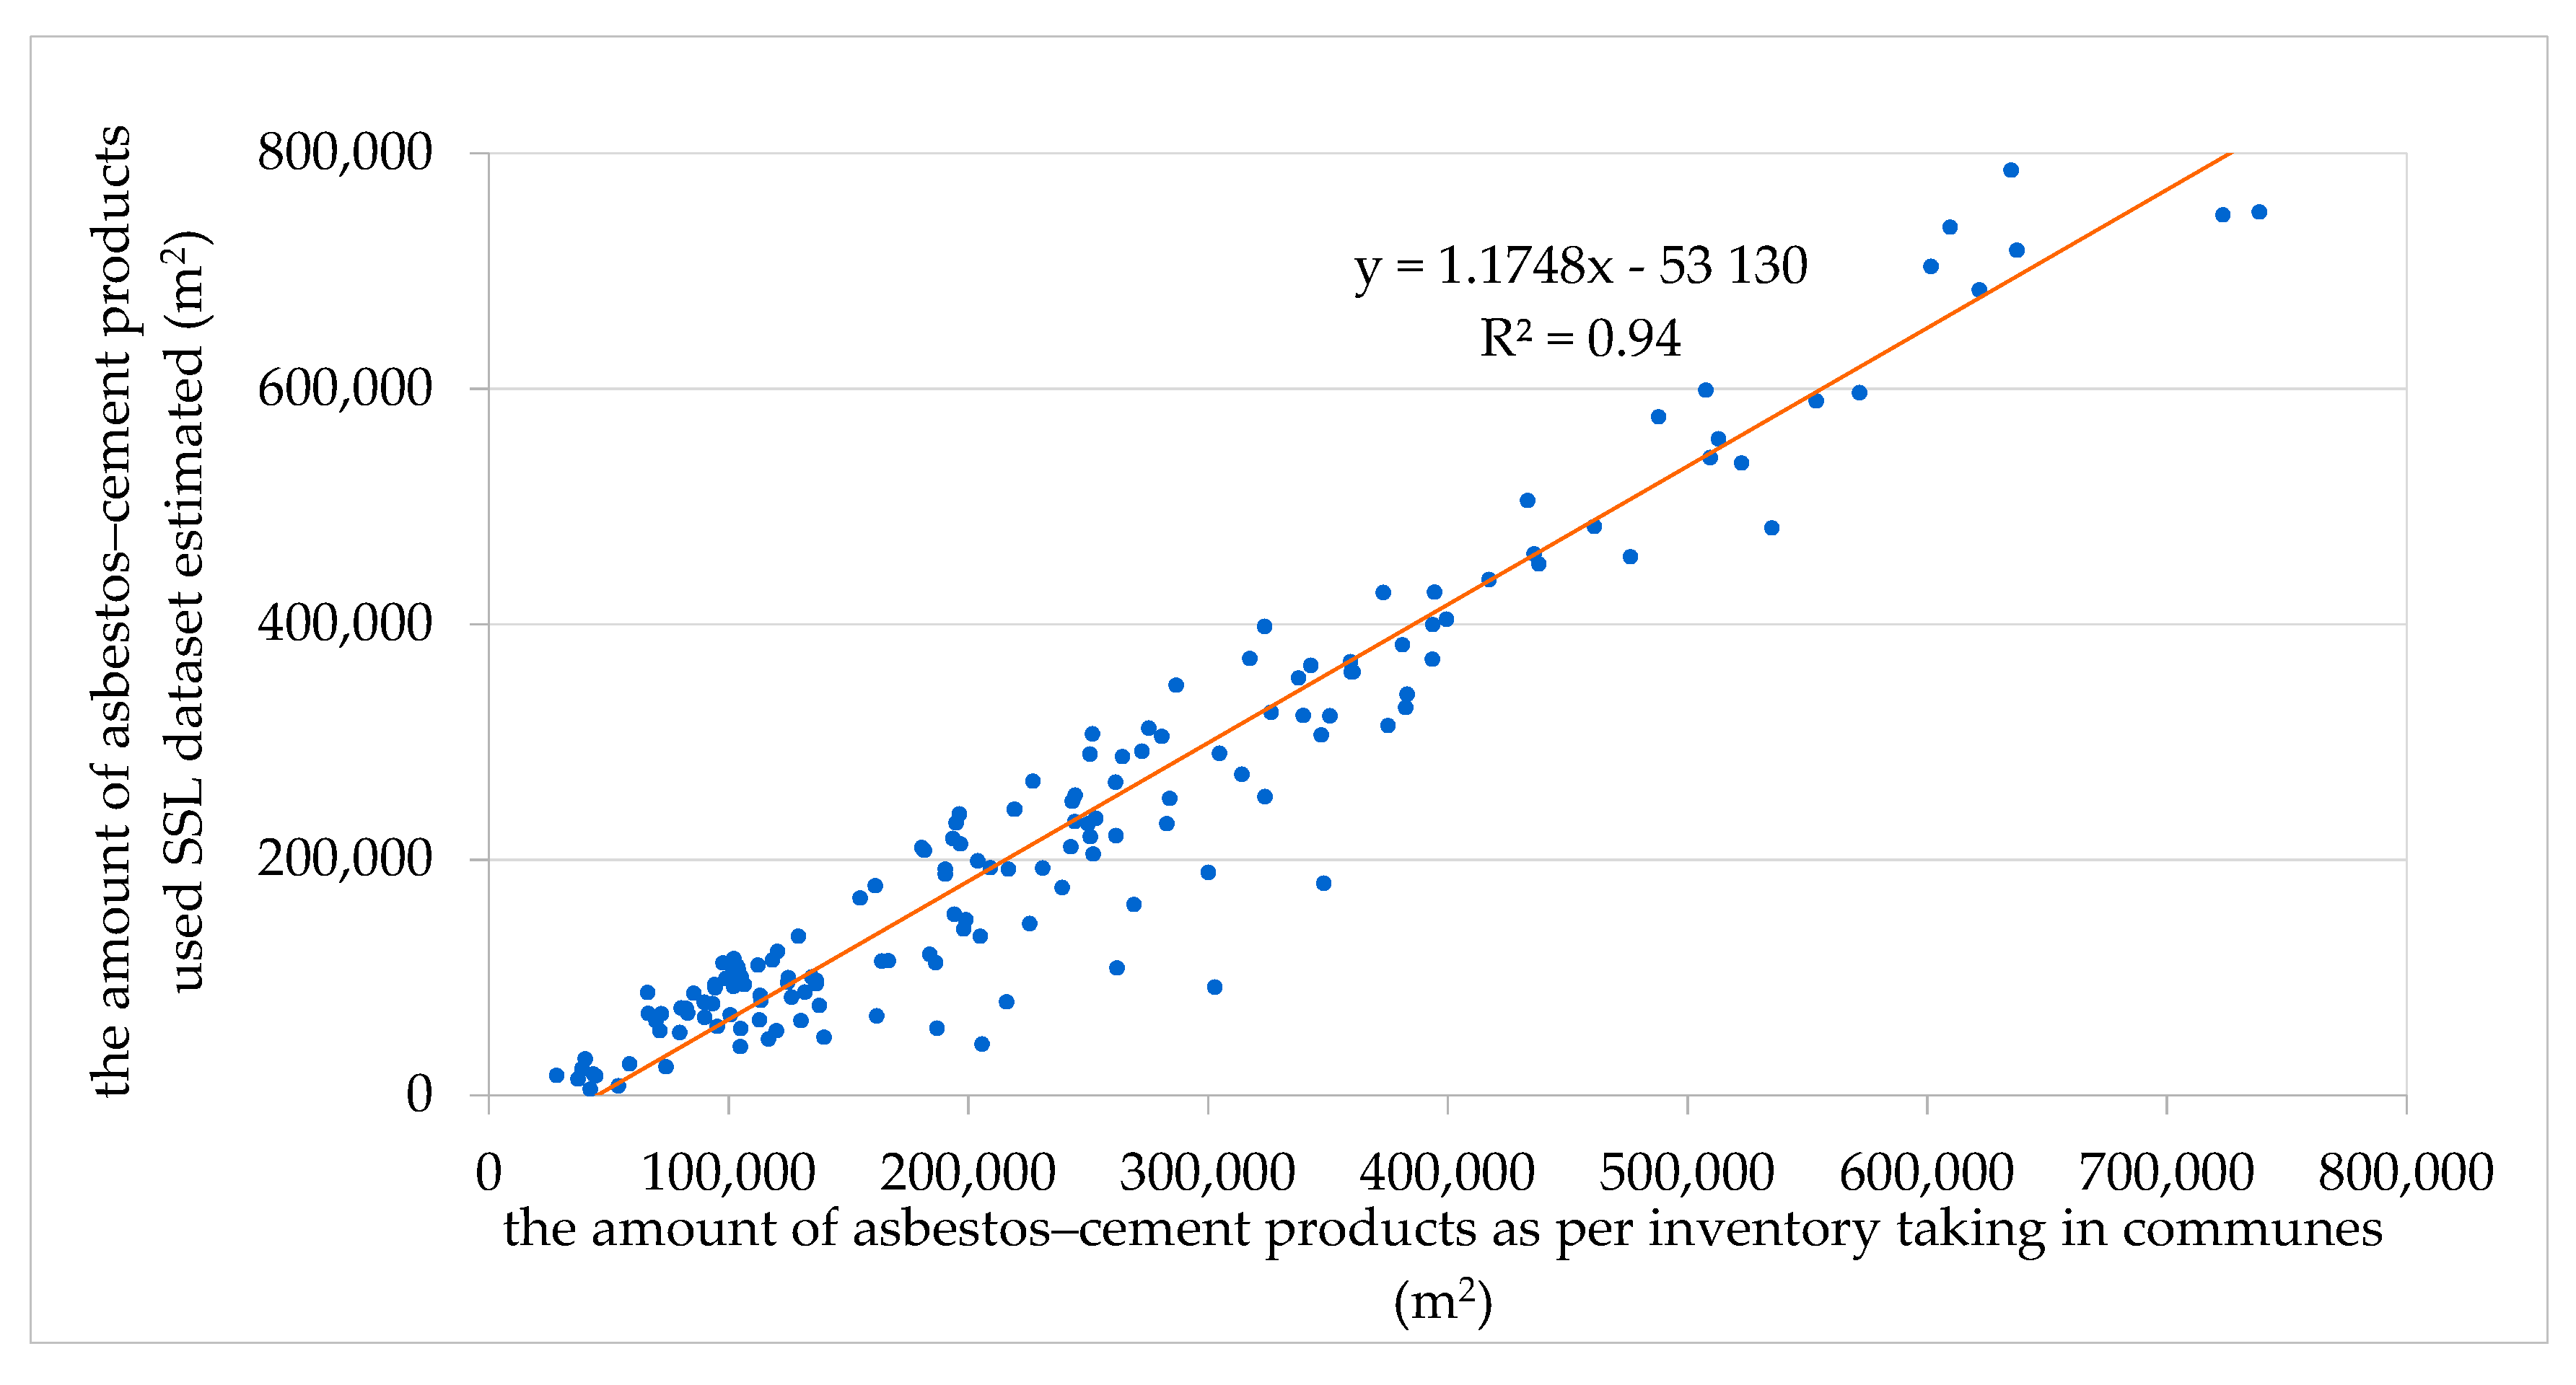
| Soil Sealing Layer (SSL) | 75.85 | 7,813,065 |
| Moran I | Variance (I) | Z-score | |
|---|---|---|---|
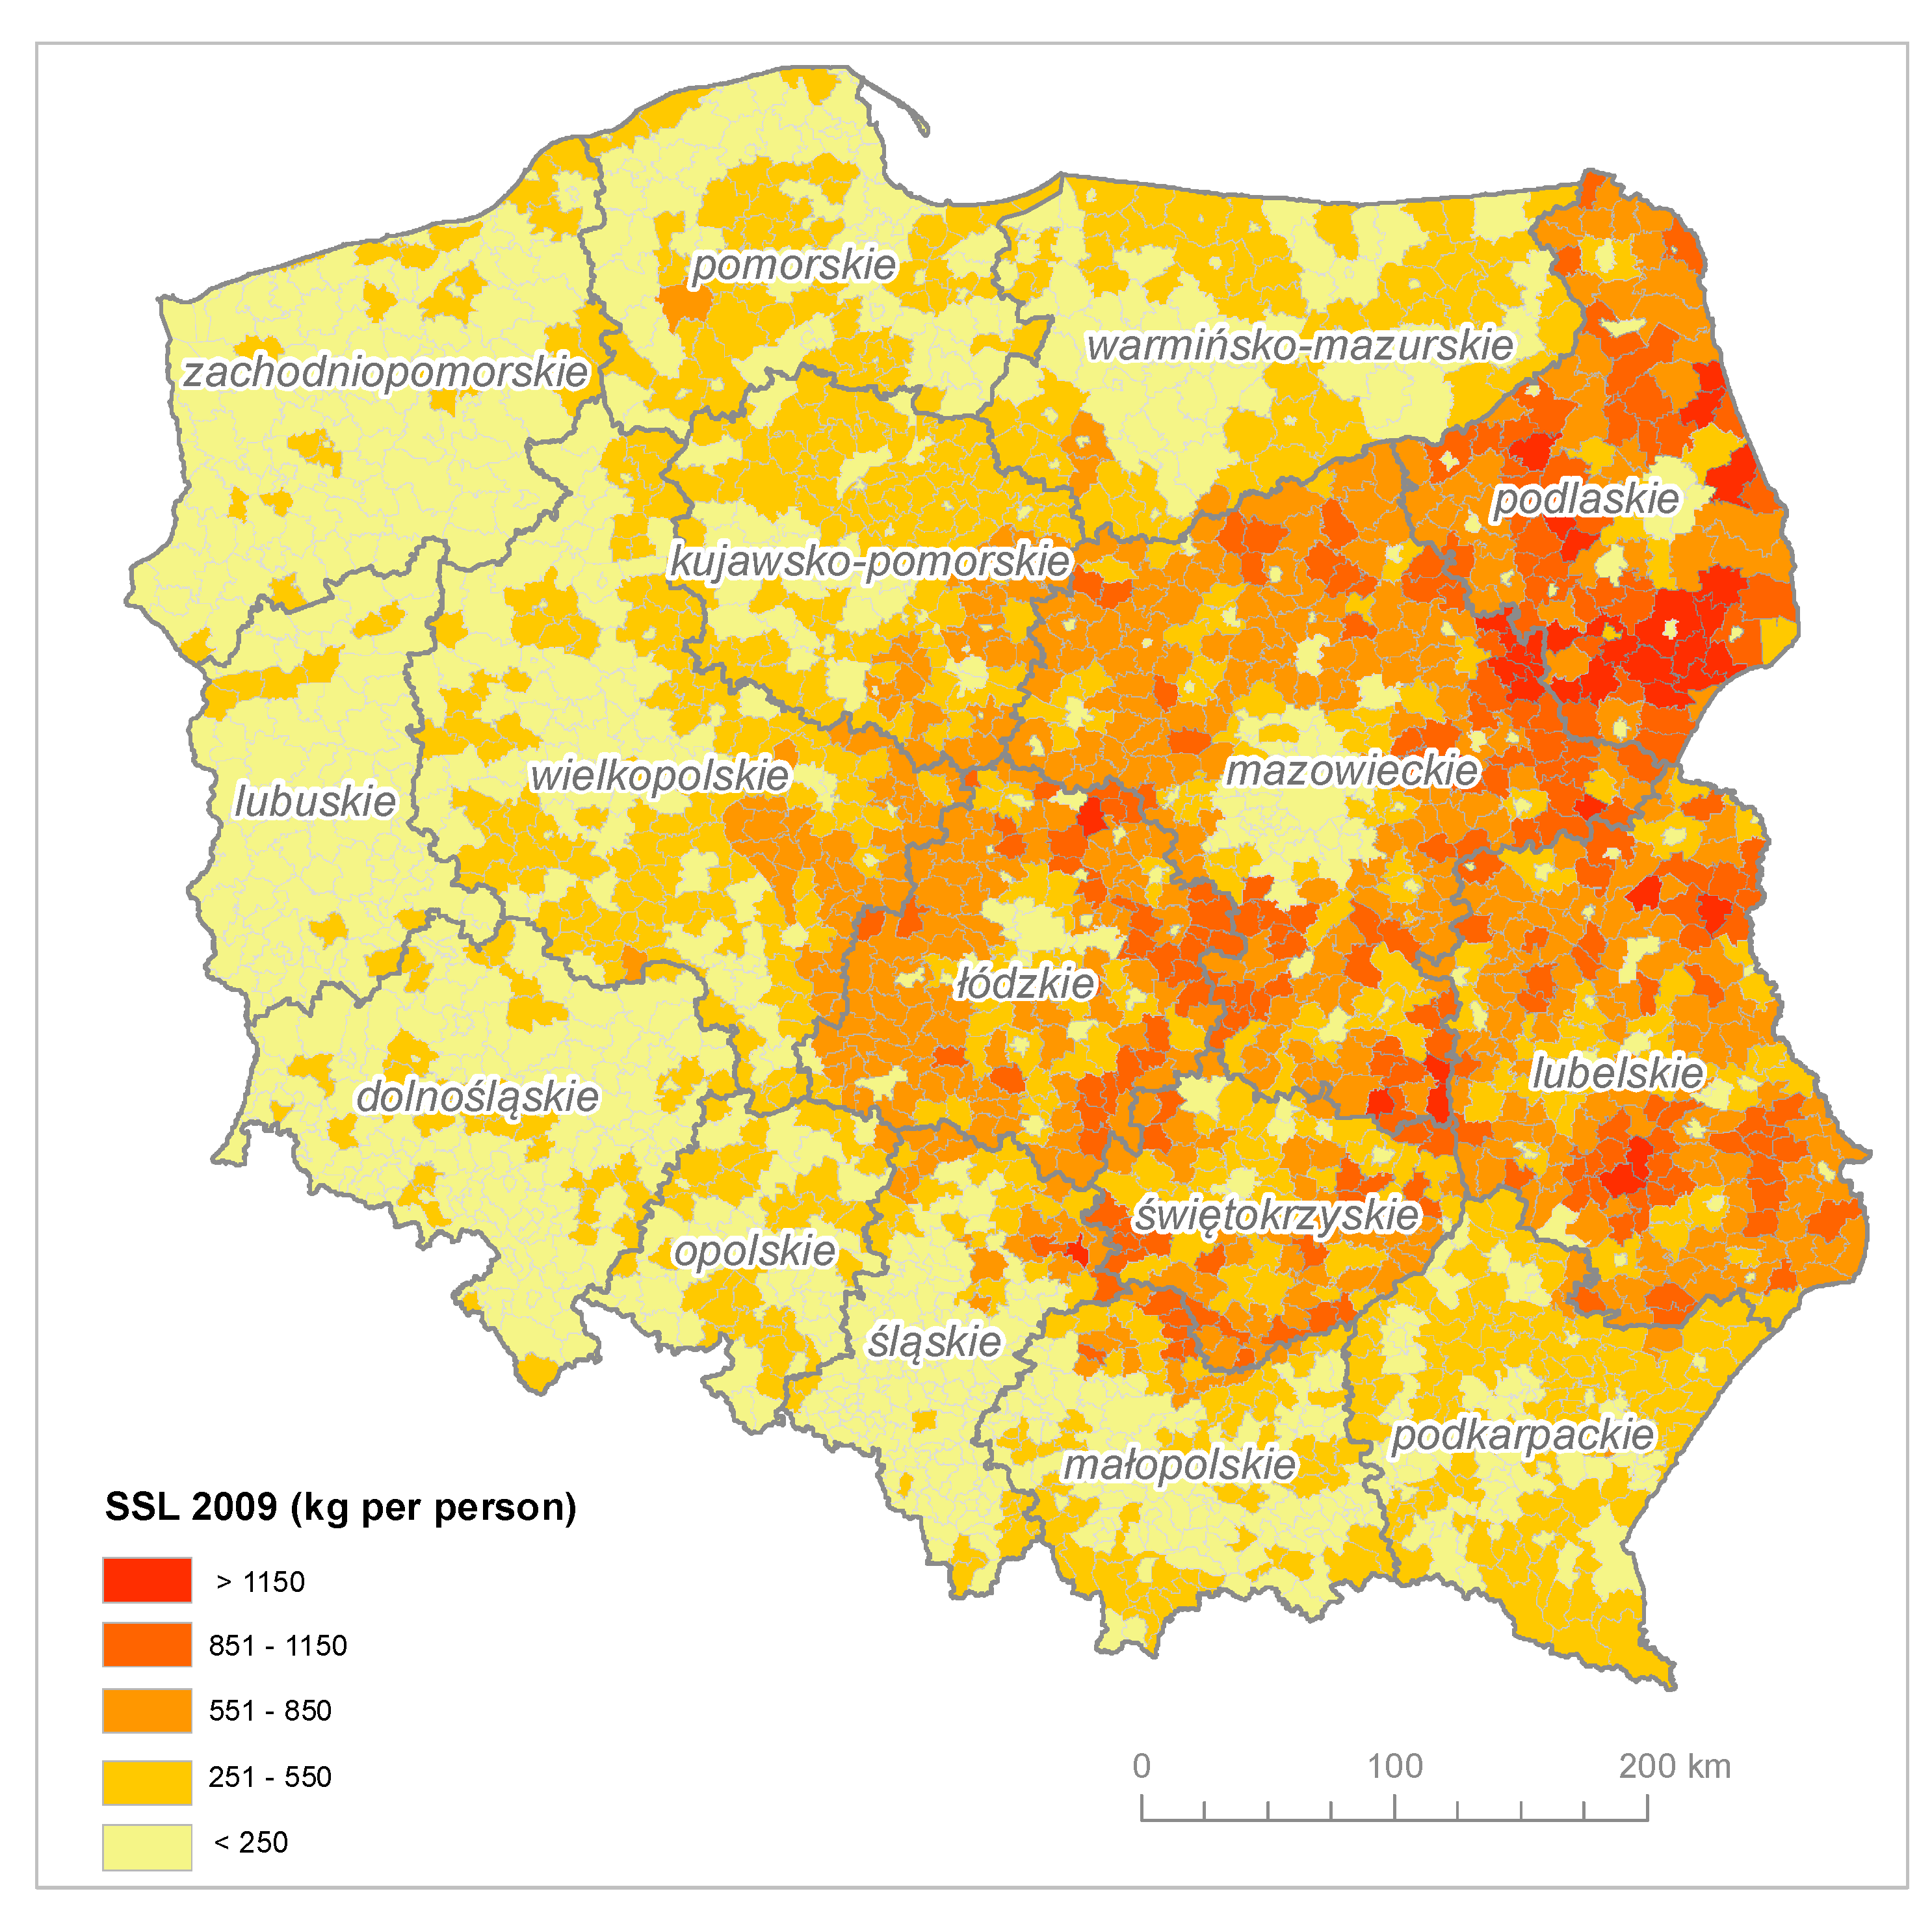
| kg of asbestos–cement products per capita | 0.569 | 0.00018 | 41.697 |
| Province | SSL Estimation Model (tons) | Asbestos Database (tons) | Difference (tons) |
|---|---|---|---|
| Mazowieckie | 1,390,000 | 1,040,811 | 349,189 |
| Lubelskie | 921,011 | 850,436 | 70,575 |
| Łódzkie | 705,605 | 531,553 | 174,052 |
| Wielkopolskie | 691,099 | 511,729 | 179,370 |
| Małopolskie | 566,924 | 286,771 | 280,153 |
| Podlaskie | 500,264 | 404,172 | 96,092 |
| Świętokrzyskie | 495,805 | 378,583 | 117,222 |
| Podkarpackie | 458,703 | 245,378 | 213,325 |
| Śląskie | 456,096 | 239,193 | 216,903 |
| Kujawsko-pomorskie | 416,870 | 375,490 | 41,380 |
| Dolnośląskie | 272,783 | 114,198 | 158,585 |
| Pomorskie | 264,171 | 166,753 | 97,418 |
| Warmińsko-mazurskie | 216,392 | 165,013 | 51,379 |
| Zachodniopomorskie | 174,848 | 110,603 | 64,245 |
| Opolskie | 172,737 | 61,936 | 110,801 |
| Lubuskie | 109,760 | 65,171 | 44,589 |
| Total | 7,813,065 | 5,547,790 | 2,265,278 |
© 2019 by the authors. Licensee MDPI, Basel, Switzerland. This article is an open access article distributed under the terms and conditions of the Creative Commons Attribution (CC BY) license (http://creativecommons.org/licenses/by/4.0/).
Share and Cite
Wilk, E.; Krówczyńska, M.; Zagajewski, B. Modelling the Spatial Distribution of Asbestos—Cement Products in Poland with the Use of the Random Forest Algorithm. Sustainability 2019, 11, 4355. https://doi.org/10.3390/su11164355
Wilk E, Krówczyńska M, Zagajewski B. Modelling the Spatial Distribution of Asbestos—Cement Products in Poland with the Use of the Random Forest Algorithm. Sustainability. 2019; 11(16):4355. https://doi.org/10.3390/su11164355
Chicago/Turabian StyleWilk, Ewa, Małgorzata Krówczyńska, and Bogdan Zagajewski. 2019. "Modelling the Spatial Distribution of Asbestos—Cement Products in Poland with the Use of the Random Forest Algorithm" Sustainability 11, no. 16: 4355. https://doi.org/10.3390/su11164355
APA StyleWilk, E., Krówczyńska, M., & Zagajewski, B. (2019). Modelling the Spatial Distribution of Asbestos—Cement Products in Poland with the Use of the Random Forest Algorithm. Sustainability, 11(16), 4355. https://doi.org/10.3390/su11164355