Abstract
The relationship between export variety and economic growth has been paid much attention in academia. This paper discusses more deeply the relationship between export related and unrelated variety and economic growth, rather than mere export variety. This paper uses the entropy measurement method to measure the level of export variety of Chinese cities and use the concept of “proximity” proposed by Hidalgo to divide the related variety and unrelated variety. Using the panel data of 252 prefecture-level cities in China from 2000 to 2011, we attempt to explore the relationship between export variety, related and unrelated variety and urban economic growth. The empirical results show that it is not export variety as such, but related and unrelated variety that has effects on economic growth. Export related variety has a positive effect on economic growth, while unrelated variety has a negative effect. And there are obvious regional and size differences. The impact of export related and unrelated variety on eastern and coastal cities is greater than that on central and inland cities, and the impact on large-size cities is also greater than that on medium-size cities.
1. Introduction
Since the 1980s, due to the deepening of the international division of labor and the global transfer of manufacturing production activities, the establishment of global production networks and global trading systems has made development among countries closely related. This process is accompanied by the rise of emerging regions and the decline of old regions. Since the reform and opening up, China has actively developed an export-oriented economy and has become a major trading country in the world, creating a miracle of growth. In 2016, China’s exports amounted to $2.1 trillion, accounting for 13.2% of the global share. Among them, the eastern region accounted for 84.94% of the national total. The concentration of trade activities in the eastern region has driven the rapid development of the eastern urban economy and shaped the pattern of regional development in China.
The Export-led Growth Hypothesis has been validated by numerous theoretical and empirical studies from different aspects, of which variety is an important perspective. The key role that variety plays in promoting economic growth is knowledge spillovers, which is also the most debated key issue in academia. Although a number of existing domestic and international empirical researches have studied the impact of variety on economic growth, it is still not very clear how to truly measure variety and what the impact of different varieties on economic growth is. With the development of relevant theories, academia has had a deeper understanding of variety, proposing the concept of related variety and unrelated variety [1], and gradually realizes that the real promotion of economic growth is related variety instead of simply variety. The related variety refers to the variety of related categories, while the unrelated variety refers to the variety of unrelated categories [1]. The relatedness here is multi-dimensional, including production, technology, labor resources and so on. Take industry, for example, the textile and clothing industry can be considered as two related industries, and the variety of these related categories is related variety. The clothing industry and automobile industry are two completely different types of industries, and the variety of these unrelated categories of industries is an unrelated variety. Therefore, how to judge the relatedness is critical and not easy for this research. In 2007, Hidalgo [2] proposed the concept of proximity in the product space to represent product relevance, and this study provides a new method for empirical research on related variety. Compared with the traditional standard classification method commonly used before, some empirical research has shown that the new method is more effective [3]. Therefore, the research of Hidalgo has opened a new chapter for the research of related variety.
Related variety and unrelated variety were first proposed from the industrial structure [1]. Therefore, the research on related variety is mainly concentrated in the industrial structure, while the attention on the export structure is not enough. As a typical representative of export-driven economic growth, the effect of China’s export structure on its economic growth is worthy of attention. In view of the rapid economic growth and the imbalance of regional economy brought by China’s export trade, this paper tries to deal with three questions. First, we analyze the spatial–temporal evolution characteristics of export variety of Chinese cities from 2000 to 2011. Second, we explore the relationship between export variety, related and unrelated variety and economic growth. And third, we investigate the effects of export related and unrelated variety on economic growth in cities of different geographic regions and sizes. We hope that we can provide a sample of China’s regional development for relevant academic research and provide some policy recommendations on how to promote urban economic development by adjusting the structure of export trade.
The paper is organized as follows. The second section summarizes the researches on the relationship between export variety and economic growth. We focus on the theoretical explanation of variety on economic growth and raise our research questions in the summary of empirical results and measurement methods. Next, we introduce the empirical research data, method, estimation model and variables. The fourth section shows spatial and temporal evolution characteristics of China’s urban export variety, as well as related and unrelated variety. In the empirical section, we verify the relationship between export variety and economic growth from national, regional and size samples. The last section concludes and guides policy implementation.
2. Export Variety and Economic Growth
The export-driven economic growth hypothesis holds that export trade is an important driving force for economic growth, and different theories give explanations from multiple perspectives. The traditional trade theory, represented by Ricardo’s relative comparative advantage and the factor endowment of the Heckscher–Ohlin model, starts with the assumption of perfect competition, homogenous products and constant returns to scale, and holds that a specialized export structure is more conducive to economic growth. In the early 1980s, with the global industrial transfer and construction of global production networks, intra-industry trade [4] became the mainstream of global trade activities. Traditional trade theory was limited by the phenomenon of inter-industry trade and could not explain the new trade phenomenon, so the new trade theory came into being [5]. Based on the assumption of monopolistic competition, differentiated products and economies of scale, the new trade theory attempts to explain the new phenomenon of intra-industry division and trade, and believes that product variety is a new perspective to explain the role of trade in promoting economic growth [6].
The endogenous growth theory also regards the increase of product category as an important way to increase productivity, and the mechanism is that the knowledge spillover effect is generated by “learning-by-exporting” and “learning-by-doing”. In the global trade competition environment, enterprises must learn the production technology, management and marketing from developed countries in order to obtain profits. With the improvement of export variety, more enterprises can learn new knowledge in this process and help domestic enterprises improve their technology, management and marketing level. This spillover effect can promote economic growth [7,8]. Herzer and Nowak-Lehmann [9] empirically demonstrated that the impact of export variety on economic growth was exerted through the “learning-by-exporting” and “learning-by-doing” effects, using Chile’s time series data. In addition, export variety also has the function of “demand discovery” and “cost discovery”. Only through as many export activities as possible can enterprises obtain low-cost elements for production in the international and domestic markets [10] and understand the potential needs of foreign companies [11]. There are also some theories that explain the mechanism of export diversification for economic growth from the perspective of risk dispersion and stability. These theories hold that export variety can reduce the adverse effects caused by changes in international market demand or price changes through “the portfolio effect”, which is conducive to economic stability and growth [12].
With the maturity of variety measurement methods and the availability of export trade data, empirical researches on export variety and economic growth are becoming increasingly abundant. Most empirical studies have concluded that export variety is conducive to economic growth. From a transnational scale, Al-Marhubi [13], Funke and Ruhwedel [14] and Agosin [15] used multiple national panel data to demonstrate that export variety was positively correlated with per capita output or unit capital output. Similarly, Feenstra et al. [16], Feenstra and Kee [17] and Hammouda et al. [18] also proved that export variety can promote productivity improvement. From a single-country perspective, Herzer and Nowak-Lehmann [9] and Arip et al. [19] took Chile and Malaysia as examples, respectively, and used time series analysis to show that export variety promoted economic growth in both countries. From the perspective of the internal region of the country, Guerrieri and Jammarino [20] empirically found that regions with high export variety had the highest economic growth rate. In addition, there are still some empirical results that do not support the positive effects of export variety on economic growth. The research of Bebczuk and Berrettoni [21] showed that the increase of export variety in Latin American countries did not lead to GDP expansion. Ferreira and Harrison [22] showed that there was no long-term relationship between Costa Rica’s export variety and economic growth. Some other studies concluded that there was a “U”-shaped curve relationship between export variety and economic growth [23,24,25]. In recent years, academia has also gradually paid attention to the impact of export variety on China’s economic growth. Feng Fan [26], Han Jian [27], Zhang Mingzhi et al. [28] and Zhou Fei and Sun Xiaodan [29] empirically demonstrated that China’s export variety had a significant role in promoting economic growth at the national level. Liu Xiuyan and Wuyan [30] used provincial units as research samples, and the result also supported the conclusion that export variety promoted economic growth.
In the process of research on variety, some scholars divided variety into related variety and unrelated variety and studied the impact of these two on economic growth [1,3,31]. Related variety considers the possibility of relationship among individuals in the structure and believes that related individuals are more prone to knowledge spillovers, thus promoting economic growth [32]. However, due to the great difference among unrelated individuals, it is difficult to learn from each other and gain knowledge spillover. According to evolutionary economic geography, whether knowledge spillover can occur among different individuals depends on the size of cognitive distance between different individuals [33]. Cognitive proximity within a certain range can guarantee the occurrence of learning behavior and knowledge spillover. Therefore, the higher the level of related variety in a region, the greater the possibility of knowledge transfer between different individuals and promoting economic growth. On the contrary, for regions with high levels of unrelated variety, the differences between individuals are too large; that is, the cognitive distance is too large, so learning behavior is difficult to occur, and the level of knowledge spillover is low. At the same time, a high level of unrelated variety can further lead to inefficiencies in organizational, social and institutional aspects, thereby limiting economic growth.
Since Frenken et al. first proposed related and unrelated variety of industrial structure, many scholars have paid attention to the impact of related and unrelated variety on economic growth, innovation and other aspects [34,35,36,37,38,39]. Frenken et al. [1] used the Netherlands data from 1996 to 2002 and found that both related variety and unrelated variety could promote regional economic growth but with different mechanisms. Related variety enhance employment growth, while unrelated variety dampens unemployment growth. Fritsch and Kublina found that the West German regions benefit from both varieties and unrelated variety have moderating effects on regional growth through regional absorptive capacity and new business formation [37]. With the recognition of related variety and unrelated variety in academia, scholars have extended it to many other studies, like export structure and innovation structure, paying more and more attention to the impact of different types of structures on growth. Research on the impact of export related and unrelated variety on economic growth is one of the branches. Saviotti and Frenken [40] used data of 20 OECD countries to demonstrate that related variety could promote the growth of GDP per capital in the short term, while the unrelated variety had a significant time lag in promoting economic growth. Boschma and Iammarino′s [41] research in Italy also supported the view that the related variety of export products contributed to regional economic growth. Ihtisham ul Haq and Zhu Shujin [42] found that both related variety and unrelated variety had a positive effect on Pakistan’s economic growth. Their estimation also showed that the magnitude of related variety was more than unrelated variety. At present, there are few studies on related variety and unrelated variety in China. Zhu Shujin et al. [43] used the HS4 code customs import and export data and entropy index to describe related variety and unrelated variety. This research showed that related variety was conducive to economic growth, and unrelated variety could restrain economic growth.
The concept of related variety expands the research of variety, and how to judge relevance becomes the key to influence research results. Standard classification is the most common method used in the early stage of the study. Taking the national economic industry classification as an example, if the two-digit code is unrelated, then the three-digit code is related. Since the standard classification itself is artificially classified according to the similarity characteristic, the measurement method has the suspicion of prior judgement and cannot truly reflect the actual situation. So, as an ex-ante judgement, there is a certain deficiency. In 2007, the concept of proximity proposed by Hidalgo et al.’s [2] study on product space provided a more rational approach to empirical research on variety. He defined proximity as the probability that two products have a comparative advantage at the same time, that is, the relevance between products. Relevance and irrelevance can be judged by determining the threshold of proximity. If the proximity between two products is greater than the threshold, it is defined as relevance; otherwise it is irrelevant. Threshold judgement based on proximity is an ex post fact judgement, which is more in line with the actual situation. Boschma and Minondo [3] used the standard classification and proximity threshold judgement to describe the related and unrelated variety of Spanish exports. The empirical results showed that export related variety could promote regional economic growth, and compared with the traditional standard classification, the proximity threshold judgement was more effective.
It is not difficult to find that China’s research on export variety and economic growth mainly concentrate on the national or provincial level, but little at the city level. Besides, little attention has been paid to the different types of variety in the export structure, that is, related variety and unrelated variety. So, there is little research on the relationship between related variety, unrelated variety and economic growth. What is more, most existing researches directly judge if the relationship is relevant or not by standard classification, which is not necessarily consistent with the direct situation, leading to differences in research results. Combing relevant theories and empirical research, this paper selects the customs-trade data at the city level and uses Hidalgo′s method based on the proximity threshold to judge the relevance or not, focusing on the relationship between export variety, related variety and unrelated variety of Chinese cities and economic growth.
3. Data Source and Methodology
3.1. Data Source and Measurement Method of Export Variety
3.1.1. The Customs Trade Data
The customs trade data is the most intuitive data source for measuring the export structure of a region. It divides the products into 22 categories, 98 chapters and more than 1200 items, represented by HS codes. To measure the export structure of Chinese cities, we extracted export data from 2000 to 2011 from the China Customs Import and Export Database. This database records the output value of imports and exports in each city. We can directly measure the export variety of each city through this data. As for export related and unrelated variety, we follow Hidalgo et al.’s [2] method to calculate the proximity to determine whether it is related or not, instead of the traditional standard classification. Therefore, we also use the international customs trade data from 2000 to 2011, which has two data sources. The international customs trade data of 2000 is from the “World Trade Flows: 1962–2000” database compiled by Robert Feenstra and Robert Lipsey [44]. The international customs trade data from 2001 to 2011 comes from the United Nations COMTRADE database. The international customs trade data records the links between import and export trade from various countries around the world. It is a complete trade loop on a global scale which can be used to measure the proximity between products. Both the international customs trade data and the Chinese customs trade data use HS codes, which enables us to connect the two sets of data with the four-digit HS code for calculation.
3.1.2. The Measurement Method of Export Variety
This paper uses the entropy measure commonly accepted by academia to calculate export variety (abbreviated V):
where V is the entropy value, indicating the degree of export variety, and the larger the V value, the higher the variety level; is the proportion of the export value of a city’s product i to its total export value; and N is the total number of products in a certain city.
Instead of using the traditional standard classification, this paper uses the method of proximity proposed by Hidalgo et al. [2] to judge relatedness or not. Hidalgo et al. define product proximity(ψ) as the probability that two products of a country have a comparative advantage at the same time (Equation (2)). Meanwhile, referring to Boschma and Minondo [3] and Neffke et al. [45], taking 0.25 as the threshold, the proximity (ψ) greater than or equal to 0.25 is defined as correlation, and less than 0.25 is defined as non-correlation.
where represents the proximity between product i and product j, and the range is (0–1). The larger the value, the higher the correlation between the two products; and represents the conditional probability that a product i has a comparative advantage at the same time while the product j has a comparative advantage.
This paper uses the concept of proximity to judge the relevance and calculates the related variety (abbreviated RV) and unrelated variety (abbreviated UV) of the city based on the entropy measurement. Firstly, according to the international customs trade data from 2000 to 2011, the product proximity matrix is calculated, and related type set and unrelated type set of the product are delineated by the threshold value of 0.25. Assuming a city has n products, the city has n sets of related types and n sets of unrelated types. Secondly, the internal variety of each related type set and unrelated type set in each city is calculated according to the entropy measurement. Finally, a weighted average of the internal variety of n related or unrelated type set of each city is the related or unrelated variety of each city. The specific calculation formulas are as follows:
where is the export proportion of each product i in each city; is the sum of the export proportion of all products i in each related or unrelated type set; and is the internal variety index of each related or unrelated type set.
3.2. The Estimation Model
3.2.1. Model Specification
We adopted the Cobb–Douglas production function with two factors (capital and labor) as the theoretical basis of the empirical model of urban economic growth:
where represents the total GDP; represents the technical level; and represent the input of capital and labor; represents a city; and represents time.
To build an estimation model based on per capita level, we divide Equation (6) by and differentiate to get Equation (7):
In view of the “learning-by-export” and “learning-by-doing” effects of export variety, we assume that the export variety affects the urban economic growth by affecting the technological level:
We can obtain the basic structure of the empirical model in this paper based on Equations (7) and (8):
3.2.2. Variables Definition
In this paper, the explained variable is the logarithm of GDP per capita at time t. We use the GDP per capita at constant prices in each city as the measure of urban economic growth. To get the actual GDP per year, we choose 2000 as the base period and adjust GDP by the provincial GDP index. The export variety (V), related variety (RV) and unrelated variety (UV) are the main explanatory variables to explore its relationship with economic growth. Capital stock per capita (K/L), as the representative of capital and labor, becomes the most important control variables in this paper. Since there is no direct capital stock data, this paper uses the perpetual inventory method to calculate the capital stock based on the fixed asset investment data. The specific steps are as follows. Firstly, the capital stock of cities in 2000 is estimated according to , where is the fixed asset investment of city j in 2000, is the average growth rate of fixed assets investment in city j from 2000 to 2011, and δ is the depreciation rate of capital and takes the 9.6% adopted by Zhang Jun et al. [46]. Then we calculate the nominal capital from 2000 to 2011 according to . Finally, we use the provincial fixed asset investment price index to smooth out and obtain the actual stock data based on the year 2000. Besides, we also consider the promotion effect of urbanization economy on economic growth, so we choose population density (PD) as another control variable. All these urban socio-economic data are from the China City Statistical Yearbook (2000–2011) [47] and statistical yearbooks of some cities. Due to the lack of some cities in some year, this paper finally selects 252 cities in the empirical model.
4. Temporal and Spatial Evolution Characteristics of Export Variety in Chinese Prefecture-Level City
4.1. Export Variety Spatial Distribution Characteristics
In general, the export variety level of Chinese cities shows the spatial characteristics of “high east and low west, high coastal and low inland, high provincial capital and low non-provincial capital” (Figure 1). Specifically, the average export variety of Chinese cities in 2011 is 4.70, the average of eastern, central and western cities is 5.42, 4.46 and 3.73, respectively, and the average of coastal and inland cities are 5.38 and 4.34, respectively (Table 1). From the perspective of an individual city, there are 72 cities with an export variety level higher than 6, most of which are located in the eastern coastal areas, such as the Pearl River Delta, Fujian Xia–Zhang–Quan, the Yangtze River Delta, Shandong Peninsula and Beijing–Tianjin–Hebei region. A few are the provincial capitals of central and western China, such as Zhengzhou, Changsha, Lanzhou, Urumqi, Chengdu and Kunming, etc. The overall characteristics of export related variety and unrelated variety in Chinese cities in 2011 are consistent with export variety, both presenting a spatial pattern of “high east and low west, high coastal and low inland, high provincial capital and low non-provincial capital” (Figure 2 and Figure 3).
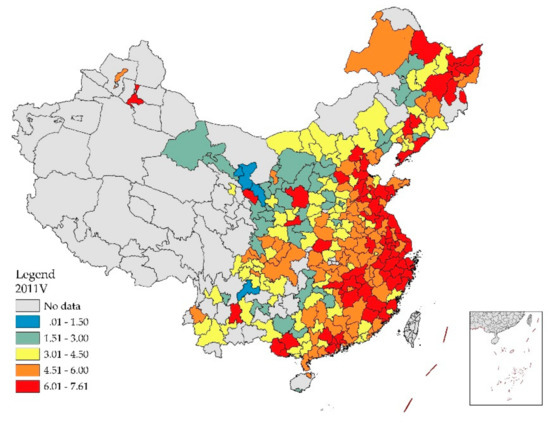
Figure 1.
Spatial distribution of export variety in Chinese cities in 2011.

Table 1.
The export variety, related variety and unrelated variety in Chinese cities in 2011.

Figure 2.
Spatial distribution of export related variety in Chinese cities in 2011.
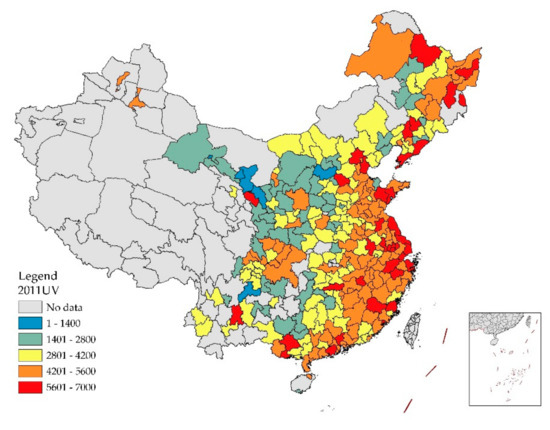
Figure 3.
Spatial distribution of export unrelated variety in Chinese cities in 2011.
In order to further describe the spatial characteristics of related variety and unrelated variety, this paper takes the mean of two indicators as the standard, and divides them into four types, RV high–UV high, RV low–UV high, RV low–UV low and RV high–UV low, corresponding to the four quadrants of the scatter plot respectively (Figure 4). The spatial distribution (Figure 5) are as follows: (1) the first quadrant has 123 cities in total (43.2%), mainly concentrated in the eastern coastal area, and a small amount distributed in the central and western capital cities of Anhui, Hunan. This kind of city’s outward-oriented economy has obvious positive effects, with diverse types of export products and an interrelated product cluster; (2) there are 16 cities(5.6%) in the second quadrant, most of which are small and medium-sized cities and scattered in the central and western regions, and the types of export products are dispersive; (3) a total of 117 cities (41.1%) in the third quadrant are located in the southwest and northwest regions, where these cities’ export product structure is single and the correlation between products is weak; and (4) there are 29 cities (10.1%) in the fourth quadrant, scattered in the central and western regions. Although the types of export products are not diversified, the correlation between products is strong, such as special agricultural and sideline products, as well as mineral resource products.

Figure 4.
Scatter plot of the export related variety and unrelated variety in Chinese cities in 2011.
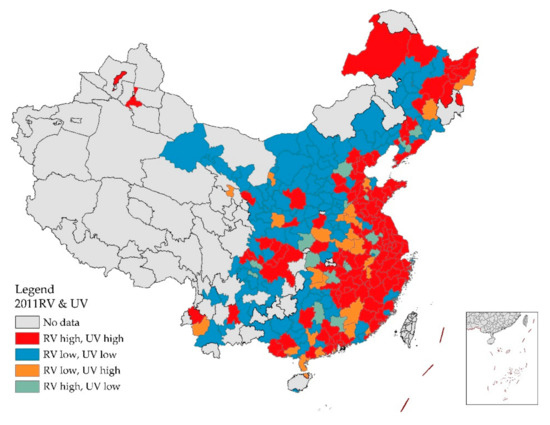
Figure 5.
Spatial distribution of the four-quadrants of export related variety and unrelated variety in Chinese cities in 2011.
4.2. Temporal Evolution Characteristics of Export Variety
Since China officially joined the World Trade Organization (WTO) in 2001, its import and export trade links with other countries have been strengthened constantly. The development process of more than ten years has created the prosperity of “Made in China”. With the changes in the breadth and depth of export trade, the export variety of Chinese cities has also changed. From 2000 to 2011, the overall export variety level of Chinese cities showed an upward trend (Figure 6). Variety increased from 4.09 in 2000 to 4.70 in 2011, with an average annual growth rate of 1.26%. Related variety increased from 495.21 to 761.41 in the same period, with an average annual growth rate of 3.99%, and unrelated variety increased from 3916.01 to 4027.40, with an average annual growth rate of 0.26%.
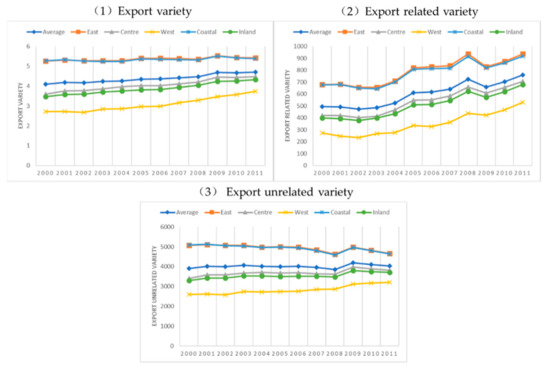
Figure 6.
Changes of export variety, related variety and unrelated variety in Chinese cities in 2000–2011.
The change of export variety at the regional level is slightly different. Variety and related variety show that the amount of increase and the growth rate of central, western and inland cities are higher than eastern cities and coastal cities, while unrelated variety shows a trend of a decline in eastern and coastal cities, but growth in central, western and inland cities (Table 2). The rise of export variety means that since China joined the World Trade Organization (WTO) in 2001, its export products have been increasingly diversified, and its export structure has been continuously improved. The differences in the magnitude and rate of change in the eastern, central and western, coastal and inland cities indicate that while the eastern coast maintain the steady development of their export advantages, the export trade of the inland cities in central and western regions has also begun to catch up.
Table 2.
Changes of export variety, related variety and unrelated variety in Chinese cities in 2000–2011.
From the data analysis above, it can be seen that the trend of export variety in different regions was slightly different from 2000 to 2011. In order to describe the related and unrelated variety changes of different cities in detail, this paper divided cities into four types according to whether the two indicators increased or not from 2000 to 2011: RV increasing–UV increasing, RV decreasing–UV increasing, RV decreasing–UV decreasing and RV increasing–UV decreasing, corresponding to the four quadrants of the scatter plot, respectively (Figure 7). From the urban spatial distribution (Figure 8), there are 138 cities (48.4%) in the first quadrant, mainly distributed in the central and western regions like Hunan, Henan, Sichuan and Gansu provinces. Under the guidance of developing an export-oriented economy, these cities’ manufacturing system has been continuously improved, and as a result, the types of export products have been continuously enriched and the relevance between products has been constantly improved. And finally, some product clusters have been initially formed. By contrast, the number of cities in the second quadrant and the third quadrant is relatively small, with 6 (2.1%) and 37 (13.0%), respectively. They are mainly scattered in the central and western regions. The export variety does not increase but decreases, which may indicate that the industrial development direction of these cities is unclear, and the types of export products are dispersed. Besides, there are 104 cities in the fourth quadrant (36.5%), mainly concentrated in the eastern coastal areas. Relying on the good manufacturing base, the cities in this region give full play to the driving role of an export-oriented economy, continuously expanding the export scale, optimizing the export structure and improving the related variety level while reducing the unrelated variety level.

Figure 7.
Scatter plot of the export related variety and unrelated variety in Chinese cities in 2000–2011.

Figure 8.
Spatial distribution of the four-quadrants of export related variety and unrelated variety in Chinese cities in 2000–2011.
5. Empirical Results
Based on the panel data of 252 prefecture-level cities in 2000–2011, this paper explores the relationship between export variety and economic growth. Firstly, taking 252 cities across the country as samples, different combinations of the main explanatory variables were added into the model to obtain the results of the national overall samples (Table 3). Secondly, to further explore the geographical differences between export variety and economic growth, model estimates were made for 108 eastern cities, 101 central cities, 43 western cities, 91 coastal cities and 158 inland cities, respectively (Table 4). Thirdly, considering the difference of the agglomeration effect of different scales, this paper divided the 252 cities into three categories according to the number of permanent residents in urban areas. Those whose urban area have more than 1 million permanent residents are large-size cities, 500,000–1 million are medium-size cities, and less than 500,000 are small-size cities. There are 117 large-size cities, 100 medium-size cities and 35 small-size cities (Table 5). In order to ensure the credibility of the regression results, the unite root test and co-integration test was carried out on the panel data before national sample and sub-sample regression. The LLC test is the most common and effective method of the unit root test, while the Kao test is the most important method of co-integration test. The LLC test shows that all variables reject the null hypothesis of the unite root at the 1% significance level, indicating that the panel data is stable. The ADF statistic result of the Kao test in the co-integration test is 7.1486, and the null hypothesis of a no co-integration relationship is rejected at the 1% significance level, indicating that there is a long-term stable co-integration relationship between the variables. In addition, the residual error of the estimated equation is stable, and the estimated result is credible. In this paper, the Hausman test is used to determine whether the panel regression model chooses a fixed effect or a random effect. The results show that all models in Table 3, Table 4 and Table 5 reject the null hypothesis of random effects at the 1% significance level. Therefore, all models in this paper adopted the fixed effect model.
Table 3.
Regression model results of 252 Chinese urban samples.
Table 4.
Regression model results of eastern, central and western, coastal and inland urban samples.
Table 5.
Regression model results of large-size, medium-size and small-size urban samples.
5.1. Analysis of Regression Model Results of National Samples
Table 3 shows the regression model results of national samples. Model (1) is the theoretical basis model of this paper. The result shows that the capital stock per capita not only passes the 1% significance test, but also has an explanatory degree of 91.88% of GDP per capita. The coefficients of capital stock per capita in Model (1) to (6) are all positive, and the six models all pass the 1% significance test, which indicates that capital stock per capita has a stable positive promotion effect on economic growth. It is consistent with the traditional view of economic growth from the perspective of factors. In addition, population density as an intuitive representative of an agglomeration economy is also significantly positive at the 5% level in Models (2)– (4). Population density plays a positive role in promoting economic growth, which is in line with the logic of agglomeration economy.
When we added export variety separately in the basic model, Model (5) shows that the export variety passes the significance test at the 10% level. The estimated coefficient is also positive. When we both consider the export variety and population density in Model (3), the estimated coefficient of export variety is still positive, but does not pass the significance test. This shows that although the export variety has a positive effect on urban economic growth, the promotion effect is not stable. Models (4) and (6) show that related variety and unrelated variety have a diametrically opposite effect on economic growth. In these two models, the related variety and GDP per capita both pass the significance test at the 1% level. Additionally, the related variety increased by one unit on average, and the GDP per capita increased by 0.0923 and 0.093 units, respectively. Unrelated variety and GDP per capita are significantly negative at 1%. Besides, unrelated variety increased by one unit on average, and GDP per capita will decline by 0.133 units. The robustness of the results of related variety and unrelated variety in Models (4) and (6) also indicates that both have significant and stable effects on urban economic growth. The instability of export variety in Models (3) and (5) suggests that it is not the simple export variety, but export related and unrelated variety that have impacts on economic growth. It is worth emphasizing that the impact of related and unrelated variety on economic growth is different.
5.2. Analysis of Regression Model Results of Eastern, Central and Western, Coastal and Inland Cities
In order to further explore the relationship between export variety and economic growth in different regions, this paper separately estimates the samples of the eastern, central and western, coastal and inland cities (Table 4). For the export variety, it all fails the significance test in the eastern Model (1), central Model (3) and western Model (5). In the coastal Model (7) and inland Model (9), the export variety only passes the significance test at the 10% level in the inland cities. These results, to some extent, once again illustrate the instability of export variety in promoting urban economic growth.
In the eastern Model (2) and central Model (4), the related variety and GDP per capita are both positive at the 1% significance level, while it fails the significance test in the western Model (6). Unrelated variety all passes the significance test in the eastern and central and western cities, among which the eastern and central models pass at the 1% level, and the western model passes at the 5% level. And the estimated coefficients were all negative in three models. The results show that the related variety has a positive effect on the economic growth of the eastern and central cities, while the unrelated variety has a negative effect on the economic growth of eastern, central and western cities. In terms of the estimated coefficients, the related variety (0.278) in the eastern cities is higher than that in the central cities (0.0867), and the unrelated variety in the eastern cities (−0.488) is successively higher than those in the central cities (−0.125) and the western cities (−0.0408). It indicates that the effect of related variety on economic growth is eastern cities > central cities, while the effect of unrelated variety on economic growth is eastern cities > central cities > western cities. In the coastal Model (8) and inland Model (10), both related variety and unrelated variety passed the significance test of 1%, and the impact of related and unrelated variety on economic growth of coastal cities (0.273/−0.468) is greater than that of inland cities (0.0612/−0.0796).
5.3. Analysis of Regression Model Results of Urban Samples of Different Sizes
In order to explore the relationship between export variety and economic growth in cities of different sizes, this paper estimates samples of large-size cities, medium-size cities and small-size cities, respectively, and obtains the regression of model results in Table 5. As shown in large-size Model (1), medium-size Model (3) and small-size Model (5), the export variety only passes the significance test at the 1% level in the large-size cities, while it fails the significance test in the medium-size and small-size cities. This suggests that export variety in large-size cities has played its role in promoting economic growth, while the export variety in medium-size and small-size cities has not yet played its role. On average, for every unit increase of export variety in large-size cities, per capita GDP increases by 0.0919 units.
Export related variety and unrelated variety also have different effects on urban economic growth in cities with different sizes. The two variables both pass the significance test at the 1% level in large-size Model (2) and medium-size Model (4), which indicates that related variety has positively promoted economic growth in large-size and medium-size cities while unrelated variety has a negative impact on them. The two variables fail to pass the significance test in small-size Model (6), which may have two possible explanations. The first is probably because the sample size of the small-size cities is too small to pass the model test, which is only 35. Another possibility is that the agglomeration effect of export in small-size cities is not enough to play its role in promoting economic growth. The estimated coefficients of related variety (0.151) and unrelated variety (−0.198) in the large-size cities are higher than those in the medium-size cities (0.117/−0.170), indicating that the effect of related variety and unrelated variety on economic growth in large-size cities is stronger than that in medium-size cities.
All models in the table above are estimated using stata15. The numbers in brackets are the “t” of the estimated coefficient. ***, ** and * represent significance at the 1%, 5% and 10% level, respectively.
5.4. Mechanism Interpretation of Empirical Results
The empirical results show that there are significant regional and size differences in the effect of export variety on the economic growth of Chinese cities. In terms of regional differences, export variety has no significant effects on the eastern, central, western and coastal cities, but a small promoting effect on the inland cities. Both related variety and unrelated variety have a significant effect on the eastern, central, coastal and inland cities, but the influence on the eastern and coastal cities is much stronger than that of the central and inland cities. In terms of size differences, export variety has a significant positive effect on large-size cities, while it has an insignificant effect on medium-size and small-size cities. Both related variety and unrelated variety have a significant effect on large-size and medium-size cities, but their effect on large-size cities is higher than that of medium-size cities. The regional and size differences of the mechanism of export variety are closely related to the rise of China’s economy and the driving force of urban development. After the reform and opening up, China began to gradually implement the export substitution strategy. With its superior geographical conditions, policy advantage and large amounts of foreign capital, the eastern coastal areas gave full play to the comparative advantages of production and manufacturing, vigorously developing an export-oriented economy, and continuously expanding the categories and scales of export products and realizing the transformation of the export structure from single raw materials to primary industrial products. However, the export economy in the central and western cities is relatively slow due to congenital conditions.
Along with the agglomeration of a larger number of foreign-funded enterprises and local enterprises, the export variety in the eastern and coastal areas, especially the related variety level, has been continuously improved. On the other hand, with the formation of the industrial clusters, the unrelated variety in the eastern and coastal areas is decreasing gradually. Under the effects of “learning-by-exporting” and “learning-by-doing”, the knowledge spillover effect of enterprises is significant, which promotes the rapid economic growth of the eastern and coastal areas. The central inland areas started relatively late, and gradually developed a manufacturing industry by the process of undertaking the industrial transfer in the eastern and coastal areas, and so the role of export related variety in promoting economic growth has gradually emerged. In order to reduce the regional economic development differences, China proposed the develop-the-west strategy in 1999 but was limited by the phenomenon of the “resource curse”. As a result, the small-size and medium-size cities in the western inland still suffer from a self-sufficient single economic development model, and rarely engage in export trade activities. The export structure is also dominated by primary products based on local resources. The overall level of urban export variety is low and it therefore cannot play its role as a driver of economic growth, only related variety can promote its economic growth.
6. Conclusions and Policy Implementation
While summarizing the temporal and spatial characteristics of export variety at the prefecture-level cities, combined with 2001–2011 panel data, this paper explores the relationship between export variety and economic growth. The research shows that (1) the export variety of Chinese cities presents obvious temporal and spatial differences. Since 1978, China’s long-term implementation of the strategy of giving priority to the development of the eastern coastal areas has led to an overall spatial pattern of “high east and low west, high coastal and low inland, high provincial capital and low non-provincial capital”. With the deepening of China’s reform and opening up, the scope of the export-oriented economy continues to expand from east to west, and from the coast to the interior. From 2000 to 2011, export variety, related variety and unrelated variety of Chinese cities have all improved. In terms of sub-regions, except for the decrease of the unrelated variety in the eastern and coastal areas, all the others have increased. Among them, although the inland cities in the central and western regions have developed relatively late, the magnitude and rate of change are higher than those in the eastern coastal cities; and (2) the empirical results show that it is not export variety as such, but related variety and unrelated variety that has effects on economic growth. Export related variety has a positive effect on economic growth, while unrelated variety has a negative effect. And there are obvious regional and size differences. As for different regions, although export related variety and unrelated variety have significant effects on the economic growth of the eastern, central, coastal and inland cities, the impact on the economic growth of eastern and coastal cities is greater than that of the central and inland cities. In terms of cities of different sizes, the effects of export related variety and unrelated variety on large-size cities are also higher than those of medium-size cities.
From the perspective of policy, China actively promoted the implementation of the export substitution strategy in the process of reform and opening up. The increasing of export related variety has greatly promoted economic growth in China, especially in the eastern coastal areas, and has important policy reference significance for the central and western regions of China and even some developing countries. The different impacts of export variety on economic growth have important policy guiding significance for the export development of Chinese cities. At the present stage, Chinese cities should pay more attention to the optimization of export structure. In recent years, great changes have taken place in the international environment of China’s export trade, especially the outbreak of a “trade war” between China and the United States. As the largest importer from and exporter to the United States, the “trade war” has had a negative impact on China’s export economy to some extent [48]. Therefore, how to continue to promote economic growth through export trade has become an urgent challenge. Under the “One Belt, One Road” strategy, China also should promote the formation of strongly associated export product clusters through the industrial upgrading and transformation of economic development mode and give play to the driving role of high related variety and strong spillover on economic growth. In addition, different regions should implement appropriate export optimization policies based on their own economic development stages and characteristics. For the eastern coastal areas, the transformation and upgrading of traditional manufacturing industries should be actively promoted. Based on the existing multi-industrial system, increase the investment in research and improve the innovation capability of enterprises, guide and cultivate industrial clusters with strong technology linkages and realize the export structure transformation into high related variety and low unrelated variety. Since the products exported to the United States are mainly concentrated in the eastern coastal area, these eastern cities should actively develop new trading partners. The central inland areas should rely on its original manufacturing base, increase investment and strict control of industrial types and promote the formation of multiple industrial clusters in the central region through the dual strategy of accepting industrial transfer and strengthening local innovation, and finally increasing related variety and reduce unrelated variety. Western inland areas should actively undertake the industrial transfer of the eastern coastal areas based on national preferential policies, and focus on the development of processing and manufacturing industries, to gradually establish a relatively complete manufacturing system and realize the transformation of the export structure from a single raw material primary product to a multiple and related primary industrial product. Some western cities should give full play to their regional advantages of the border cities in the region of trade exchange to establish friendly and close trade relations with surrounding cities, and eventually drive the whole economic development of western cities.
This paper starts from the perspective of variety, taking into account the differences in the correlation between products in the export structure, breaking through the traditional standard classification and innovatively introducing the method of judging the correlation based on the proximity concept proposed by Hidalgo et al. [2] to explore the impact of related and unrelated variety in the export structure on economic growth. The existing researches are mostly concentrated on the national scale and the provincial scale. To some extent, this study enriches the discussion on the urban scale. Limited by the availability of data, the research period of this paper is only 2000–2011, resulting in insufficient research on the changes of export variety and its impact on economic growth after the financial crisis and the “trade war”. At present, the role of related and unrelated variety in the industrial structure has been highlighted, but there are still few studies on the aspect of export structure. In addition, the idea and method based on proximity can be applied to describe many structural problems, so as to deeply discuss the influence of different types of structures on regional development. All the above issues deserve further study and discussion.
Author Contributions
Writing—original draft preparation, X.Q.; methodology, S.L.; software, X.Q. and W.X.; visualization, W.X.; writing—review and editing, X.L.; supervision, X.L.; and funding acquisition, X.L.
Funding
This research was funded by [National Natural Science Foundation of China] grant number (41571118).
Conflicts of Interest
The authors declare no conflict of interest. The founding sponsors had no role in the design of the study; in the collection, analyses, or interpretation of data; in the writing of the manuscript, and in the decision to publish the results.
References
- Frenken, K.; Van Oort, F.; Verburg, T. Related variety, unrelated variety and regional economic growth. Reg. Stud. 2007, 41, 685–697. [Google Scholar] [CrossRef]
- Hidalgo, C.A.; Klinger, B.; Barabási, A.L.; Hausmann, R. The product space conditions the development of nations. Science 2007, 317, 482–487. [Google Scholar] [CrossRef] [PubMed]
- Boschma, R.; Minondo, A. Navarro M. Related variety and regional growth in Spain. Pap. Reg. Sci. 2012, 91, 241–256. [Google Scholar]
- Grubel, H.G.; Lloyd, P.J. Intra-Industry Trade: The Theory and Measurement of International Trade in Differentiated Products; Macmillan: London, UK, 1976. [Google Scholar]
- Krugman, P. Scale economies, product differentiation, and the pattern of trade. Am. Econ. Rev. 1980, 70, 950–959. [Google Scholar]
- Feenstra, R.C. Product Variety and the Gains from International Trade; MIT Press: Cambridge, UK, 2010. [Google Scholar]
- Pineres, S.A.G.; Ferrantino, M. The Commodity Composition of Export Portfolios: A Comparative Analysis of Latin America. Lat. Am. Bus. Rev. 2000, 1, 1–15. [Google Scholar] [CrossRef]
- Wu, Y.J.; Zhang, Q.Z. Evolution of Comparative Advantage and Economic Growth—Empirical Analysis Based on Argentina. China Ind. Econ. 2012, 2, 37–46. [Google Scholar]
- Herzer, D.; Nowak-Lehmann, D. FIs there a long-run relationship between exports and imports in Chile? Appl. Econ. Lett. 2006, 13, 981–986. [Google Scholar] [CrossRef]
- Hausmann, R.; Rodrik, D. Economic development as self-discovery. J. Develop. Econ. 2003, 72, 603–633. [Google Scholar] [CrossRef]
- Vettas, N. Investment dynamics in markets with endogenous demand. J. Ind. Econ. 2000, 48, 189–203. [Google Scholar] [CrossRef]
- Brainard, W.C.; Cooper, R.N. Uncertainty and Diversification in International Trade; Cowles Foundation for Research in Economics at Yale University: New Haven, CT, USA, 1970. [Google Scholar]
- Al-Marhubi, F. Export diversification and growth: An empirical investigation. Appl. Econ. Lett. 2000, 7, 559–562. [Google Scholar] [CrossRef]
- Funke, M.; Ruhwedel, R. Export variety and export performance: Empirical evidence from East Asia. J. Asian Econ. 2001, 12, 493–505. [Google Scholar] [CrossRef]
- Agosin, M.R. Export diversification and growth in emerging economies. Cepal Rev. 2009, 97, 115–131. [Google Scholar] [CrossRef]
- Feenstra, R.C.; Madani, D.; Yang, T.H.; Liang, C.Y. Testing endogenous growth in South Korea and Taiwan. J. Dev. Econ. 1999, 60, 317–341. [Google Scholar] [CrossRef][Green Version]
- Feenstra, R.; Kee, H.L. Export variety and country productivity: Estimating the monopolistic competition model with endogenous productivity. J. Int. Econ. 2008, 74, 500–518. [Google Scholar] [CrossRef]
- Hammouda, H.B.; Karingi, S.N.; Njuguna, A.E.; Jallab, M.S. Growth, productivity and diversification in Africa. J. Product. Anal. 2010, 33, 125–146. [Google Scholar] [CrossRef]
- Arip, M.A.; Yee, L.S.; Karim, A.B. Export Diversification and Economic Growth in Malaysia; MPRA: Munich, Germany, 2010. [Google Scholar]
- Guerrieri, P.; Iammarino, S. Dynamics of export specialization in the regions of the Italian Mezzogiorno: Persistence and change. Reg. Stud. 2007, 41, 933–948. [Google Scholar] [CrossRef]
- Bebczuk, R.N.; Berrettoni, D. Explaining Export Diversification: An Empirical Analysis; Department of Economics, Universidad Nacional de La Plata: Argentina, 2006. [Google Scholar]
- Ferreira, G.F.C.; Harrison, R.W. From Coffee Beans to Microchips: Export diversification and economic growth in Costa Rica. J. Agric. Appl. Econ. 2012, 44, 517–531. [Google Scholar] [CrossRef]
- De Benedictis, L.; Gallegati, M.; Tamberi, M. Overall trade specialization and economic development: Countries diversify. Rev. World Econ. 2009, 145, 37–55. [Google Scholar] [CrossRef]
- Imbs, J.; Wacziarg, R. Stages of diversification. Am. Econ. Rev. 2003, 93, 63–86. [Google Scholar] [CrossRef]
- Newfarmer, R.; Shaw, W.; Walkenhorst, P. Breaking into new markets: Emerging lessons for export diversification; The World Bank: Washington, DC, USA, 2009. [Google Scholar]
- Feng, F. Trade Structure and Economic Growth: An Empirical Study. Nanjing J. Soc. Sci. 2012, 4, 39–45. [Google Scholar]
- Han, J. Export Diversification and Economic Growth in China. J. Int. Trade 2009, 8, 23–29. [Google Scholar]
- Zhang, M.Z.; Lin, J.; Tie, Y. On Export Specialization, Export Diversification and China’s Economic Growth, and Transformation of Driving Forces in China’s Export. J. Int. Trade 2013, 6, 16–26. [Google Scholar]
- Zhou, F.; Sun, X.D. The influence of China’s export diversification on economic growth—A quantitative study based on the Herfindhl index. Seeker 2012, 2, 14–16. [Google Scholar]
- Liu, X.Y.; Wu, Y. The Specialization of Export, the Diversification of Export, and the Growth of the Regional Economy: A Case Study Based on the Panel Data of China’s Provinces and Cities of the Provincial levels. Manag. World 2013, 8, 30–40. [Google Scholar]
- O’Connor, S.; Doyle, E.; Doran, J. Diversity, employment growth and spatial spillovers amongst Irish regions. Reg. Sci. Urban Econ. 2018, 68, 260–267. [Google Scholar] [CrossRef]
- Boschma, R. Relatedness as driver of regional diversification: A research agenda. Reg. Stud. 2017, 51, 351–364. [Google Scholar] [CrossRef]
- Boschma, R.; Frenken, K. The emerging empirics of evolutionary economic geography. J. Econ. Geogr. 2011, 11, 295–307. [Google Scholar] [CrossRef]
- Aarstad, J.; Kvitastein, O.A.; Jakobsen, S.E. Related and unrelated variety as regional drivers of enterprise productivity and innovation: A multilevel study. Res. Policy 2016, 45, 844–856. [Google Scholar] [CrossRef]
- Castaldi, C.; Frenken, K.; Los, B. Related variety, unrelated variety and technological breakthroughs: An analysis of US state-level patenting. Reg. Stud. 2015, 49, 767–781. [Google Scholar] [CrossRef]
- Content, J.; Frenken, K. Related variety and economic development: A literature review. Eur. Plan. Stud. 2016, 24, 2097–2112. [Google Scholar] [CrossRef]
- Fritsch, M.; Kublina, S. Related variety, unrelated variety and regional growth: The role of absorptive capacity and entrepreneurship. Reg. Stud. 2018, 52, 1360–1371. [Google Scholar] [CrossRef]
- Rebelo, F.; Silva, E.G. Export variety, technological content and economic performance: The case of Portugal. Ind. Corp. Chang. 2017, 26, 443–465. [Google Scholar] [CrossRef]
- Van Oort, F.; De Geus, S.; Dogaru, T. Related variety and regional economic growth in a cross-section of European urban regions. Eur. Plan. Stud. 2015, 23, 1110–1127. [Google Scholar] [CrossRef]
- Saviotti, P.P.; Frenken, K. Export variety and the economic performance of countries. J. Evol. Econ. 2008, 18, 201–218. [Google Scholar] [CrossRef]
- Boschma, R.; Iammarino, S. Related variety, trade linkages, and regional growth in Italy. Econ. Geogr. 2009, 85, 289–311. [Google Scholar] [CrossRef]
- Haq, I.U.; Zhu, S.J. Does export variety determine economic growth in Pakistan? Appl. Econ. Lett. 2018, 26, 1–4. [Google Scholar] [CrossRef]
- Zhu, S.J.; Tang, M.Y.; Zheng, J.L. Rical Research on the Effect of Export Variety and Technological Sophistication on Economic Growth——Evidence from Chinese Provincial Panel Data. J. Hunan Univ. (Soc. Sci.) 2015, 29, 50–57. [Google Scholar]
- Feenstra, R.C.; Lipsey, R.E.; Deng, H.; Ma, A.C.; Mo, H. World trade flows: 1962-2000 (No. w11040); National Bureau of Economic Research: Cambridge, MA, USA, 2005. [Google Scholar]
- Neffke, F.; Henning, M.; Boschma, R. How do regions diversify over time? Industry relatedness and the development of new growth paths in regions. Econ. Geogr. 2011, 87, 237–265. [Google Scholar] [CrossRef]
- Zhang, J.; Wu, G.Y.; Zhang, J.P. The Estimation of China’ s provincial capital stock: 1952–2000. Econ. Res. J. 2004, 10, 35–44. [Google Scholar]
- National Bureau of Statistics. China City Statistical Yearbook; Statistics Press: Beijing, China, 2000–2011. [Google Scholar]
- Guo, K.W. Impacts of the trade war between China and U.S. and scenario analysis. J. Int. Econ. Coop. 2018, 5, 18–24. [Google Scholar]
© 2019 by the authors. Licensee MDPI, Basel, Switzerland. This article is an open access article distributed under the terms and conditions of the Creative Commons Attribution (CC BY) license (http://creativecommons.org/licenses/by/4.0/).