Article

Modernization of African Food Retailing and (Un)healthy Food Consumption

Department of Agricultural Economics and Rural Development, University of Goettingen, 37073 Goettingen, Germany
*
Author to whom correspondence should be addressed.
Sustainability 2019, 11(16), 4306; https://doi.org/10.3390/su11164306
Submission received: 26 July 2019 / Revised: 6 August 2019 / Accepted: 7 August 2019 / Published: 9 August 2019

Abstract

:
Food environments in Africa are changing rapidly, with modern retailers—such as supermarkets, hypermarkets, and fast-food restaurants—gaining in importance. Changing food environments can influence consumers’ food choices and dietary patterns. Recent research has suggested that the growth of supermarkets leads to more consumption of processed foods, less healthy diets, and rising obesity. However, relatively little is known about what type of consumers actually use modern supermarkets and to what extent. Moreover, focusing only on supermarkets may be misleading, as most consumers obtain their food from various modern and traditional retailers. We add to the literature by examining relationships between consumers’ socioeconomic status, use of different modern and traditional retailers, and dietary patterns. The analysis uses household survey data from urban Zambia. Results show that two-thirds of the households use modern and traditional retailers simultaneously, but that richer households are more likely than poorer ones to use supermarkets and hypermarkets. Use of modern retailers is positively associated with higher consumption of ultra-processed foods, after also controlling for income and other socioeconomic factors. However, the use of traditional stores and kiosks is also positively associated with the consumption of ultra-processed foods, suggesting that modern retailers are not the only drivers of dietary transitions.

1. Introduction

Food systems in developing countries have been evolving rapidly in the last few decades, with a growing role played by modern retailers such as supermarkets, hypermarkets, convenience stores, and fast-food restaurants [1,2,3,4]. The modernization of food systems is largely driven by consumer preference changes resulting from urbanization, income growth, and globalization [5,6,7,8,9]. However, at the same time consumer preferences and demand may also be shaped by changing food environments [10,11,12]. For example, a shift from traditional markets to modern supermarkets and hypermarkets has effects on the types of food offered, as well as on food variety, food prices, and shopping atmosphere, all of which may influence consumer choices [3,13,14,15]. Understanding the links between changing food environments and food consumption patterns is important to promote food security and healthy diets. This is especially true in Africa, where poverty and undernutrition are still widespread, but where being overweight and obesity are also on the rise [16,17,18]
Available research suggests that the modernization of food retailing may make calories more affordable for urban consumers but—at the same time—may foster the nutrition transition towards more highly processed foods that are rich in fat, sugar, and salt, but contain low amounts of micronutrients and other ingredients for healthy nutrition [1,12,19,20]. Recent studies with data from different countries in Africa, Asia, and Latin America suggest that the growth of supermarkets may contribute to increased consumption of processed foods and a higher body mass index (BMI), after also controlling for household income [13,18,21,22,23,24]. However, especially in Africa, relatively little is known about what type of consumers actually use modern supermarkets and to what extent. Moreover, focusing only on supermarkets may be misleading, as most consumers obtain their food from various modern and traditional retailers [8,25,26,27].
Here, we add to the existing literature by analyzing more explicitly the associations between household socioeconomic status, the use of different types of retailers, and dietary patterns in urban Africa. In particular, we use household survey data from urban Zambia to analyze what type of socioeconomic characteristics are associated with the choice of modern and traditional food retailers, and to what extent the use of different retailers is associated with the consumption of processed and unprocessed foods, and products belonging to different healthy and unhealthy food groups. To our knowledge, this is the first study that looks into these issues with detailed data from Africa.
Zambia is an interesting empirical setting for this analysis, because it has recently experienced rapid growth of supermarkets, hypermarkets, and other modern retailers [5]. Moreover, Zambia is experiencing a triple burden of malnutrition, where undernutrition and micronutrient malnutrition coexist with rising overweight and obesity [17,28]. Hence, our results may help to project how diets evolve with further changes in retail environments and what type of policy responses might be useful. We expect that the insights from Zambia can be useful also for other countries in Africa, where the modernization of the food retail sector is still in its earlier stages.
The rest of this paper is organized as follows. Section 2 provides an overview of the most important types of modern and traditional food retailers in Zambia. Section 3 explains materials and methods, including a description of the household survey, the measurement of key variables, and the econometric models used. Section 4 presents and discusses the results, while Section 5 provides the conclusions.

2. Modern and Traditional Food Retailers in Zambia

Food retail environments in many African countries have been changing rapidly during the last 20 years, with a considerable growth of modern retailers such as supermarkets and hypermarkets [5,29]. Zambia is one of the countries in the Southern African region with particularly high growth rates of modern retailers [29,30]. For instance, our own review of internet sources supplemented by key informant interviews in the local context revealed that the number of large shopping malls in Lusaka City increased from one in 1995 to 25 in 2018 (Table S1 in the Supplementary material). These shopping malls with a big variety of shops are also the main locations of supermarkets, hypermarkets, and fast-food restaurants. Most of these modern retailers are almost homogenous in product offerings across countries in Africa. For instance, supermarket retail giant like Shoprite; Africa’s largest food retailer is operating more than 2738 outlets in 15 African countries (Angola, Botswana, Democratic Republic of Congo, eSwatini, Ghana, Lesotho, Madagascar, Malawi, Mauritius, Mozambique, Namibia, Nigeria, South Africa, Uganda and Zambia) [31]. Smaller supermarkets and convenience stores are also found in other locations. In the following, we characterize the main types of modern food retailers that we also use in the empirical analysis below. We characterize the most important types of traditional food retailers as well. An overview of the key characteristics of each type of retailer is shown in Table 1. The classification builds on criteria similar to those used in previous studies [22,24,25], partly adjusted to the local context based on key informant interviews.
The largest modern retailers are hypermarkets with a floor space of more than 200 m2. The main hypermarket chains in Lusaka are Game Stores, Cheers, and Choppies. Supermarkets are similar to hypermarkets, but are smaller with 100–200 m2 of floor space. Major supermarket chains in Lusaka include Shoprite and PicknPay, among others. Both hypermarkets and supermarkets are self-service stores with a wide range of fresh and processed products, including chilled and frozen foods. Convenience stores also belong to the category of modern retailers. They are also self-service in nature but are smaller (<100 m2) and offer a more limited range of food products.
Finally, we include fast-food restaurants—such as Hungry Lion, Debonairs Pizza, and KFC—in the group of modern retailers (Table 1).
Traditional food retailers include grocery stores, traditional markets, roadside markets, and neighborhood kiosks (Table 1). None of the traditional retailers have self-service options, all providing over-the-counter services. Traditional retailers are mostly owner-operated and do not belong to larger chains. Customers can negotiate prices to some extent and can usually also buy foods on credit. The range of products and brands offered by traditional retailers is smaller than that offered by modern retailers. Packaging sizes are also smaller. Sometimes traditional retailers repackage foods such as sugar, flour, or cooking oil, into very small packets, which are particularly demanded by poor customers. Traditional retailers rarely sell frozen and chilled foods, mostly due to lack of refrigeration facilities.

3. Materials and Methods

3.1. Household Survey

The data used in this study were collected through a household survey in Lusaka, the capital city of Zambia, between April and July 2018. We surveyed a total of 475 households using a two-stage random sampling procedure. At the first stage, we purposively selected 14 compounds within Lusaka urban. These compounds were selected based on the locations of major shopping malls as well as information provided by the City Council on mean income levels in the different compounds. Based on population distributions, we selected four compounds with high mean income levels (Avondole, Chalala, Kabulonga, Woodlands), four compounds with medium income levels (Chelston, Chilenje, Kabwata, PHI), and six compounds with low income levels (Chawama, Chazanga, Gardens, Kalingalinga, Kaunda Square, Ng’ombe). At the second stage, depending on compound size, we randomly sampled around 34 households from each compound for study participation. The spatial distribution of selected compounds and households is shown in Figure S1 in the Supplementary material. The sample should be fairly representative of households in the urban parts of Lusaka.
In each of the sample households, we carried out a face-to-face interview with the household head or another adult responsible for food purchase decisions. The computer-aided structured interviews were conducted in the local language by a small team of interviewers that we recruited, trained, and supervised. The questionnaire that we had developed for this purpose captured general economic and socio-demographic information of the household and its members. Food consumption data were collected through a 7-day household-level recall, using a detailed list of food items typically consumed in the local setting. In addition to food quantities and expenditures, we also collected data on the processing level and the source of each food item, focusing particularly on the different modern and traditional retailers. These data were used to construct various key variables, as discussed below.

3.2. Measurement of Key Variables

We are interested in analyzing the relationship between socioeconomic characteristics and use of different retailers. Socioeconomic characteristics of interest include household income levels, education, gender, and age of the household head, household size and structure, ethnicity, religion, car ownership, among others. Previous research showed that these characteristics can influence the decision of which retailers to use [13,15,22,23,24,32]. The use of different retailers is measured through a set of dummy variables capturing whether or not the household purchased any food from a particular type of retailer during the 7-day recall period. In addition to the retailer dummies, we also examine the share of the total household food budget spent in different retail outlets.
We are also interested in analyzing associations between the use of different retailers and dietary patterns. One way of looking at dietary patterns is through classifying all food items consumed by their level of processing. We differentiate between unprocessed foods, primary processed foods, and ultra-processed foods [24]. For these three processing levels, we calculate household expenditures and food expenditure shares. Unprocessed foods include wholegrain cereals and pulses, fresh fruits and vegetables, eggs and fresh milk, among others. Primary processed foods include milled cereals and fresh meat and fish. Ultra-processed foods include bread, pasta, dairy products, sausages and meat products, soft drinks, sweets, and other ready-made dishes and snacks (Table S2 in the Supplementary material). Ultra-processed foods are generally considered less healthy than unprocessed foods, because they often have high sugar, fat, and salt contents, and low fiber and micronutrient contents. Research has shown that high consumption of ultra-processed foods is associated with obesity and increased risks of chronic diseases such as coronary heart diseases, stroke, and diabetes [17,28,33,34]. Separate indicators of dietary patterns that we use are the quantities of different food groups consumed by the households during the 7-day recall period. We use the following food groups: cereals and tubers, legumes, fruits, vegetables, meat and fish, dairy products, eggs, oils and fats, and sugar and sugar-sweetened beverages. While the last two food groups are considered as rather unhealthy, the others contain important nutrients and can therefore contribute to healthy nutrition.

3.3. Statistical Analysis

We start the analysis by calculating descriptive statistics for the use of modern retailers and dietary patterns and comparing between households of different socioeconomic status. For this purpose, we subdivide the sample into three groups of almost equal size, namely the lower, middle, and upper income terciles. In addition, we use regression models to analyze the associations of interest more formally.
To analyze the socioeconomic factors that influence the use of different types of retailers, we estimate models of the following type:
F R i = α + β X i + ε i
where F R i is a vector of the types of food retailers that household i used during the 7-day recall period, X i is a vector of socioeconomic variables, and ε i is a random error term. F R i is measured through a set of dummy variables, one for each of the modern and traditional retailers considered, so that we use a probit specification to estimate Equation (1). Households can use more than one type of retailer, and the decisions for different retailers are likely correlated. We use a multivariate probit model to account for possible error correlation between the equations for different retailers [35].
Next, we analyze how far the use of particular retailers is associated with more or less healthy dietary patterns by estimating regression models of the following type:
D P i = γ + δ F R S i + ρ X i + u i
where D P i characterizes the observed dietary pattern of household i , and u i is the random error term. F R S i is a vector of variables representing the food expenditure shares of each of the retailers, and X i is a vector of socioeconomic characteristics. In one set of regressions, D P i will characterize expenditures for foods with different processing levels, while in another set of regressions D P i will characterize the consumption of different healthy and unhealthy food groups.
For the processing level equations, we use an ordinary least squares (OLS) estimator. As error term correlation between the different equations is possible, we also use a seemingly unrelated regression (SUR) estimator to compare the results. Furthermore, in addition to estimates with the full sample, we estimate separate models for households below and above the poverty line, as the role of modern retailers may potentially differ by socioeconomic status. For the food group equations, we use a Tobit estimator, because the consumption quantities are left-censored at zero. To account for the heterogeneity among the sampled households, for all models, standard errors are clustered at the level of city compounds.
We start estimating the models in Equation (2) by only considering one food retailer in F R S i , namely supermarkets. This is similar to previous studies that have analyzed the effects of supermarkets on diets and nutrition [13,22,23,24,32]. However, conclusions based on such models that only consider the use of supermarkets may be incomplete, as households typically use various types of retailers. To demonstrate this, we re-estimate the same models with all types of retailers included. We note that the use of food retailers (vector F R S i ) is endogenous, so the estimated δ coefficients from Equation (2) should not be interpreted as causal effects. Using instruments to deal with possible endogeneity bias would be possible in principle, but is difficult in our case, with a total of eight endogenous variables. We were unable to identify eight valid instruments, which is why we interpret the estimated coefficients only in terms of associations.

4. Results and Discussion

4.1. Household Socioeconomic Characteristics

Table 2 shows summary statistics for selected household socioeconomic variables (additional variables are shown in Table S3 in the Supplementary material). Average annual per capita incomes range from US$ 410 in the lowest tercile to more than US$5,000 in the highest tercile. Twenty-seven percent of the sample households fall below the international poverty line of US$1.90 per capita in purchasing power parity terms [36]. We observe large differences between the income terciles in terms of education, occupation, and car ownership. While only 3% of the households in the lowest tercile own a car, in the highest tercile the share is 60%.
The middle and lower parts of Table 2 show food consumption patterns. The average consumption of cereals, tubers, and legumes does not differ much between the three income terciles, whereas the consumption of most of the other food groups increases considerably with income, as one would expect. Noteworthy is the very low consumption of fruits in all three income terciles. Many of the households consume fruits only occasionally. In terms of processing levels, for the sample as a whole, 25% of the food expenditures are for unprocessed foods, 40% for primary processed foods, and 35% for ultra-processed foods. Strikingly, the expenditure share for ultra-processed foods does not increase with income, emphasizing that the purchase and consumption of these types of foods are very common for all types of households in Lusaka City.

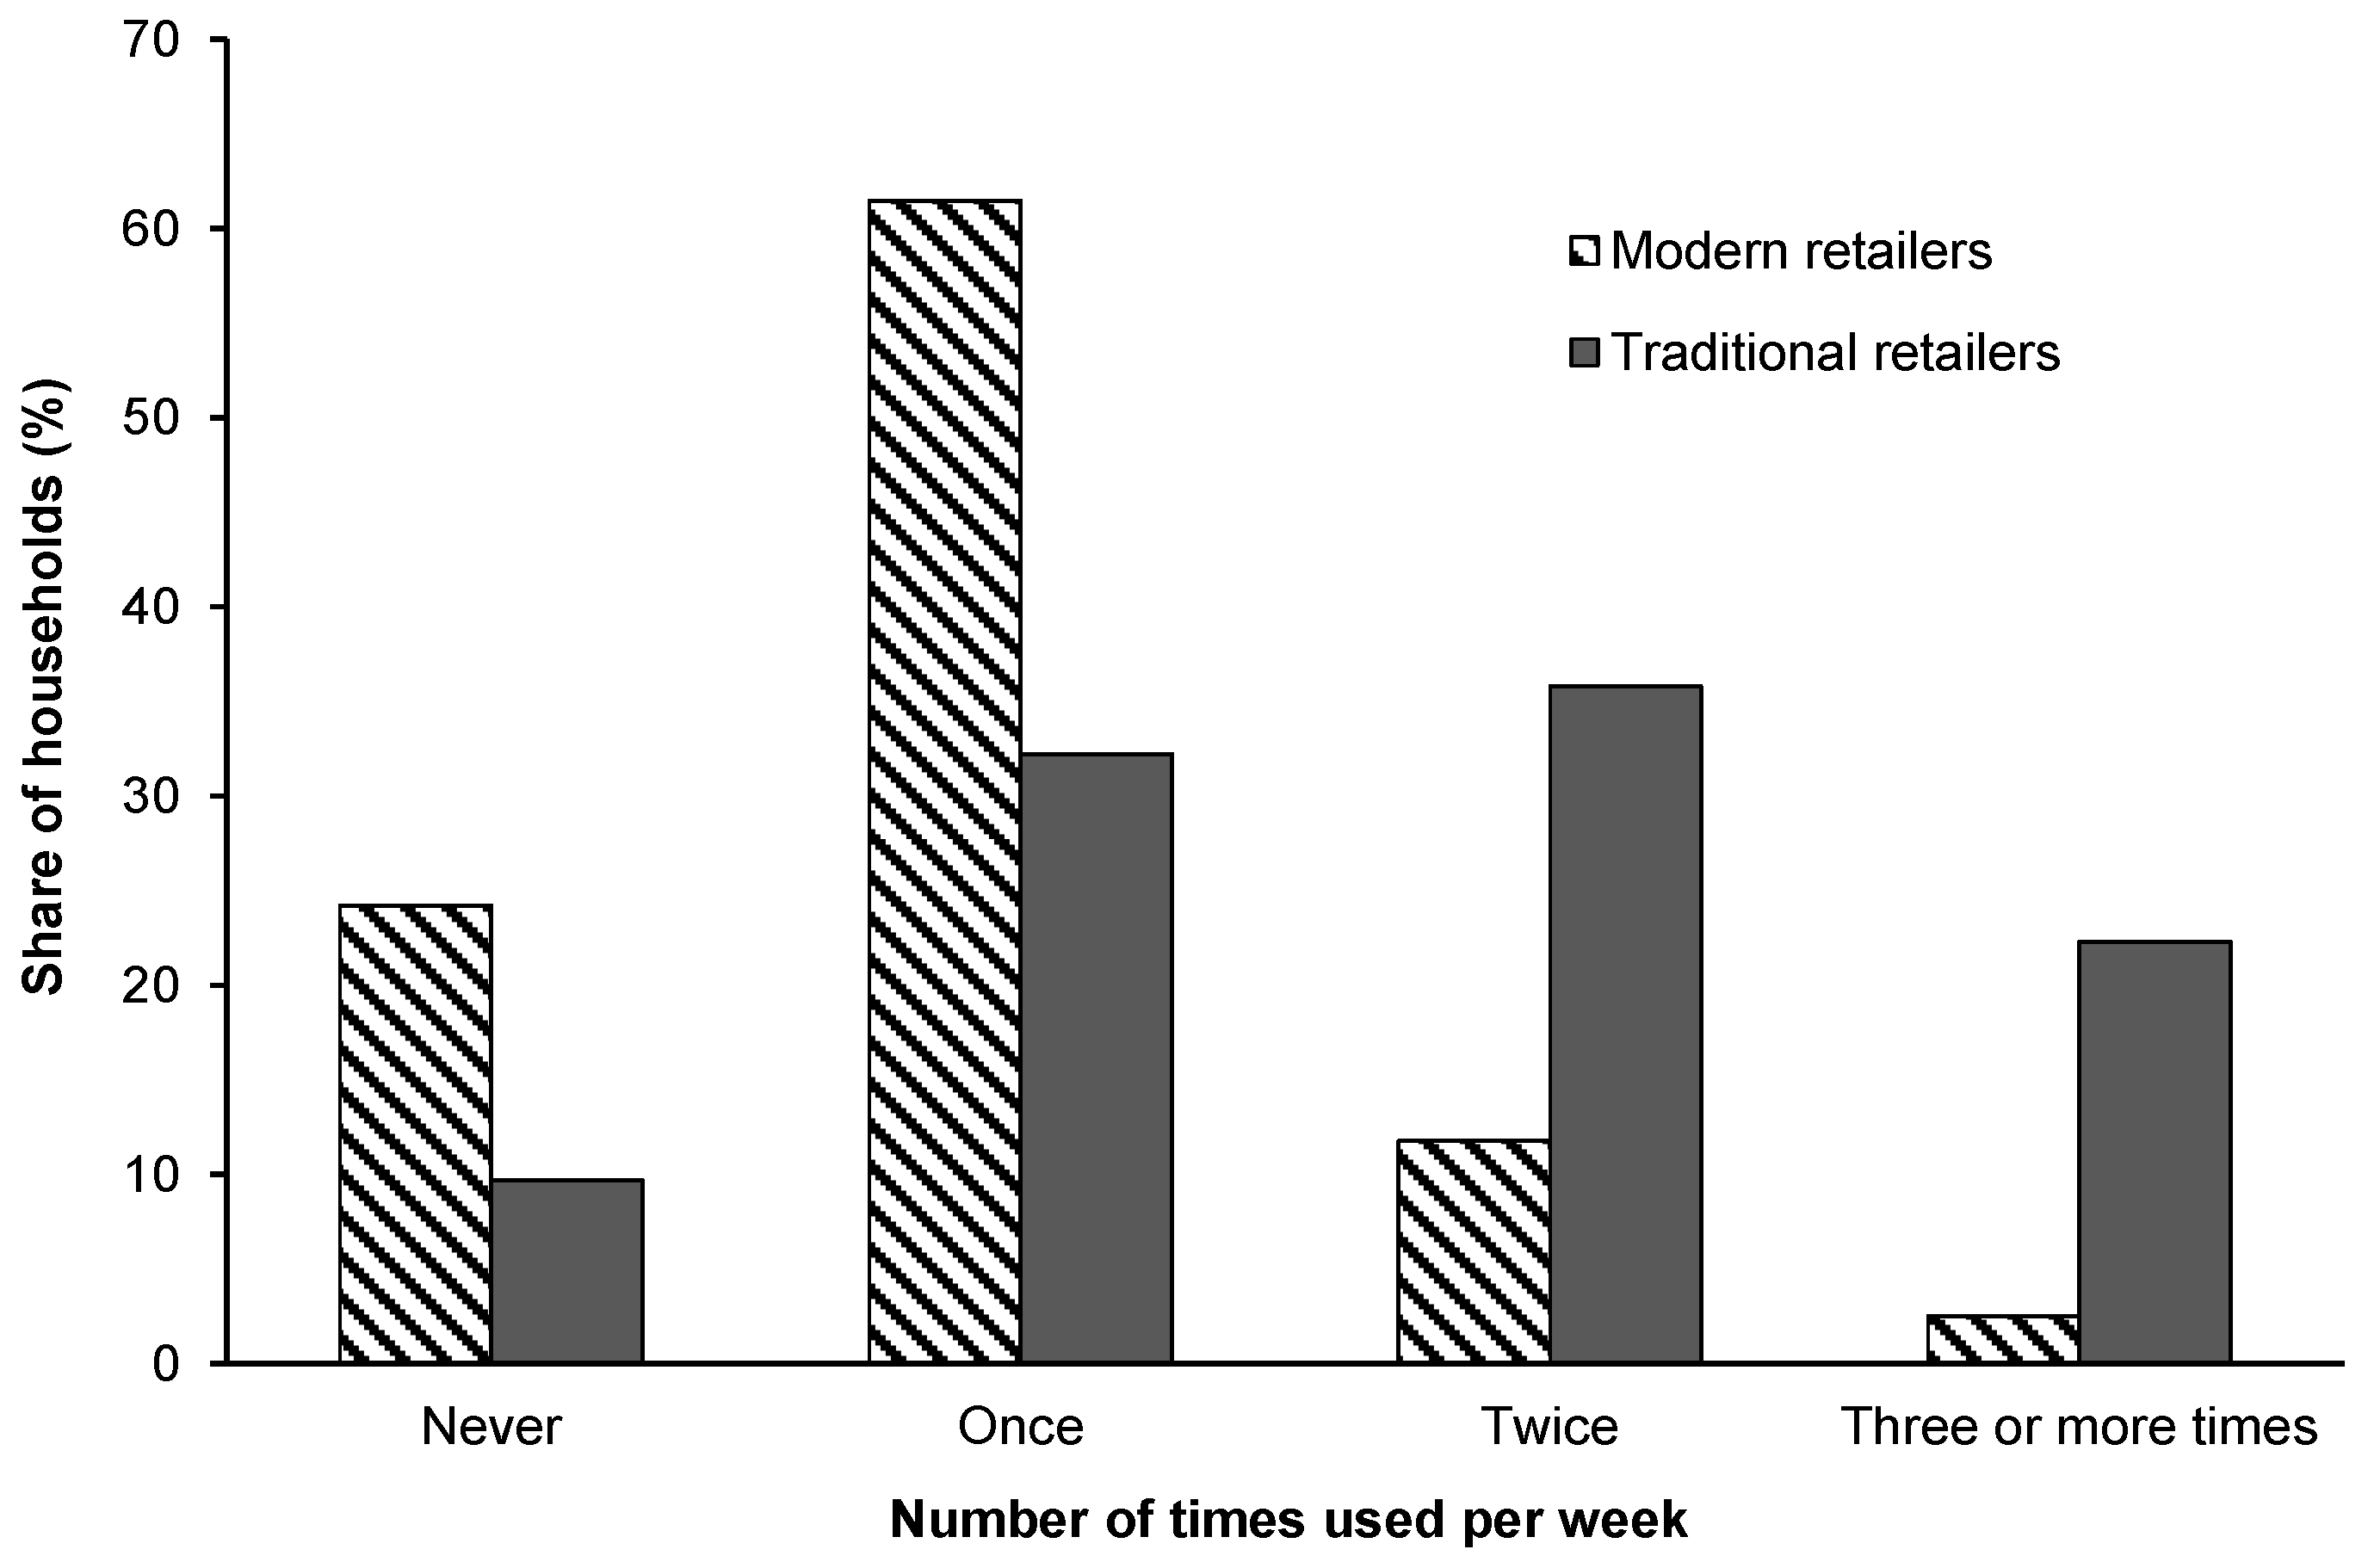
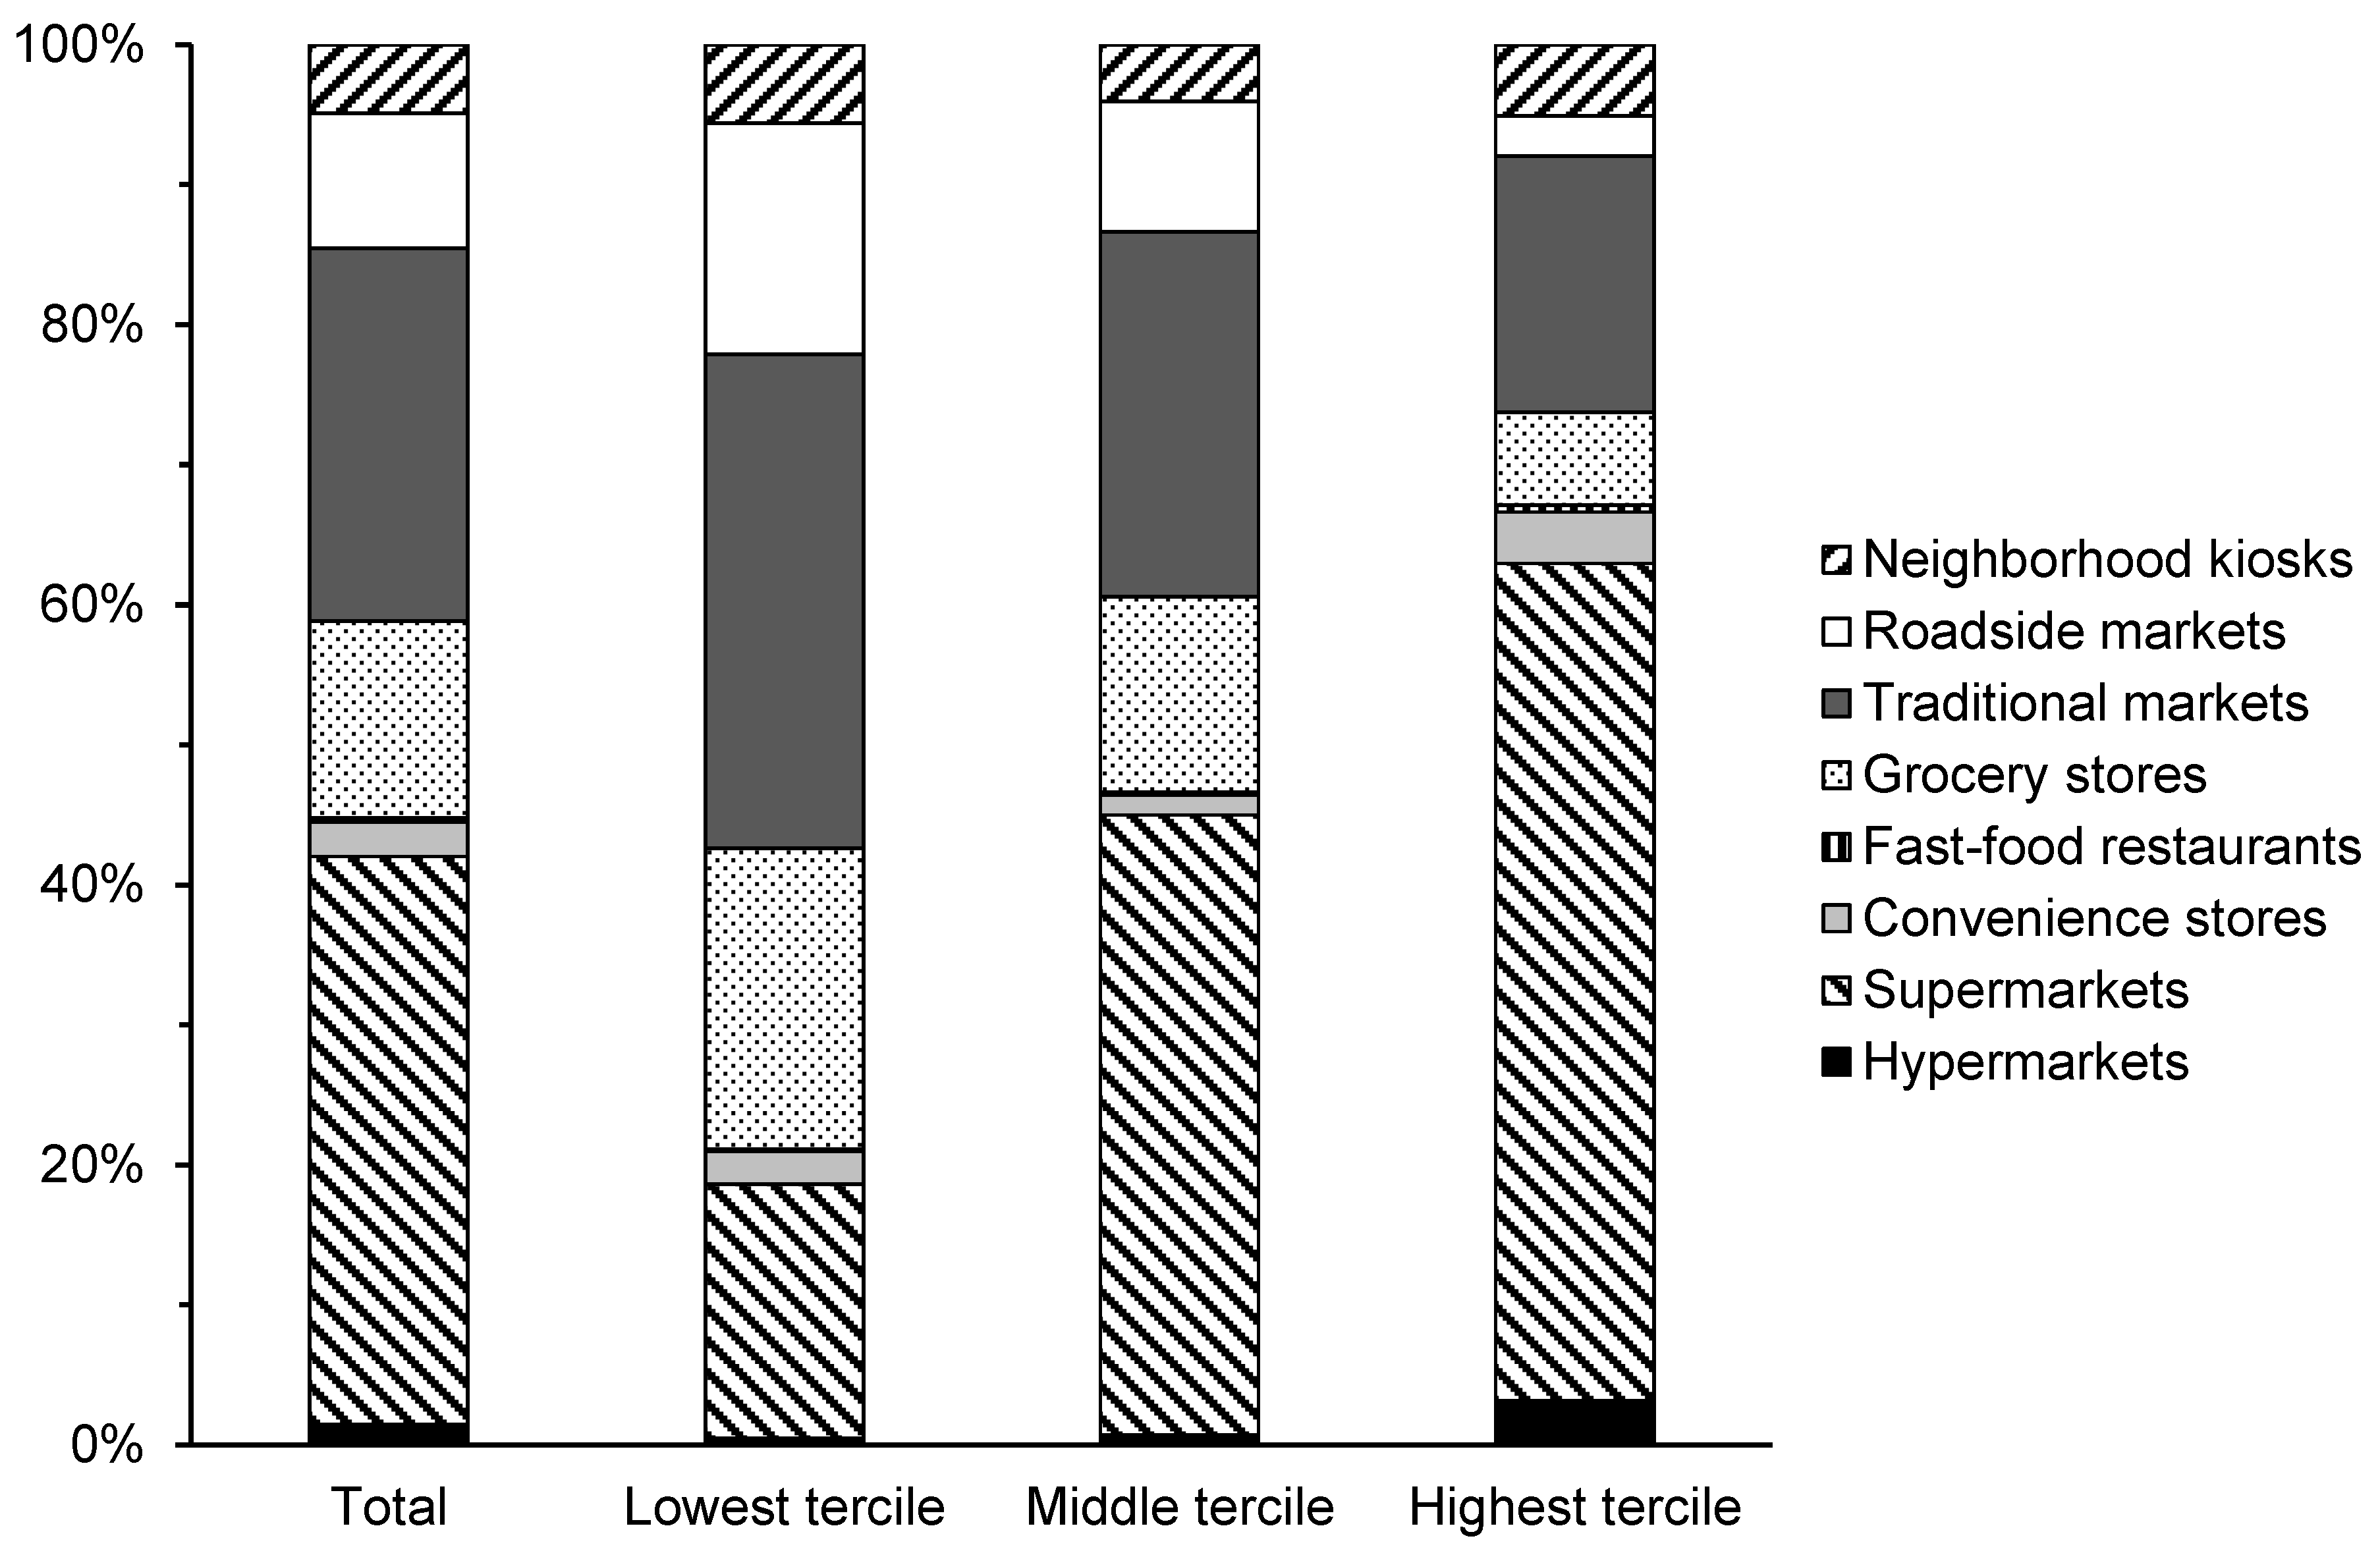
4.2. Role of Modern and Traditional Retailers

Table 3 shows the proportion of households using the different modern and traditional retailers. This refers to the sources of the foods consumed during the 7-day recall period used in the household survey. While the regular use of hypermarkets and fast-food restaurants is relatively low, the majority of all households (73%) used supermarkets. Even more (76%) used at least one of the modern food retailers. As expected, the use of modern retailers increases considerably from the lowest to the highest tercile. In the highest tercile, almost all households used at least one of the modern retailers. Most households in all income terciles used more than one type of retailer during the 7-day recall period. Two-thirds used both modern and traditional retailers.
Figure 1 shows that the average frequency of traditional retailer use is higher than that of modern retailer use. Many households make one larger purchase in a supermarket or hypermarket once a week and then purchase additional foods from traditional retailers whenever needed during the week.
The finding that many consumers use both modern and traditional retailers is consistent with a recent study for Nairobi [25] and also with theoretical predictions for a setting with large socioeconomic heterogeneity [8]. The use of some traditional retailers decreases with rising household income, which is especially true for grocery stores and roadside markets. In contrast, the use of traditional markets and kiosks does not decrease with rising income (Table 3).
Figure 2 shows the distribution of household food expenditure shares by type of retailer. For the sample as a whole, 42% of the food expenditures are made for purchases from modern retailers. This is very high when compared to most other African countries, even when only looking at urban areas [7]. The rest of the household food budgets are spent (58%) in traditional retail outlets. Notable differences are observed between the three income terciles. While households in the highest tercile make 63% of their food expenditures in modern retailers, for households in the lowest tercile this share is only around 20%. This is in line with [25,37] who found that poor households use modern retailers less extensively than rich households in Kenya and Vietnam, respectively. Among the modern retailers, supermarkets account for the lion’s share of food expenditures for all households in Lusaka.

4.3. Factors Influencing the Use of Modern Retailers

We now look at the estimation results from the multivariate probit model to analyze factors influencing the household decision regarding whether or not to use particular types of retailers (see Equation (1) above). Average estimated marginal effects are shown in Table 4. Household income has a positive effect on the likelihood of using modern supermarkets and hypermarkets and a negative effect on the likelihood of traditional grocery stores and roadside markets, also after controlling for a number of other household characteristics. As mentioned earlier, occasionally, many households make one larger purchase in a modern retailer and often buy smaller food quantities from a traditional retailer (e.g., see Figure 1). In contrast, and consistent with the descriptive statistics above, the likelihood of using traditional markets and kiosks does not decrease with rising income. The use of traditional kiosks even increases when household income rises.
Education also affects the use of modern supermarkets positively. Similarly, more education tends to increase the use of fast-food restaurants. This latter result may be surprising, because fast food dishes are typically not very healthy, and better-educated households are generally expected to know more about healthy nutrition. On the other hand, education may also be a proxy of more exposure to global influences and lifestyles, which may contribute to a certain preference for westernized diets. Furthermore, better-educated consumers are often more conscious about food safety issues. In many developing countries, modern retailers and restaurants are perceived to fulfill higher food safety standards than their traditional counterparts [38,39,40,41]. This could also explain why households with more education are significantly less likely to use traditional grocery stores, roadside markets, and kiosks. For instance, each additional year of schooling reduces the likelihood of purchasing food from a roadside market by 2.8 percentage points.
The other results in Table 4 show that household size has a negative effect on using supermarkets and a positive effect on using traditional grocery stores and roadside markets. These results are probably related to shop opening hours and convenience. Supermarkets and hypermarkets have longer and more reliable opening hours than most traditional retailers. Furthermore, given the wide variety of products offered in supermarkets and hypermarkets, one-stop shopping is easily possible, which is much less the case for traditional retailers. These conditions make supermarkets particularly convenient for people with time constraints. In larger households, time constraints may be less severe, at least for some household members, so that the use of traditional retailers is more easily possible. Time constraints could also explain why people with an office job are more likely to use supermarkets and less likely to use roadside markets and kiosks. Also in line with this, is the fact that male-headed households are less likely to use supermarkets and more likely to use traditional retailers than female-headed households. Female household heads are typically the main income earners of the family and the main homemakers simultaneously, which means that only a small amount of time is available for shopping.
Other socioeconomic characteristics that seem to influence the choice of modern and traditional retailers include car ownership, ethnicity, and religion (Table 4). Car ownership increases the likelihood of using modern retailers and decreases the likelihood of using traditional retailers. This is unsurprising, given that most of the supermarkets and hypermarkets are located in larger shopping malls that typically also provide easy access by car and parking space. The patterns for ethnicity and religion are probably related to geographic clustering. On average, Tonga and catholic households live more closely to shopping malls with a large hypermarket.
The error term correlation matrix for the multivariate probit model is shown in Table S4 in the Supplementary material. The null hypothesis of zero correlation between the equations for the different retailers is rejected, suggesting that the multivariate probit specification is preferred over separate single equation probit models. The correlation coefficients shown in Table S4 can also be interpreted economically. A positive correlation means that consumers use both retailers in a complementary way. This is observed, for instance, between hypermarkets and modern convenience stores. While the former are used for making large-quantity purchases, the latter are used for making complementary smaller purchases. A positive correlation is also observed between traditional grocery stores and neighborhood kiosks. On the other hand, we also observe negative correlations, for instance between modern supermarkets and traditional grocery stores, indicating that these types of retailers are rather considered substitutes. Both offer a similar range of products, but the variety in modern supermarkets is larger. These results indicate that traditional grocery stores may suffer the most from a shrinking customer base with the continued expansion of modern supermarkets. Other traditional retailers—such as traditional markets and neighborhood kiosks—may also be affected negatively by further supermarket expansion, but to a lesser extent than grocery stores. These types of competitive relationships between modern and traditional retailers are in line with earlier observations in Asia, Europe, and the USA [26,40,42,43,44].

4.4. Associations between Retailers and Food Processing Levels

We now estimate the associations between the use of different retailers and household dietary patterns (see Equation (2) above), starting with the disaggregation of the foods consumed by processing level. Results are summarized in Table 5 (full estimation results are shown in Table S5 in the Supplementary material). The results in Table 5 are single-equation OLS estimates. We also used SUR as an alternative estimator to account for possible correlation between the error terms. SUR results are shown in Table S6 in the Supplementary material. They are very similar to the OLS estimates, only that the SUR estimator cannot easily be combined with the cluster correction of standard errors. The upper part of Table 5 (panel A) shows models where supermarkets are considered as the only retailer variable.
The higher the share of food expenditures made in supermarkets, the higher the consumption of ultra-processed and primary processed foods, and the lower the consumption of unprocessed foods (panel A, Table 5). These results are consistent with previous studies in Guatemala and Kenya showing that the use of supermarkets contributes to a shift from the consumption of unprocessed to highly processed foods [13,21,22]. As mentioned, the consumption of ultra-processed foods was shown to be associated with increased risks of obesity and chronic diseases [10,33].
The picture becomes more differentiated when also considering the other modern and traditional retailers, as shown in panel B of Table 5. The use of supermarkets (and hypermarkets) remains positively associated with the consumption of ultra-processed foods, and the size of the association is even larger than that evident in panel A. An increase in the expenditure share of supermarkets by 1 percentage point increases the expenditure share of ultra-processed foods by about 0.2 percentage points. Modern convenience stores and fast-food restaurants are also associated with higher consumption of ultra-processed foods. Interestingly, however, the same is true for some of the traditional retailers. For traditional grocery stores and neighborhood kiosks the size of the positive association is even somewhat larger than for modern supermarkets and hypermarkets. These results suggest that there is a general shift towards the consumption of ultra-processed foods that cannot be attributed to modern retailers alone.
As a robustness check, we re-estimated the models in Table 5 by using absolute food expenditures for the three processing levels as dependent variables instead of expenditure shares. These alternative results also show that modern retailers as well as traditional grocery stores and kiosks are associated with higher consumption of ultra-processed foods (Table S7 in the Supplementary material). Furthermore, we estimated the same models by splitting the sample into poor and non-poor households, using the international poverty line of US$1.90 a day [36]. Results in Table S8 of the Supplementary material suggest that the associations between the use of certain food retailers and the consumption of ultra-processed foods are more pronounced for non-poor than for poor households. This is plausible given that poor households’ food choices are more constrained by income limitations. However, as was shown in Table 2, poor people also spend more than one-third of their food budget on ultra-processed foods.

4.5. Associations between Retailers and Food Groups

Table 6 shows the associations between the use of different retailers and the consumption of various food groups. In these models, consumption is expressed in terms of the food quantities consumed by the household during the 7-day recall period. The upper part of Table 6 (panel A) includes supermarkets as the only retailer variable. The estimates suggest that the use of supermarkets is associated with higher consumption of meat, fish, and dairy products and lower consumption of sugar, sweets, and sweetened beverages.
However, the picture changes somewhat in the lower part of Table 6 (panel B), where the other retailers are also included as explanatory variables. The specifications in panel B show that the use of supermarkets and hypermarkets is associated with higher meat, fish, and dairy consumption, but also with higher consumption of sugar, sweets, and sweetened beverages. In addition, the use of modern convenience stores is associated with higher consumption of oils and fats. The higher consumption of animal-source products is likely related to better cooling facilities in modern retail outlets. This is generally positive from a dietary quality and nutrition perspective, as meat, fish, and dairy products are important sources of protein and micronutrients. Table 2 showed that the mean consumption of meat and fish in the sample households is not very low. Very high meat consumption levels can also be associated with negative health and environmental externalities [45]. However, more sugar, sweets, oils, and fats may contribute to people being overweight and increasing obesity, and therefore, worsen dietary quality and nutrition. In other words, modern retailers seem to be associated with both positive and negative dietary effects.
Strikingly, however, mixed dietary effects are also observed for traditional retailers. On the positive side, the estimates in Table 6 suggest that the use of traditional grocery stores and neighborhood kiosks is associated with higher consumption of dairy products and eggs. The use of traditional markets is associated with higher vegetable consumption. On the negative side, the use of grocery stores, traditional markets, and neighborhood kiosks is also associated with higher consumption of sugar, sweets, and sweetened beverages. The use of traditional markets is further associated with higher consumption of oils and fats. These patterns suggest that the retail format and the product ranges offered by different types of retailers do influence consumer food choices and diets, but that there is no clear division between modern and traditional retailers. This finding is in line with the analysis of links between food retailing and processing levels discussed above.
Another noteworthy observation from the estimates in Table 6 is that all retailers seem to be associated with lower consumption of fruits; several of these negative associations are statistically significant. This is surprising because consumers actually buy fresh fruits in several of the retail outlets, especially in supermarkets, traditional markets, and roadside markets. However, some of the fruits are also obtained from own production, and we do not include own production as an explanatory variable. Households with own fruit production consume more fruits than households that fully rely on purchases, which can explain the negative associations between all retailers and fruit consumption in Table 6. Overall, the consumption of fruits is very low among the sample households from Lusaka City.
In a robustness check of the estimates in Table 6 we ran the same models, but used consumption expressed in value terms instead of quantities as dependent variables. These alternative estimates are shown in Table S11 in the Supplementary material. The results support the same general conclusions only that the associations with consumption expenditures for sugar, sweets, and sweetened beverages are not statistically significant for any of the modern and traditional retailers.

5. Conclusions

Many countries in Africa are experiencing a rapid modernization of their food retail sector, with supermarkets, hypermarkets, modern convenience stores, and fast-food restaurants gaining in importance. These changing food environments, especially in urban areas, may influence consumers’ food choices, dietary patterns, and nutrition. Previous research has suggested that the spread of modern retailers may contribute to less healthy diets, higher consumption of ultra-processed foods, and rising rates of overweight and obesity. However, previous studies did not pay much attention to the question as to which socioeconomic groups use what type of retailers. Furthermore, the existing research on diet and nutrition effects focused primarily on the role of supermarkets, without accounting for the fact that most consumers obtain their foods from various types of retailers. We have added to this research direction by more explicitly analyzing the associations between household socioeconomic status, the use of different types of modern and traditional retailers, and dietary patterns. We have collected and used data from households in Lusaka City in Zambia, one of the places in Southern Africa where food environments have changed dramatically in recent years.
Our results show that almost all households use different types of retailers on a regular basis. Two-thirds of the households use modern and traditional retailers simultaneously. Among the modern retailers, supermarkets account for the largest share of the food purchases, followed by modern convenience stores and hypermarkets. Overall, in Lusaka City, modern retailers account for 42% of the household food expenditures on average, although with notable differences between poor and rich households. Modern retailers account for 20% and 63% of total food expenditures in the lowest and highest income tercile, respectively. Income is also an important predictor of the use of modern retailers after controlling for other socioeconomic variables. Other variables that increase the likelihood of using modern retailers are education, car ownership, having an office job, and female household heads. Supermarkets and hypermarkets, in particular, offer a large variety of products, which consumers perceive as safe and of high quality. Supermarkets and hypermarkets also have longer and more reliable opening hours than most traditional retailers. All of these factors make supermarkets and hypermarkets attractive shopping places especially for better-off households with high opportunity costs of time.
The regression analysis also shows that using supermarkets is associated with a higher consumption of ultra-processed foods and a lower consumption of unprocessed foods, also after controlling for income and other socioeconomic variables. This is in line with earlier research on the dietary effects of supermarkets [19,21,22,24,32]. From a nutrition and health perspective, these dietary trends are undesirable, as high consumption of ultra-processed foods is associated with increased risks of obesity and chronic diseases [10,28,33,34]. However, unlike earlier studies, we also analyzed the role of other retailers and found that especially the use of traditional grocery stores and neighborhood kiosks is also associated with higher consumption of ultra-processed foods. These results suggest that there is a general shift towards the consumption of ultra-processed foods that cannot be attributed to modern retailers alone.
We also analyzed the consumption of different food groups and found that the use of modern retailers is associated with higher consumption of certain unhealthy food groups (sugar, sweets, oils, fats), but also with higher consumption of certain healthy food groups (meat, fish, dairy products). At the same time, the use of some of the traditional retailers—such as grocery stores, traditional markets, and kiosks—is also associated with higher consumption of unhealthy food groups.
Many countries in Africa are experiencing a nutrition transition with both positive and negative implications. On the positive side, the consumption of some nutritious foods is increasing. On the negative side, the consumption of sugar, fat, and salt is increasing as well. Changing food environments seem to influence and support these dietary trends and should, therefore, also be seen as potential entry points for public regulations and policies to support more healthy diets. Policy options to consider are regulations related to the advertisement and promotion of healthy and unhealthy foods and their strategic placement within shops. For instance, in studies referring to industrialized countries, the authors of [46,47] showed that changes in the placement of fruits and vegetables can positively influence consumer choices. Related regulations could also be relevant for countries in Africa. In urban Zambia, the consumption of fresh fruits is particularly low; policies to increase fruit consumption levels would be useful. Beyond advertisement, awareness campaigns, and nudges, taxes and subsidies could also be options to promote healthy diets. A detailed discussion of policy approaches is beyond the scope of this article. In any case, our results emphasize that modern retailers are not the only drivers of dietary transitions, so that a focus on regulating modern retailers alone would be insufficient to promote healthy eating.
In closing, three limitations of our research should briefly be discussed. First, we used processing level categories, which could not sufficiently classify the degree of healthfulness of a specific food. Moreover, the three categories (ultra-processed, primary processed and unprocessed foods) could not properly account for the overlap in nutritional attributes for some food products. Second, we used observational data and could not control for the endogeneity of households’ decisions about which retailers to use. Therefore, our results are interpreted only in terms of associations, not as causal effects. Proper identification is difficult with observational data, but longer-term studies with panel data may possibly help. Third, results from Lusaka City in Zambia are not necessarily representative for other parts of Africa. Follow-up research in different geographical contexts would be interesting to further broaden the knowledge base.

Supplementary Materials

The following are available online at https://www.mdpi.com/2071-1050/11/16/4306/s1, Figure S1: Map of Lusaka City with sampled compounds and households, Table S1: List of main shopping malls with modern food retailers in Lusaka City, Table S2: Food processing levels by food groups and items; Table S3. Additional descriptive statistics; Table S4. Correlation matrix from multivariate probit model; Table S5. Associations between the use of retailers and food processing levels (full results); Table S6. Associations between supermarket use and food processing levels (seemingly unrelated regressions); Table S7. Associations between the use of different retailers and food processing levels (absolute expenditures); Table S8. Associations between the use of different retailers and food processing levels (by poverty status); Table S9. Associations between the use of different retailers and the consumption of selected food groups (full results, supermarkets only); Table S10. Associations between the use of different retailers and the consumption of selected food groups (full results, all retailers); Table S11: Associations between the use of different retailers and the consumption of food groups (in value terms).

Author Contributions

Conceptualization and Design of the Study, M.G.K. and M.Q.; Data Collection, M.G.K.; Data Analysis, M.G.K.; Writing—Original Draft Preparation, M.G.K.; Writing—Review and Editing, M.Q.

Acknowledgments

This research was financially supported by the German Research Foundation (DFG), grant number RTG 1666 (GlobalFood).

Conflicts of Interest

The authors declare no conflict of interest.

References

  1. Gómez, M.I.; Ricketts, K.D. Food value chain transformations in developing countries: Selected hypotheses on nutritional implications. Food Policy 2013, 42, 139–150. [Google Scholar] [CrossRef] [Green Version]
  2. Popkin, B.M. Nutrition, agriculture and the global food system in low and middle income countries. Food Policy 2014, 47, 91–96. [Google Scholar] [CrossRef] [PubMed] [Green Version]
  3. Reardon, T.; Timmer, C.P. Five inter-linked transformations in the Asian Agrifood economy: Food security implications. Glob. Food Secur. 2014, 3, 108–117. [Google Scholar] [CrossRef]
  4. Andersson, C.I.M.; Chege, C.G.K.; Rao, E.J.O.; Qaim, M. Following up on smallholder farmers and supermarkets in Kenya. Am. J. Agric. Econ. 2015, 97, 1247–1266. [Google Scholar] [CrossRef]
  5. Tschirley, D.; Reardon, T.; Dolislager, M.; Snyder, J. The rise of a middle class in East and Southern Africa: Implications for food system transformation. J. Int. Dev. 2015, 27, 628–646. [Google Scholar] [CrossRef]
  6. Minten, B.; Reardon, T.; Chen, K.Z. Agricultural value chains: How cities reshape food systems. In 2017 Global Food Policy Report; IFPRI: Washington, DC, USA, 2017; Chapter 5; pp. 42–49. [Google Scholar]
  7. Qaim, M. Globalisation of agrifood systems and sustainable nutrition. Proc. Nutr. Soc. 2017, 76, 12–21. [Google Scholar] [CrossRef]
  8. Lu, L.; Reardon, T. An economic model of the evolution of food retail and supply chains from traditional shops to supermarkets to e-commerce. Am. J. Agric. Econ. 2018, 100, 1320–1335. [Google Scholar] [CrossRef]
  9. Reardon, T.; Echeverria, R.; Berdegué, J.; Minten, B.; Liverpool-Tasie, S.; Tschirley, D.; Zilberman, D. Rapid transformation of food systems in developing regions: Highlighting the role of agricultural research & innovations. Agric. Syst. 2019, 172, 47–59. [Google Scholar]
  10. Popkin, B.M. Relationship between shifts in food system dynamics and acceleration of the global nutrition transition. Nutr. Rev. 2017, 75, 73–82. [Google Scholar] [CrossRef] [Green Version]
  11. Laska, M.N.; Sindberg, L.S.; Ayala, G.X.; D’Angelo, H.; Horton, L.A.; Ribisl, K.M.; Kharmats, A.; Olson, C.; Gittelsohn, J. Agreements between small food store retailers and their suppliers: Incentivizing unhealthy foods and beverages in four urban settings. Food Policy 2018, 79, 324–330. [Google Scholar] [CrossRef]
  12. Popkin, B.M.; Reardon, T. Obesity and the food system transformation in Latin America. Obes. Rev. 2018, 19, 1028–1064. [Google Scholar] [CrossRef] [PubMed]
  13. Asfaw, A. Does supermarket purchase affect the dietary practices of households? Some empirical evidence from Guatemala. Dev. Policy Rev. 2008, 26, 227–243. [Google Scholar] [CrossRef]
  14. Hawkes, C. Dietary implications of supermarket development: A global perspective. Dev. Policy Rev. 2008, 26, 657–692. [Google Scholar] [CrossRef]
  15. Odunitan-Wayas, F.; Okop, K.; Dover, R.; Alaba, O.; Micklesfield, L.; Puoane, T.; Uys, M.; Tsolekile, L.; Levitt, N.; Battersby, J.; et al. Food purchasing characteristics and perceptions of neighborhood food environment of South Africans living in low-, middle- and high-socioeconomic neighborhoods. Sustainability 2018, 10, 4801. [Google Scholar] [CrossRef]
  16. Ruel, M.T.; Garrett, J.; Yosef, S. Food security and nutrition: Growing cities, new challenges. In 2017 Global Food Policy Report; IFPRI: Washington, DC, USA, 2017; Chapter 3; pp. 24–33. [Google Scholar]
  17. Harris, J.; Chisanga, B.; Drimie, S.; Kennedy, G. Nutrition transition in Zambia: Changing food supply, food prices, household consumption, diet and nutrition outcomes. Food Secur. 2019, 11, 371–387. [Google Scholar] [CrossRef] [Green Version]
  18. Kroll, F.; Swart, E.C.; Annan, R.A.; Thow, A.M.; Neves, D.; Apprey, C.; Aduku, L.N.E.; Agyapong, N.A.F.; Moubarac, J.-C.; Du Toit, A.; et al. Mapping obesogenic food environments in South Africa and Ghana: Correlations and contradictions. Sustainability 2019, 11, 3924. [Google Scholar] [CrossRef]
  19. Asfaw, A. Does consumption of processed foods explain disparities in the body weight of individuals? The case of Guatemala. Health Econ. 2011, 20, 184–195. [Google Scholar] [CrossRef] [PubMed]
  20. Freire, T.; Rudkin, S. Healthy food diversity and supermarket interventions: Evidence from the Seacroft intervention study. Food Policy 2019, 83, 125–138. [Google Scholar] [CrossRef]
  21. Kimenju, S.C.; Rischke, R.; Klasen, S.; Qaim, M. Do supermarkets contribute to the obesity pandemic in developing countries? Public Health Nutr. 2015, 18, 3224–3233. [Google Scholar] [CrossRef] [Green Version]
  22. Rischke, R.; Kimenju, S.C.; Klasen, S.; Qaim, M. Supermarkets and food consumption patterns: The case of small towns in Kenya. Food Policy 2015, 52, 9–21. [Google Scholar] [CrossRef]
  23. Umberger, W.J.; He, X.; Minot, N.; Toiba, H. Examining the relationship between the use of supermarket and over-nutrition in Indonesia. Am. J. Agric. Econ. 2015, 97, 510–525. [Google Scholar] [CrossRef]
  24. Demmler, K.M.; Ecker, O.; Qaim, M. Supermarket shopping and nutritional outcomes: A panel data analysis for urban Kenya. World Dev. 2018, 102, 292–303. [Google Scholar] [CrossRef]
  25. Berger, M.; van Helvoirt, B. Ensuring food secure cities—Retail modernization and policy implications in Nairobi, Kenya. Food Policy 2018, 79, 12–22. [Google Scholar] [CrossRef]
  26. Zhong, T.; Si, Z.; Crush, J.; Xu, Z.; Huang, X.; Scott, S.; Tang, S.; Zhang, X. The impact of proximity to wet markets and supermarkets on household dietary diversity in Nanjing City, China. Sustainability 2018, 10, 1465. [Google Scholar] [CrossRef]
  27. Vetter, T.; Larsen, M.N.; Bruun, T.B. Supermarket-led development and the neglect of traditional food value chains: Reflections on Indonesia’s Agri-food system transformation. Sustainability 2019, 11, 498. [Google Scholar] [CrossRef]
  28. Steyn, N.P.; Mchiza, Z.J. Obesity and the nutrition transition in Sub-Saharan Africa. Ann. N. Y. Acad. Sci. 2014, 1311, 88–101. [Google Scholar] [CrossRef] [PubMed]
  29. Ziba, F.; Phiri, M. The Expansion of Regional Supermarket Chains: Implications for Local Suppliers in Zambia; World Institute for Development Economic Research (UNU-WIDER): Helsinki, Finland, 2017. [Google Scholar]
  30. Planet Retail. Country Breakdown by Retailer. Available online: http://www.planetretail.net/ (accessed on 10 April 2017).
  31. Shoprite Holdings. Financial Results for the Year Ended 2 July 2017. Johannesburg. Available online: https://www.shopriteholdings.co.za/investor-centre.html (accessed on 2 April 2019).
  32. Rupa, A.J.; Umberger, W.J.; Zeng, D. Does food market modernisation lead to improved dietary diversity and diet quality for urban Vietnamese households? Aust. J. Agric. Resour. Econ. 2019, 59, 1–22. [Google Scholar] [CrossRef]
  33. Monteiro, C.A.; Levy, R.B.; Claro, M.R.; de Castro, I.R.R.; Cannon, G. Increasing consumption of ultra-processed foods and likely impact on human health: Evidence from Brazil. Public Health Nutr. 2010, 14, 5–13. [Google Scholar] [CrossRef]
  34. Beatty, T.K.M.; Lin, B.H.; Smith, T.A. Is diet quality improving? Distribution changes in the United States, 1989–2008. Am. J. Agric. Econ. 2014, 96, 769–789. [Google Scholar] [CrossRef]
  35. Cappellari, L.; Jenkins, S.P. Multivariate probit regression using simulated maximum likelihood. Stata J. 2003, 3, 278–294. [Google Scholar] [CrossRef]
  36. The World Bank. Poverty—World Bank Open Data—World Bank Group. Available online: https://data.worldbank.org/topic/poverty (accessed on 3 August 2019).
  37. Figuié, M.; Moustier, P. Market appeal in an emerging economy: Supermarkets and poor consumers in Vietnam. Food Policy 2009, 34, 210–217. [Google Scholar] [CrossRef]
  38. Mergenthaler, M.; Weinberger, K.; Qaim, M. The food system transformation in developing countries: A disaggregate demand analysis for fruits and vegetables in Vietnam. Food Policy 2009, 34, 426–436. [Google Scholar] [CrossRef]
  39. Gorton, M.; Sauer, J.; Supatpongkul, P. Wet markets, supermarkets and the “big middle” for food retailing in developing countries: Evidence from Thailand. World Dev. 2011, 39, 1624–1637. [Google Scholar] [CrossRef]
  40. Schipmann, C.; Qaim, M. Modern food retailers and traditional markets in developing countries: Comparing quality, prices, and competition strategies in Thailand. Appl. Econ. Perspect. Policy 2011, 33, 345–362. [Google Scholar] [CrossRef]
  41. Wertheim-Heck, S.C.O.; Vellema, S.; Spaargaren, G. Food safety and urban food markets in Vietnam: The need for flexible and customized retail modernization policies. Food Policy 2015, 54, 95–106. [Google Scholar] [CrossRef]
  42. Suryadarma, D.; Akhmadi, A.P.; Budiyati, S.; Rosfadhila, M.; Suryahadi, A. Traditional food traders in developing countries and competition from supermarkets: Evidence from Indonesia. Food Policy 2010, 35, 79–86. [Google Scholar] [CrossRef]
  43. Stewart, H.; Dong, D. How strong is the demand for food through direct-to-consumer outlets? Food Policy 2018, 79, 35–43. [Google Scholar] [CrossRef]
  44. Hovhannisyan, V.; Cho, C.; Bozic, M. The relationship between price and retail concentration: Evidence from the US food industry. Eur. Rev. Agric. Econ. 2019, 46, 319–345. [Google Scholar] [CrossRef]
  45. Godfray, H.C.J.; Aveyard, P.; Garnett, T.; Hall, J.W.; Key, T.J.; Lorimer, J.; Pierrehumbert, R.T.; Scarborough, P.; Springmann, M.; Jebb, S.A. Meat consumption, health, and the environment. Science 2018, 361, eaam5324. [Google Scholar] [CrossRef] [PubMed] [Green Version]
  46. Glanz, K.; Bader, M.D.; Iyer, S. Retail grocery store marketing strategies and obesity: An integrative review. Am. J. Pre. Med. 2012, 42, 503–512. [Google Scholar] [CrossRef] [PubMed]
  47. Payne, C.; Niculescu, M. Can healthy checkout end-caps improve targeted fruit and vegetable purchases? Evidence from grocery and SNAP participant purchases. Food Policy 2018, 79, 318–323. [Google Scholar] [CrossRef]
Figure 1. Frequency of use of modern and traditional retailers in Lusaka City.
Sustainability 11 04306 g001
Figure 2. Household food expenditure shares spent in different retail outlets in Lusaka City.
Sustainability 11 04306 g002
Table 1. Key characteristics of different food retailers in Lusaka City, Zambia.
CharacteristicModern RetailersTraditional Retailers
HypermarketSupermarketConvenience StoreFast-Food RestaurantGrocery StoreTraditional MarketRoadside MarketNeighborhood Kiosk
Typical locationBig shopping mallBig shopping mallSmall shopping mallBig shopping mall or gas stationVery small shopping mallTraditional marketplaceInformal stallFormal or informal stall
Floor space (m2)>200100–200<10010–3010–701–101–51–5
Modern cash tills4–154–10<4<4NoneNoneNoneNone
Service typeSelf-serviceSelf-serviceSelf-servicePressing orderOver the counterOver the counterOver the counterOver the counter
Credit facilityNoNoNoNoPossiblePossiblePossiblePossible
Promotions via mediaOftenOftenOftenOftenVery rareNoNoNo
Price discountsOccasional (e.g., month ends)Occasional (e.g., month ends)Occasional (e.g., month ends)Occasional (e.g., month ends)Very rareNoNoNo
Price negotiationNoNoNoNoNoOftenOftenOften
Product rangeLarge variety of food and non-food productsLarge variety of food and non-food productsLimited variety of food and non-food productsOnly fast food products and beveragesLimited variety of food productsFairly large variety of legumes, cereals, vegetablesFairly large variety of fruits and vegetablesFairly large variety of legumes, cereals, vegetables
Large variety of fruits and vegetablesLarge variety of fruits and vegetablesLimited variety of fruits and vegetablesLimited variety of vegetables
Frozen, canned, and cooked foodFrozen, canned, and cooked foodLimited variety of frozen and canned food Sometimes cooked food
Packaging sizeSmall to very largeSmall to very largeSmall to very largeSmall to very largeSmall to largeVery small to smallVery small to smallVery small to small
Repacking NoNoNoNoNoOftenOftenOften
Key actors (examples)Game Stores, Cheers, ChoppiesShoprite, PicknPay, Food Lover’s, SpursNumerousHungry Lion, Debonairs Pizza, KFC, KEGNumerousSoweto, Compound MarketsNumerousNumerous
Table 2. Socioeconomic characteristics and food consumption patterns.
Full SampleBy Income Tercile
LowestMiddleHighest
Socioeconomic characteristics
Household income (US$/year)10691.401855.677548.1422920.93
(12163.16)(1036.68)(2134.58)(14347.06)
Household size (members)4.524.534.474.56
(1.63)(1.79)(1.66)(1.43)
Male household head (dummy)0.530.460.490.65
(0.50)(0.50)(0.50)(0.48)
Education of household head (dummy)12.039.4811.8814.77
(3.93)(3.62)(3.46)(2.71)
Office job (dummy, any household member)0.450.100.510.74
(0.50)(0.30)(0.50)(0.44)
Car ownership (dummy)0.280.030.210.60
(0.45)(0.16)(0.41)(0.49)
Food consumption
Cereals and tubers (kg/week)11.8811.2311.4512.97
(5.20)(5.48)(4.56)(5.38)
Legumes (kg/week)1.221.271.341.03
(1.59)(1.55)(1.83)(1.34)
Fruits (kg/week)0.280.220.260.37
(0.82)(0.73)(0.83)(0.89)
Vegetables (kg/week)4.224.364.573.70
(3.74)(3.78)(3.87)(3.52)
Meat and fish (kg/week)4.813.384.856.24
(3.45)(2.86)(3.24)(3.64)
Dairy products (kg/week)0.610.250.481.11
(1.27)(0.65)(1.01)(1.74)
Eggs (kg/week)0.440.280.340.69
(0.77)(0.64)(0.67)(0.92)
Oils and fats (kg/week)0.690.650.720.70
(0.60)(0.58)(0.60)(0.62)
Sugar, sweetened beverages (kg/week)1.681.281.652.13
(2.59)(1.99)(2.31)(3.26)
Food expenditures
Total weekly food expenditure (ZMW/capita)112.4696.32115.61125.69
(62.98)(65.99)(59.37)(60.18)
Unprocessed foods (%)0.250.290.250.20
(0.14)(0.16)(0.13)(0.12)
Primary processed foods (%)0.400.350.400.45
(0.17)(0.18)(0.17)(0.15)
Ultra-processed foods (%)0.350.360.350.35
(0.14)(0.14)(0.14)(0.12)
Observations475159160156
Notes: Mean values are shown with standard deviations in parentheses. ZMW, Zambia Kwacha (local currency). The average exchange rate was ZMW 9.87 = US$ 1 in mid-2018. Descriptive statistics of additional variables are shown in Table S3 in the Supplementary material.
Table 3. Proportion of households using different modern and traditional retailers.
Full SampleBy Income Tercile
LowestMiddleHighest
Modern retailers
Hypermarkets0.050.010.040.12
Supermarkets0.730.480.780.92
Convenience store 0.120.120.090.16
Fast-food restaurant 0.020.010.010.04
Traditional retailers
Grocery stores0.450.640.430.28
Traditional market 0.730.700.740.74
Roadside market 0.360.540.330.20
Neighborhood kiosk 0.200.170.200.23
Observations475159160156
Table 4. Factors influencing the use of different food retailers (multivariate probit model).
Modern RetailersTraditional Retailers
HypermarketSupermarketConvenience StoreFast-Food RestaurantGrocery StoreTraditional MarketRoadside MarketNeighborhood Kiosk
Income (log)0.031 **0.063 ***0.0270.011−0.045 **0.015−0.043 **0.072 ***
(0.015)(0.017)(0.018)(0.009)(0.022)(0.022)(0.021)(0.022)
Household size−0.004−0.031 **0.019 *0.009 *0.054 ***0.0170.044 ***−0.001
(0.009)(0.012)(0.011)(0.005)(0.016)(0.016)(0.015)(0.026)
Education (years)−0.0020.025 ***−0.0070.006 **−0.021 ***0.000−0.028 ***−0.012 *
(0.005)(0.006)(0.005)(0.003)(0.007)(0.007)(0.007)(0.006)
Age (years)0.0000.0000.001−0.001−0.002−0.001−0.0020.001
(0.001)(0.001)(0.001)(0.001)(0.002)(0.002)(0.002)(0.002)
Male (dummy)0.007−0.088 **0.022−0.0080.105 **0.0090.168 ***0.091 **
(0.023)(0.035)(0.032)(0.015)(0.044)(0.041)(0.043)(0.038)
Office job (dummy)0.0040.109 **−0.015−0.033 *−0.0720.123 **−0.125 **−0.100 **
(0.027)(0.043)(0.038)(0.018)(0.052)(0.053)(0.051)(0.046)
Car ownership (dummy)0.054 **0.157 ***0.086 **0.010−0.124 **−0.113 **0.008−0.012
(0.024)(0.058)(0.038)(0.017)(0.056)(0.054)(0.054)(0.048)
Adolescents (dummy)0.0140.053−0.0030.010−0.0170.050−0.0600.043
(0.022)(0.037)(0.034)(0.015)(0.046)(0.045)(0.045)(0.040)
Children (dummy)−0.002−0.0190.0150.0110.0300.0610.0090.016
(0.022)(0.040)(0.034)(0.016)(0.048)(0.046)(0.046)(0.042)
Chewa (dummy)−0.035−0.011−0.008−0.1760.107 *−0.024−0.0980.007
(0.047)(0.050)(0.048)(6.286)(0.064)(0.063)(0.062)(0.055)
Tonga (dummy)0.058 **−0.118 **0.0670.0080.0050.005−0.057−0.008
(0.024)(0.048)(0.041)(0.017)(0.058)(0.060)(0.056)(0.050)
Catholic (dummy)0.039 *−0.089 **0.0520.0200.0780.036−0.0410.067
(0.023)(0.039)(0.033)(0.016)(0.049)(0.047)(0.047)(0.041)
Seventh Day Adventist (dummy)−0.0170.031−0.0590.0010.0100.083−0.049−0.007
(0.028)(0.053)(0.049)(0.014)(0.060)(0.063)(0.059)(0.058)
Notes: Average marginal effects are shown with standard errors in parenthesis. Number of observations = 475. Log pseudo likelihood = −1460, and Wald χ2 (104) = 364. Bemba and Protestant are used as a reference group for ethnicity—Chewa and Tonga, and religion status—Catholic and Seventh Day Adventist, respectively. * significant at the 10% level; ** significant at the 5% level; *** significant at the 1% level.
Table 5. Associations between the use of different retailers and food processing levels.
Ultra-Processed Foods (Expenditure Share, %)Primary Processed Foods (Expenditure Share, %)Unprocessed Foods (Expenditure Share, %)
Panel A: Only supermarkets considered
Supermarket0.051 **0.043 *−0.094 ***
(0.022)(0.021)(0.027)
Other covariatesYesYesYes
Panel B: Multiple food retailers considered
Hypermarket0.146 *−0.018−0.128
(0.071)(0.095)(0.091)
Supermarket0.196 ***−0.053−0.143 *
(0.052)(0.075)(0.075)
Convenience store0.293 ***−0.267 **−0.026
(0.091)(0.110)(0.097)
Fast-food restaurant0.611 ***−0.671 ***0.060
(0.109)(0.091)(0.168)
Grocery store0.217 ***−0.043−0.174 **
(0.055)(0.070)(0.066)
Traditional market0.063−0.122 *0.058
(0.044)(0.063)(0.070)
Roadside market0.041−0.164 **0.122 *
(0.054)(0.061)(0.063)
Neighborhood kiosk0.274 ***−0.101−0.173 *
(0.079)(0.093)(0.098)
Other covariatesYesYesYes
Observations475475475
Notes: Ordinary least squares estimates are shown with robust standard errors clustered at compound level in parentheses. All types of retailers are represented by the household expenditure share for this retailer. Socioeconomic control variables are included in all models, but are not shown here, for purposes of brevity. Full estimation results are shown in Table S5 in the Supplementary material. * significant at the 10% level; ** significant at the 5% level; *** significant at the 1% level.
Table 6. Associations between the use of different retailers and the consumption of selected food groups.
Food Quantity (kg/week)
Cereals and TubersLegumes Fruits Vegetables Meat and FishDairy ProductsEggs Oils and FatsSugar, Beverages
Panel A: Only supermarkets considered
Supermarket−0.003−0.001−0.005−0.0010.015 ***0.014 *−0.002−0.003−0.010 ***
(0.006)(0.005)(0.004)(0.009)(0.006)(0.007)(0.001)(0.002)(0.004)
Other covariatesYesYesYesYesYesYesYesYesYes
Panel B: Multiple food retailers considered
Hypermarket0.025−0.009−0.0090.0130.043 *0.053 *0.0070.0090.040 ***
(0.031)(0.019)(0.018)(0.020)(0.023)(0.029)(0.006)(0.005)(0.008)
Supermarket0.0110.003−0.031 **0.0270.030 *0.055 ***0.0050.0050.015 *
(0.018)(0.012)(0.015)(0.021)(0.016)(0.020)(0.003)(0.004)(0.008)
Convenience store0.058 **−0.007−0.039 *0.0120.0220.0140.0020.014 **0.020
(0.025)(0.011)(0.023)(0.019)(0.015)(0.050)(0.005)(0.006)(0.013)
Fast-food restaurant−0.100 *** 0.110 *0.132 ** 0.105 **
(0.037) (0.062)(0.055) (0.049)
Grocery store0.013−0.003−0.030 *0.0160.0260.063 **0.008 **0.0050.028 ***
(0.016)(0.013)(0.017)(0.023)(0.016)(0.029)(0.004)(0.004)(0.007)
Traditional market0.0110.016−0.033 **0.058 ***0.0150.0230.0040.011 ***0.024 ***
(0.018)(0.013)(0.015)(0.015)(0.015)(0.022)(0.003)(0.004)(0.008)
Roadside market0.0100.012−0.038 **0.038 **0.0070.038 **0.0060.0050.010
(0.019)(0.013)(0.018)(0.016)(0.016)(0.015)(0.004)(0.004)(0.007)
Neighborhood kiosk0.030−0.013−0.014−0.008−0.0100.057 **0.017 ***0.0070.027 *
(0.027)(0.015)(0.017)(0.025)(0.019)(0.027)(0.004)(0.005)(0.015)
Other covariatesYesYesYesYesYesYesYesYesYes
Observations475475475475475475475475475
Notes: Tobit estimates are shown with robust standard errors clustered at compound level in parentheses. All types of retailers are represented by the household expenditure share for this retailer. Socioeconomic control variables are included in all models, but are not shown here, for purposes of brevity. Full estimation results are shown in Tables S9 and S10 in the Supplementary material. * significant at the 10% level; ** significant at the 5% level; *** significant at the 1% level.

