Article

The Sustainable Development of Choronymic Cultural Landscapes in China Based on Geo-Informatic Tupu

1
State Key Laboratory of Resources and Environmental Information System, Institute of Geographic Sciences and Natural Resources Research, CAS, Beijing 100101, China
2
Institute of Geographic Sciences and Natural Resources Research, Chinese Academy of Sciences, Beijing 100101, China
3
University of Chinese Academy of Sciences, Beijing 100049, China
4
School of Geography, Jiangsu Center for Collaborative Innovation in Geographical Information Resource Development and Application, Nanjing Normal University, Nanjing 210023, China
*
Author to whom correspondence should be addressed.
Sustainability 2019, 11(16), 4302; https://doi.org/10.3390/su11164302
Submission received: 10 July 2019 / Revised: 2 August 2019 / Accepted: 4 August 2019 / Published: 9 August 2019

Abstract

:
As a part of cultural landscapes, toponyms with abundant cultural connotations and a long history are valuable cultural heritage assets. Choronyms not only reflect natural and social phenomena but also help with relevant management and naming work. In order to explore the historical development sequence of choronymic cultural landscape evolution, we analyze the spatial–temporal pattern evolution, spatial–temporal variation, spatial association, and semantic evolution of choronymic cultural landscapes since the Qin dynasty. We adopt the sequent snapshot model and an event-based state amendment model to establish a spatio-temporal database. That can provide decision supports and theoretical reference for the sustainable development of toponymic landscapes. Results indicate the following: (1) Spatial distribution of toponym density has been different since the Qin dynasty. The cores of toponym density spread from the middle-lower reaches of the Yellow River to Yangtze Plain, Chengdu Plain, Pearl River Delta Plain. (2) Spatial distribution of choronyms is agglomerative since the Qin dynasty and uneven at national and provincial scales since the Yuan dynasty. Temporal distribution of toponyms at different levels is centralized. (3) Spatial agglomeration phenomena of toponyms are positively clustered in nine periods. The Ming dynasty presents the largest degree of spatial aggregation. (4) Words relevant to blessings, orientation, and hydrological features have high proportions in the top 20 words. (5) Spatial distribution of county-level choronyms named over the last 1000 years and “Millennium Ancient Counties” are unbalanced at national and provincial scales.

1. Introduction

Cultural landscapes are a variety of human activity forms relevant to natural landscapes [1]. They include tangible and intangible forms. The former are human creations similar to language, music, the legal system, and so on, they do not necessarily have a solid tangible form. Moreover, Cosgrove and Jackson considered the “landscape” as a cultural concept for an interdisciplinary re-visioning, this vision of cultural geography focused on geography’s visual cultural politics [2]. Toponyms (or place names) are the preservations and marks of regional cultures on the surface level, they can directly reveal space distribution of languages and ethnic origins. Toponyms are the names given to particular places by people, and defined as names for natural or artificial geographic features [3]. The words, pronunciation and cultural connotation of toponyms can be regarded as the intangible cultural landscapes, while the landscapes presented by toponyms entities can be regarded as the tangible ones. Toponyms are important carriers of culture, they are products of people’s understanding for environment and tools for social communication. Toponyms are constantly evolving with the changes of natural and humanistic environment [4]. As a part of linguistic cultural landscapes, toponymic cultures include toponymic words ‘culture and entities’ culture. The former belongs to the intangible form and the field of pragmatics, while the latter is the foundation of formation and existence of the former and belongs to the tangible form. Besides, we can learn the knowledge of history, evolution, and culture of a region from toponyms. Toponyms become the witness of harmonious coexistence and sustainable development in the long-term production and living process. While with the development of social economy, a large number of toponyms with cultural and historical meanings disappeared. Hence, the United Nations held the ninth United Nations conference on the standardization of toponyms, and the panel classified toponyms as intangible cultural heritages in 2008 [5]. Toponyms are generally used to identify, mark, and locate sites and are interpretations by local residents from the naming time [6], the “toponymic landscape” denotes cluster features of toponyms formed by consistency factors in some regions [7], the “toponymic culture heritage” refers to the cultural connotation of toponyms with outstandingly universal value [8]. Toponyms belong to the category of linguistics, including minority languages toponyms, such as the Manchu language and Zhuang language, especially the UNESCO has identified the Manchu language in Northeast China as being endangered [9]. In this paper, toponyms reflecting minority languages, with a long history, rich cultural connotation, and great significance could be recognized as toponymic cultural heritages. Moreover, toponymic landscapes can not only reflect the features of past and present natural environments but also record information such as significant political changes, the vicissitude of a country, ethnic migration, religious beliefs, and military events [10,11]. Choronyms are a part of toponymic landscapes. They not only describe natural and social phenomena but also help with the relevant management and naming work. Choronyms are commonly the names of administrative divisions that have certain boundaries, which are directly derived from the administrative divisions. An administrative division system is a complex system and changes frequently. It is one of the basic elements of choronyms and reflects the position of a choronym in the regime of a particular time–space system [7], such as the rank and affiliation of choronyms (the latter can roughly represent the location of choronyms). With the changes in dynasties, administrative divisions at different levels and their corresponding toponyms have constantly changed. Moreover, choronyms are usually based on geographical entities, cultural properties, or desires of the governors.
Although scholars have studied the features of toponymic landscapes, few have paid attention to the spatio-temporal evolution of toponymic landscapes at a large scale, and little research has involved visualizing maps to clarify these evolutions intuitively and accurately. China has a long history and a large number of toponymic cultural heritages, and these heritages record the history of China’s civilization, contain a unique value, and the way of thinking. They are precious cultural resources with an important inheritance value. However, with the rapid development of urbanization and industrialization, a large number of toponyms, especially choronyms containing important historical and cultural values, are disappearing and facing serious damages. These toponymic cultural heritage assets are in urgent need of rescue and protection. Consequently, it is necessary to explore the laws of choronymic cultural landscape evolution (including the spatial-temporal evolution and semantic evolution) for protecting toponymic cultural heritages and providing decision support for the sustainable development of toponymic landscapes.
Studies concerning China’s toponyms at the primary stage emerged alongside academic works on ancient geography [11]. Subsequent studies concerning toponyms had been sustaining. Especially, many published works interpreted toponyms from the multidisciplinary fields of historiography, linguistics, culturology, and geography after the 1st Toponyms Census of China in the 1980s [11,12,13,14,15,16,17,18]. China established the Committee of Experts on the Protection of toponymic cultural heritages and launched the project of protecting toponymic cultural heritages since 2004. In the 21st century, toponymic research in contemporary time has tended to focus on quantitative analyses. Such as, the method of GIS is widely utilized in toponymic studies, and geo-visualization techniques play a significant part in the quantification and visualization research of toponyms. Generally, toponymic research has focused on using toponyms to interpret land use changes, reconstruct historical land use, and analyze traditional practices [6,19,20], on constructing a database of historical and contemporary toponyms based on a genealogy GIS [21], on using toponyms to reveal climate changes [22], on analyzing the spatial distribution features of toponyms based on GIS, containing rural toponyms, dialectic toponyms, and ethnic minority language toponyms [23,24,25,26], on utilizing GIS technology to analyze toponymic landscapes [7,27,28,29]. As a kind of “living heritages”, toponyms storing data of local cultures and languages can act as a proxy for past situations and supply insight into the heritages of a certain region [6,23,30,31,32,33,34].

2. Data and Methods

2.1. Data Sources and Preparation

The earliest administrative division unit is “County” that approximately appeared in the 7th Century BC. A “Prefecture” (Jun) was an administrative unit that dominated some “Counties” (Xian), which dated back to the spring and autumn period (770–476 BC) [28]. The prefecture-county system was implemented nationwide during the Qin dynasty (221–207 BC), and “Counties” had a wide distribution in ancient China [35]. The Qin dynasty was the first dynasty in which China’s administrative system was formally established [36], so this paper considers the choronyms in China, at the county level or higher since the Qin dynasty until 2010 AD. The historical toponym data were obtained from The Historical Atlas of China [37]. The territories of China in historical periods are also in line with this atlas. The atlas consists of eight volumes, 20 map series, and nearly 70,000 toponyms, which is the most complete atlas of China’s historical administrative districts over the last 100 years. It also represents the best historical map compilation of China in the past 100 years. Toponyms in this atlas can reflect the natural and social/economic landscapes in the historical period of China. For example, in the North China Plain, there were some toponyms named “Qiu” (hill) and “Fu” (mound) in the Qin dynasty. These toponyms could reflect topographical features at the corresponding time. Since the Tang dynasty, there were a lot of toponyms named “Zhen” (town), “Ji” (market), and “Shi” (market) in the central plains. These toponyms could indicate the rising of small commercial cities. We vectorized the paper version of the atlas, and other data from the Dictionary of Chinese Historical Toponyms [38], The New Century Chinese City View [39], The Changes of Administrative Divisions in Chinese History [40], the Encyclopedic Dictionary of Ancient and Modern Chinese Geographical Names [41], and China’s Toponyms Anecdotes Dictionary [42] were sorted. The data of administrative divisions of China at a scale of 1:1,000,000 in 2010 AD were acquired from the National Catalogue Service For Geographic Information. Table 1 shows the time frames and map scales since the Qin dynasty. Digital Elevation Model (DEM) data at a resolution of 30 m were obtained from the Resource and Environment Data Cloud Platform.

2.2. Research Methods

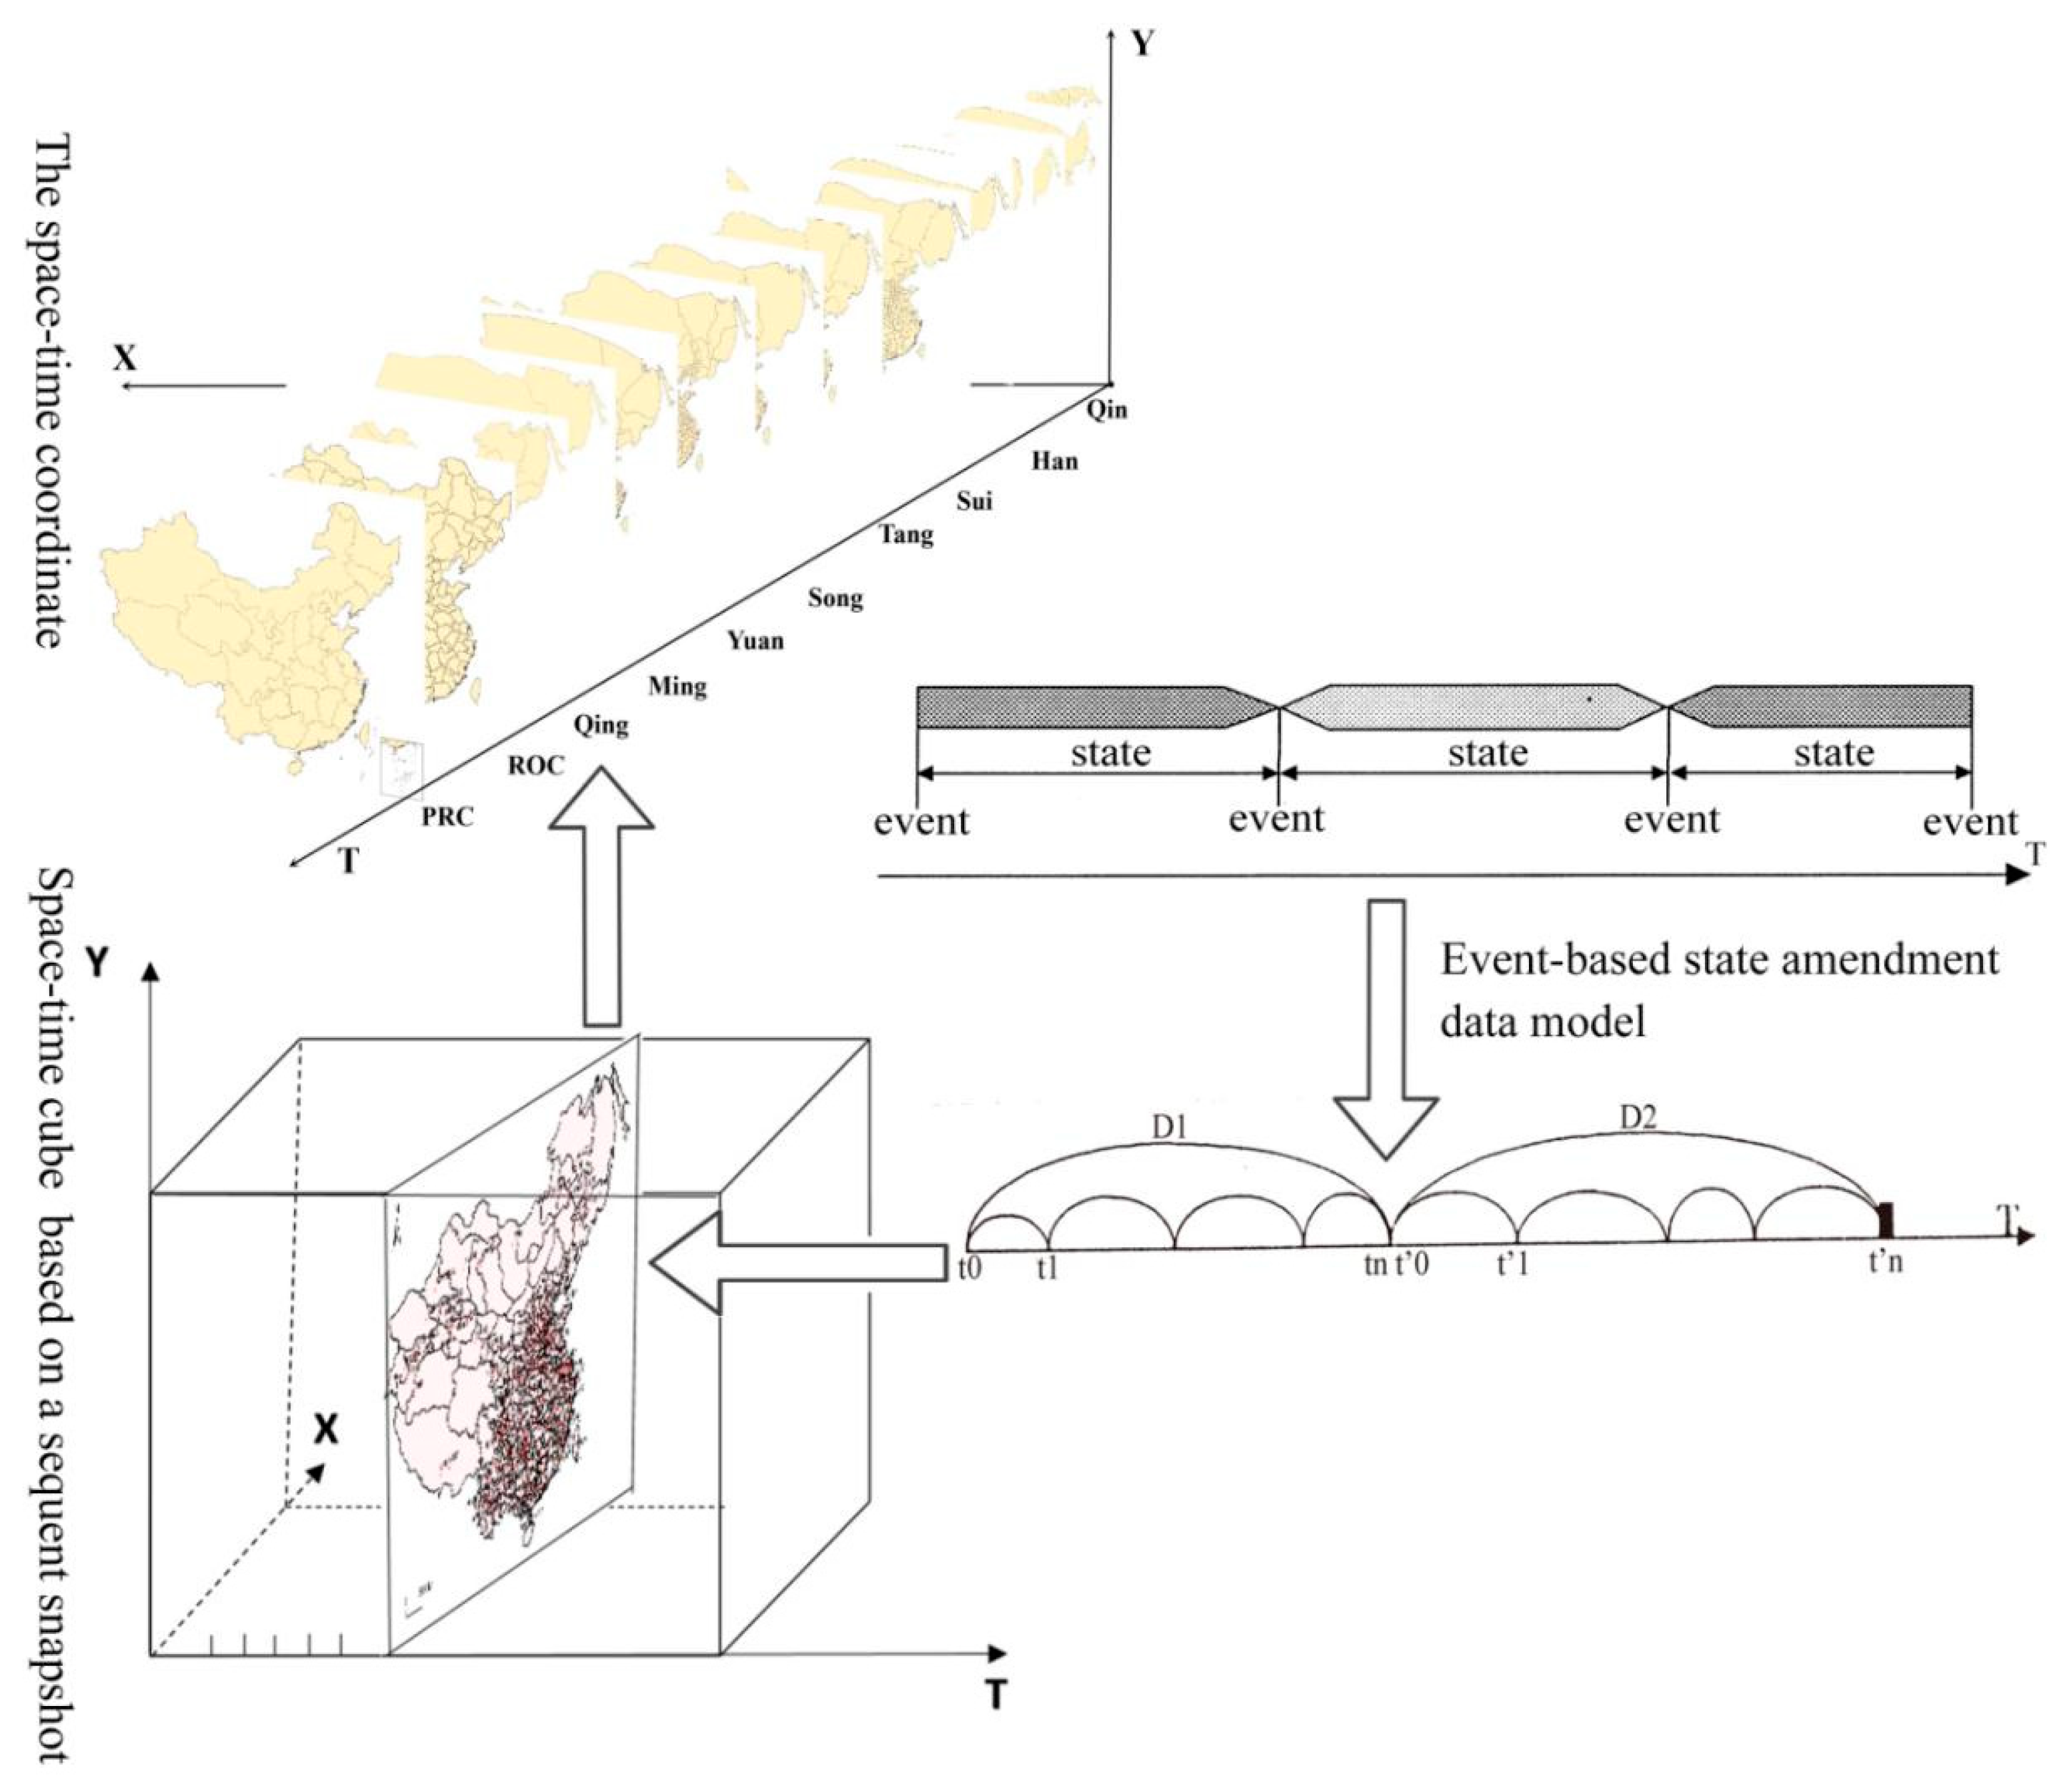
2.2.1. Spatial-Temporal Database of Choronym Evolution

A toponym has both a specific geographical location and a specific time of existence. That is, all choronyms have a space–time coordinate. In this study, we took China’s space scope as the space coordinate, and China’s history since the Qin dynasty as the time coordinate (Figure 1). Generally, time information is demonstrated in two modes: Event and state [43]. A geographic entity in its lifespan has different states and events. An event is defined as a process that is transformed from one state to another. Considering the availability of historical data, we analyzed the spatial–temporal evolution pattern of choronyms since the Qin dynasty by building a database based on a sequent snapshot model (Figure 1). In this study, the changes in choronyms were displayed in maps based on evolution events, and compromising the ideas of the ground state correction model and spatial–temporal model based on events, we adopted an event-based state amendment model to realize the continuous evolution of choronyms. D1 and D2 denote the evolution events of choronyms in two adjacent dynasties, and t0 and t1 represent the evolution event in a dynasty (Figure 1). The evolution of choronyms is divided into seven types in this paper (Table 2).

2.2.2. The Kernel Density Estimation Method

The method of kernel density estimation (KDE) utilizes a moving unit (equal to a window) to estimate the density of a point. It is defined as x1, x2, where xn is independent, identically distributed samples are extracted from an object distribution density function f, and f(x) is the value estimated at a given point x. Researchers generally use the method of Rosenblatt–Parzen kernel estimation [44]:
f ( x ) = 1 n h i = 1 n { k [ d ( x , x i ) h ] } .
In Equation (1), n represents the number of toponyms in the range scale, k(·) is the kernel density function of toponyms, h is the distance threshold, and d(x, xi) is the Euclidean distance between estimated point x and sample xi. The KDE method utilizes the distance attenuation bandwidth to denote an object’s spatial influence domain, which is appropriate to situations that consider the influence of regions [45]. Therefore, we utilized this method to study toponym density changes of China’s choronyms since the Qin dynasty.

2.2.3. Spatial-Temporal Variation Indicators

(1) Nearest Neighbor Analysis
The nearest neighbor analysis (NNA) can be used to determine the spatial distribution of point elements. Generally, the spatial distribution types of point elements can be divided into three types: Uniform, random, and condensed. The NNA is widely used in the study of regional space structure. Stephen L.J. Smith pointed out that the NNA could be used to describe the spatial distribution of point elements accurately and objectively [46].
A N N = r 1 ¯ / r E ¯ = 2 r 1 ¯ / n A = 2 r 1 ¯ D .
In Equation (2), ANN is the nearest neighbor analysis index, r 1 ¯ is the mean of the values of r1 (r1 is the distance between the nearest point), r E ¯ is the theoretical value of the nearest distance, A denotes the area of the study region, n is the number of the nodes, and D is the point density. The spatial distribution is stochastic when the value of ANN is 1, and is homogeneous when the value is greater than 1, is agglomerate when the value is less than 1.
(2) The Coefficient of Variation
The coefficient of variation (CV) is selected to measure the spatial variation of choronyms with various types. It is a standardized measure of dispersion of a probability distribution of frequency distribution [47]. CV is defined as the ratio of the standard deviation (SD) to the mean (Equations (3) and (4)) [48], and we considered that the CV was more suitable for analyzing the spatial–temporal variation than the SD because the SD must always be understood in the context of the mean of the data, which varied between different levels of choronyms in this study. In contrast, the CV is independent of the mean in which the measurement is made [47]. Therefore, the CV was selected to measure the spatial–temporal variation of choronyms.
SD = 1 n i = 1 n ( X i X ¯ ) 2 ,
CV = S D X ¯ ,
where CV denotes the coefficient of variation, SD is the standard deviation, n represents the number of high-level administrative regionalizations, Xi is the number of choronyms of the ith high-level administrative regionalization (i = 1, 2, …, n.), and X ¯ is the mean of the number of choronyms in high-level administrative regionalizations. The higher the CV value is, the greater the spatial variation in the number of choronyms is.
(3) The Geography Concentrate Index
The geography concentrate index is an important indicator to measure the degree of concentration [48]. In this study, the geography concentrate index was used to measure the spatial distribution of choronyms, county level or higher, during the 14 periods since the Qin dynasty.
G = 100 × i = 1 n ( X i T ) 2 .
In Equation (5), G is the geography concentrate index, Xi is the number of choronyms, county level, or higher, in the ith high-level administrative regionalization in one period, T is the total number of choronyms, and n is the number of high-level administrative regionalizations. The value range of G is [0,100]. The lower the value is, the more dispersed the spatial distribution is; the higher the value is, the more concentrated the distribution is. Similarly, we also utilized G to measure the temporal distribution of choronyms, county level or higher, since the Qin dynasty.
(4) The Gini Coefficient
The Gini coefficient can be utilized to study the spatial distribution features of discrete regions [49]. Province-level administrative regions are the highest administrative regions in China, The “Province” is evolved from the “Xingsheng”, which dates back to the Yuan dynasty. Therefore, we used the Gini coefficient to further measure the spatial-temporal distribution of choronyms, county level or higher, in province-level administrative regionalizations since the Yuan dynasty.
H = P i log P i ,
H m = log N ,
G ini = H H m ,
C = 1 G ini .
In Equations (6)–(9), Gini represents the Gini coefficient, Pi is the proportion of choronyms, county level or higher, of the ith province-level administrative regionalization in the total, N is the number of province-level administrative regionalizations, and C is the distribution homogeneity. The value range of Gini is [0,1]. The lower the value is, the more dispersed the spatial-temporal distribution; the higher the value is, the more concentrated the distribution is.
(5) The Unbalanced Index
The unbalanced index can denote the degree of equilibrium (or completeness) of the distribution of subjects in different levels or regions. This paper utilized the unbalanced index to measure the degree of distribution equilibrium of choronyms, county level, or higher, in province-level administrative regionalizations since the Yuan dynasty. The unbalanced index can be obtained using the formula for calculating the concentration index in a Lorentz curve [50]:
S = i = 1 n Y i     50 ( n   +   1 ) 100 n     50 ( n   +   1 ) .
In Equation (10), S denotes the unbalanced index, Yi represents the cumulative percentage of the number of choronyms of the ith province-level administrative regionalization in the total, where the percentages are sorted from large to small, and n is the number of province-level administrative regionalizations. The value range of S is [0,1]. The lower the value is, the more dispersed the spatial–temporal distribution; the larger the value is, the more concentrated the distribution is. For example, while S = 0, the choronyms are evenly distributed in all province-level administrative regionalizations; when S = 1, the choronyms are all concentrated in one province-level administrative regionalization.

2.2.4. The Spatial Association Indicator

Spatial association statistics are applied to measure and analyze the degree of associations among divisions in a geographic space. The spatial association analysis needs geographical relationships in high-level administrative regionalizations to be modeled, and a matrix of spatial weighting is used to conceptualize the spatial relationships and show how strong the influence is between regions. We utilized a spatial weighting matrix, which took the contiguity into consideration. If two spatial entities have a common border of non-zero length, they are considered contiguous, and a value of 1 is assigned; otherwise, a value of 0 assigned. This method is fit to describe the spatial relationship of high-level administrative regionalizations in this study. Moran’s I is one of the principal global indicators of association. It estimates the overall level of spatial association for a dataset [51]. In this paper, we used the global Moran’s I to analyze the global spatial association of choronyms in high-level administrative regionalizations since the Qin dynasty.
Global   M o r a n s   I = n i = 1 n j = 1 n w i j i = 1 n j = 1 n w i j ( X i X ¯ ) ( X j X ¯ ) i = 1 n ( X i X ¯ ) 2 .
In Equation (11), the global Moran’s I refers to the spatial association indicator, n is the number of high-level administrative regionalizations, Xi and Xj respectively refer to the number of choronyms in the ith and jth high-level administrative regionalizations (i, j= 1, 2, …, n; i ≠ j), X ¯ . is the average value, and Wij is the matrix of spatial weights. The value of Global Moran’s I is between −1 and +1; if it is positive, a positive association is indicated, and similar values are clustered in a geographic space, and there is an opposite result if the value of Global Moran’s I is negative. Theoretically, if the value is close to 0, a stochastic spatial pattern is indicated.

2.2.5. Geo-Informatic Tupu

In order to explore the spatio-temporal evolution features of China’s choronymic cultural landscapes qualitatively and quantitatively, we introduced the concept of geo-informatic Tupu. It is a group of tables, maps, curves, and graphs arranged by indicators of gradient rules or organized laws, it uses the mathematical model, GIS, and Remote Sensing (RS) methods to display spatio-temporal dynamic changes [52,53,54,55,56,57,58]. In this paper, we utilized the generated maps and adopted an event-based state amendment model to establish the spatio-temporal database based on The Historical Atlas of China [37], The New Century Chinese City View [39], and China’s Toponyms Anecdotes Dictionary [42], and subsequently selected various indicators of spatial–temporal variation and spatial association to derive a series of spatio–temporal composite maps according to time sequence (Figure 1). The spatio–temporal evolution Tupu of choronyms densities of China since the Qin was generated by the KDE method [59], and extracted the naming time information of county-level choronyms in 2010 AD by relying on the expert knowledge from the Dictionary of Chinese Historical Toponyms [38], The New Century Chinese City View [39], Encyclopedic Dictionary of Ancient and Modern Chinese Geographical Names [41], and China’s Toponyms Anecdotes Dictionary [42]. In order to analyze the spatio-temporal evolution characteristics of different levels choronyms, we set the weights of toponyms by applying the method of Expert Scoring. This paper divided choronyms into the high, prefecture, and county levels. Considering the political influence in different dynasties, capitals in different periods were also classified into a separate category for the weight scoring. For example, the weight of capital of the Sui dynasty was 0.6, of the prefecture level was 0.3, of the county level was 0.1; the weight of capital of the Tang dynasty was 0.4, of the high level was 0.3, of the prefecture level was 0.2, and of the county level was 0.1.

3. Results

As the embryonic forms of administrative units, “Counties” primordially appeared in the spring and autumn period of Chu, Qin, and other states in ancient China. According to the available data, “Counties” were mainly set up in the frontier areas of vassal states at the beginning of the spring and autumn period, because “Counties” still retained an original clan structure at that time. Strictly speaking, they were not administrative units. “Counties” were truly institutionalized after the establishment of the Qin dynasty in 221 BC, then the prefecture–county system was implemented nationwide [60]. Therefore, this paper considers the choronyms at the county level or higher in China since the Qin dynasty until 2010 AD.
As products of people recognizing and reconstructing the natural environment, choronyms are not only parts of linguistic cultural landscapes, but also indicators of natural landscape changes and social landscape changes. For example, Qidong City in Jiangsu Province was once a sea area and was named in 1989 for the meaning of developing the eastern coastal area, it preliminarily emerged as a shoal made by the sands; Hekou District in Shandong Province was also once a sea area and was named in 1984 for locating at the estuary of the Yellow River, and people initially settled there since the Qing dynasty [42]. Furthermore, generally, the density of toponyms can reflect the level of population density and economic development [59]. In order to explore the evolution venation of choronymic cultural landscapes, we analyzed the spatial–temporal pattern evolution, spatial–temporal variation, spatial association, and semantic evolution of choronymic cultural landscapes since the Qin dynasty.

3.1. Spatial–Temporal Pattern Evolution of Choronymic Cultural Landscape Entities

We calculated the toponym density by using Equation (1) and the ArcGIS software platform to intuitively demonstrate changes in the density evolution of choronyms since the Qin dynasty (Figure 2).
The birth of the state in China is generally considered to have occurred during the Xia dynasty (about the 21st century BC), the following Shang and Chou dynasties implemented the enfeoffment system, which is the first kind of administrative regions. “County” is the earliest administrative division unit, which approximately appeared in the 7th century BC and was widespread by China’s Warring States Period; “Prefecture” appeared later than “County”, it dated to the spring and autumn period [35].
Table 3 and Figure 2 indicate that the number of choronyms and the spatial distribution of toponym density had all been different since the Qin dynasty, especially the number of toponyms was increasing since the Yuan dynasty, mainly because the county-level choronyms account for the vast majority of the total, and new counties were roughly being separated from old ones over time. Hence, the People’s Republic of China (PRC) period had the most toponyms. Furthermore, regions with high toponym density were generally located in plain areas. Figure 2 also displays that regions that had high toponyms density mostly had high population density and economic level. Furthermore, the cores of toponym density gradually spread from the region of the middle-lower reaches of the Yellow River to the Yangtze Plain, the Chengdu Plain, the Pearl River Delta Plain, and so forth. This is partly because ancient China moved the economic center from the north to the south during the Song. The increasing prosperity and development of the maritime silk road led to a rapid economic development in the southern part of China during the Song and Yuan, and the cores of toponym density did not change much after the Ming and Qing because the Qing used the same choronym system as that of the Ming. However, the number of toponyms was decreased in the Song and Yuan and the reasons were complicated, which might be related to the historical administrative division system and demographic/economic factors.

3.2. Spatial–Temporal Variation of Choronymic Cultural Landscape Entities

As shown in Figure 2, the spatial–temporal distribution of toponyms density was unbalanced since the Qin dynasty. In order to describe the disequilibrium degree of spatial–temporal distribution of toponyms quantitatively, we analyzed the spatial and temporal variations of choronyms by using the indicators of the ANN, CV, G, Gini, and S. The ANN was calculated by Equation (2); CV by Equations (3) and (4); G by Equation (5); Gini by Equations (6)–(9); S by Equation (10). We specifically analyzed the spatial variation from two perspectives: The whole country and the province-level administrative regionalizations.

3.2.1. Spatial Variation of Choronym Entities

We analyzed the spatial variation of choronyms at county level or higher, in the whole country since the Qin by utilizing ANN, and CV (Figure 3). Moreover, in Figure 2, the spatial distribution of toponyms density roughly presents two parts bounded by the “Hu Line”: East is dense, while west is sparse, so we made a further analysis on spatial statistics of choronyms on the two parts of the “Hu Line” (Figure 4). As shown in Figure 3, the results demonstrated a negative correlation between ANN and CV, and approximately show a mirror image distribution on the two sides of the straight line with a value of 0.53. The values of the ANN were all less than 1, and the value range was 0.39–0.67. The values of the CV were also less than 1, and the value range was 0.42–0.72, indicating that the spatial distribution of choronyms was agglomerative since the Qin dynasty. The Tang dynasty showed the highest unevenness, while the period of the ROC had the lowest unevenness.
The “Hu Line” was put forward by Prof. Hu in 1935 and was utilized to roughly describe a geographical line of China’s population quantitatively. The “Hu Line” divides China into two parts: Southeast and Northwest. In the 1930s, the Southeast only occupied 36% of the land area but accounted for 96% of the population, while the Northwest occupied 64% of the land but just 4% of the population [61]; in the 1980s–1990s, the southeast occupied 43% of the land area but accounted for 94% of the population while the northwest occupied 57% of the land but just 6% of the population [62]. The “Hu Line” can not only reflect the spatial distribution heterogeneity of China’s population but also reveal the relationship of humans and the environment. Prof. Hu pointed out that the spatial distribution of terrain, rainfall, and population had a close relationship [62]. As shown in Figure 4, the percentages of choronyms in the southeast of “Hu Line” were all more than 65% and, since the Western Han, were over 80%. Taking the period of the PRC as an example, the Northwest only occupied 15% of choronyms. The “Hu Line” can not only reflect a spatial coupling relationship between China’s population and physiographical environments [63] but also reflect a spatial coupling relationship between China’s choronyms and population, physiographical environments.
Furthermore, because the provincial system was originated from the Yuan dynasty, we analyzed the spatial variations of choronyms, the county level, or higher, in the province-level administrative regionalizations since the Yuan dynasty by utilizing the indicators of the G, Gini, and S (Table 4). As shown in Table 4, the G values were all more than 20, the Gini values were all less than 1, the S values were between 0.20 and 0.39, and the change trends of these three indicators were consistent. This indicates that choronyms, the county level, or higher, were unevenly distributed among province-level administrative regionalizations since the Yuan dynasty. Relatively, the Yuan dynasty was the most concentrated, and the PRC was the least. In order to verify the spatial variations of choronyms in each province-level administrative regionalization, we calculated the ANNs of 31 province-level districts in 2010 respectively (Table 5).
As shown in Table 5, the results indicate that the ANNs in different provincial administrative regions were different; that is, the spatial distribution of choronyms in different province-level administrative regions was different. Furthermore, the ANNs of Hainan, Beijing, Shanghai, Tianjin, Guizhou, Chongqing, Shanxi, and Jiangxi were greater than 1, which illustrates that the spatial distribution of choronyms in these regions is relatively homogeneous compared to other regions in China. The ANNs of Xinjiang, Gansu, Heilongjiang, Guangdong, Liaoning, Ningxia, Qinghai, and so on are less than 1, which illustrates that the spatial distribution of choronyms in these regions is relatively agglomerate compared to others.

3.2.2. Temporal Variation of Choronym Entities

As shown in Table 6, the values of G were all more than 27, Gini values were less than 1, S values were between 0.16 and 0.57, and the change trends of these three indicators were consistent. Results indicate that the temporal distribution of choronyms at high, prefecture, and county levels was centralized since the Qin dynasty. The high-level temporal distribution was the most concentrated, followed by the prefecture-level and the county-level. Furthermore, we used the Lorentz curve (Figure 5) to verify the imbalance and concentration degree of temporal distribution of choronyms at different levels since the Qin dynasty. The results of these three indicators and the Lorentz curve also verified that it is feasible to use them to describe temporal distribution characteristics of toponyms.

3.3. Spatial Association of Choronymic Cultural Landscape Entities

The Moran’s I was calculated by Equation (11). As shown in Figure 3, the values of the Moran’s I of the Qin, Western Jin, Northern and Southern Dynasties, Tang, Northern Song, Southern Song, Yuan, Ming, and Qing dynasties were positive and significant at the 0.01 or 0.05 level, indicating that the spatial agglomeration phenomena of choronyms were positively clustered over the regions in these periods. By contrast, Moran’s I of the Western Han, Eastern Han, Sui, ROC, and PRC periods were negative and significant at the 0.01 or 0.05 level, indicating that the spatial agglomeration phenomena of choronyms were negatively clustered over the regions. Moreover, the Ming dynasty presents the highest degree of spatial aggregation, followed by that of the Northern Song, and the third highest was that of the Yuan dynasty. The aggregation extents of the Qin, Sui, Tang, and Qing dynasties were comparatively low.

3.4. Semantic Evolution of Choronymic Cultural Landscapes Entities

3.4.1. Toponymic Words’ Cultural Characteristics

As shown in Table 7, among the top 20 words of choronyms at the county level or higher since the Qin, the words of “Yang” (the south of mountain or north of river), “Cheng” (city), “Shan” (mountain), “An” (peace or safety), “Ping”(peace, safety or flat terrain), “Ning” (peace or safety), “Jiang” (river), and “Nan” (south) had high frequencies. “Shan” had the highest frequency in 2010. This demonstrates that people were more inclined to use the words relevant to the landscapes of mountain and river, orientation and blessings to name the administrative districts throughout history. Professor Shi Nianhai also stated that the naming of administrative units focused on geographic factors and toponyms named after natural landscapes such as mountains and rivers were universal and stable [64].
Based on some research achievements [7,42,59,64], we divided the top 20 words of choronyms into eight categories according to the words’ meaning. That is, relevant to mountains, hydrological features, terrain, orientation, blessings, ancient relics, surnames, and minority languages. As demonstrated in Figure 6, the words relevant to blessings, orientation and hydrological features had high proportions in the top 20 words. That indicates a preference for naming a choronym. We could infer that natural and man-made disasters were common in China’s history from these toponyms, and people prayed for a peaceful life by naming toponyms relevant to blessings; toponyms relevant to orientation highlight the function of indicating spatial positions; toponyms relevant to hydrological features show that the corresponding districts had significant rivers, lakes, or other hydrological features. Besides, the toponyms relevant to minority languages began to accumulate since the Qing dynasty, such as, Manchu and Mongolian languages (“Yi”, “Er”), and these toponyms were mainly located in the north and northeast of China. They were related to the governors of Qing dynasty and activity scopes of ethnic minorities. The cultural characteristics express through these ways of naming toponyms were also special toponymic cultural landscapes.
Furthermore, toponymic words can reflect the types of toponymic landscapes. For example, “Shan”, “Yang”, “Jiang”, and “Nan” toponyms belong to the natural landscape toponyms, while “Cheng” and “An” toponyms belong to the humanistic landscape toponyms. As shown in Table 7, the toponymic words indicating natural landscapes (“Yang” and “Shan”) had the largest number in 10 dynasties. Moreover, as displayed in Figure 7, the spatial distribution of “Shan”, “Cheng”, “Yang”, “Jiang”, “An”, and “Nan” toponyms could indicate that toponyms in the eastern part of the “Hu Line” were relatively concentrated, “Cheng” and “Jiang” toponyms showed more obvious spatial agglomeration, the “Cheng” toponyms were mainly distributed in the North China Plain, and the “Jiang” toponyms were mainly distributed in the Yangtze River Basin, the Pearl River Basin, and the Sanjiang Plain. The “Cheng” toponyms were mainly named for historical sites, so these toponyms were mainly distributed in the plain area, which had a long development history. Moreover, the naming pattern of rivers in China generally follows the law whereby “rivers in the south were named as ‘Jiang’, and in the north were named as ‘He’ “. Rivers in the northeast are mainly named ‘Jiang’ [65], so the “Jiang” toponyms show the same law.

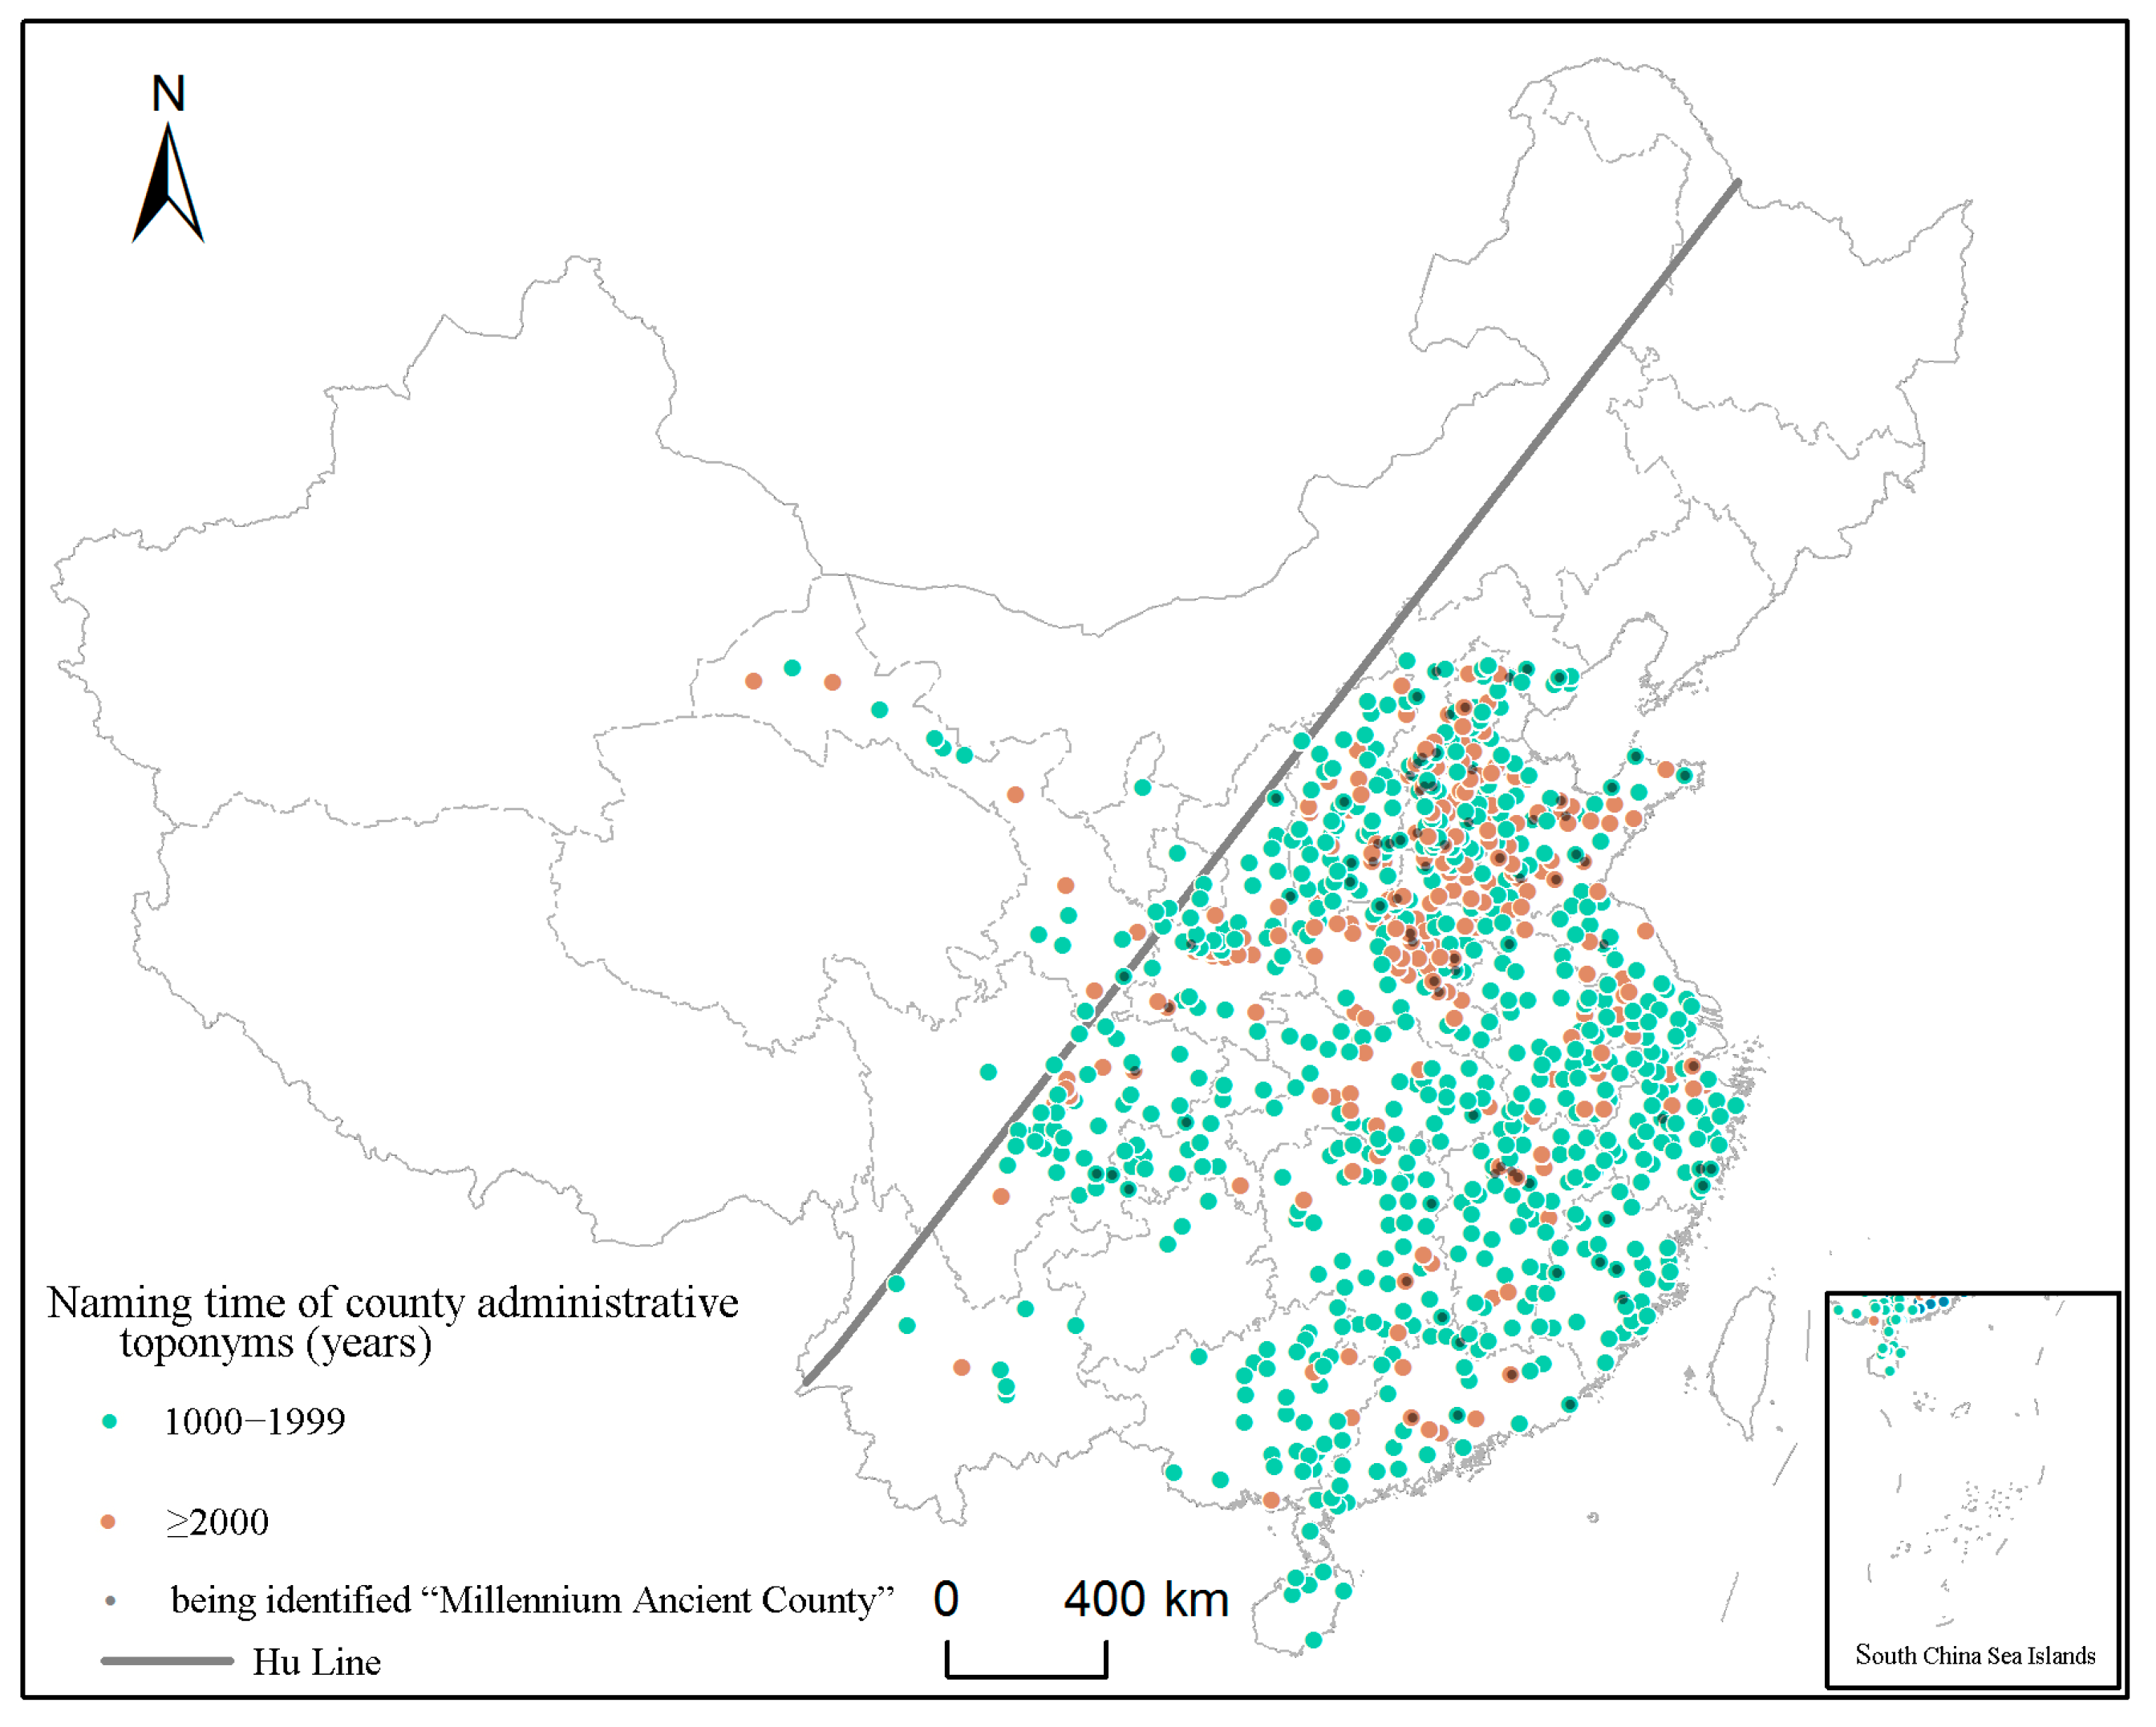
3.4.2. Millennium Ancient Counties (An Important Part of Toponymic Cultural Heritages)

County-level administrative districts are the most stable and basic administrative regions in China’s history and have played a key role in the management of the country. From the statistics of the Dictionary of Chinese Historical Toponyms [38] and The New Century Chinese City View [39], less than 3% of county-level administrative regions still use their names from the Qin and Han dynasties. Figure 8 shows that there were 826 county-level choronyms named over the last 1000 years in China, of which 220 were more than 2000 years old. Furthermore, as shown in Figure 8, nearly 98% of county-level choronyms named over the last 1000 years were located in the eastern part of the “Hu Line”, with a concentrated distribution in the plain areas, such as the North China Plain, the Guanzhong Plain, the Yangtze Plain, the Chengdu Plain, etc. The agricultural development played a vital role in ancient China, and the plain areas had relatively superior natural conditions and were suitable for agriculture and human habitation, so these regions had a larger number of choronyms named over the last 1000 years and had a larger proportion of toponyms more than 2000 years old. Furthermore, as shown in Figure 9, Hebei Province had the largest proportion of toponyms named over the last 1000 years. The second largest was the Henan Province, and the third largest was the Shandong Province. Moreover, the toponyms more than 2000 years old were also mainly distributed in these three provinces (Figure 8).
“Millennium Ancient Counties” are a key part of protecting China’s toponymic cultural heritages; that is, 100 ancient counties with a long history and with rich toponym cultural connotations will be selected to carry out key protection and publicity work at home and abroad with respect to the 826 county-level choronyms named over the last 1000 years. As shown in Figure 9, the percentages of county-level choronyms named over the last 1000 years and those were identified as the “Millennium Ancient Counties” showed a positive correlation. Generally, the more county-level choronyms named over the last 1000 years that a province have, the more toponyms are identified as the “Millennium Ancient Counties”. However, the identification of a “Millennium Ancient County” is insufficient. As Figure 8 indicates, there were only 81 county-level choronyms identified as “Millennium Ancient Counties” by the Ministry of Civil Affairs by the end of 2017, and almost all “Millennium Ancient Counties” were located in the eastern part of the “Hu Line”. The provinces of Hebei, Shandong, and Henan accounted for nearly half of the total. Furthermore, the provinces of Anhui and Guangxi had more than 30 toponyms named more than 1000 years ago but had no “Millennium Ancient Counties” (Figure 9).

4. Discussion

4.1. Influencing Factors of Spatial–Temporal Distribution of Choronymic Cultural Landscapes

The distribution of choronyms is influenced by both natural and human/social factors. The choronyms are created by humans, so they are generally more intensive where more people lived. In addition, the spatial distribution of choronyms is closely related to elevation. We made statistics of the spatial distribution of choronyms in the three steps of China’s terrain in 2010 and found that about 6% of choronyms were located in the first step (the average altitude was >4000 m), 34% were located in the second step (the average altitude was 1000–2000 m), and 60% were located in the third step (most elevations are below 500 m). That is, the higher the regional elevation is, the lower the density of the choronyms is, mainly because the high elevation restricts human activities. While the influencing factors of temporal distribution of choronyms are complex at different time scales, (for example, political factors can affect the grade and quantity of choronyms in different dynasties), population migrations and natural disasters also can cause changes in choronyms, which may have a delayed effect.

4.2. Differences and Stability of Choronymic Cultural Landscapes Spatial Agglomeration Between the Two Sides of the “Hu Line”

The “Hu Line” can reflect a spatial coupling relationship between choronyms and the physiographical environment. This paper examined the differentiation and changes in the choronym distribution on the two sides of the “Hu Line”. The “Hu Line” revealed the same characteristic of the choronyms distribution since the Qin dynasty: East is dense, while west is sparse. Moreover, nearly 98% of county-level choronyms named over the last 1000 years were located in the eastern part of the “Hu Line”, with a concentrated distribution in the plain areas. This is because the Northwest region has a dry climate and a sparse population, while the Southeast region has more plain areas, more rainfall, more population, and more choronyms. Moreover, the percentage of choronyms in the eastern part of the “Hu Line” in the Qin dynasty was the lowest for the territory scope, while the percentages of dynasties from Western Han to Ming were all more than 88% and less than 94%, and all percentages of dynasties since Qing were all less than 86%. This indicates that the government have enhanced the management and improved the development of the western part since the Qing dynasty. Even though the proportion of choronyms on both sides of the “Hu Line” has been changing since the Qin dynasty, it is basically stable for a long period; that is, the eastern part has a higher density of choronyms compared to the western part.

4.3. Proposals for the Sustainable Development of Choronymic Cultural Landscapes and the Protection of Toponymic Cultural Heritages

The longer the toponyms are created, the deeper the historical accumulation of toponyms will be. China has a rich culture of toponyms, and the ancient county-level choronyms are important toponymic cultural heritages. According to our study, there were 826 county-level choronyms named over the last 1000 years in China, of which 220 were older than 2000 years. There were approximately 60 counties still using names of the Qin and Han dynasties as of 2002. However, there were only 81 county-level choronyms identified as “Millennium Ancient Counties” by the end of 2017, and the spatial distribution of these toponyms was not balanced at a national scale or provincial scale. Almost all “Millennium Ancient Counties” were located in the eastern part of the “Hu Line”. Some provinces had more county-level choronyms named over the last 1000 years, but had no “Millennium Ancient Counties”, as were the Anhui and Guangxi Provinces. Therefore, future identification of “Millennium Ancient Counties” should consider the regions that have abundant toponymic cultures, and focus on bridging the gap between the two sides of the “Hu Line”.
In view of the advantage of geo-informatic Tupu in analyzing and expressing the spatio-temporal changes, it is suitable to the study of spatio-temporal evolution characteristics of choronymic cultural landscapes and extracting toponymic cultural heritages in this paper. The protection of toponymic cultural heritages should adhere to the requirements of preferential rescue, dominant protection, focusing on inheritance, and rational utilization; combining comprehensive protection with key protection; combining conservation research with conservation practice. Studying the formation and classification of local toponym landscape is of great significance for protecting toponymic cultural heritages and inheriting the context of toponyms. In this paper, we preliminarily extracted the toponymic cultural heritages by identifying semantic evolution features (the high-frequency words and naming time of toponyms). The results show that the identification of “Millennium Ancient Counties” was insufficient and unbalanced, so the future study could sort out significant naming and evolution events of toponyms by using geo-informatic Tupu, it could provide reference suggestions for the development and protection of the existing toponymic cultural heritages, and provide decision support for the scientific selection of potential heritages.

5. Conclusions

As linguistic fossils, toponyms have a mark function for the changes in the natural environment and social environments of different historical periods. Choronyms are an integral part of cultural landscapes and an important tool for state administration. Further research on choronymic cultural landscapes can reveal natural and sociocultural phenomena and can be used for managing and naming places. This research on the laws of choronymic cultural landscape evolution is significant for the protection of toponym cultural resources and cultural heritages, and it can provide decision support for the sustainable development of toponymic landscapes and promote the construction of a local economy. “Millennium Ancient Counties” especially have a profound cultural accumulation and broad social identity; however, historical events, such as separation, amalgamation, revocation, and renaming, have changed the landscapes of toponyms in old administrative districts, and some local governments have changed ancient toponyms artificially in order to develop the regional economy to, for example, improve the tourism industry. Even some county-level choronyms have been changed repeatedly, which has caused great inconvenience to administration management and social cognition and has destroyed toponym cultures.
Based on the data of choronyms of China since the Qin dynasty, at the county level or higher, we analyzed the spatial–temporal pattern evolution, the spatial–temporal variation, the spatial association, and the semantic evolution of choronymic cultural landscapes by adopting the sequent snapshot model and event-based state amendment model to establish a spatio-temporal database and by utilizing various indicators of spatial–temporal variation and association. Conclusions are summarized as follows.
(1)
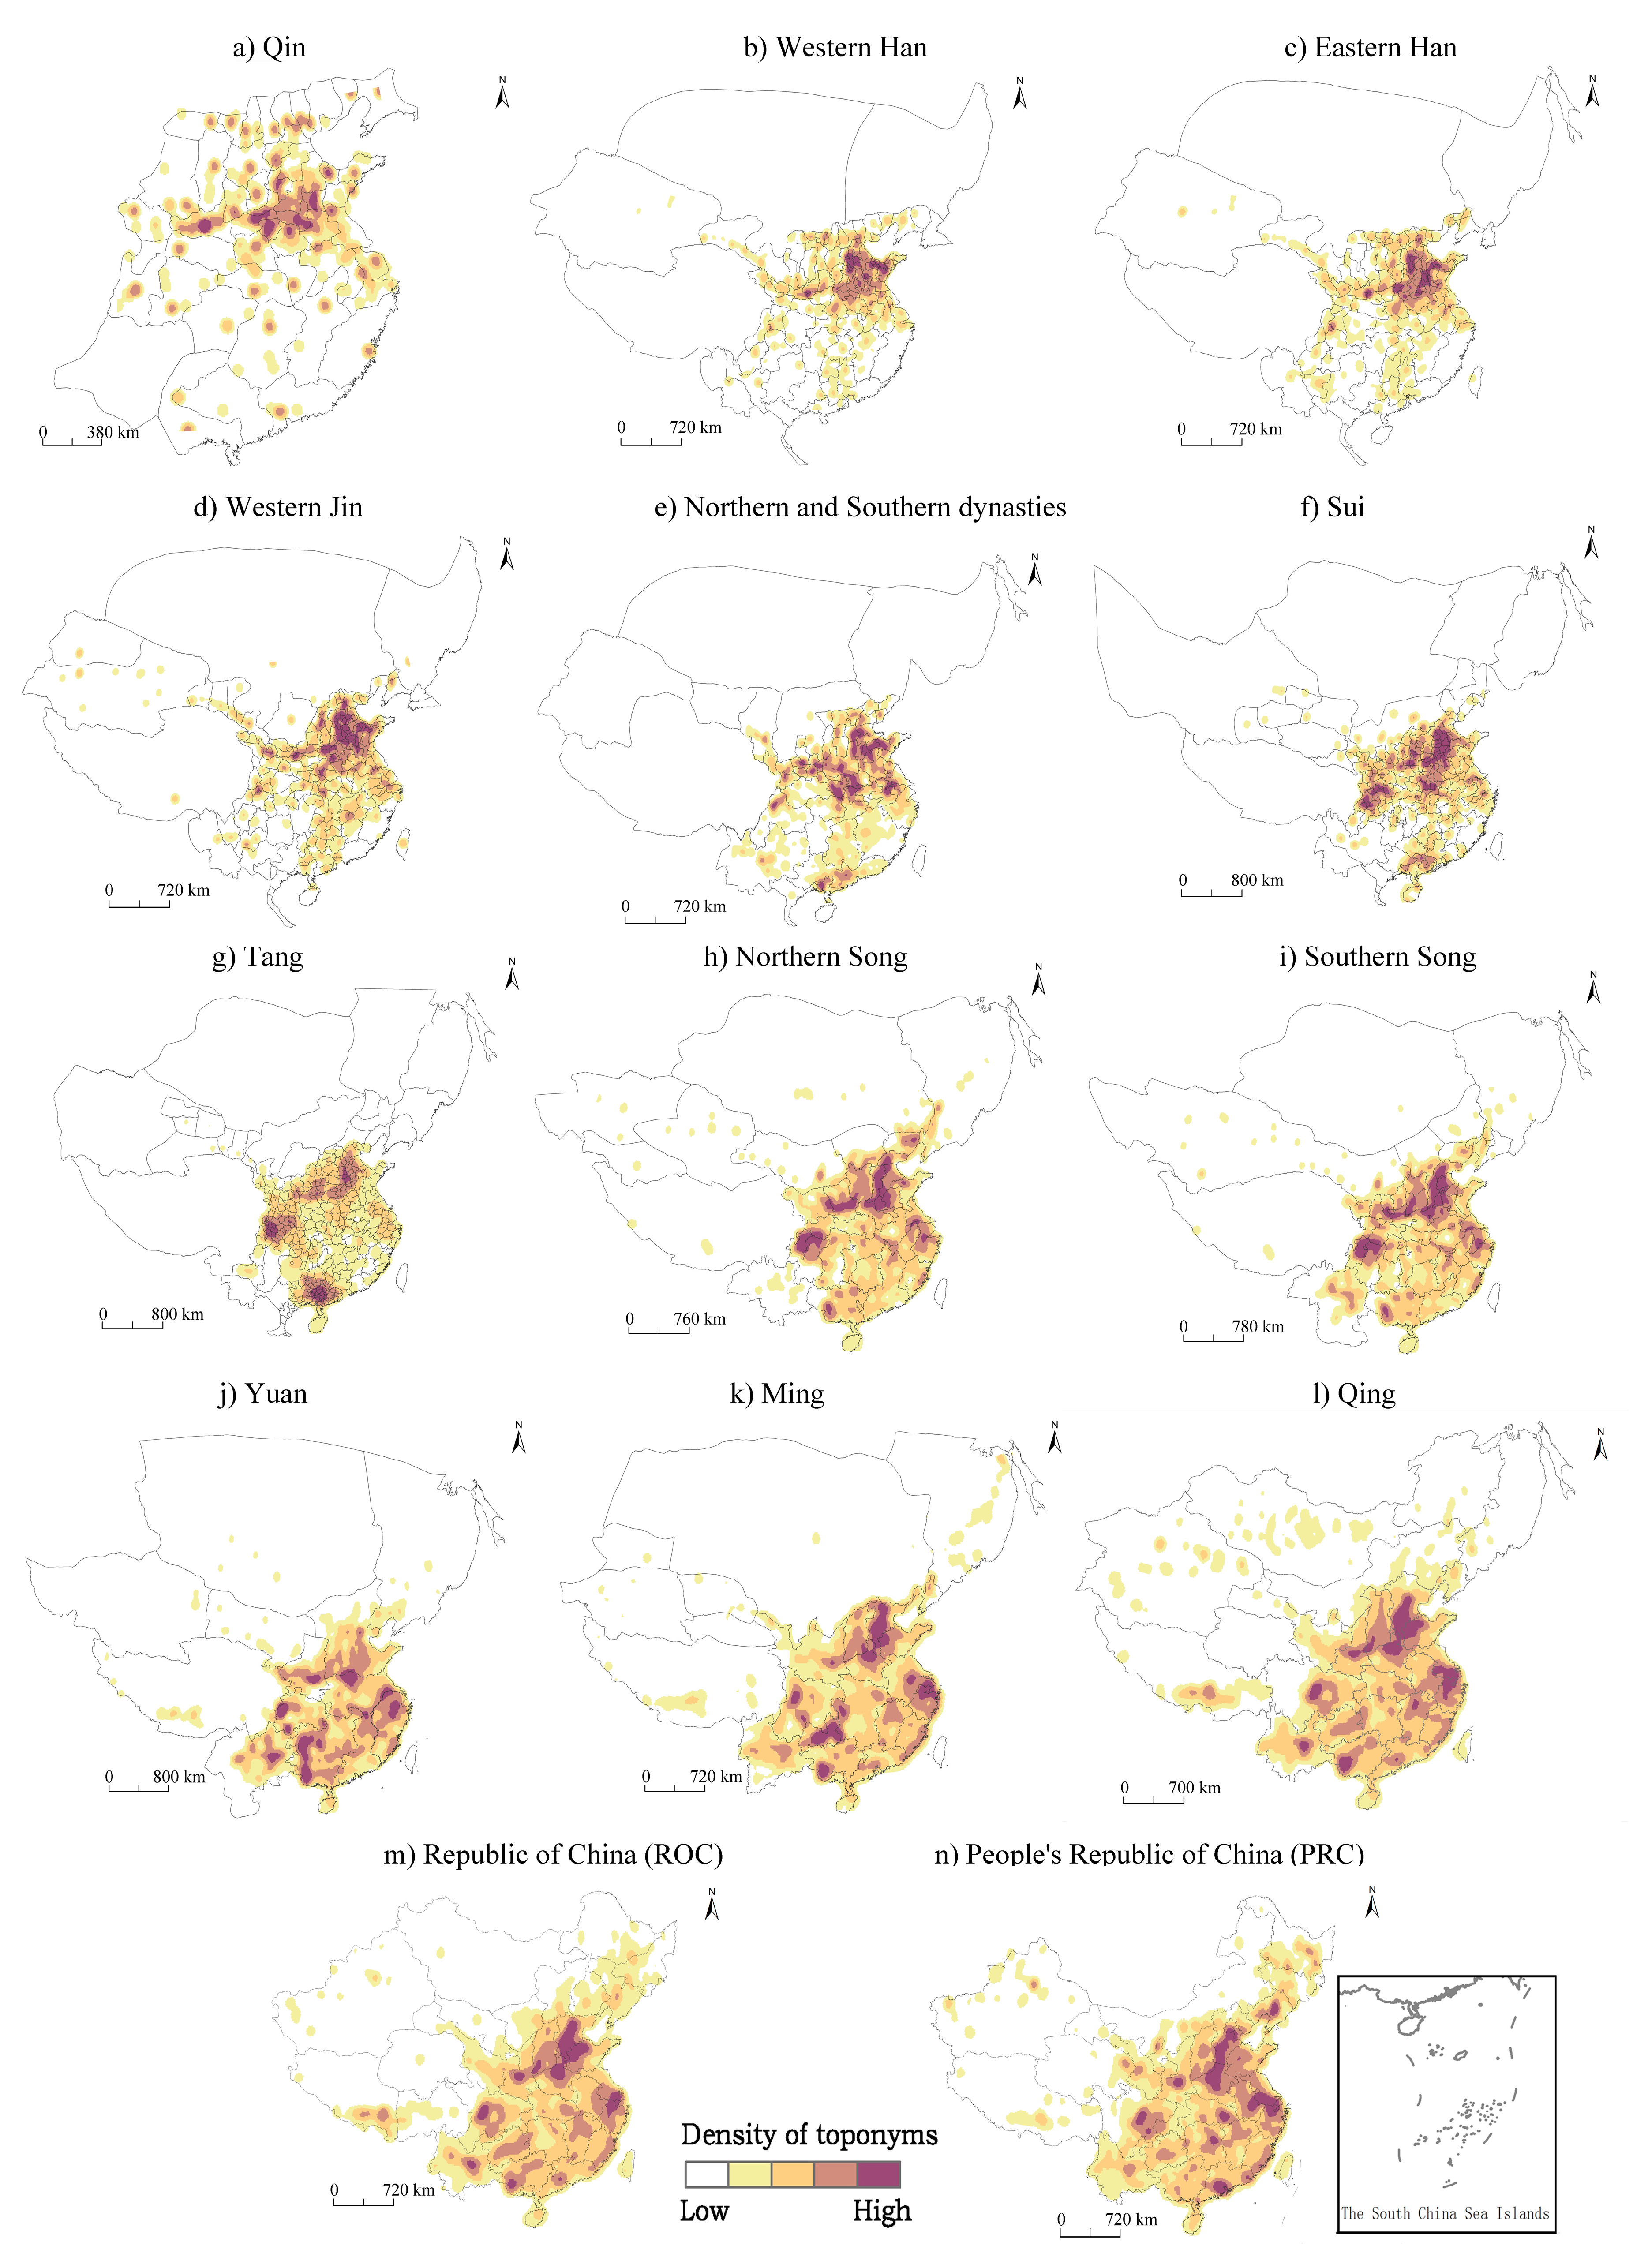
The number of choronyms and spatial distribution of toponym density were all different since the Qin dynasty. The regions with high toponym density were generally located in plain areas. The cores of toponym density gradually spread from the middle–lower reaches of the Yellow River to the Yangtze Plain, the Chengdu Plain, and the Pearl River Delta Plain.
(2)
The spatial distribution of choronyms was agglomerative since the Qin dynasty. The Tang dynasty had the highest unevenness, while the period of the ROC had the lowest unevenness. The spatial distribution especially was uneven at the national scale and provincial scale since the Yuan dynasty. The choronyms were unevenly distributed among province-level administrative regionalizations since the Yuan dynasty. Relatively, the Yuan dynasty was the most concentrated, and the PRC was the least. Moreover, the temporal distribution of choronyms at high, prefecture, and county levels was centralized. The high level was the most concentrated, followed by the prefecture level and county level.
(3)
The spatial agglomeration phenomena of choronyms were positively clustered over the regions in the Qin, Western Jin, Northern and Southern Dynasties, Tang, Northern Song, Southern Song, Yuan, Ming, and Qing. By contrast, the spatial agglomerations of the choronyms were negatively clustered over the regions in the periods of the Western Han, Eastern Han, Sui, ROC, and PRC. Furthermore, the Ming presents the highest degree of spatial aggregation, followed by the Northern Song and Yuan dynasties, while the aggregation extents of the Qin, Sui, Tang, and Qing dynasties were comparatively low.
(4)
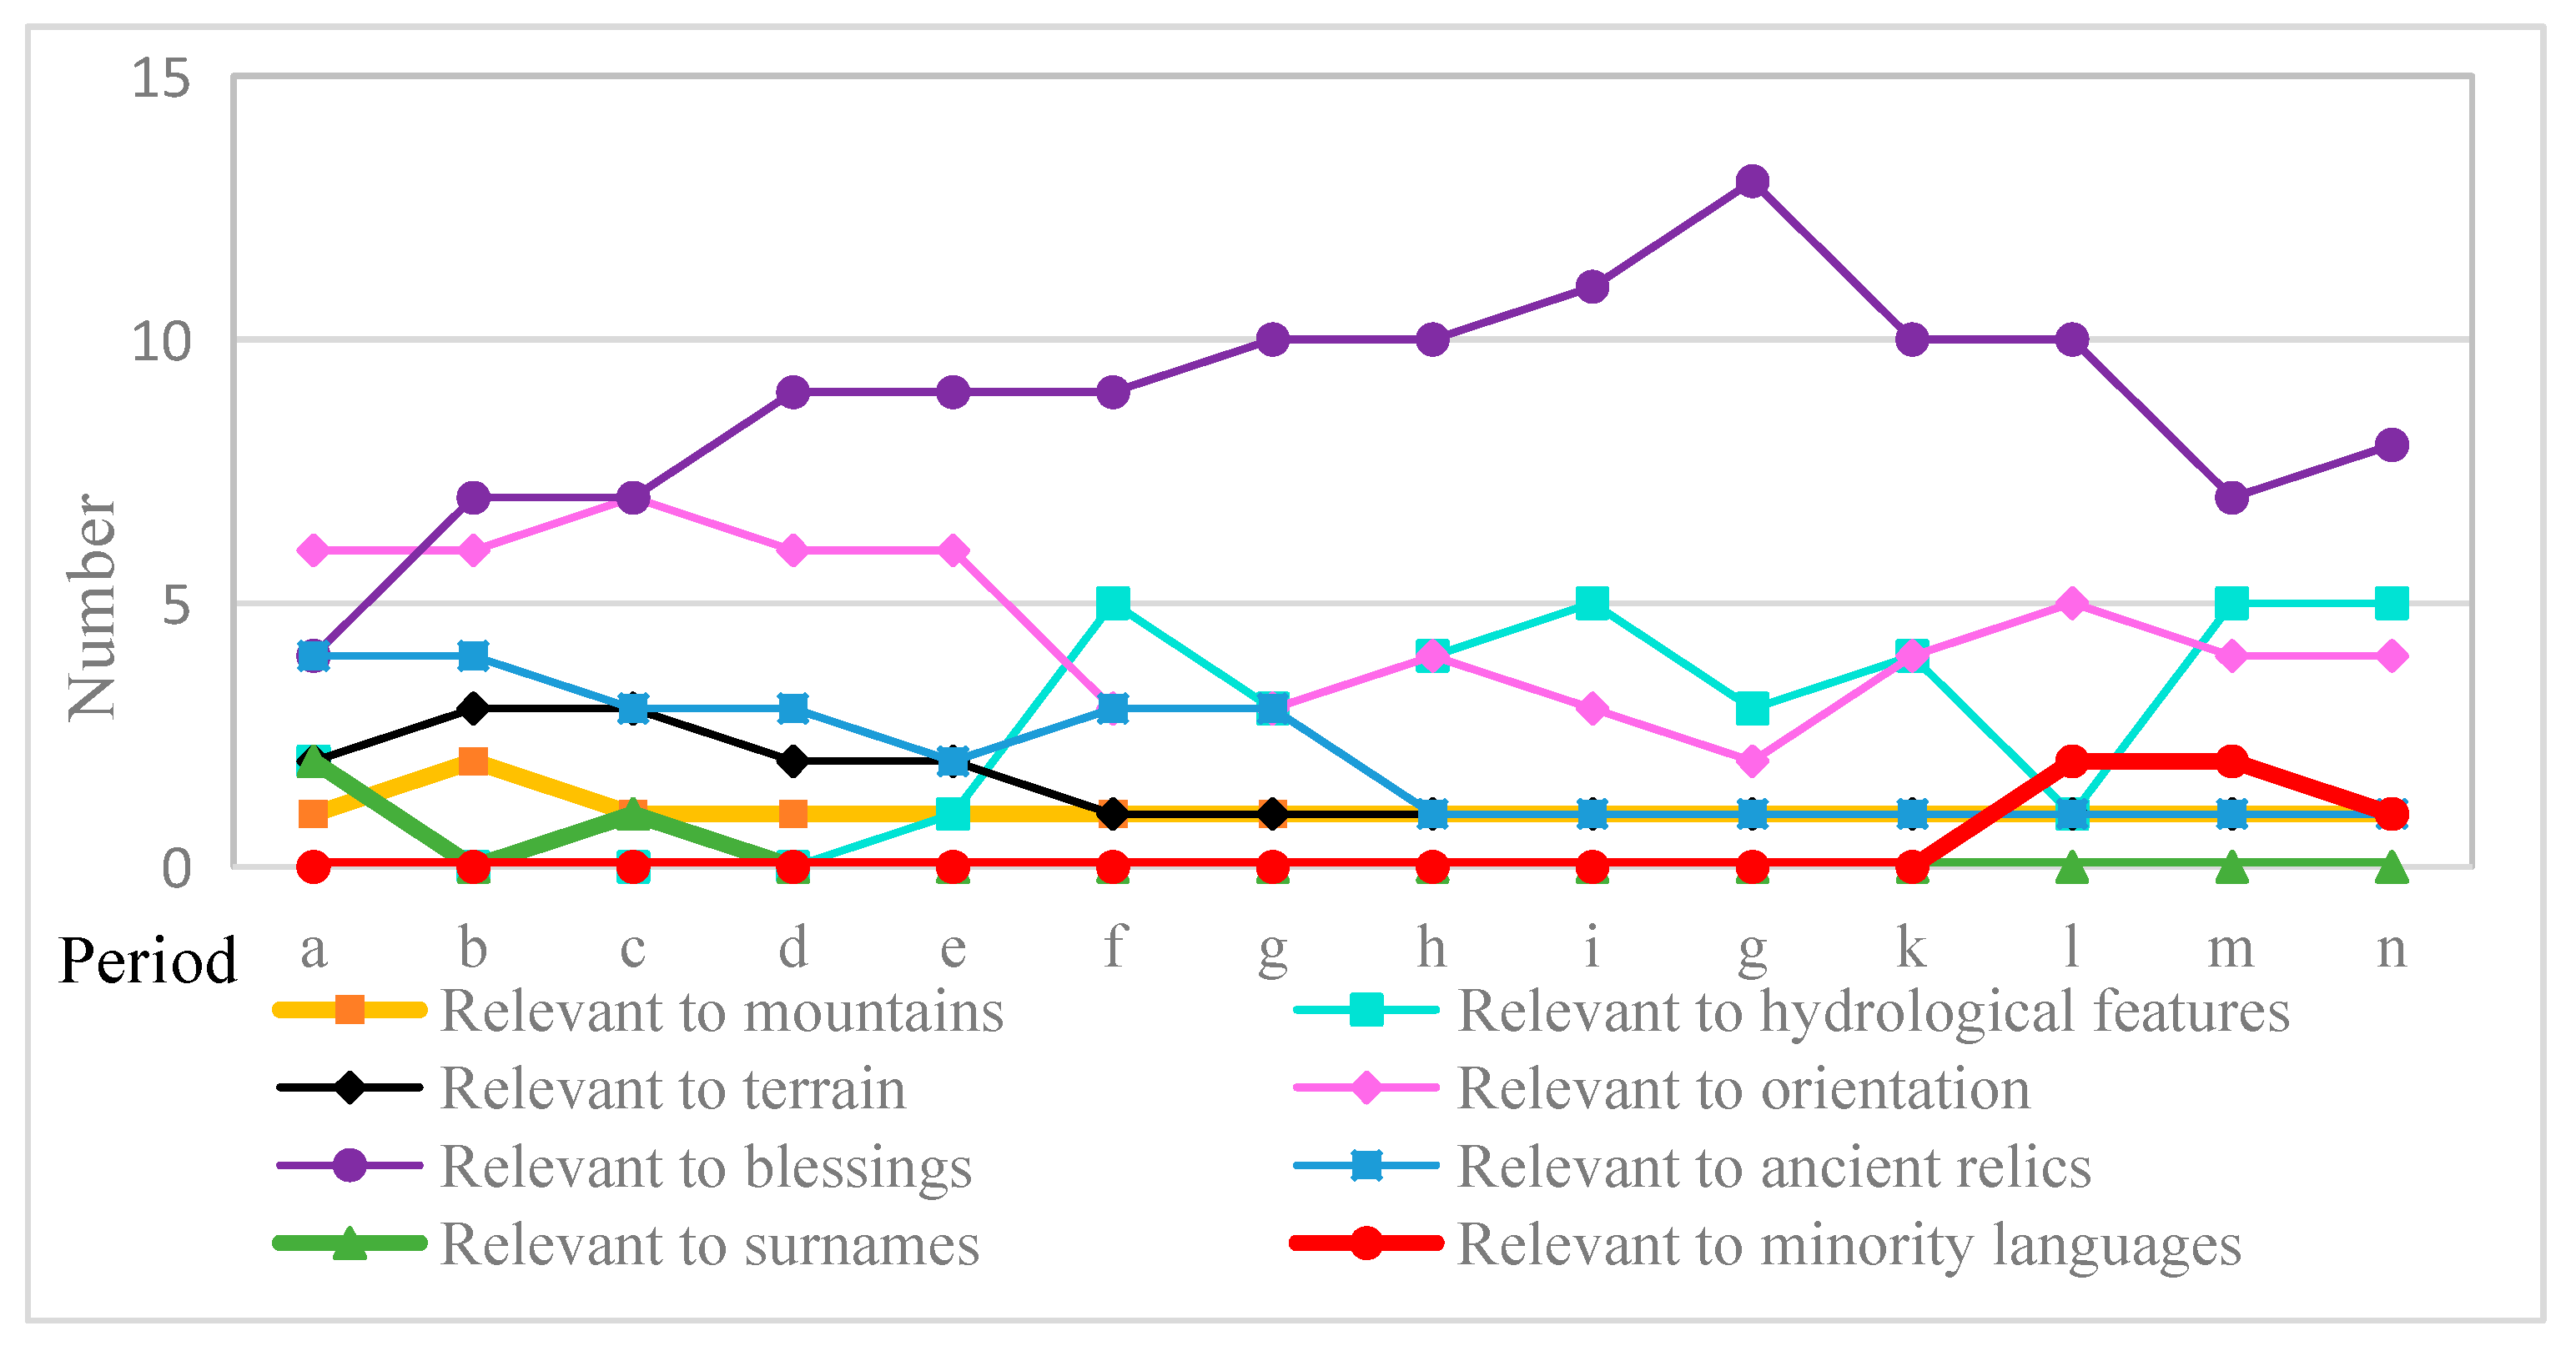
Among the top 20 words of choronyms since the Qin, the “Yang”, “Cheng”, “Shan”, “An”, “Ping”, “Ning”, “Jiang”, and “Nan” had high frequencies, and the words relevant to blessings, orientation and hydrological features had high proportions in the top 20 words.
(5)
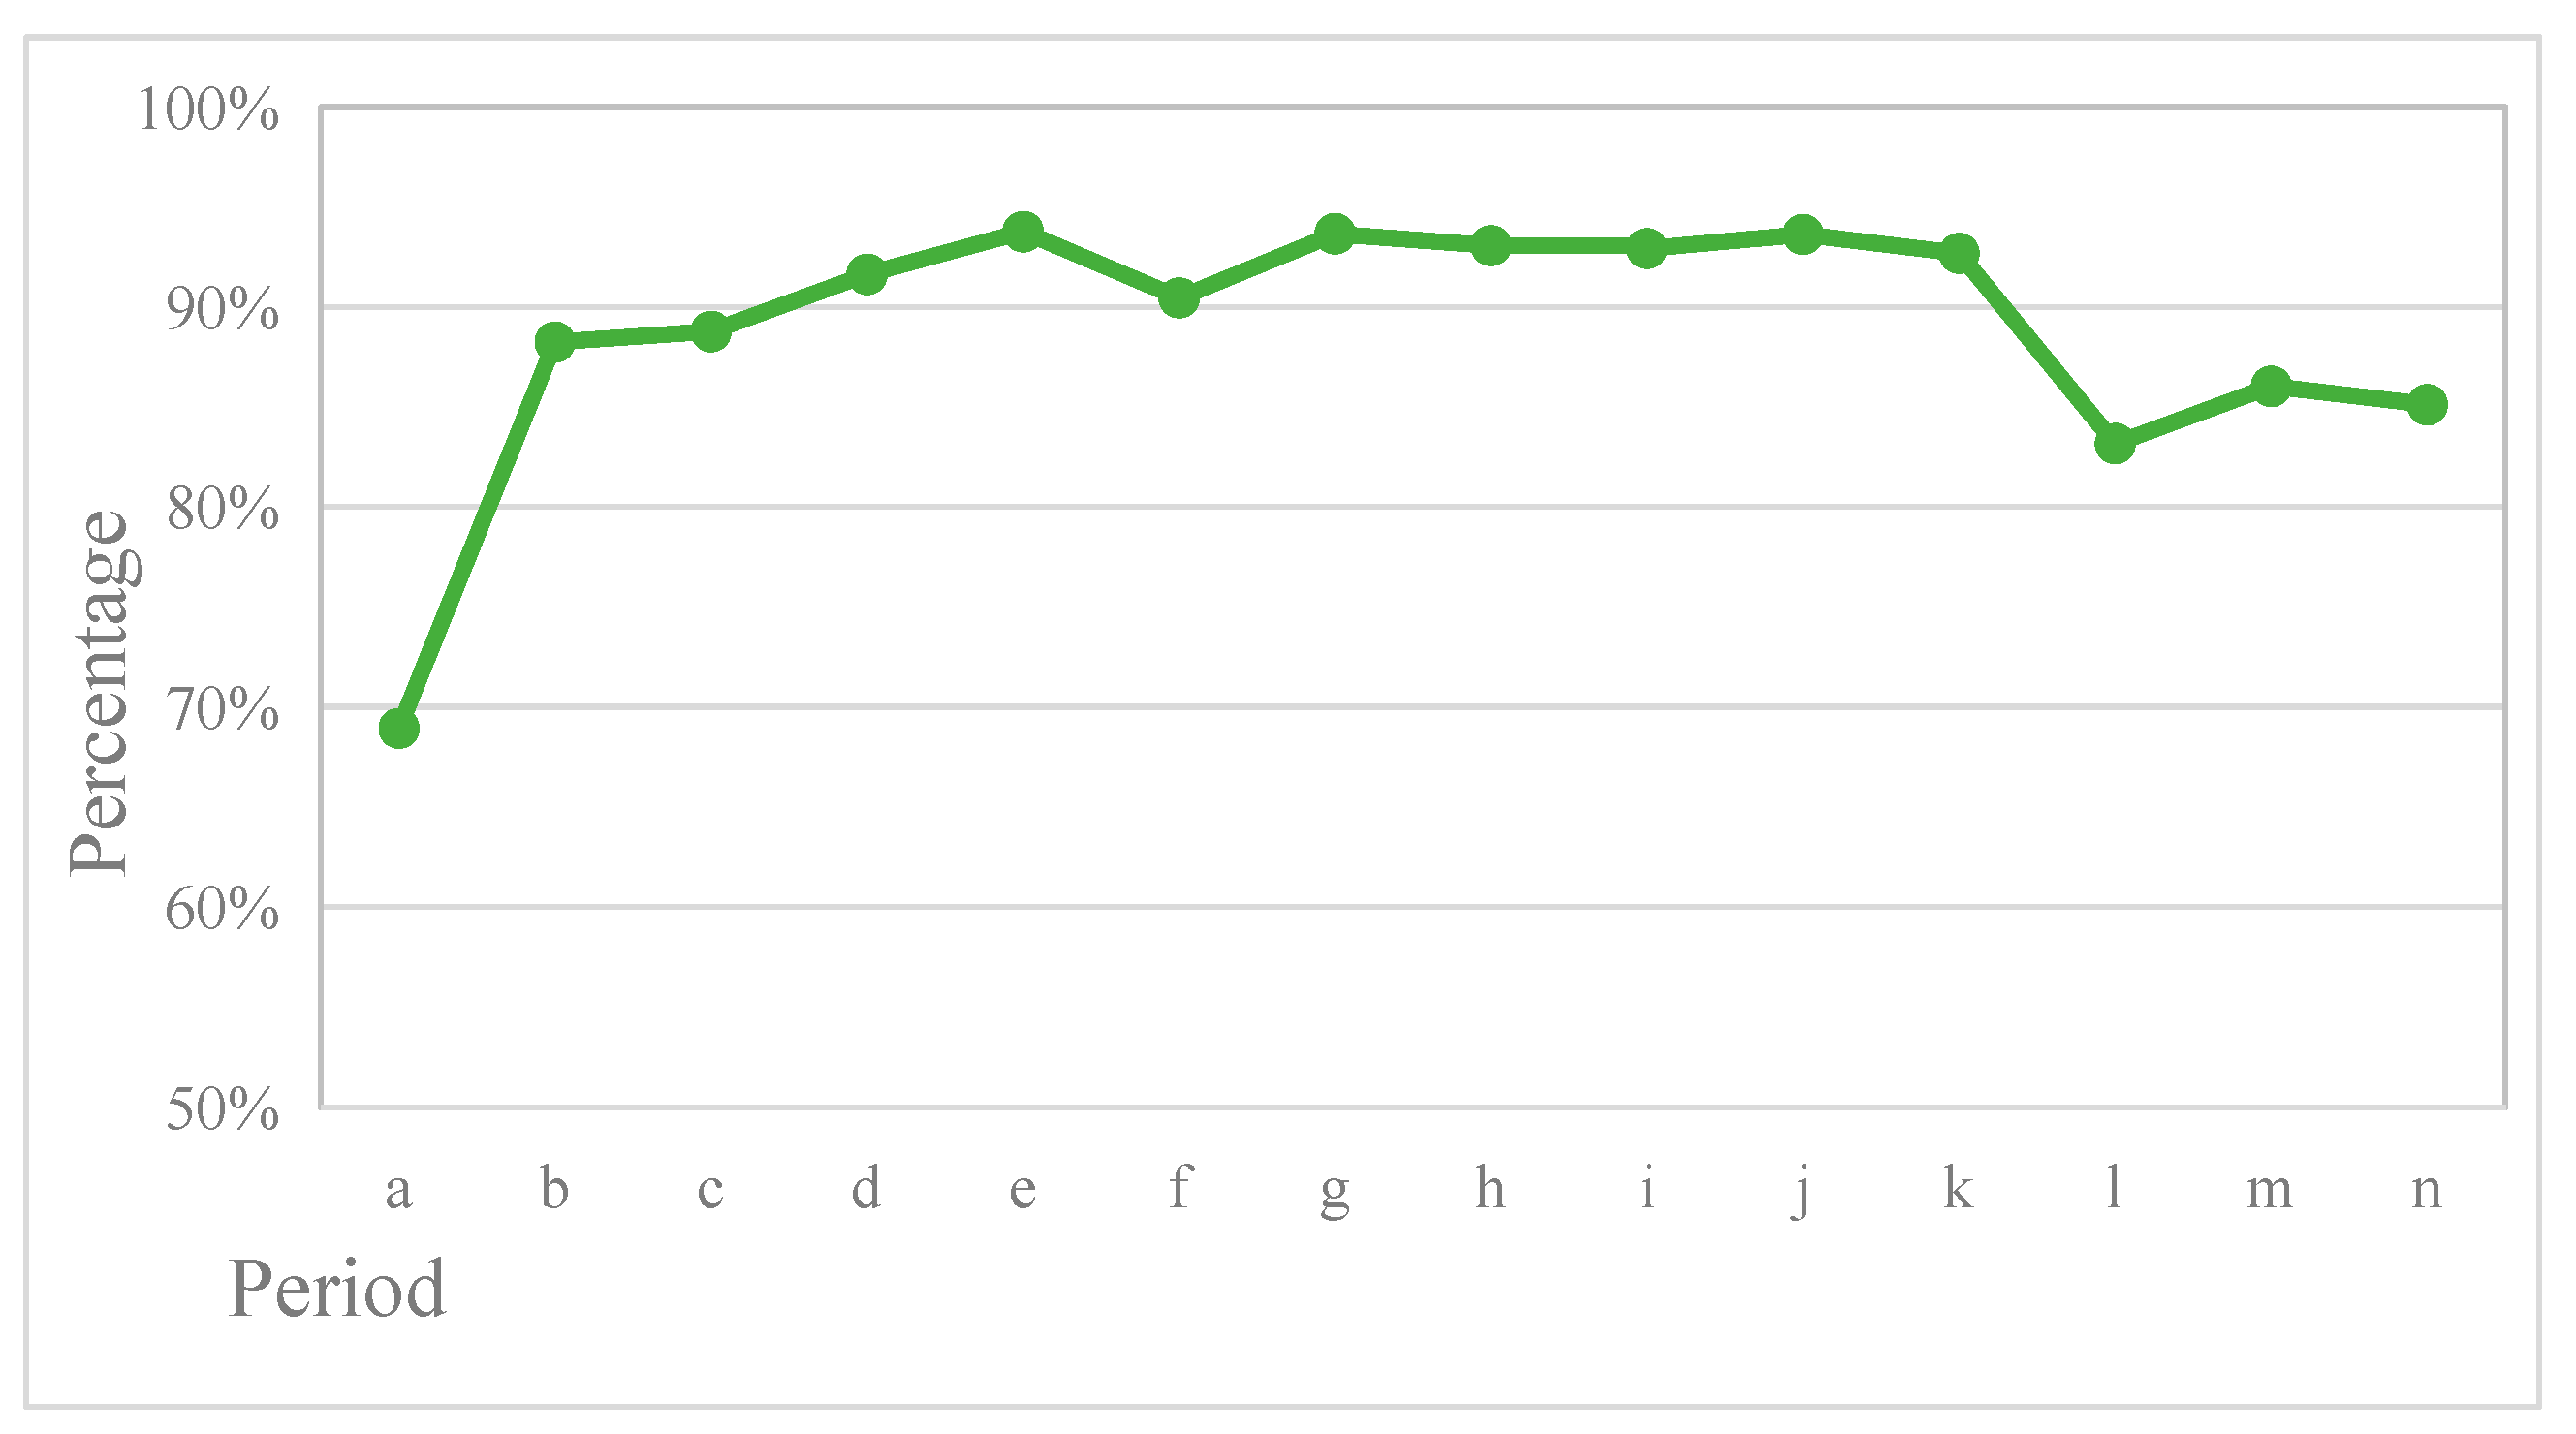
There were 826 county-level choronyms with a naming time from over 1000 years ago in China, and there were approximately 60 counties still using the names of the Qin and Han dynasties until 2002. However, only 81 county-level choronyms were identified as “Millennium Ancient Counties” by the Ministry of Civil Affairs by the end of 2017, and the spatial distribution of the county-level choronyms named over the last 1000 years and “Millennium Ancient Counties” were all unbalanced at the national scale and provincial scale.
This study explored the laws of choronymic cultural landscapes evolution since the Qin dynasty and sorted out the distribution characteristics of the important parts of toponymic cultural heritages (county-level choronyms named over the last 1000 years and the toponyms identified as “Millennium Ancient Counties”), which can not only help protect China’s toponymic cultural heritages but also provide theoretical and practical guidance for rationally optimizing administrative divisions and toponym management. However, this paper only analyzed the influencing factors of the spatio-temporal distribution of choronyms preliminarily due to a limitation of data. Further study is required, for example, analysis can be focused on the relationships between choronyms and natural, human/social factors at a large scale.

Author Contributions

Conceptualization, Y.W. (Yingying Wang), D.G., T.Z. and Y.W. (Yingjie Wang); Methodology, Y.W. (Yingying Wang), D.G., T.Z. and Y.W. (Yingjie Wang); Software, Y.W. (Yingying Wang); Validation, Y.W. (Yingying Wang); Formal Analysis, Y.W. (Yingying Wang); Investigation, Y.W. (Yingying Wang); Resources, Y.W. (Yingying Wang); Data Curation, Y.W. (Yingying Wang); Writing Original Draft Preparation, Y.W. (Yingying Wang); Writing Review & Editing, Y.W. (Yingying Wang); Visualization, Y.W. (Yingying Wang); Supervision, Y.W. (Yingying Wang); Project Administration, Y.W. (Yingying Wang); Funding Acquisition, Y.W. (Yingjie Wang)

Funding

This research was funded by [Ministry of Civil Affairs of the People’s Republic of China] grant number [Y77L0200AJ] and [MOE (Ministry of Education in China) Project of Humanities and Social Sciences] grant number [19YJCZH036].

Acknowledgments

The authors gratefully thank Shengsheng Gong and Tao Zhang from Central China Normal University, who provided partly historical geography data.

Conflicts of Interest

The authors declare no conflict of interest.

References

  1. Sauer, C.O. Recent Development in Cultural Geography. In Recent Development in the Social Science; Hayes, E.C., Ed.; Lippincott: New York, NY, USA, 1927. [Google Scholar]
  2. Cosgrove, D.; Jackson, P. New directions in cultural geography. Area 1987, 19, 95–101. [Google Scholar]
  3. China Encyclopedia Editor Committee “Geography” Editorial Board. The Encyclopedia of China: Geography, Article Name; The Encyclopedia of China Press: Beijing, China, 1992. (In Chinese) [Google Scholar]
  4. Wang, H.B.; Yang, R.R. Spatial distribution characteristics of toponymic landscape in Baoding. J. Arid Land Resour. Environ. 2018, 32, 99–105. (In Chinese) [Google Scholar]
  5. Zhu, P.F. Research on Cultural Sights Named after Geographical Name in Changbai Mountains. Master’s Thesis, Yanbian University, Yanji, China, 2008. (In Chinese). [Google Scholar]
  6. Conedera, M.; Vassere, S.; Neff, C.; Meurer, M.; Krebs, P. Using toponymy to reconstruct past land use: A case study of ‘brüsáda’ (burn) in southern Switzerland. J. Hist. Geogr. 2007, 33, 729–748. [Google Scholar] [CrossRef]
  7. Hu, H.N.; Zhang, L.R. Cultural landscapes of place names of administrative regions in Shaanxi province. Areal Res. Dev. 2013, 32, 170–174. (In Chinese) [Google Scholar]
  8. Liu, B.Q.; Li, B.Y.; Song, J.C.; Zhang, Q.H. An Introduction of Toponymic Cultural Heritages; China Society Press: Beijing, China, 2011. (In Chinese) [Google Scholar]
  9. Moseley, C. (Ed.) Atlas of the World’s Languages in Danger, 3rd ed.; UNESCO Publishing: Paris, France, 2010. [Google Scholar]
  10. Situ, S.J. Historical geography study of toponyms of Guangdong province. Collect. Essays Chin. Hist. Geogr. 1992, 1, 21–55. (In Chinese) [Google Scholar]
  11. Wang, J.T. Introduction of Toponymy; China Social Sciences Publishing: Beijing, China, 1993. (In Chinese) [Google Scholar]
  12. Hua, L.F. Textual Research on the History of Toponymy in China; Social Sciences Literature Press: Beijing, China, 2002. (In Chinese) [Google Scholar]
  13. Chu, Y.P. Essays on Toponymy; Higher Education Press: Beijing, China, 1986. (In Chinese) [Google Scholar]
  14. Ma, Y.L. New Exploration of Toponymy; Nanjing University Press: Nanjing, China, 1993. (In Chinese) [Google Scholar]
  15. Sun, D.H. History of Geographical Names in China; China’s Environment Press: Beijing, China, 1997. (In Chinese) [Google Scholar]
  16. Niu, R.C. Dictionary of the Origin of Chinese Geographical Names; Minzu University of China Press: Beijing, China, 1999. (In Chinese) [Google Scholar]
  17. Song, J.C. Study of Place Names Culture: Concepts, Ethnic Languages, Place Names and Others; Law Press: Beijing, China, 2010. (In Chinese) [Google Scholar]
  18. Tang, G.P. Linguistics in Place Names of Panzhihua; Southwest Jiaotong University Press: Chengdu, China, 2012. (In Chinese) [Google Scholar]
  19. Sweeney, S.; Jurek, M.; Bednar, M. Using place names to interpret former floodplain connectivity in the Morava River, Czech Republic. Landsc. Ecol. 2007, 22, 1007–1018. [Google Scholar] [CrossRef]
  20. Sandu, I.; Poruciuc, A.; Alexianu, M. Salt and human health: Science, archaeology, ancient texts and traditional practices of eastern Romania. Mank. Q. 2010, 50, 225–256. [Google Scholar]
  21. Hu, Y. Spatio–Temporal Relationships among Chinese Ancient and Modern Placenames Oriented to Genealogy GIS. Master’s Thesis, Nanjing Normal University, Nanjing, China, 2008. (In Chinese). [Google Scholar]
  22. Sousa, A.; García-Murillo, P.; Sahin, S.; Morales, J.; García–Barrón, L. Wetland place names as indicators of manifestations of recent climate change in SW Spain (Doñana Natural Park). Clim. Chang. 2010, 100, 525–557. [Google Scholar] [CrossRef]
  23. Wang, C.S.; Ma, Q.L. Temporal-spatial distribution of villages in Beijing based on toponym change. J. Arid Land Resour. Environ. 2015, 29, 18–23. (In Chinese) [Google Scholar]
  24. Luo, W.; Hartmann, J.F.; Wang, F.H. Terrain characteristics and Tai toponyms: A GIS analysis of Muang, Chiang and Viang. GeoJournal 2010, 75, 93–104. [Google Scholar] [CrossRef]
  25. Wang, F.H.; Wang, G.X.; Hartmann, J.; Luo, W. Sinification of Zhuang place names in Guangxi, China: A GIS–based spatial analysis approach. Trans. Inst. Br. Geogr. 2012, 37, 317–333. [Google Scholar] [CrossRef]
  26. Wang, F.H.; Wang, G.X.; Li, X.J. GIS–based spatial analysis of Zhuang place names in Guangxi, China. Geogr. Res. 2013, 32, 487–496. (In Chinese) [Google Scholar]
  27. Wang, B.; Situ, S.J. Analysis of spatial characteristics of place names landscape based on GIS technology in Guangdong Province. Geogr. Res. 2007, 26, 238–248. (In Chinese) [Google Scholar]
  28. Chen, C.; Xiu, C.L.; Chen, W. Spatial distribution characteristics of place–name landscape based on GIS approach in Beijing and its reasons for the formations. Sci. Geogr. Sin. 2014, 34, 420–429. (In Chinese) [Google Scholar]
  29. Sun, B.S.; Guo, C.E.; Yang, Y.T.; Ge, W. Spatial distribution characteristics of rural place–name cultural landscape based on GIS approach in Chengde. Sci. Geogr. Sin. 2017, 37, 244–251. (In Chinese) [Google Scholar]
  30. Tucci, M.; Ronza, R.W.; Giordano, A. Fragments from many pasts: Layering the toponymic tapestry of Milan. J. Hist. Geogr. 2011, 37, 370–384. [Google Scholar] [CrossRef]
  31. Calvo-Iglesias, M.S.; DÍaz-Varela, R.A.; MÉndez-MartÍnez, G.; Fra-Paleo, U. Using place names for mapping the distribution of vanishing historical landscape features: The Agras Field System in Northwest Spain. Landsc. Res. 2012, 37, 501–517. [Google Scholar] [CrossRef]
  32. Fuchs, S. History and heritage of two midwestern towns: A toponymic-material approach. J. Hist. Geogr. 2015, 48, 11–25. [Google Scholar] [CrossRef]
  33. Qian, S.W.; Kang, M.J.; Weng, M. Toponym mapping: A case for distributionof ethnic groups and landscape features in Guangdong, China. J. Maps 2016, 12, 546–550. [Google Scholar] [CrossRef]
  34. Zhu, Z.H.; Zhang, H.Y.; Zhao, J.J.; Guo, X.Y.; Zhang, Z.X.; Ding, Y.L.; Xiong, T. Using Toponyms to Analyze the Endangered Manchu Language in Northeast China. Sustainability 2018, 10, 563. [Google Scholar] [Green Version]
  35. Liu, J.D.; Jin, R.C.; Zhou, K.Y. Political Geography of China; Science Press: Beijing, China, 1999. (In Chinese) [Google Scholar]
  36. Hua, L.F. Research on the History of Chinese Toponyms; Qilu Publishing House: Jinan, China, 2006. (In Chinese) [Google Scholar]
  37. Tan, Q.X. The Historical Atlas of China; China Cartographic Publishing House: Beijing, China, 1982. (In Chinese) [Google Scholar]
  38. Shi, W.L. Dictionary of Chinese Historical Toponyms; China Social Sciences Press: Beijing, China, 2005. (In Chinese) [Google Scholar]
  39. Niu, R.C. The New Century Chinese City View; People’s Daily Publishing Corporation of China: Beijing, China, 2002. (In Chinese) [Google Scholar]
  40. Zhou, Z.H. The Changes of Administrative Divisions in Chinese History; China’s International Broadcasting Publishing House: Beijing, China, 1998. (In Chinese) [Google Scholar]
  41. Dai, J.L. Encyclopedic Dictionary of Ancient and Modern Chinese Geographical Names; Shanghai Lexicographical Publishing House: Shanghai, China, 2005. (In Chinese) [Google Scholar]
  42. Niu, R.C. China’s Toponyms Anecdotes Dictionary; China Social Sciences Press: Beijing, China, 2016. (In Chinese) [Google Scholar]
  43. Wang, Y.J.; Yuan, K.S.; Yu, Z.Y. Multi–Dimensional Dynamic Geoscience Information Visualization; The Science Press: Beijing, China, 2003. (In Chinese) [Google Scholar]
  44. Liu, R.; Hu, W.P.; Wang, H.L.; Wu, C.; He, J. The road network evolution of Guangzhou–Foshan metropolitan area based on Kernel Density Estimation. Sci. Geogr. Sin. 2011, 31, 81–86. (In Chinese) [Google Scholar]
  45. Yu, W.H.; Ai, T.H.; Yang, M.; Liu, J.P. Detecting “Hot Spots” of facility POIs based on kernel density estimation and spatial autocorrelation technique. Geomat. Inf. Sci. Wuhan Univ. 2016, 41, 221–226. (In Chinese) [Google Scholar]
  46. Stephen, L.J. Tourism Analysis: A Handbook; Longman Group: London, UK, 1989. [Google Scholar]
  47. Lovie, P. Coefficient of variation. Encycl. Stat. Behav. Sci. 2005, 1, 317–318. [Google Scholar]
  48. Bao, J.G.; Zheng, H.Y.; Dai, G.Q. The evolvement of spatial structure and the significance of Guilin’s domestic tourist origins. Acta Geogr. Sin. 2002, 57, 96–106. (In Chinese) [Google Scholar]
  49. Wu, B.H.; Tang, Z.Y. A study on spatial structure of national 4A grade tourism attractions in China. Hum. Geogr. 2003, 18, 1–5. (In Chinese) [Google Scholar]
  50. Zhou, Y.X. Urban Geography; The Commercial Press: Beijing, China, 1995; p. 295. (In Chinese) [Google Scholar]
  51. Moran, P.A. The interpretation of statistical maps. J. R. Stat. Soc. Ser. B Methodol. 1948, 10, 243–251. [Google Scholar] [CrossRef]
  52. Chen, S.P.; Yue, T.X.; Li, H.G. Studies on Geo-Informatic Tupu and its application. Geogr. Res. 2000, 19, 337–343. (In Chinese) [Google Scholar]
  53. Liao, K. The discussion and prospect for Geo-Informatic Tupu. Geo-Inf. Sci. 2002, 1, 14–20. (In Chinese) [Google Scholar]
  54. Qi, Q.W. The latest development on Geo-Informatic Tupu. Sci. Surv. Mapp. 2004, 29, 15–23. (In Chinese) [Google Scholar]
  55. Ye, Q.H.; Tian, G.L.; Liu, G.H.; Ye, J.M.; Yao, X.; Liu, Q.S.; Lou, W.G.; Wu, S.G. Tupu methods of spatial—Temporal pattern on land use changes: A case study in the Yellow River Delta. J. Geogr. Sci. 2004, 14, 131–142. (In Chinese) [Google Scholar]
  56. Zhang, R.Q. The research progress of Geo-Informatic Tupu. Sci. Surv. Mapp. 2009, 34, 14–16. (In Chinese) [Google Scholar]
  57. Zheng, H.R.; Luo, H.X.; Zou, Y.Q.; Cheng, Y.S.; Zhang, R. Quantifying vegetation restoration in a karst rocky desertification area in Chongqing based on Geoinformatic Tupu. Acta Ecol. Sin. 2016, 36, 6295–6307. (In Chinese) [Google Scholar]
  58. Liao, K. Modern Cartography; Science Press: Beijing, China, 2003. (In Chinese) [Google Scholar]
  59. Wang, Y.; Wang, Y.; Fang, L.; Zhang, S.; Zhang, T.; Li, D.; Ge, D. Spatial-temporal characteristics and causes of changes to the county-level administrative toponyms cultural landscape in the eastern plains of China. PLoS ONE 2019, 14, e0217381. [Google Scholar] [CrossRef] [PubMed]
  60. Ye, Z.R.; Zheng, H.S. County system: The basis of China’s administrative system. Tian Fu New Idea 2012, 6, 93–99. (In Chinese) [Google Scholar]
  61. Hu, H.Y. Distribution of China’s population: Accompanying charts and density map. Acta Geogr. Sin. 1935, 2, 33–74. (In Chinese) [Google Scholar]
  62. Hu, H.Y. The distribution, regionalization and prospect of China’s population. Acta Geogr. Sin. 1990, 45, 139–145. (In Chinese) [Google Scholar] [PubMed]
  63. Qi, W.; Liu, S.H.; Zhao, M.F.; Liu, Z. China’s different spatial patterns of population growth based on the “Hu Line”. J. Geogr. Sci. 2016, 26, 1611–1625. [Google Scholar] [CrossRef]
  64. Shi, N.H. Study on toponyms and the exploration of relevant laws. Collect. Essays Chin. Hist. Geogr. 1985, 1, 36–41. (In Chinese) [Google Scholar]
  65. Zhuang, H.B.; Wang, B.X. A study on the etymology of “Jiang” in Northeast China. Mod. Chin. Stud. 2011, 13, 148–152. (In Chinese) [Google Scholar]
Figure 1. The flow chart of the methodology employed in this study.
Sustainability 11 04302 g001
Figure 2. Spatio–temporal evolution of choronymic cultural landscape entities density since the Qin dynasty.
Sustainability 11 04302 g002
Figure 3. Spatial statistics of choronyms since the Qin dynasty. Notes: The choronyms in Figure 3 consist of choronyms, the county level, or higher. The small letters of a, b, c, …, n respectively refer to the 14 periods since the Qin dynasty. That is, a: Qin, b: Western Han, c: Eastern Han, d: Western Jin, e: Northern and Southern Dynasties, f: Sui, g: Tang, h: Northern Song, i: Southern Song, j: Yuan, k: Ming, l: Qing, m: ROC, and n: PRC. * indicates the value is significant at the 0.05 level. ** indicates the value is significant at the 0.01 level.
Sustainability 11 04302 g003
Figure 4. The percentage of choronyms in the southeast part of the “Hu Line”. Notes: The small letters of a, b, c, …, n in Figure 4 respectively refer to the 14 periods since the Qin dynasty. That is, a: Qin, b: Western Han, c: Eastern Han, d: Western Jin, e: Northern and Southern Dynasties, f: Sui, g: Tang, h: Northern Song, i: Southern Song, j: Yuan, k: Ming, l: Qing, m: ROC, and n: PRC.
Sustainability 11 04302 g004
Figure 5. Lorentz curves of the numbers of choronyms since the Qin dynasty. (a) High-level choronyms; (b) prefecture-level choronyms; and (c) county-level choronyms. Note: In this paper, the Lorentz curves were adjusted according to the order of the periods. The small letters of a, b, c, …, n in Figure 4 respectively refer to the 14 periods since the Qin dynasty. That is, a: Qin, b: Western Han, c: Eastern Han, d: Western Jin, e: Northern and Southern Dynasties, f: Sui, g: Tang, h: Northern Song, i: Southern Song, j: Yuan, k: Ming, l: Qing, m: ROC, and n: PRC.
Sustainability 11 04302 g005
Figure 6. Naming types of choronyms at the county level or higher since the Qin dynasty (the top 20 words). Note: The small letters of a, b, c, …, n in Figure 6 respectively refer to the 14 periods since the Qin dynasty.
Sustainability 11 04302 g006
Figure 7. Spatial distribution of words of choronyms at the county level or higher in 2010 (“Shan”, “Cheng”, “Yang”, “Jiang”, “An”, and “Nan” toponyms).
Sustainability 11 04302 g007
Figure 8. Distribution map of the county-level choronyms named over the last 1000 years. Note: The statistics of the naming time were calculated by the end of 2018.
Sustainability 11 04302 g008
Figure 9. The percentage of the county-level choronyms named over the last 1000 years.
Sustainability 11 04302 g009
Table 1. The time frames and map scales since the Qin dynasty.
PeriodYearScale
QinThe late Qin dynasty1:21,000,000
Western Han7 BC1:21,000,000
Eastern Han140 AD1:21,000,000
Western Jin281 AD1:21,000,000
Northern and Southern Dynasties497 AD1:21,000,000
Sui612 AD1:21,000,000
Tang741 AD1:21,000,000
Northern Song1111 AD1:21,000,000
Southern Song1208 AD1:21,000,000
Yuan1330 AD1:21,000,000
Ming1582 AD1:21,000,000
Qing1820 AD1:21,000,000
ROC1925 AD1:21,000,000
PRC2010 AD1:1,000,000
Table 2. Evolution types of choronyms.
Type ID1234567
Type NameNameRenameCancelPosition migrationBoundary changeGradec hangeMembership change
Table 3. Statistics of choronyms number since the Qin dynasty.
PeriodHigh-Level ChoronymsPrefecture-Level ChoronymsCounty-Level ChoronymsTotal
Qin 4810001048
Western Han 10315871690
Eastern Han1310211801295
Western Jin2117612321429
Northern and Southern Dynasties25340315622218
Sui 19412711465
Tang1532315751913
Northern Song3435312881675
Southern Song4940213861837
Yuan1328711311431
Ming1839814271843
Qing2330215491874
ROC318220442157
PRC3433428513219
Note: High-level, prefecture-level, and county-level choronyms are historical geography terms. Since the Qin, Western Han, and Sui dynasties were a “Prefecture” and “County” two-tier system, there were no high-level choronyms.
Table 4. Spatial statistics of choronyms in the province-level administrative regionalizations since the Yuan dynasty.
PeriodGGiniS
Yuan 35.500.980.39
Ming 25.260.97 0.31
Qing 21.750.96 0.25
ROC 20.690.94 0.21
PRC20.420.92 0.20
Table 5. ANNs of choronyms in provincial administrative regionalizations in 2010.
NameANNZNameANNZ
Anhui0.82−3.76Jiangxi1.010.16
Beijing1.362.99Jilin0.86−2.21
Chongqing1.070.83Liaoning0.80−4.11
Fujian0.93−1.25Ningxia0.77−2.28
Gansu0.69−5.88Qinghai0.84−2.25
Guangdong0.76−5.63Shandong0.91−2.15
Guangxi0.85−3.16Shanghai1.282.42
Guizhou1.122.23Shanxi1.040.92
Hainan1.655.86Shaanxi0.88−2.36
Hebei0.86−3.60Sichuan0.88−3.35
Heilongjiang0.75−5.59Tianjin1.151.24
Henan0.88−3.16Tibet0.98−0.26
Hubei0.90−2.05Xinjiang0.66−6.94
Hunan0.97−0.70Yunnan0.89−2.42
Inner Mongolia0.80−4.03Zhejiang0.91−1.85
Jiangsu0.89−2.35
Note: NAA is the nearest neighbor analysis index. The choronyms in Table 5 consist of choronyms, the county level, or higher, and the data of Hong Kong, Macao, and Taiwan are temporarily unavailable.
Table 6. Temporal statistics of choronyms since the Qin dynasty.
IndexHigh-Level ChoronymsPrefecture-Level ChoronymsCounty-Level Choronyms
G41.1629.8427.89
Gini0.980.950.81
S0.570.300.16
Table 7. Word statistics of choronyms at county level or higher since the Qin dynasty (the top 20 words).
Rankabcdefghigklmn
1YangYangYangYangYangYangChengYangYangAnAnAnYangShan
2LingPingPingPingChengChengYangChengChengNingNingNingAnCheng
3DongLingLingAnAnAnAnAnAnYangYangYangChengYang
4ChengAnChengChengPingPingShanShanShanPingPingYiShanJiang
5PingChengAnLingNanShanPingPingPingNanShanChengJiangAn
6YiWuWuNanXinChuanShuiNingNingChengChengPingNingNan
7WuChengNanChangNingShuiNanJiangJiangShanNanShanPingDong
8LinNanLinXinLingNanChuanNanShuiJiangJiangJiangNanPing
9YinDongDongWuChangLingChangHuaWuDeHaiZuoErNing
10AnGaoYinLinDongWuWuYongXingChangHeYouHeHe
11ZhongLinGuangXiWuChangJiangWuChuanXingXinErYiXi
12ShiDuDuDongXingJiangLeShuiChangXiDaZhongDongXin
13NanYinChengGuangGuangLinLingHeHuaYongYongNanXiHai
14JiangChangGaoDuBeiNingDuLinYongLongXiYongChuanLong
15HeGuangQiuYinLinQingLinXiLinXinChangXinXinChuan
16XinQiuShiGaoLeHeLongChangQingHuaDingChangWuXing
17XiangXiangXiXingXiXiangXinChuanNanDingWuDingYongEr
18ShanXinChangNingGaoLeNingXingXinWuZhongHuaShuiShui
19ChenShanZhongLeShanChangYiDeChangQingDongWuChangDa
20DuZhongXinShanShuiYongYongChangXiShuiXingXingHaiWu
Note: The small letters of a, b, c, …, n in Table 7 respectively refer to the 14 periods since the Qin dynasty. That is, a: Qin, b: Western Han, c: Eastern Han, d: Western Jin, e: Northern and Southern Dynasties, f: Sui, g: Tang, h: Northern Song, i: Southern Song, j: Yuan, k: Ming, l: Qing, m: ROC, and n: PRC. “Cheng” is related to the ancient cities and other historical sites, “Cheng” is related to the success, “Yi” is related to the ancient cities, “Yi” refers to the wing, “Yi” is related to the justice, “Xiang” is related to the assistance or high altitude, “Xiang” refers to the ancestral home, “Xi” refers to the west, and “Xi” refers to a creek in the mountains.

