1. Introduction
The manufacturing sector consumed 36% of global resources to be the most resource-consuming sector in the world which, fortunately, has been falling thanks to technological advances. The Organisation for Economic Co-operation and Development [
1,
2] argues that the manufacturing system requires significant restructuring in order to achieve better environmental performance so that resource consumption by the sector can be reduced further to 18–26% by 2020 [
2]. Consequently, cleaner production technologies will be required to reduce the resource consumption intensity of manufacturing.
While there is general agreement on the definition of sustainable development, there is little consensus on the manufacturing practices that can be classified as sustainable [
3]. A review of literature on sustainable manufacturing reveals three major streams of sustainable manufacturing. The first stream attributes sustainable manufacturing to strategic focus of organizations [
4]. The second stream focuses on the effectiveness of technologies in strengthening sustainability [
5]. The third stream emphasizes environmental intelligence [
6].
It is the growing recognition that manufacturing has been the biggest polluter as economies undergo rapid growth and structural change that led to increasing focus on cleaning up the sector. In this regard, researchers have paid constant attention. For example, Raja [
7] investigated the link between work practices and manufacturing performance. Similarly, Shah and Ward [
8] examined lean manufacturing practices, such as Just-in-time (JIT) and total quality management (TQM), and linked these work practices to manufacturing performance. Soliman et al. [
9] investigated how lean manufacturing practices can influence the complex socio-technical systems. However, these works possess some pitfalls. Firstly, while existing work practices have focused on lean manufacturing based on the socio-technical systems principles of work design, the links between them and sustainable manufacturing are not clear. Secondly, most of these studies used work practices mainly as technical and social subsystems either neglecting wholly or emphasizing little environmental subsystems in the work design process [
9]. Greening has not been the central pillar in such studies. Thus, existing studies on work practices have not captured sustainable manufacturing adequately. Also, as Geels [
10] had argued, recent transitions in the socio-technical systems to bring sustainability into manufacturing processes are beyond conventional organizational boundaries. Consequently, there is a need to examine recent developments on greening manufacturing processes, which will go a long way to check pollution from the world’s most resource-consumption-intensive sector.
Hence, the aim of this paper is to examine the impact of management support on social subsystems, environmental subsystems, and technical subsystems, on sustainable manufacturing performance. The rest of the paper is organized as follows.
Section 2 reviews the extant literature from where the hypotheses are developed for testing.
Section 3 presents the methodology and data.
Section 4 discusses results and analysis.
Section 5 finishes with the conclusions.
2. Literature Review and Hypotheses Formulation
Sustainable manufacturing approach is multilevel manufacturing approach. These levels are product, process, and system [
11]. Manufacturing processes are outcomes of human interactions with technology. Organizational systems that arise from human and technology integrations are usually referred to as Socio-Technical Systems (STS) [
12]. Under manufacturing processes, employees have full information about their organizational, technical, social, and environmental characteristics and objectives, which act as a motivation to confidently learn various skills so that they become experts in doing multiple tasks [
13]. The manufacturing systems are usually divided into three subsystems to design best work practices to support efficient production [
12].
The first subsystem arises from workers’ social interactions and is called the social subsystem. The first subsystem consists of the way workers interact with other workers, and deals with employee empowerment and participation in the manufacturing process within and between groups [
14]. Employee empowerment and participation refer to the degree to which workers are involved in decision making [
15].The second subsystem involves the interactions of workers with their technical elements and is called the technical subsystem. The second subsystem consists of workers’ interaction with technology (e.g., machinery, equipment, and manuals). This is the technical subsystem that focuses on the effective use of tools, techniques, procedures, and other forms of technology to acquire inputs and transform them into outputs [
16]. Technical work practices in such systems are geared towards effective utilization of technology to produce desired quality of output with zero defects and minimal waste. The third subsystem deals with interactions of workers with environmental elements and is called the environmental subsystem [
17]. The third layer consists of workers’ interactions in manufacturing processes that embody greening practices so that work practices are not only environmentally safe and accident-free, but the output is also environmentally safe to be consumed by buyers. Some aspects of this is covered by ISO 14000 practices, which has resulted in the evolution of environment-friendly work practices to achieve efficient manufacturing processes that emphasize the reduction of environmentally damaging inputs and practices and provide eco-efficient products [
18]. Shahbazi et al. [
19] provided a comparison of the effectiveness of the different environmental management practices used in the manufacturing industry. Their findings indicated the choice of the right tool for effective usage of resources is largely dependent on the situation in which the tool is being used. De Giovanni [
20] called for a broader scope of environmental management practices that can be categorized into internal environmental management practices and external environmental management practices. The smooth integration of the three subsystems provides the basis for the development of work design practices that are both efficient and sustainable, which is reflected in recent advancements in sustainable manufacturing practices [
14,
21].
The work design in manufacturing identified a broader range of work practices under social, technical, and environmental subsystems [
16]. However, the effectiveness of these work practices is dependent on management support at all levels of the manufacturing process [
22], which is the essential part of the theoretical model of this study. There is already some evidence of the positive impact of management support on social interventions among the employees [
23]. Management can play an important role by empowering employees to enhance belief and confidence among employees in pursuing sustainable manufacturing practices [
24]. Raja [
7] and Maynard et al. [
25] confirmed that management support is vital for pursuing the social element in manufacturing processes effectively. The relationship between management support and financial performance has already been established, but it is still unexplored whether there is any relationship between the top management support and the social and environmental aspect of the manufacturing performance. Thus, little is known about whether management support has any influence on the social, environmental, and economic performance. The relationship between management support and sustainable manufacturing performance remains unexplored. Following the above problematization, we develop the following hypothesis for testing:
Hypothesis 1: Management support has a positive relationship with sustainable manufacturing performance.
Social subsystems comprise employee empowerment and participation. Seibert et al. [
26] examined individual team-level psychological empowerment by using meta-analysis of 22 team-based studies to test the antecedents and precedents of social work practices. Their results indicated that social work practices supported by management are more effective than those not supported by management. In addition, Maynard et al. [
25] found a mediating effect of social subsystems on the relationship between management support and sustainable manufacturing performance using 79 independent samples from 75 studies. Separate analyses were also carried out on the moderating relationships between employee participation and empowerment as key mediators. However, as argued by Qureshi et al. [
27], there is still little empirical work on the mediation effects of social work practices on the relationship between management support and sustainable manufacturing performance. Hence, we formulate the following hypothesis:
Hypothesis 2: Social subsystems mediate the relationship between management support and sustainable manufacturing performance.
Earlier studies have often depicted a positive association between organizational factors and environmental performance pointing to the positive impact of organizational factors, such as management support, employee participation, and employee empowerment linkages [
28]. Rasli et al. [
29] went further to show that the mediation takes place between environment management processes and environmental performance. Their findings show that each of the organizational factors result in positive process conditions, such as supporting change initiatives and friendly environment culture and ensuring that staff are committed to meeting environmental objectives.
Daily et al. [
30] went further to argue that top management support is critical in the introduction of cutting-edge environmental processes particularly in adequate resource provision and communication of authority in these initiatives, which was supported by the researchers [
3,
31,
32]. These enhancements may be mirrored in explicit activities, such as environmental strategy formulation and implementation, environmental risk management, and/or specific management initiatives required by implementation (e.g., recycling activities). Additionally, top management may lobby for resource allocation from shareholders to make improvements to the processes of environmental management to raise staff alertness over environmental matters, encourage a friendly environment culture, and inspire improved performance. Enhancements in environmental management processes can enable improvements in environmental performance [
15]. Also, it is claimed that the impact of management support to initiate sustainable organization on sustainable performance is mediated by the efficiency of environmental management processes.
Thus, it can be argued that environmental practices imposed by top management are more effective than those imposed by lower levels of management. Employees through the line of command usually take interest in developing sustainable organizational culture if top management is strongly committed to environment-friendly and eco-social efficiency strategies [
33]. These firm-level internal environmental management practices are attributed to committed management. In contrast, environmental management initiatives imposed by governmental policies, which are externally driven, are generally successful only with internal commitment by management [
20]. However, firm-level surveys generally do not distinguish top management participation from overall management practices as questionnaires are typically answered by lower management staff. On the other hand, it is still under discussion whether the internal or external environmental practices are effective to enhance sustainable manufacturing performance through management support. Hence, we test the following hypothesis:
Hypothesis 3: Environmental subsystems mediate the relationship between management support and sustainable manufacturing performance.
Technical work practices in the socio-technical systems approach consist of five work practices:
viz., TQM, Total Preventive Maintenance (TPM), JIT, Materials Resource Planning (MRP), and Kaizen (continuous improvement) practices [
34]. Technical work practices in JIT manufacturing refer to workers’ interactions with technology to produce efficiently products through processes, eliminating defects and surplus inventories to meet specified targets. [
35] had argued that the top management commitment and support is indispensable for the successful execution of TQM in organizations. Reducing variability in processes is key to successful TQM that ultimately enhances firm profitability [
36]. It is in this context that [
37] reported the mediating role of technical work practices, such as TQM. However, existing works have hardly broached the mediating role of technical work practices in the relationship between management support and sustainable manufacturing performance. Thus, we hypothesize that:
Hypothesis 4: Technical subsystems mediate the relationship between management support and sustainable manufacturing performance.
Over the years, manufacturing processes have been improved to be more supportive of society and promote optimization of resources to produce socially acceptable products that also reduce environmental degradation [
38]. For example, Kaku [
39] studied how satellite remote sensing can support disaster management that leads to sustainable development goals. Sustainable industrial strategies and cross-functional factory demonstration of important work practices are key to the development of sustainable manufacturing systems. Different approaches have been established to accompany design with a decrease in resource use, eco-efficiency, environmental damage control, and simulation tools motivated by gradually restricting energy laws and volunteer green rating systems. These studies were focused on economic performance in the manufacturing process. The environmental factor remained neglected in these studies. Other researchers placed an emphasis on green practices with a focus on environmental sustainability [
40]. The concept is also considered as an extension of the lean manufacturing. Recent shifts in the manufacturing processes somehow have rejected the concept of focusing only on the environment and defined the three pillars model of sustainability (i.e., Economy, Society, and Environment) [
20]. The role of top management support is obvious in implementing strategies effectively at all levels of the organization. In order to achieve the goal of sustainable manufacturing, it is important to understand the interaction of workers with technology to redesign work practices.
Figure 1 presents the conceptual framework of an integrated sustainable manufacturing performance with work design practices. This framework helps unfold the relationship between management support and work practices, and sustainable manufacturing performance. Moreover, management support is the essential pillar for the successful implementation of any strategic plans.
4. Results and Analysis
Out of 384 questionnaires distributed, 310 were returned with the relevant questions answered at a response rate of 80.7%, which met the response rate of 60–80% of response rate validity so that it would not lead to incorrect generalizations of the population (Fincham, 2008). Since the response rate exceeded 80%, it met the generalizability criterion. During the initial screening of the data, 11 questionnaires were removed from the data collected due to outliers as their response might have biased the results [
50]. The remaining 299 were a sufficient sampling size for data analysis using SEM as noted by Hair et al. [
50].
Table 2 indicates that the maximum respondents of 66 (22.1%) were from plant sizes of 200–249 employees. The second highest was 57 (19.1%) from plant sizes of 150–199 employees, followed by 49 (16.4%) and 37 (12.4%) respondents from plant sizes of 300–349 and 350–399, respectively. Most plants (160) were in the age group of 8–15 (53.6%). Also, most plants (107) were engaged in assembly line (35.8%) and batch process (35.8%) type of manufacturing, followed by continuous process plants (76; 25.4%). The lack of a sharp skew in both the size distribution of plants and the type of manufacturing involved complements further the generalizability of the results.
Exploratory Factor Analysis (EFA) was carried out to validate the dimensions of the social, technical, and environmental subsystems and sustainable manufacturing performance. The Kaiser–Meyer–Olkin (KMO) and Bartlett’s tests were used to verify if the data was adequate for factor analysis.
Table 2 shows the results of principal component analysis and KMO that indicates the suitability of data for dimension reduction analysis. KMO measures sampling adequacy, which indicates the proportion of variance in latent constructs that might be caused by underlying factors. The KMO value for work practices in the social subsystem was 0.92, environmental subsystem was 0.94, technical work practice was 0.87, and sustainable manufacturing performance was 0.83. These results indicate that the data was suitable for factor analysis.
Table 3 presents the results of principal component analysis (PCA). The latent construct of work practices in the social subsystems were factorized into two components. The first and second components of social subsystems indicated 36.4% and 32.2% of common variance, respectively, with a cumulative variance of 68.6%. The first and second components of work practices in the environmental subsystems showed a common variation of 43.7% and 31.3%, respectively, so that its cumulative common variation came to 75.0%. The third section consisted of technical subsystems with three components: the common variations of TQM, TPM, and JIT were 38.6%, 18.1%, and 10.1%, respectively, with a cumulative common variation of 67.6%. The three components of sustainable manufacturing performance had common variations of 21.6%, 16.6%, and 16.0%, respectively, with a cumulative common variation of 54.2%.
Table 4 shows the rotated component matrix. Rotated component matrix refers to the matrix of factors that are loaded for each variable into each other. The rotation of varimax was done using the Kaiser normalization index and the extraction was done by principal component extraction. The rotated component matrix shows the two components extracted from the multidimensional scale of social subsystems that comprised 12 questions (items). Each dimension consists of multiple items. The first component consists of six items related to employee participation with factor loadings ranging from 0.608 to 0.786. The second component, classified as employee empowerment, consists of six items with factor loadings ranging from 0.594 to 0.726. The next factor consists of environmental work practices with two components (i.e., internal environmental management and external environmental management), each of which consists of five items with factor loadings above 0.50. The subsequent three components represent technical work practices named TQM based on four items, JIT based on three items, and TPM based on three items, each having factor loadings of above 0.50. The last three components consist of the components of sustainable manufacturing performance (i.e., social performance, environmental performance, and economic performance) having factor loadings above 0.50. Item SMP6 shows a factor loading value of 0.432. However, we removed the item during confirmatory factor analysis.
4.1. Convergent Validity
The analysis was carried out in two stages. Firstly, the measurement model was tested to ensure the reflective items measured the construct accurately. The confirmatory factor analysis (CFA) was performed on all constructs. Subsequently, the measurement model was tested independently. The constructs of social subsystems, technical subsystems, environmental subsystems, and sustainable manufacturing performance were captured through several dimensions. This was followed by a second-order measurement analysis. In Structural Equation Modeling (SEM), model fitness has to be assessed through incremental fit indices, absolute fit indices, and parsimony fit indices [
51]. Absolute fit indices contain chi-square value, root mean square error of approximation (RMSEA), root mean square residual (RMR), goodness-of-fit (GFI), and the adjusted goodness-of-fit (AGFI). Incremental fit indices are based on normed fit index (NFI) and comparative fit index (CFI), while parsimony fit indices are based on parsimony goodness-of-fit index (PGFI) [
52].
The initial results show minor issues in model fit and factor loadings of the items. Initial values were χ
2 = 3455.974, DF = 1385, GFI = 0.678, AGFI =.0.642, Tucker-Lewis Index (TLI) = 0.793, CFI = 0.807. The values for RMR = 0.054 and RMSEA = 0.071 were within acceptable range as shown in
Table 2. This indicates the requirement of the adjustments in the model in order to achieve goodness of fit. The items TPM2, JIT2, MS3, EP4, EP5, SP4, SP5, EcP4, and EcP5 with low factor loadings (factor loadings <0.50) were removed from the model [
50]. The modification indices were subsequently treated to achieve model fitness. Error terms e1 and e2, e9 and e10, e33 and e34, e44 and e45 were correlated as they had the highest modification indices values. After adjustments in the measurement model, the final values for χ
2 = 1778.570, DF = 900, CMIN/DF = 1.976, GFI = 0.901, AGFI = 0.845, TLI = 0.984, CFI = 0.974, RMR = 0.034, and RMSEA = 0.049 resulted in a good model fit [
50].
Figure 3 shows the final measurement model used in this study.
Table 5 illustrates the average variance extraction of each construct with all the constructs having more than 0.50 of average variance extraction showing sufficient amount of convergent validity. The average variation of the extractions range was 0.529–0.720. All the constructs had satisfactory reliability as they ranged from 0.709 to 0.923. Hence, this study passed the convergent validity of constructs.
4.2. Discriminant Validity
Discriminant validity refers to discrimination between the constructs, which measures the level to which alike constructs have discrete values. It depicts the level by which constructs under study are dissimilar [
50]. Discriminant validity violation occurs in cases where correlation among exogenous constructs exceeds 0.85 and when the value of the square root of Average Variance Extraction (AVE) is greater than interconstruct correlations.
Table 6 displays the interconstruct correlations obtained from AMOS output, which represents the correlations between variables and diagonals showing the square root of AVE. It can be seen that the square root of AVE is greater than the correlations, which means that the signaled constructs are significantly different from each other in nature.
4.3. Hypothesis Testing
Having validated the measurement model, we then proceeded to test our hypotheses using SEM. The fitness indices for the structural model indicated good fit [
50]: the values were χ
2 = 1526.076, CFI = 0.972, CMIN/DF = 1.732, TLI = 0.982, GFI = 0.915, AGFI = 0.875, RMSEA = 0.062, and RMR = 0.044.
Figure 4 shows the structural model results. We used the Preacher and Hayes [
52] method for testing the mediation effect using bootstrapping technique. We also calculated the full and partial mediation by using a two-step approach. First, the direct relationships were estimated with and without the mediator in the model. H1 of the study states that management support has a positive relationship with sustainable manufacturing performance. The results indicate that the path coefficient between management support and sustainable manufacturing was 0.84 with a t value of 7.31, which is highly significant. Hence, hypothesis 1 can be accepted.
Hypothesis 2 of the study states that work practices under social subsystems mediate the relationship between management support and sustainable manufacturing performance.
Figure 4 shows that the direct result without introducing the social subsystems in the model was 0.84 with a t value of 7.31, which is highly significant. Once social subsystems were included in the model, the path coefficient between management support and sustainable manufacturing fell slightly to 0.75 with t value of 2.11, which was still significant. The results show a significant direct impact of management support on sustainable management practice, as well as a significant direct effect with social subsystems as mediator on this relationship.
Table 7 shows the indirect path coefficient for management support through social subsystems to sustainable manufacturing performance, which is 0.092. Bootstrapping analysis with 1000 iterations was performed to get
p-values of the indirect paths.
p-value of the indirect path was 0.008, which is lower than the 0.05 so that hypothesis 2 is accepted. However, since the direct effects of management support on sustainable manufacturing performance are also significant, the mediation is partial as suggested by Baron and Kenny [
21].
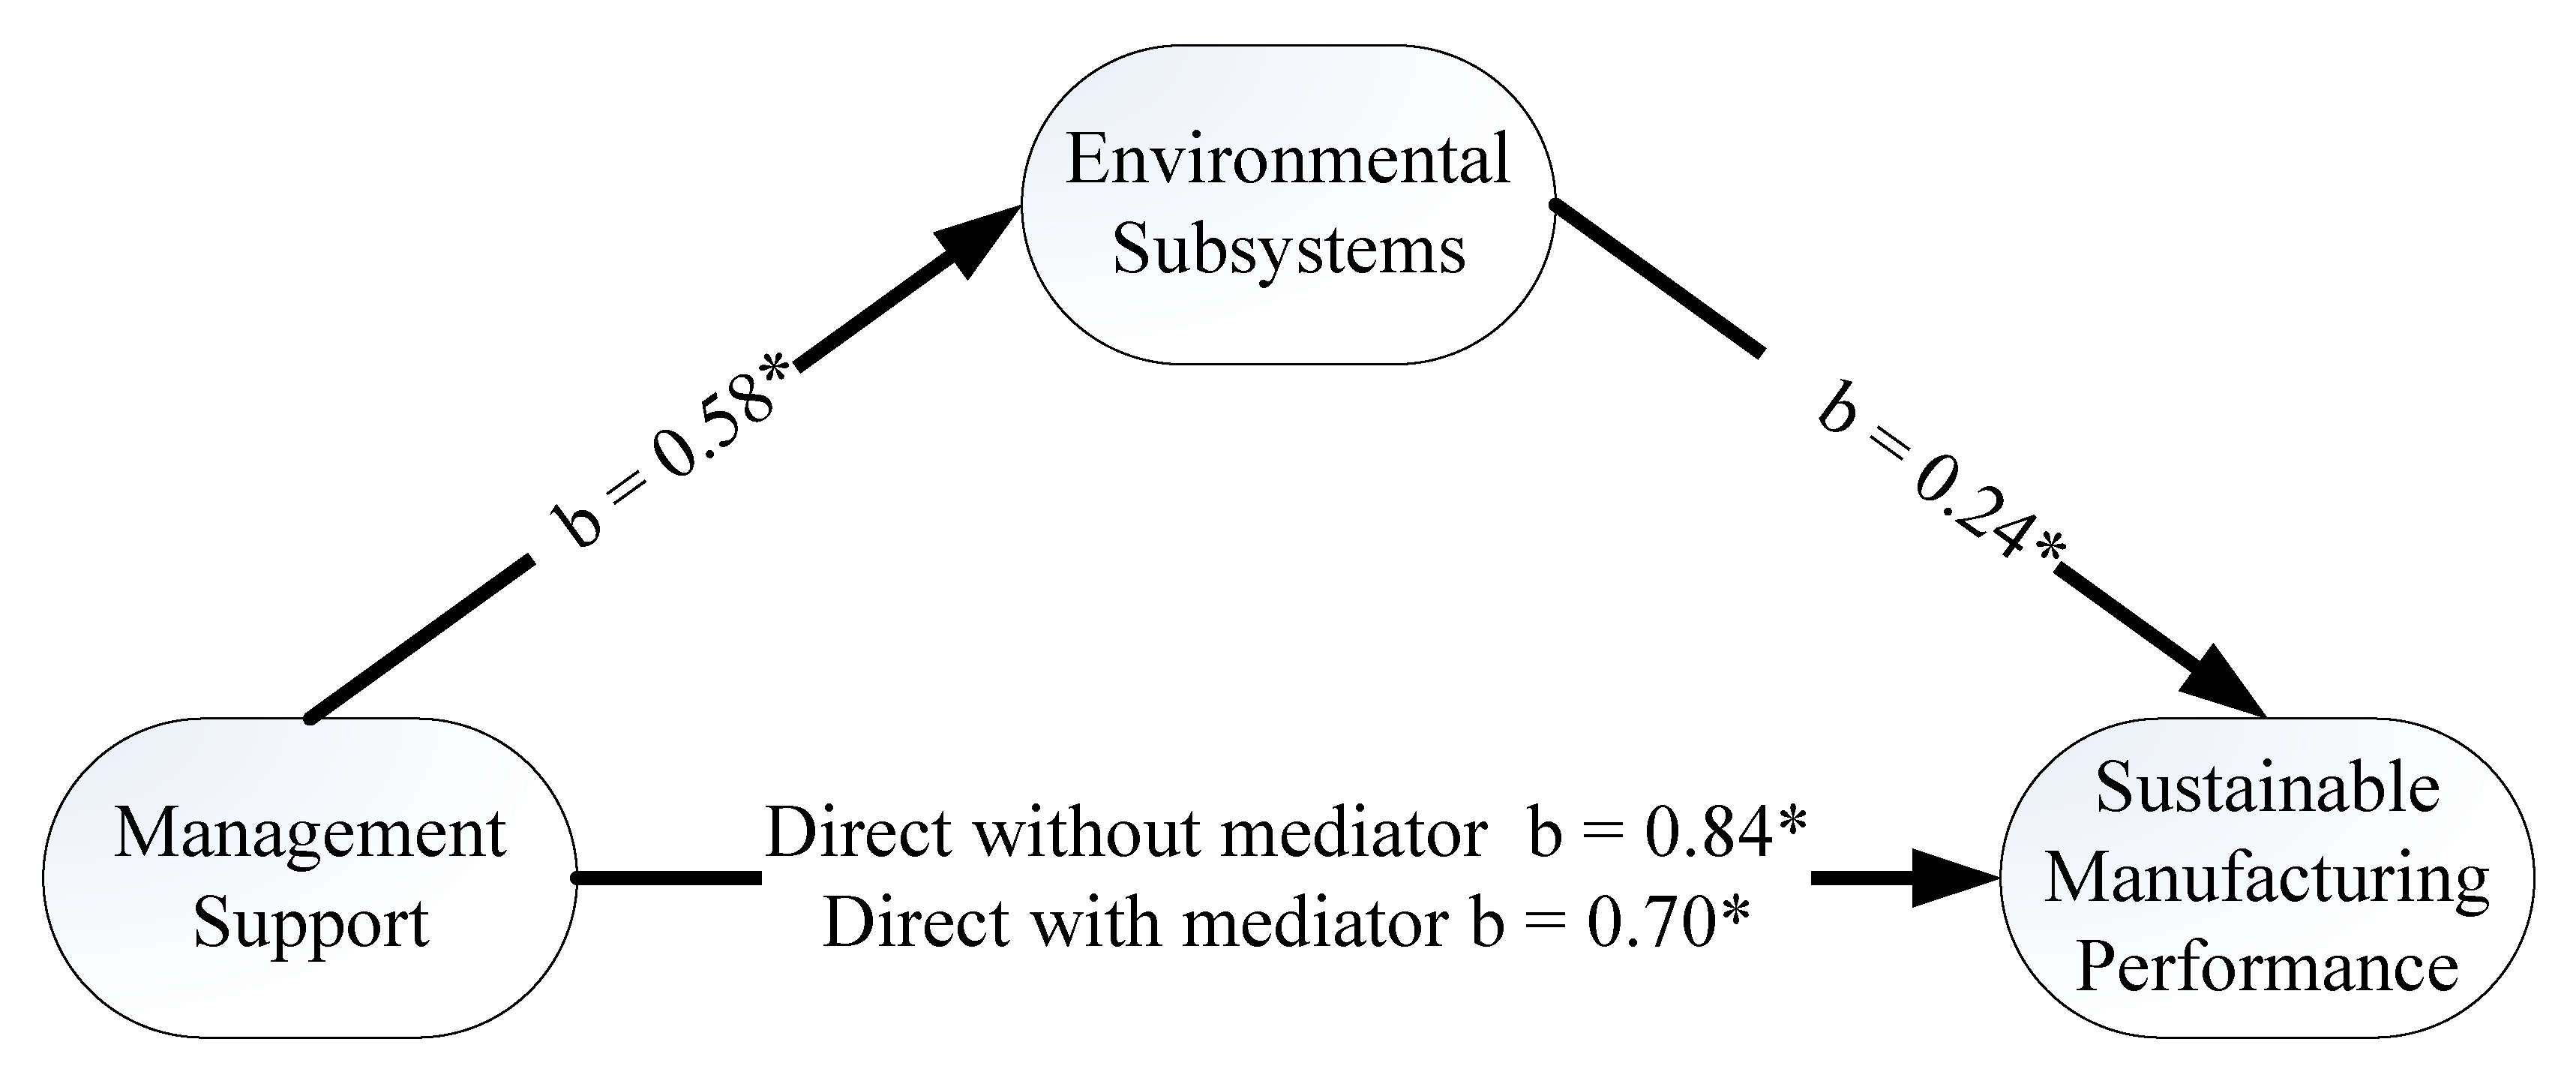
Figure 5 shows the path coefficient of 0.70 between management support and sustainable manufacturing after including environmental subsystems, which is highly significant. Thus, management support shows a significant direct impact on sustainable manufacturing performance.
Table 6 shows the indirect path coefficient of 0.139 for management support through environmental subsystems to sustainable manufacturing performance. Bootstrapping analysis with 1000 iterations was performed to get
p-values of the indirect path, which is lower than 0.05. Hypothesis 3 is accepted. Thus, environmental subsystems mediate the association between management support and sustainable manufacturing performance. Since the direct effects of management support on sustainable manufacturing performance are also significant, the mediation is partial as suggested by Baron and Kenny [
21].
Table 7 presents the mediation results.
Figure 6 shows the path coefficient of 0.75 between management support and sustainable manufacturing after including technical subsystems, which is statistically highly significant. Hence, management support shows a significant direct impact on sustainable manufacturing performance. Indirect path coefficient of 0.087 through technical subsystems is also highly significant so that hypothesis is accepted. Technical subsystems mediate the association between management support and sustainable manufacturing performance. As shown in
Table 7, since the direct effects of management support on sustainable manufacturing performance are also significant upon calculation with mediator, the mediation is partial as suggested by Baron and Kenny [
21].
5. Conclusions
We conclude that management support is crucial to engender the conditions to galvanize the social, environmental, and technical subsystems to stimulate improvements in sustainable manufacturing performance. The results are also palatable for consideration by competitive firms seeking to sustain their profitability as the three subsystems do not compromise on growth and performance. High levels of management support help employees in manufacturing plants to enjoy high levels of empowerment and participation to pursue sustainable manufacturing initiatives. In addition, evidence shows that cutting-edge environmental practices are important to raise manufacturing performance sustainability. However, the level of environmental management practices usage is dependent on the management support and facilitation. The results show that environmental practices mediate the relationship between management support and sustainable manufacturing practices. Similarly, technical work practices, such as TQM, TPM, and JIT, mediate the relationship between management support and sustainable manufacturing performance.
The results also highlight the mediating effect of social, environmental, and technical work practices on the relationship between management support and sustainable manufacturing performance. Hence, efforts must be taken to encourage managements of manufacturing firms to support sustainable management performance, while at the same time supporting them to introduce cutting-edge social, environmental, and technical practices. Following the election of the new government on May 2018, the Energy, Science, Technology, Environment and Climate Change Ministry has taken a strong policy line to green the environment on all fronts. In addition to efforts to reduce carbon emission by 20% by 2025 from 2005 levels, the Ministry has also begun efforts to lower plastics use and increase energy supply through increasing the supply of renewable energy [
51]. It should extend such initiatives to green processes and materials used in the economy in general and manufacturing in particular. Given that the environment is a global common, such initiatives should be promoted regionally and globally across countries.

 ,
, 


