Article

Voting on Behalf of a Future Generation: A Laboratory Experiment

1
School of Economics and Management, Kochi University of Technology, 2-22, Eikokuji-Cho, Kochi-Shi, Kochi 780-8515, Japan
2
Research Institute for Future Design, Kochi University of Technology, 2-22, Eikokuji-Cho, Kochi-Shi, Kochi 780-8515, Japan
3
Research Institute for Humanity and Nature, 457-4 Motoyama, Kamigamo, Kita-ku, Kyoto 603-8047, Japan
4
Department of Management, Kyoto College of Economics, 3-1 Higashinaga-cho, Ooe, Nishikyo-ku, Kyoto 610-1195, Japan
*
Author to whom correspondence should be addressed.
Sustainability 2019, 11(16), 4271; https://doi.org/10.3390/su11164271
Submission received: 6 July 2019 / Revised: 2 August 2019 / Accepted: 5 August 2019 / Published: 7 August 2019
(This article belongs to the Collection Future Design)

Abstract

:
This paper investigates a new voting rule wherein some people are given extra votes to serve as proxies for future generations. We predict that this voting scheme affects the voting behavior of those who do not receive an extra vote (i.e., single-ballot voters) because they are less likely to become a pivot, while proxy voters are expected to behave in support of the future generation. To test this prediction, we compare three scenarios wherein single-ballot voters would cast a vote: (a) one-voter-one-vote scenario wherein all voters cast only a single ballot; (b) a standard proxy-voting scenario wherein other voters cast two ballots, and the second vote is to cast for the benefit of a future generation; and (c) a non-proxy-voting scenario wherein other voters cast two ballots with no explanation for the second vote. The result shows that single-ballot voters are less inclined to vote for the future-oriented option in (c) than in (a). This indicates the potential drawback of the new voting scheme. However, there is no difference in the single-ballot voters’ decision between (a) and (b), indicating that the explanation of the second ballot as the proxy is important for reducing the intergenerational inequality through this voting reform.

1. Introduction

Although future generations are affected by on-going economic, social, and environmental conditions, the current political process allows present-day voters to ignore future generations’ needs and this fosters the crisis of the sustainability of our society and nature. Moreover, democratic countries with aging populations suffer a common political problem—an increase in the age of voters—, which spurs the crisis. When a country’s population advances in age, the intergenerational allocation of the country’s resources becomes biased in favor of the elderly, and policies that may increase the country’s birth rate are given less importance [1,2,3,4,5]. Noted demographer Paul Demeny proposed a radical approach to deal with this issue—a new voting system wherein parents are allowed to vote as proxies for their children [6]. The system, called Demeny voting [7], has been the subject of debate in several European countries, including Germany, Hungary, and Austria. In these debates, Demeny voting is offered as a potential electoral rule that would enable the current generation to make future-friendly decisions, thereby reducing inequality between the current and future generations. Discussions related to the Demeny voting system are now pervasive in other countries, including Japan [8,9] and Canada [10].
Besides the inequality between the present and the future generations, now we face several kinds of problems related to sustainability issues like global warming, energy problem, etc. To relieve these problems, saving the consumption and the usage of energy is important. However, our present generation has the priority on the allocation problem between present and future [11,12]. How we deal with the sustainability issues depends on the decision of a democratic process and thus the voting reform such as the Demeny voting is expected to enhance the sustainable decisions.
Although Demeny voting has been considered in many developed countries, we have almost no experience of its actual working in any country at any period of time (A few exceptions existed in the French protectorate of Tunisia and Morocco during the interwar period [13].). Therefore, we do not have empirical evidence on what would likely happen under this voting scheme, and therefore need an empirical investigation. The purpose of this study is to investigate possible flaws in the proxy-voting system proposed by Demeny in order to provide further insight to current discussions on it. Past research on the proxy-voting scheme has generally focused on its legitimacy [13,14]; however, this study investigates whether it accomplishes the benefits of future generations as intended.
To clarify the focus of this paper, let us consider a voter who prefers to vote for a candidate that emphasizes issues salient to future generations (e.g., environmental protection, education, or technological progress) over benefits to the current generation (e.g., tax reduction). Would such a voter cast his or her ballot for the future-oriented candidate if other voters were expected to cast a proxy vote on behalf of a future generation? This is a critical question, as the contention that proxy-voting schemes benefit future generations and correct intergenerational inequality hinges on the assumption that they do not affect the voting behaviors of people who are not given the proxy votes. However, as is often the case with economic policies and institutions, the new voting scheme may change voting behavior, resulting in unexpected and unintended outcomes.
In this study, we are concerned with whether people who do not have a proxy vote change their voting behavior. We focus on the behavior of single-ballot voters because current discussions on the proxy-voting scheme overlook this crucial point. Even after the introduction of this new voting system, the majority of voters still cast only a single ballot. Their behavior still has a substantial influence on election outcomes.
To evaluate single-ballot voters’ behavior in the proxy-voting scheme, we utilize a laboratory-based experiment. Although such experiments (using university student participants) are not suitable for testing how parents cast their proxy votes on behalf of their children, they are suitable for testing the behavior of single-ballot voters in different voting systems. By evaluating voter behavior in different voting systems (and therefore, with different voting incentives), this study can provide useful information to consider when introducing this scheme for future generations.
There are two key reasons why single-ballot voters may behave differently in the proxy-voting scheme relative to traditional voting systems. First, their influence on an election is weakened in the proxy-voting scheme because it empowers another voting block (i.e., parents voting on behalf of their children). Second, voters allowed to cast two ballots are expected to cast their second ballot on behalf of a future generation; this expectation can affect the voting preferences of single-ballot voters. Taken together, these two factors can influence the behavior of single-ballot voters in different ways.
In our experimental task, two participants act as representatives of the present generation, and one of them acts as a representative of a future generation. The two members of the present generation determine how resources should be allocated between the two generations. We then compare the voting decisions of present-generation participants between two voting rules—a traditional voting system (i.e., each participant casts one ballot) and the proxy-voting scheme (i.e., one of the two present-generation participants casts two ballots). To independently test the effects of the proxy-voting scheme on the voting behavior of single-ballot voter, we compare voting behavior between two slightly different voting schemes—proxy-voting (PV) and non-proxy-voting (NPV) schemes. Both of them are asymmetric voting schemes. However, in PV, the rationale for the two-ballot voter receiving the second vote is explained; in NPV, it is not. Thus, we compare the voting decision of single-ballot voters in the traditional voting system, PV, and NPV. Comparing voting decisions in the traditional voting system and in NPV, we test the effect of the decreasing influence of single-ballot voters. The comparison of single-ballot voters’ decisions in NPV and PV tests how the rationale of the second vote affects their voting behavior.
We derive predictions from two different strands of literature on voting. In the first, a voting model wherein voters express their preferences through voting behavior in a manner similar to fans cheering for their favorite sports teams is considered [15,16]. The expressive voting model predicts that the decreasing pivot probability promotes voting for a future-friendly option because the cost of behaving ethically becomes lower when the voters’ decision is less likely to influence the voting outcome. The second strand is related to the conformity of decisions. In the literature, it is known as the bandwagon effect [17,18]. The bandwagon model predicts that explaining the rationale for the two-ballot voter’s proxy vote increases the single-ballot voter’s expectation that the likely winner is a future-friendly option, and thus promotes the ethical voting of single-ballot voters.
The experiment’s results provide evidence against our first prediction of expressive voting model; the NPV scheme did not induce single-ballot voters to vote for future-oriented issues possibly because asymmetric voting power between single- and two-ballot voters in this scheme produces unfair perception of the single-ballot voters. This perception may induce them to vote more egoistically. However, we did find support for the bandwagon model prediction—single-ballot voters will vote in favor of the future in the PV scheme relative to the NPV scheme. It is likely that the combined effect of decreasing pivot probability and the explained rationale of the two-ballot voters’ second vote guaranteed the neutrality of single-ballot voters’ behavior before and after the introduction of the proxy-voting scheme. These results suggest that the success of the new voting scheme suggested by Demeny should depend on whether the rationale behind giving some voters a second ballot is explained and understood.
Our results have implications not only for the current discussions on voting reform, but also for the academic literature on experimental economics and political science. First, our use of an experimental design (and the results derived from it) is relatively novel in this domain. Past experimental research on weighted voting is based on cooperative game theory [19,20]; however, our study focuses on how asymmetric voting power affects the decision between self-interest and fairness. Second, this study adds to the literature on the expressive voting model by showing a negative relationship between pivot probability and fair voting [21,22,23]. Our results indicate that voters’ behavior is affected by whether voting power is symmetrical or asymmetrical. Third, our research design is related to a dictator game experiment wherein a group of multiple participants plays the role of a dictator. Past literature on group decision-making has suggested that, relative to individuals, groups tend to show greater self-interest because of in-group favoritism and the group discussion process [24,25]. In this study, we demonstrate how the manner wherein each group member’s opinion is aggregated affects each group member’s voting preferences.
To address these issues, we have organized the remainder of the paper in a series of interrelated sections. In the next section, we describe our experimental design. We then present the results of our experiment in Section 3. Finally, in Section 4, we summarize our results, discuss their implications, and outline their limitations.

2. Material and Methods
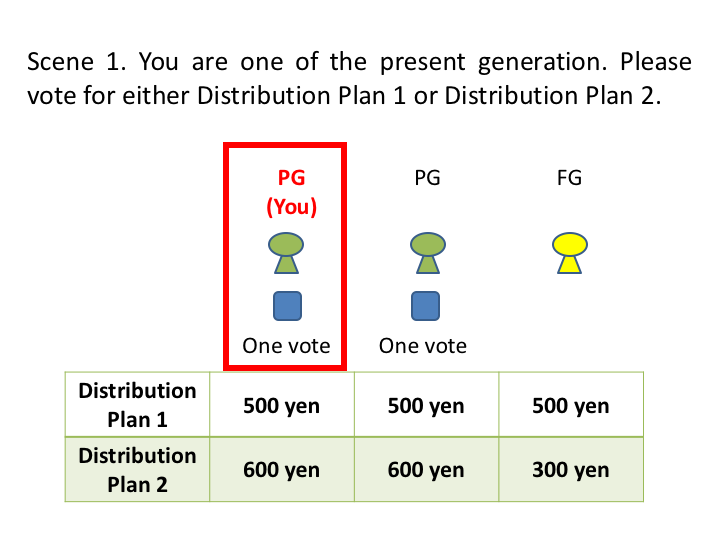
2.1. Task

We divide participants into groups of three to represent individual “societies”. Two of the three group members represent the present generation, and the remaining member represents the future generation. The two members of the present generation determine the way wherein resources are allocated between the present and future generations. The members of the future generation cannot participate in decision-making related to resource allocation, but receives a payoff determined by the present generation. Given this setup, the future generation can be considered a stakeholder, but is excluded from the political process. In this sense, our experimental findings can be extrapolated to not only intergenerational resource allocation problems, but also to more general situations wherein some stakeholders are excluded from the decision-making process.
Members of the present generation are asked to choose one of the following two alternatives (see Table 1): an allocation scheme wherein all individuals receive 500 JPY (Choice A, a sustainable or future-oriented option), or a setup wherein the members of the current generation receive 600 JPY and the member of the future generation receives 300 JPY (Choice B, a present-oriented option). We assume the future-oriented choice to be the fair option because the present political decision is biased toward the present [11,12,26].
Members of the present generation vote on the choices, and the option that receives the most votes is declared the winner (with resources allocated accordingly). In the ordinary voting (OV) scheme, each member in the present generation casts a vote for only one of the options. Voters are not allowed to abstain. In case of a tie between choices, one option is randomly selected.
In the proxy-voting (PV) scheme, one of the two members in the present generation is provided with an additional vote that represents a proxy ballot for the future generation. Although the person provided with the additional vote is recommended to use it on behalf of the future generation, he or she is not required to do so. We consider the PV scheme to be asymmetric in terms of voting power because one of the two present-generation members is provided with two votes relative to the other member’s one vote. The member with one vote is called a “single-ballot voter”, and the member with two votes a “two-ballot voter”.
We use this binary-option experimental design to eliminate strategic considerations from the voting decision as much as possible. This design allows us to determine that differences in voting behavior across conditions reflect changes in voting preferences because of the voting scheme.

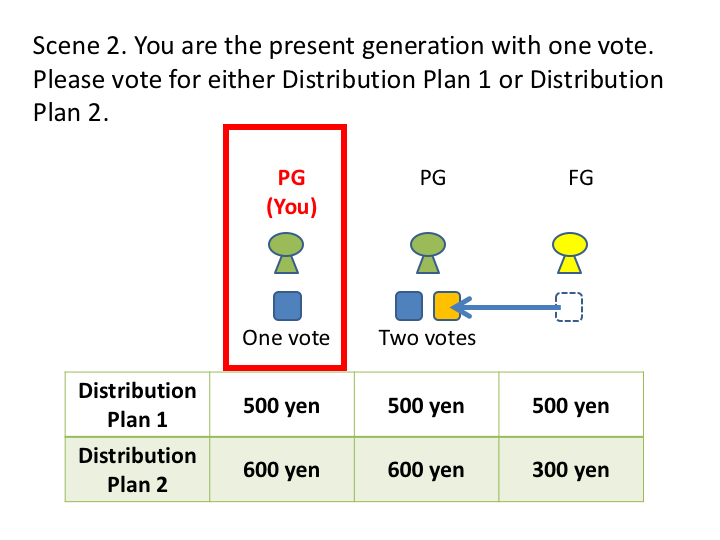
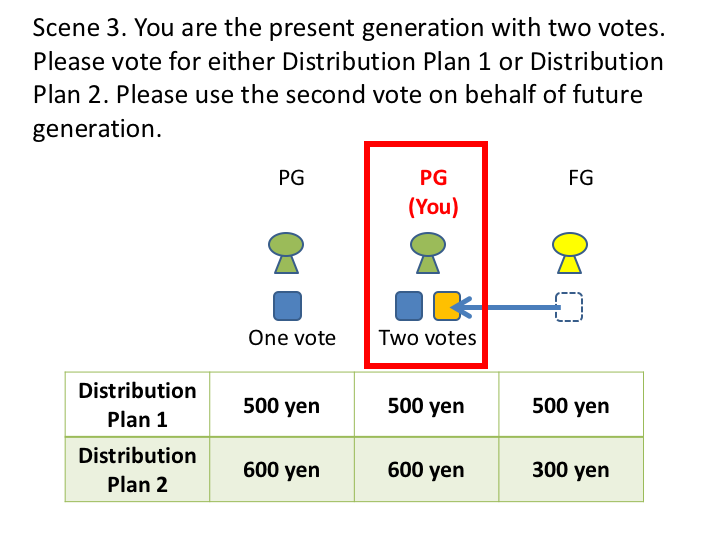
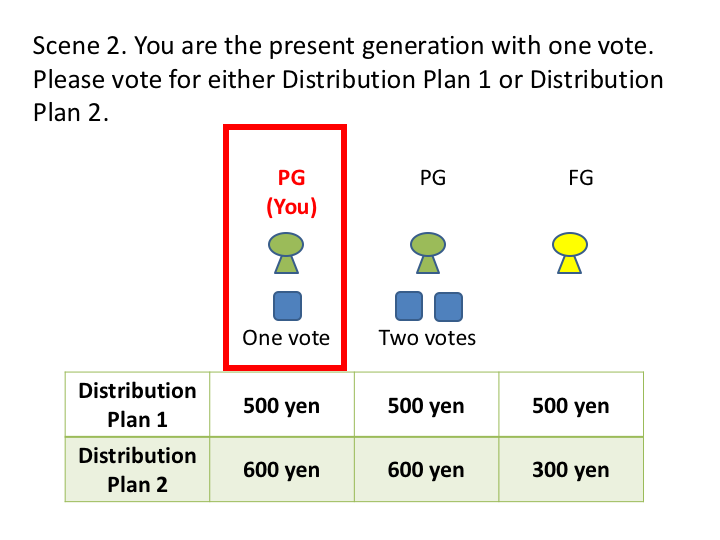
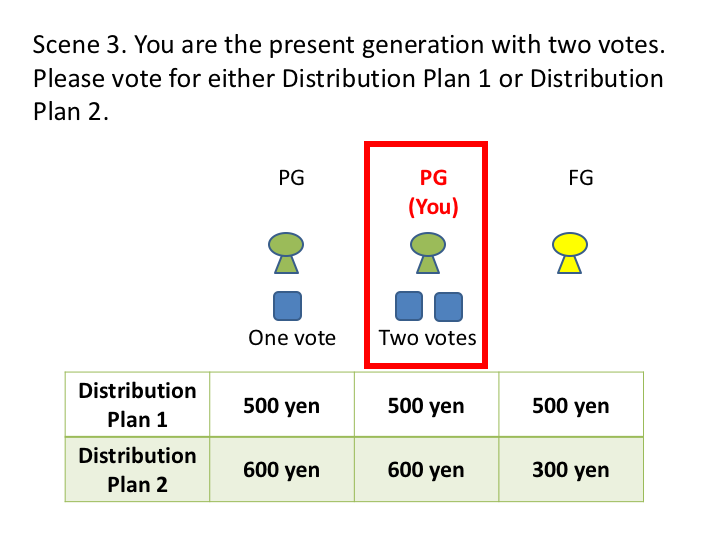
2.2. Two Types of Asymmetric Voting Scheme: Proxy Voting and Non-Proxy Voting

The PV scheme differs from the OV scheme (i.e., one-voter-one-vote scheme) in two key ways. First, the PV is weighted such that some voters are allowed multiple votes, while others are not. This creates asymmetric voting power between voters. Second, when the PV scheme is employed, two-ballot voters are instructed to use their second ballot on behalf of the future generation. However, this instruction is non-binding, and, therefore, has no influence on the structure of their voting power between the present and future generations. Nevertheless, we expect the instruction to influence voters’ moral preferences by increasing the perception that Choice A is socially desirable.
To distinguish the two effects that the PV scheme may induce, we also create a control condition wherein voters have asymmetric power (i.e., one voter has one vote and the other has two), but they do not receive explanations for the two-ballot voter’s second vote. In the control condition, the two-ballot voter’s second vote was not framed as the voting right of members of the future generation. This control condition is called the non-proxy-voting (NPV) scheme. By comparing single-ballot voters’ voting behavior in the OV scheme to their behavior in the NPV scheme, we can evaluate how asymmetric voting power affects voting behavior independent of context. By comparing the single-ballot voters’ voting behavior in the NPV scheme to their behavior in the PV scheme, we can test the effect of “proxy voting” on the voting behavior of single-ballot voters.

2.3. Hypothesis

Experimental research on actual human subjects has shown that they are not simple economic agents that maximize their own tangible profit. Here, we assume that voters have behavioral preferences that are popular in the voting context as well as concerns regarding their tangible outcome.
First, in addition to being motivated by tangible outcomes, people also have a tendency to behave in an ethical manner [27]. Research on voting behavior has shown that voters obtain positive utility not only from the outcomes of the elections wherein they participate, but also by using their votes as an expression of their attitudes [28,29,30,31,32,33].
Second, we assume that voters may prefer to vote for the likely winner. The bandwagon effect [17,18,34,35] will affect voting behavior in our experiment because the prospects of the likely winner are different between the three situations, even though voters have the same belief on other voters’ preference in the three different situations.
To derive a sharp hypothesis on voting behavior, we consider a rational decision model of voters incorporating the expressive and bandwagon preferences. In our model, in addition to the tangible utility from choices (i.e., 500 JPY if Choice A is realized and 600 JPY if Choice B is realized), voters are assumed to obtain utilities from other sources—their behavior itself (not the outcome), and victory or defeat of the choice for which they casted their ballots. We assume that voters construct subjective probability to the opponent’s preferences on choices, and this probability is not affected by the voting scheme. Let pA and pB be the subjective probabilities that the opponent likes Choices A and B, respectively. Given this, voters cast their ballots in order to maximize their expected payoffs.

2.3.1. Expressive Voting Preference

In the expressive voting model, voters are assumed to obtain positive utility UE directly from behaving in an ethical manner. Since Choice A is fairer, we assume that the voter obtains UE by just voting for Choice A. The size of UE depends on voter characteristics, but we assume that this is constant across voting schemes for that voter.
We now calculate the expected payoff of voting for A and B as follows. In the OV scheme, these expected payoffs are
E U E O V ( A ) = U E + p A × 500 + p B × ( 0.5 × 500 + 0.5 × 600 ) , E U E O V ( B ) = p A × ( 0.5 × 500 + 0.5 × 600 ) + p B × 600 .
Thus, the payoff difference between voting for A and B is
D E O V = U E + 0.5 × ( 500 600 ) .
The second term is interpreted as the pivot probability of this voter multiplied by the reduction in the tangible outcomes; this is considered the cost of acting in an ethical manner. Thus, the payoff difference is the direct utility by behaving ethically minus the cost of doing that. If voters are rational, they vote for Choice A if D E O V is greater than 0.
Next, we consider how single-ballot voters vote in the NPV scheme. In this voting scheme, voters think that two-ballot voters cast their ballots for their preferred choices. Thus, single-ballot voters assume that there is no split voting in two-ballot voters, and thus his or her pivotal probability becomes zero. Thus, in NPV, the payoff difference is just the positive gain, and cost is negligible. Thus, we have
D E N P V = U E
In contrast to the NPV, single-ballot voters think that the two-ballot voters in the PV scheme use the second vote for the future generation, and vote for Choice A. In the first ballot, they use the vote for themselves. Thus, with probability pA, the opponent casts their two ballots for Choice A, but, with probability pB, they split their votes into two choices. Therefore, in the PV scheme, these expected payoffs are
E U E P V ( A ) = U E + p A × 500 + p B × 500 ,
E U E P V ( B ) = p A × 500 + p B × 600 .
Thus, the payoff difference is
D E P V = U E + p B × ( 500 600 ) .
Since our behavioral model assumes that voters choose Choice A if the payoff difference is positive, we have the following predictions.
E1 (Asymmetric voting power). 
Single-ballot voters in the NPV scheme will vote for Choice A more frequently than single-ballot voters in the OV scheme will.
E2 (Proxy vote). 
Single-ballot voters in the NPV scheme will vote for Choice A more frequently than single-ballot voters in the PV scheme will.
Rationales for E1 and E2 are as follows: E1 is derived from the analytical result wherein D E N P V > D E O V , and thus, D E O V > 0 implies D E N P V > 0 . Therefore, if some voter votes for Choice A in the OV scheme, the voter must vote for Choice A when he or she is a single-ballot voter in the NPV scheme. E2 is derived from the analytical result wherein D E N P V > D E P V , and thus D E P V > 0 implies D E N P V > 0 .
Our hypotheses, which are derived from expressive voting models, are consistent with extant literature. This suggests that voters tend to vote for fair and ethically sound alternatives as their pivot probability decreases and the cost of expressing the ethical behavior becomes lower [21,22,35]. In our model, a single-ballot voter in NPV has negligible influence on the voting outcome, and thus the cost of expressing an ethical attitude is small. This implies that they vote for Choice A more frequently than voters in OV and PV do.

2.3.2. Bandwagon Preference

Another relevant behavioral characteristic of voters in our voting context is the bandwagon effect [17,18,34,35]. Voters may prefer to vote for the likely winner. Thus, we assume that voters obtain a positive utility UB if they vote for the winner. For a person who has a strong bandwagon preference, it is important to follow the behavior of the majority members. In our context, the prospect of how the opponent votes in each voting scheme is important to determine the voting decision of the voter with a strong bandwagon preference.
We now calculate the expected payoff of voting for A and B as follows. In the OV scheme, these expected payoffs are
E U B O V ( A ) = p A × ( U B + 500 ) + p B × 0.5 × ( U B + 500 ) + p B × 0.5 × 600 ,
E U B O V ( B ) = p A × 0.5 × 500 + p A × 0.5 × ( U B + 600 ) + p B × ( U B + 600 ) .
Therefore, the payoff difference is
D B O V = 0.5 × ( p A p B ) × U B + 0.5 × ( 500 600 ) .
Next, we consider how a single-ballot voter votes in the NPV scheme. In this voting scheme, voters think that two-ballot voters cast their two ballots for their preferred choices. Thus, the single-ballot voters assume there is no split voting in two-ballot voters, and thus their pivot probability becomes zero. Thus, we have
E U B N P V ( A ) = p A × ( U B + 500 ) + p B × 600 , E U B N P V ( B ) = p A × 500 + p B × ( U B + 600 ) .
Thus, the payoff difference is
D B N P V = ( p A p B ) × U B .
In contrast to NPV, single-ballot voters in the PV scheme think that two-ballot voters use their second vote for the future generation and vote for Choice A. However, they use their first ballots for themselves. Therefore, in the PV scheme, the expected payoffs are
E U B P V ( A ) = p A × ( U B + 500 ) + p B × ( U B + 500 ) , E U B P V ( B ) = p A × 500 + p B × ( U B + 600 ) .
Thus, the payoff difference is
D B P V = p A × U B + p B × ( 500 600 ) .
The magnitude of the relationship between the three payoff differences is more complex because it depends on the subjective probability and the bandwagon utility. However, under a reasonable assumption on the subjective probability that the egoistic choice is more frequent (i.e., p B > 0.5 ), D B O V and D B N P V must be negative. However, it is possible that D B P V is still positive (when U B > 100 p B p A ). Thus, from bandwagon preferences with such an assumption on the subjective probability, we have the following predictions.
B1 (Asymmetric voting power). 
The frequency of voting for Choice A of single-ballot voters in the NPV scheme is not different from that in the OV scheme.
B2 (Proxy vote). 
Single-ballot voters in the PV scheme will vote for Choice A more frequently than single-ballot voters in the NPV scheme will.
The rationales for B1 and B2 are as follows. B1 comes from the analytical result wherein both D B O V and D B N P V are negative when p B > 0.5 . B2 comes from the analytical result wherein, while D B N P V is negative when p B > 0.5 , D B P V can be positive.

2.3.3. Summary of the Predictions and Their Presumptions

Table 2 summarizes our models and predictions. The predictions derived from the two different models are contrasting. While the highest frequency of ethical voting is predicted in NPV from the expressive voting preference model, it is predicted in PV from the bandwagon preference model. The three presumptions that are needed to derive these predictions should be emphasized. First, we assume that, in NPV, vote splits rarely occur. Second, the second votes of the two-ballot voters in PV are cast more frequently for Choice A. Third, the frequency of ethical vote is less than 50% in all situations except for the proxy vote in PV.

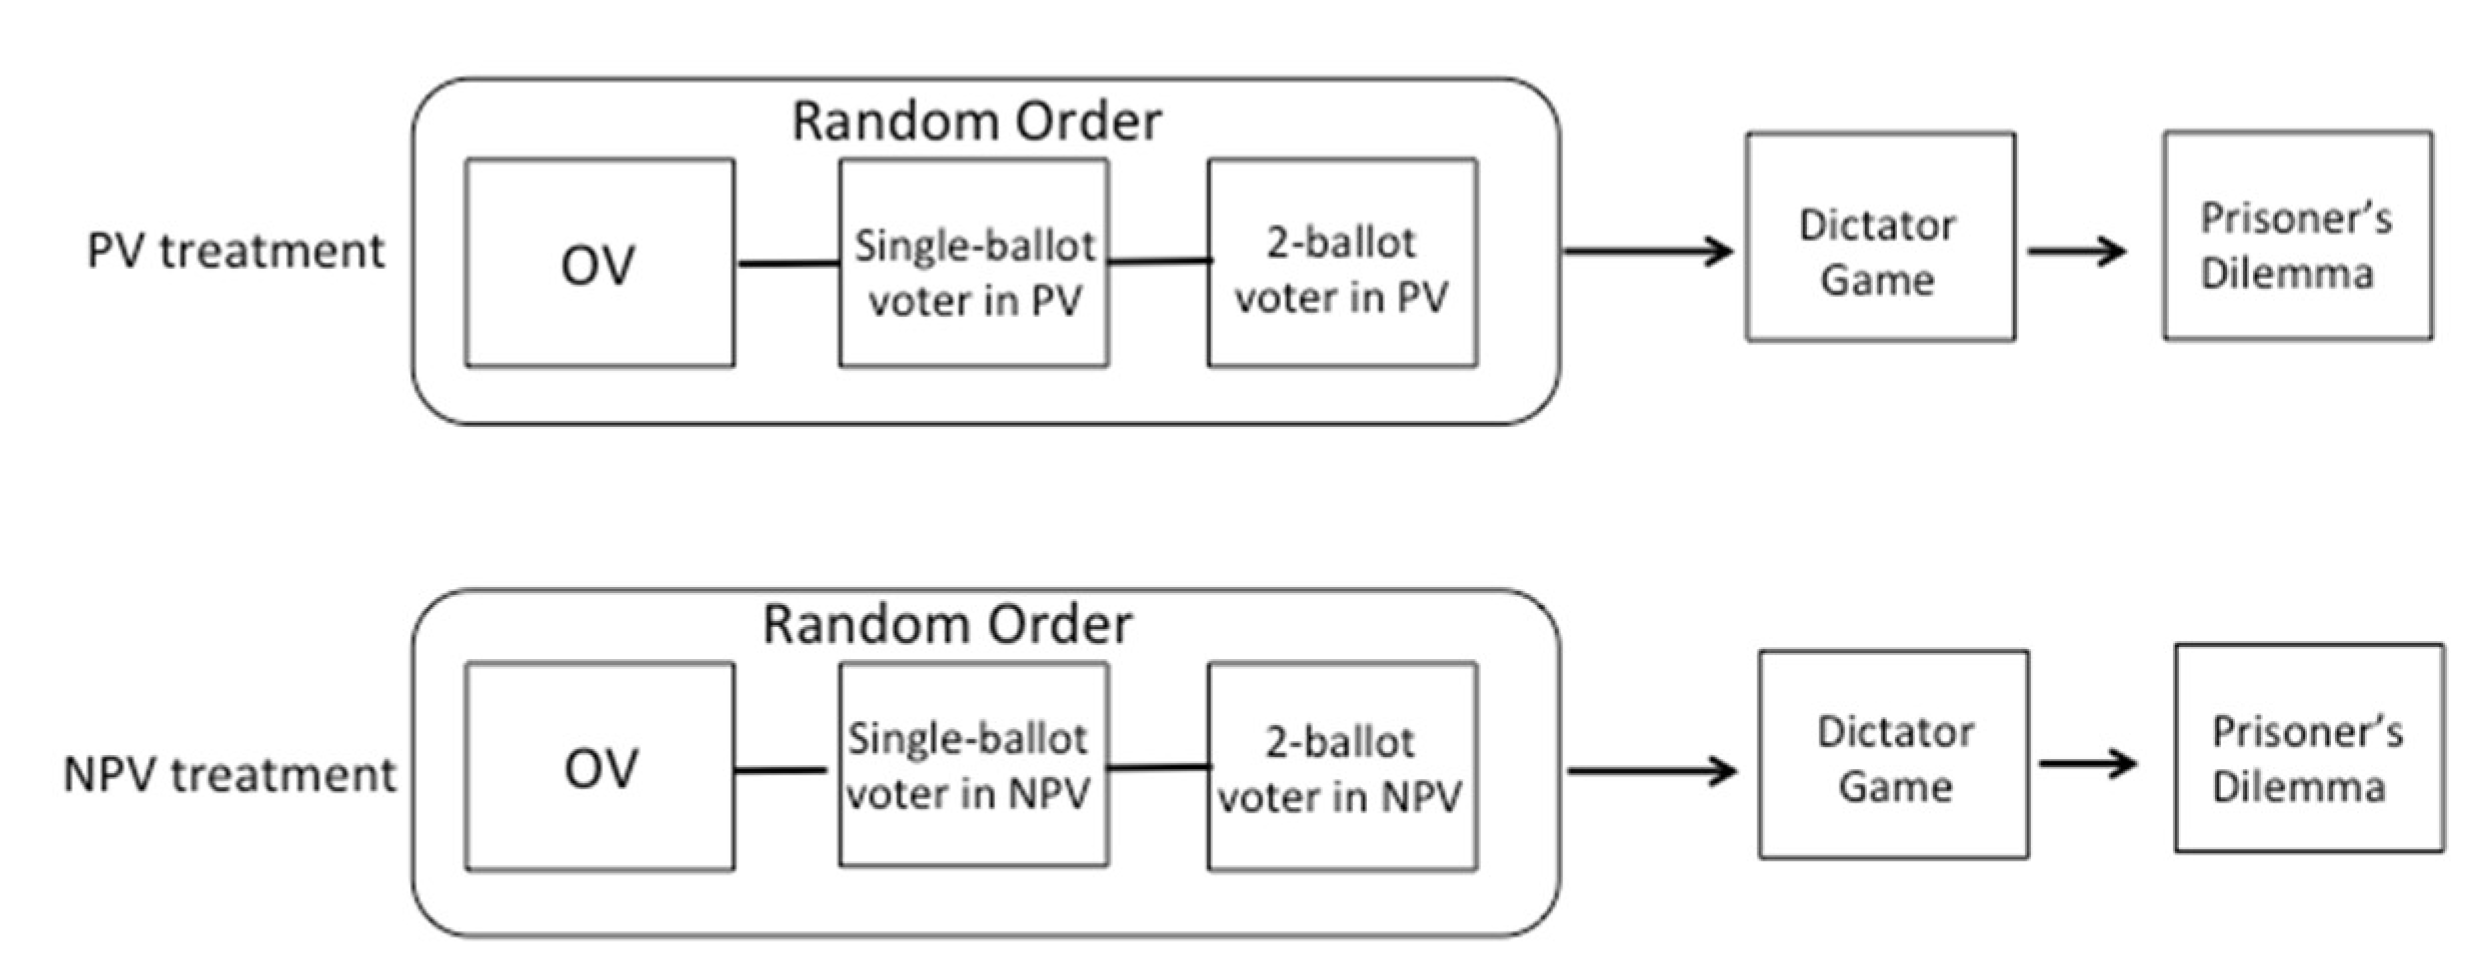
2.4. Experimental Design

We use a between-subjects experimental design to compare the voting behavior of single-ballot voters in the NPV and PV schemes. In contrast, we use a within-subjects experimental design to compare voting decisions between the OV and the PV schemes and between the OV and the NPV schemes (see Figure 1).
We adopt the strategy method to collect meaningful data for this study as much as possible. Thus, before determining the voting scheme (OV or PV/NPV) and the role (present generation or future generation; OV voter, single-ballot voter, or two-ballot voter), the participants are asked to choose and vote for either Choice A or B if they play each of the roles. In the PV and NPV treatments, there are three roles (i.e., OV voter, single-ballot voter in the PV/NPV scheme, and two-ballot voter in the PV/NPV scheme) of making decisions; thus, the three decisions are made in a random order to control the order effect (see Figure 1). Before each decision, we give three minutes to the participants for considering the decision.
Previous experimental studies have shown that concerns that are related to fairness and altruism are different across individuals. We measure these factors because they are of interest to our current study. After participating in the voting experiment, participants move on to a dictator game (DG), and, then, a prisoner’s dilemma (PD) (see Figure 1). In the DG, participants are paired; one of the two participants is randomly selected to act as the dictator. The dictator then allocates proportions of 1000 JPY to the dictator and the opponent. Before being told whether they were assigned the role of dictator, participants answered how much they would allocate to their opponents if they were assigned that role.
In the PD, each of the paired participants is initially allocated 300 JPY, and must decide whether to pass 200 JPY from it to the paired participant. If the participant passes 200 JPY of his or her 300 JPY, the opponent receives double the amount of the passed amount. In the context of the prisoner’s dilemma, “pass” and “not pass” are respectively treated as cooperation and defection. We conduct both simultaneous and sequential PD experiments to evaluate participants’ propensity for altruism, reciprocity, and beliefs in others’ behavior. The detailed instructions of all experiments are in Appendix A.

2.5. Procedure

We performed all experiments at the experimental laboratories of Kochi University of Technology and Kansai University in 2016 and 2017. Each research subject participated in only one session. In total, 162 participants were assigned to the PV treatment, and 159 participants to the NPV treatment.
At the beginning of each session, participants were randomly assigned to laboratory booths. These booths separated participants to ensure their decisions were made independently and anonymously. Once participants took seats inside these booths, the experimenter provided them with instructions. Consistent with the common practice in experimental economics, we used neutral wording in the instructions to the extent possible. For example, we avoided words such as “fair”, “pity”, “election”, “democracy”, and “Demeny voting”.
In the order stated, participants engaged in the voting experiments, the DG experiment, and the PD experiment. Participants were unaware of the nature of the experiments before they engaged in them, and feedback for all experiments was provided at the conclusion of the final experiment (i.e., the PD experiment). In this way, we avoid confounding each result.
We used z-Tree software [36] to perform the experiment. On average, sessions took 90 minutes to complete. The participants’ earnings are based on the collective results of the three experiments, and the average payment per subject is 2311 JPY (approximately 21 USD).

3. Results

3.1. Summary of Experimental Data

Table 3 reports the descriptive statistics associated with both the NPV and the PV treatments. Variables related to the voting and the PD experiments take the value of 1 if the ethically superior option is chosen (i.e., Choice A in the voting experiment and cooperation in the prisoner’s dilemma) and 0 otherwise. The value of the variable associated with the DG ranges from 0 JPY to 1000 JPY (equal to the amount offered). As shown in Table 3, the variables in the DG and PD show no significant differences between the two treatments. This result indicates that slightly different instructions in the voting experiment (i.e., revelation of the purpose of the second vote) between the two treatments did not influence participants’ decisions in the DG and the PD experiments. Moreover, there is no significant difference in the choice under the OV scheme between the two treatments. This indicates that participants’ voting behaviors in the OV scheme are not affected by the instructions for NPV and PV. We find the only difference in the behavior of single-ballot voters between the PV scheme and the NPV scheme (though this difference is significant only at the 10% level), and the direction is much consistent with B2, rather than E2. We elaborate further on this finding in Section 3.4, wherein we perform a regression analysis that controls for the effects of other variables.
Figure 2 shows the proportion of votes for Choice A, depending on voting rules and the context. While Choice A receives the greatest proportion of votes in the PV scheme, it receives the smallest proportion of votes in the NPV scheme. The difference between PV and NPV schemes in the proportion of votes received by Choice A is likely attributable to the appropriate usage of two-ballot voters’ proxy votes for the future generation, coupled with a moderate increase in ethical voting practices among single-ballot voters (see Table 3). In addition, the decrease of the share of Choice A in the NPV scheme is also attributed to a decline in future-oriented voting among single-ballot voters. This result demonstrates that the manner wherein voters interpret the intention of the second vote being given to two-ballot voters is critical.

3.2. Checking the Presumptions

Here, we check the three presumptions that underlie the models (see Table 2). First, as predicted, the ratio of vote-split is lower in the NPV scheme than in the PV scheme. However, a non-negligible percentage of participants in the NPV scheme (18.24%) split their votes between Choices A and B. One interpretation of this behavior is that these participants are indifferent to Choices A and B. Another is responsibility-avoiding behavior on the outcomes; their vote split makes the single-ballot voter pivotal. Second, about 70% of the second vote in the PV scheme is cast to Choice A, much higher than the ratio of voting for A in the other voting conditions. This is significantly higher than 50%. Third, the frequency of the ethical vote is 0.35, 0.37, 0.30, 0.38, 0.31, and 0.31 in the OV scheme of the NPV treatment, the OV of the PV treatment, single-ballot voter in the NPV scheme, single-ballot voter in the PV scheme, and two-ballot voter in the NPV scheme, and the first ballot of the two-ballot voter in the PV scheme, respectively. All of them are significantly lower than 0.5 (according to a chi-square goodness-of-fit test).
In summary, the presumptions behind the models hold, and we directly test the predictions from these models in the next subsections.

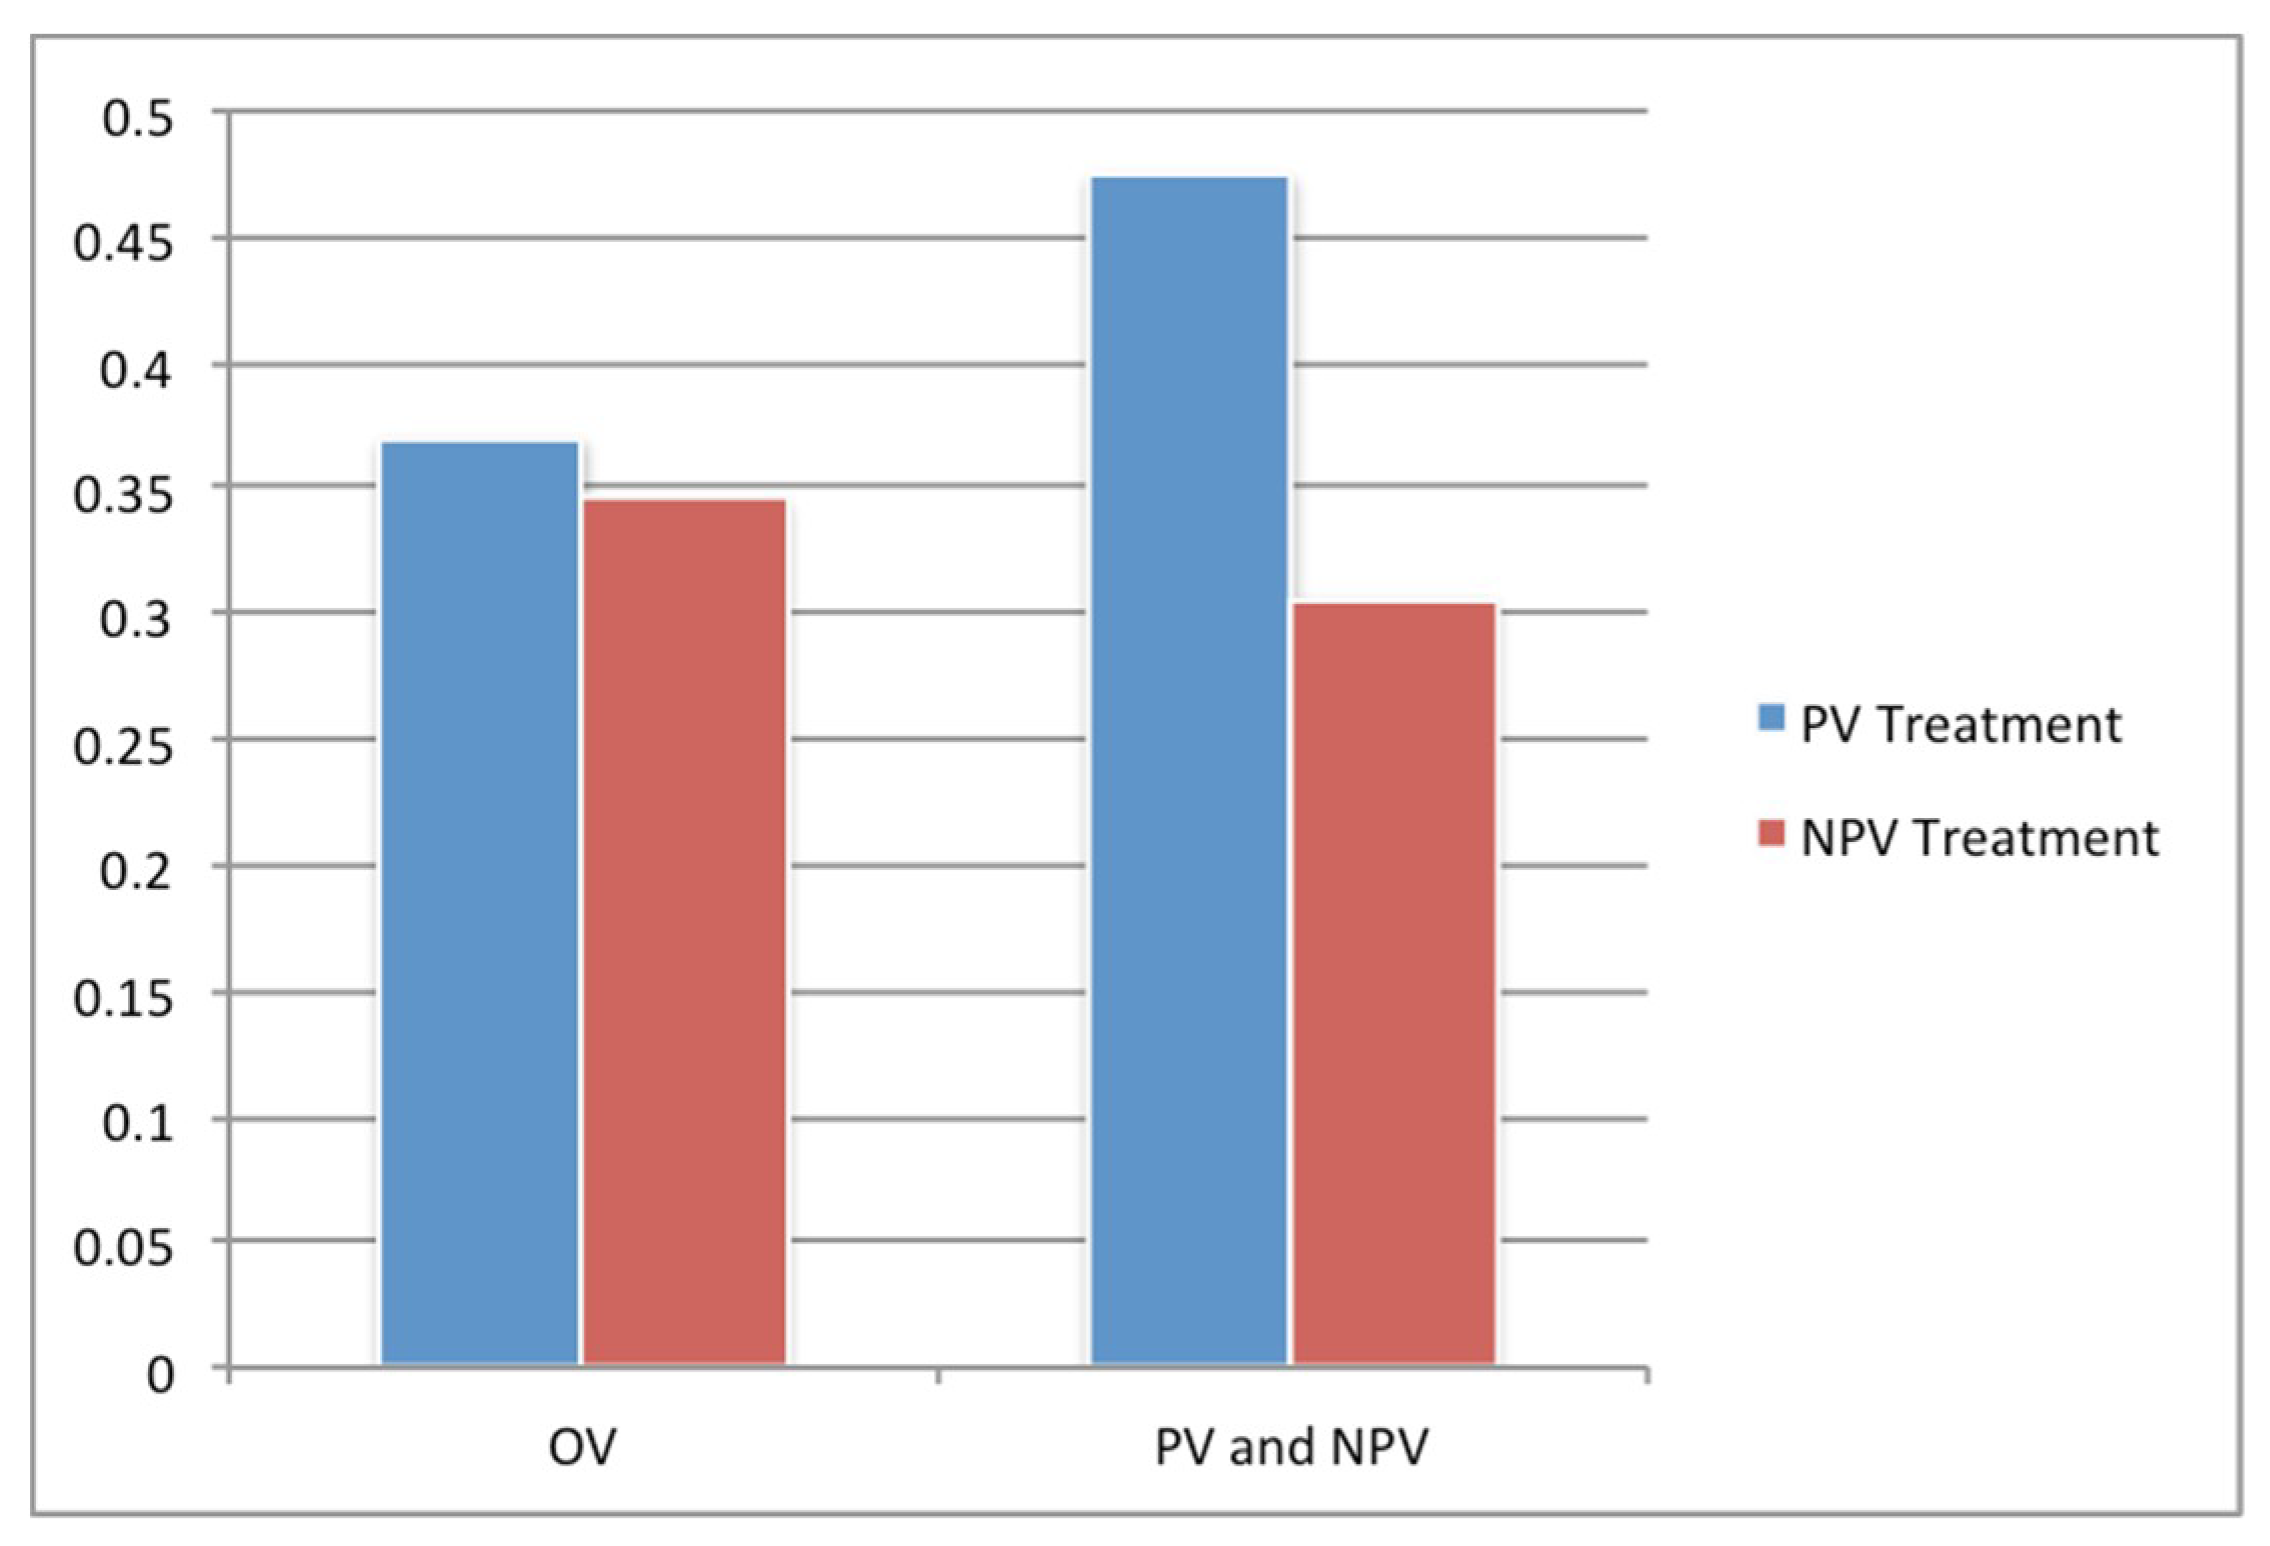
3.3. The Effect of the Asymmetric Voting Power: OV vs. NPV

In this subsection, we check whether Hypotheses B1 and E1 are supported by our data. Contrary to these two hypotheses, we find a five-point decline in voting for Choice A among single-ballot voters in the NPV scheme compared with voters in the OV scheme (0.30 for single-ballot voters in NPV vs. 0.35 in OV) (see Table 3). This difference is statistically significant at the 10% level (p = 0.059; McNemar’s test). Thus, at least, the data confidently reject Hypothesis E1 that predicts the increase in voting for Choice A in NPV. This result indicates that weighted voting procedures do not promote ethical voting among voters in a weak position. We offer some potential reasons for this result in Section 4.
Result 1. 
The frequency of voting for Choice A among single-ballot voters in the NPV scheme is slightly less than that of voters in the OV scheme. Thus, our data reject Hypothesis E1.

3.4. The Effect of the Explanation about the Second Vote: NPV vs. PV

In this subsection, we test whether our data support Hypotheses B2 or E2. While B2 suggests that single-ballot voters in the PV scheme will vote for the future-oriented option more often than single-ballot voters in the NPV scheme will; the reverse relation is suggested by E2.
To perform this analysis, we ran a probit regression consisting of three models (see Table 4). In all models, the PV dummy (i.e., PV = 1 and NPV = 0) serves as the independent variable, and voting behavior (i.e., 1 for Choice A and 0 for Choice B) of the single-ballot voters in the PV and NPV conditions serves as the dependent variable. To account for participants’ inherent preferences for altruism or fairness, we include voters’ choices in the OV scheme and their offer provided in the DG in the regressions as control variables. We also control for the order wherein decisions are made in the voting experiment and the location of the lab (Kochi or Kansai). Models 2 and 3 add other control variables, including demographic factors and decisions made in PD games.
The three models show that single-ballot voters are more likely to vote for the future-oriented option in the PV scheme than in the NPV scheme (Models 1 and 2: p < 0.05; Model 3: p < 0.10). When single-ballot voters are provided with an explanation of the proxy vote, their probability of voting for the future-oriented option increases by 10–12%. These results provide evidence that supports B2, but not E2.
The coefficients associated with variables regarding preference for altruism or fairness in the allocation tasks (Choice in DG and Choice in Sequential PD as the second mover after the first mover chooses cooperation) are also positive and statistically significant. These results indicate that our data are robust across different distributional tasks. The coefficients associated with the other three choices in the prisoner’s dilemma game (i.e., Choice in PD, Choice in Sequential PD as the first mover and Choice in Sequential PD as the second mover after the first mover chooses defection) are not significant. This is reasonable in the sense that the three altruistic or fair choices are affected not only by participants’ altruistic preferences, but by other factors as well (e.g., beliefs about opponents’ choices and negative reciprocity). This is in line with the literature on social psychology, which shows that the prisoner’s dilemma and dictator games measure different elements of an individual’s propensity to behave prosocially [37,38].
Result 2. 
Single-ballot voters in the PV scheme vote for Choice A more frequently than single-ballot voters in the NPV scheme do. Thus, our data support Hypothesis B2, but not E2.
From Results 1 and 2, we find that the predictions from the bandwagon preference model are more consistent with our data than the ones from the expressive preference model.

4. Discussion

We seriously need sustainable choices in various dimensions in order to pass the society and the earth to future generations. However, the current economic, social and political systems tend to be essentially trapped in the shortsighted perspectives. Facing the sustainability crisis, we are in urgent to reconsider the systems surrounding us such as market and democracy [12]. In this study, we performed an experiment to evaluate the effects of introducing a new voting scheme intended to correct intergenerational inequality. Specifically, this study was designed to test whether this new voting scheme maintains the neutrality of voters’ behavior. Our experimental design distinguished two different effects of the proxy-voting scheme on single-ballot voters. We found that, although the asymmetric voting power caused by the proxy vote induced a negative reaction on the part of single-ballot voters, explaining why other voters had two votes mitigated their negative responses.
This result has significant implications for policymakers. It shows that the manner wherein two-ballot voters’ second vote is explained to single-ballot voters is critical to ensure the neutrality of single-ballot voters’ behavior. If single-ballot voters interpret the proxy vote as an undue amplification of two-ballot voters’ interests and opinions, their voting behavior may be reversed to the direction in accordance with the interest of the present generation. In contrast, when single-ballot voters interpret the proxy vote as an inherent right of the people to make decisions for future generations, this negative reaction can be mitigated.
Furthermore, we added evidence for the literature on voting, especially concerning the bandwagon effect and expressive voting. We found that the prediction derived from the former is more consistent with the data than that from the latter. Similar findings are observed in [35] wherein experimental participants voted for approving or disapproving donations. It was hypothesized that expressive voters approved donations more as the probability of being a pivotal player became smaller. However, his experimental data reject the hypothesis derived from the expressive voting model, being more consistent with the bandwagon model prediction, that is, the subjects vote for approving the donation if they expect other voters to do so.
Although the prediction from the bandwagon model is consistent with our experimental data, we can be still beset by misconceptions regarding why single-ballot voters in the NPV scheme move toward a relatively egoistic direction. One possible explanation is the weaker voting power of single-ballot voters relative to two-ballot voters. Prior experimental research has shown that individuals behave in their own self-interest if they have less power than others have. For instance, asymmetric prisoner’s dilemma experiments show that players at a disadvantage tend to defect against group interests more frequently [39,40]. A similar result is observed in asymmetric coordination games [41].
While this paper provides a number of insights, some points should be discussed. First, although our experiment was based on decisions related to resource allocation between the present generation and a future generation similar to [26], we believe that this result is not context-specific. Certainly, using the term “future generation” may have primed altruistic preferences among experimental participants, but this is not problematic because we compare the two treatments using the same framework. In addition, we found that participants’ propensity to vote for a future-oriented alternative positively correlates with the offer amount in a dictator game or the reciprocal cooperation in the sequential prisoner’s dilemma. This suggests that, in this study, future-oriented voting measures one aspect of social preference that experimental economists and social psychologists have studied for decades.
Second, it is important to ensure the robustness and the applicability of our findings by conducting further experiments in the future. For example, a two-person group may be sensitive to one-person adjustments to proxy voters. While the effectiveness of proxy-voting systems for sustainable choice is expected to be strongly dependent on the proportion of proxy voters in the current generation, it is useful to identify boundary conditions of proxy voter effectiveness. In addition, other experimental parameters such as the allocation options and the stake size may affect the experimental results. For instance, the larger the payoff difference between future-oriented options and current options is, the more difficult it is for single-ballot voters to select future-oriented options even under the proxy-voting scheme because the greater bandwagon utility is required to compensate the payoff difference. Future studies in various laboratory environments can confirm the robustness of the current findings.
Regarding the second point, our results may depend on the fact that we used university students as participants because they are sensitive to the needs of the experimenter. The real world is quite different from the laboratory environment [42], and field experiments can bridge the laboratory and the real environment [43]. Thus, we conducted the online voting experiment by using the general public as participants wherein they choose the amount of donation for the future generation via the internet, and we observed that basically the same tendency to the laboratory experiment holds even in the field setting [44].
Finally, we should be careful not to overestimate the experimental results with respect to voting outcomes. Our focus was on the voting behavior of single-ballot voters; however, we did not replicate the current voting standards of our society. To gain further insight into voting outcomes, it would be useful to perform simulation analyses using actual demographic data combined with experimental observations. Such an analysis would be necessary to explore whether and how parents use their proxy votes on behalf of their children, a potentially valuable topic for future research.

Author Contributions

Conceptualization, Y.K. and T.S.; Methodology, Y.K. and Y.H.; Software, T.T.; Validation. Y.K. and T.T.; Formal Analysis, T.T.; Investigation, T.T.; Data Curation, T.T.; Writing—Original Draft Preparation, Y.K.; Writing—Review and Editing, Y.H.; Visualization, Y.K.; Supervision, Y.K. and T.S.; Project Administration, Y.K. and T.S.; Funding Acquisition, Y.K.

Funding

This work was supported by the Japan Society for the Promotion of Science (Grant-in-Aid for Scientific Research [B] 26285047 and [C] 18K01515).

Conflicts of Interest

The authors declare no conflict of interest. The Ethical Review Board of Kochi University of Technology has specifically approved this study. The methods were carried out in accordance with the approved guidelines. Informed consent was obtained from all participants prior to participating the survey.

Appendix A

The following is the instruction used in our experiment.
Thank you for participating in the study. In this manual, I will explain the protocols to be followed for the experiments. If you have any questions, please raise your hand and let us know. Please turn off your mobile phone and refrain from talking until the experiment is completed.
You will use a computer to participate in Experiment 1, Experiment 2 and Experiment 3. The three experiments are independent, and the choices you make in each experiment will not affect your participation in the other experiments. Given that they are not connected, please participate in each experiment with the understanding that they are distinct from one another. None of the responses you provide for any of the experiments will be transmitted to other participants.
The payment you receive for participation will depend on your responses in the three experiments. After the experiment, you will receive the sum of the experiment fee of the three plus the participation fee 1000 yen in cash.
From here, the manual will describe Experiment 1. If you decide to end your participation in the experiment at any time, you will not suffer any consequences.

Appendix A.1. Experiment 1 (PV Treatment)

In this experiment, you will be divided into a group of three participants on your computer. Two of the three will represent the present generation; the remaining one will represent the future generation. Responses in this experiment will relate to how money is distributed between the present and future generations.
Specifically, you will be asked to choose one of two plans for distributing money between the two generations:
Distribution Plan 1: All the three (i.e., the two present generations and the one future generation) receive 500 yen.
Distribution Plan 2: The two present generations receive 600 yen, and the future generation receives 300 yen.
The Distribution Plan to be implemented is determined by the votes of the present generation. The nature of the present generation groups’ voting outcomes can take one of two forms: Voting Rule 1 or Voting Rule 2.
Voting Rule 1: Each of the two present generations has a single vote. Each vote will support either Distribution Plan 1 or Distribution Plan 2. The Distribution Plan that receives more votes will be the plan that is implemented. If the vote is a tie, one of the two distribution plans will be randomly determined via computer lottery.
Voting Rule 2: One of the two present generations has two votes while the other present generation has one vote. For the present generation with two votes, one vote is meant to support the present generation and the other vote is meant to be made on behalf of the future generation. Both voters vote for Distribution Plan 1 or Distribution Plan 2. The Distribution Plan that receives more votes will be the plan that is implemented.
Each participant has a 66.67% chance of being assigned to a present generation, and a 33.33% chance of being assigned to a future generation. There is an equal chance (50%) that either Voting Rule 1 or Voting Rule 2 will be applied to your group. If Voting Rule 2 is selected for your group, you will have an equal chance (50%) of being a two-vote or one-vote voter. Your role and the voting rule will be selected by random lottery. Before the lottery, however, you will respond to all questions posed to you. Because there is no indication as to when (or whether) you will be assigned to the future generation, you will respond to questions related to the following three scenarios:
Scenario 1. 
You represent the present generation and Voting Rule 1 is enacted. In this scenario, you and one other representative of the present generation will have one vote, and are free to vote for Distribution Plan 1 or Distribution Plan 2. Figure A1 provides a visualization of Scenario 1.
Figure A1. Scenario 1.
Sustainability 11 04271 g0a1
Scenario 2. 
You represent the present generation and Voting Rule 2 is enacted. In this scenario, you have one vote with which you can vote for Distribution Plan 1 or Distribution Plan 2. Another representative of the present generation has two votes—one meant for the present generation, and one meant to serve as a proxy for the future generation. Figure A2 provides a visualization of Scenario 2.
Figure A2. Scenario 2.
Sustainability 11 04271 g0a2
Scenarios 1 and 2 are identical in the sense that you have a single vote. However, in Scenario 2, another representative of the present generation has two votes, the second of which is made on behalf of the future generation.
Scenario 3. 
You represent the present generation and Voting Rule 2 is enacted. Unlike in Scenario 2, however, you represent the present generation, but have two votes with which you can vote for Distribution Plan 1 or Distribution Plan 2. Your second vote acts as a proxy vote for the future generation. The other representative of the present generation has only one vote. Figure A3 provides a visualization of Scenario 3.
Figure A3. Scenario 3.
Sustainability 11 04271 g0a3
After providing responses to Scenarios 1–3, your role and voting rules will be confirmed. Then, depending on the answers you and the other participants provided in Scenarios 1–3, we decide which Distribution Plan will be enacted. For example, if you are assigned as the representative of the future generation and Voting Rule 1 is enacted, the Distribution Plan will be determined by the answers provided by the other two participants.
From here, we will describe how you respond to Scenarios 1–3. Although we will describe these scenarios (and how to respond to them) in sequential order, the actual presentation of these scenarios in the experiment will be random.
We omit the explanation of how the experimental participants answer via computer in this translated version of the instruction. Please refer to the original version of the instruction if you have some interest.

Appendix A.2. Experiment 1 (NPV Treatment)

In this experiment, you will be divided into a group of three participants on your computer. Two of the three will represent the present generation; the remaining one will represent the future generation. Responses in this experiment will relate to how money is distributed between the present and future generations.
Specifically, you will be asked to choose one of two plans for distributing money between the two generations:
Distribution Plan 1: All the three (i.e., the two present generations and the one future generation) receive 500 yen
Distribution Plan 2: The two present generations receive 600 yen, and the future generation receives 300 yen
The Distribution Plan to be implemented is determined by the votes of the present generation. The nature of the present generation groups’ voting outcomes can take one of two forms: Voting Rule 1 or Voting Rule 2.
Voting Rule 1: Each of the two present generations has a single vote. Each vote will support either Distribution Plan 1 or Distribution Plan 2. The Distribution Plan that receives more votes will be the plan that is implemented. If the vote is a tie, one of the two distribution plans will be randomly determined via computer lottery.
Voting Rule 2: One of the two present generations has two votes while the other present generation has one vote. The present generation with two votes can use the two votes as s/he likes. Both voters vote for Distribution Plan 1 or Distribution Plan 2. The Distribution Plan that receives more votes will be the plan that is implemented.
Each participant has a 66.67% chance of being assigned to a present generation, and a 33.33% chance of being assigned to a future generation. There is an equal chance (50%) that either Voting Rule 1 or Voting Rule 2 will be applied to your group. If Voting Rule 2 is selected for your group, you will have an equal chance (50%) of being a two-vote or one-vote voter. Your role and the voting rule will be selected by random lottery. Before the lottery, however, you will respond to all questions posed to you. Because there is no indication as to when (or whether) you will be assigned to the future generation, you will respond to questions related to the following three scenarios:
Scenario 1. 
You represent the present generation and Voting Rule 1 is enacted. In this scenario, you and one other representative of the present generation will have one vote, and are free to vote for Distribution Plan 1 or Distribution Plan 2. Figure A4 provides a visualization of Scenario 1.
Figure A4. Scenario 1.
Sustainability 11 04271 g0a4
Scenario 2. 
You represent the present generation and Voting Rule 2 is enacted. In this scenario, you have one vote with which you can vote for Distribution Plan 1 or Distribution Plan 2. Another representative of the present generation has two votes. Figure A5 provides a visualization of Scenario 2.
Figure A5. Scenario 2.
Sustainability 11 04271 g0a5
Scenarios 1 and 2 are identical in the sense that you have a single vote. However, in Scenario 2, another representative of the present generation has two votes.
Scenario 3. 
You represent the present generation and Voting Rule 2 is enacted. Unlike in Scenario 2, however, you represent the present generation, but have two votes with which you can vote for Distribution Plan 1 or Distribution Plan 2. Your second vote acts as a proxy vote for the future generation. The other representative of the present generation has only one vote. Figure A6 provides a visualization of Scenario 3.
Figure A6. Scenario 3.
Sustainability 11 04271 g0a6
After providing responses to Scenarios 1–3, your role and voting rules will be confirmed. Then, depending on the answers you and the other participants provided in Scenarios 1–3, we decide which Distribution Plan will be enacted. For example, if you are assigned as the representative of the future generation and Voting Rule 1 is enacted, the Distribution Plan will be determined by the answers provided by the other two participants.
From here, we will describe how you respond to Scenarios 1–3. Although we will describe these scenarios (and how to respond to them) in sequential order, the actual presentation of these scenarios in the experiment will be random.
We omit the explanation of how the experimental participants answer via computer in this translated version of the instruction. Please refer to the original version of the instruction if you have some interest.

Appendix A.3. Experiment 2

You currently have 1000 yen. You will divide those 1000 yen among you and your opponent. The amount of yen to be distributed to your opponent can be of any amount from 0 yen to 1000 yen, but please indicate the amount to be distributed to your opponent in 100-yen increments (e.g., 400 yen, 600 yen).
Here, we explain how the experiment reward is decided. All participants are assigned the role of “A” or “B”. All participants have a 50% chance of being assigned to role “A” or “B”. The amount you can earn in Experiment 2 will change, depending on the role you are assigned to
(1) When you assume Role “A”
The amount you choose to distribute to your opponent is deducted from your 1000 yen. In this way, you will receive (1000—distributed amount) yen if you assume Role A. For example, if you decided to distribute 200 yen to your opponent, you would receive 800 yen.
(2) When you assume Role “B”
You will receive the amount your opponent decided to distribute to you. You will not know who your opponent is. For example, if your opponent decided to distribute 700 yen to you, you would receive 700 yen.
Please consider how much you would distribute to your opponent if you assume Role A before the computer randomly decides your role and opponent. Your actual role will be announced after all experiments are over.
Now, we turn to how you will respond to the prompts.
We omit the explanation of how the experimental participants answer via computer in this translated version of the instruction. Please refer to the original version of the instruction if you have some interest.

Appendix A.4. Experiment 3

At first, you and your randomly selected opponent have 300 yen each. You will choose to either “pass 200 yen” or “do not pass it” to your opponent. If you choose to pass 200 yen to your opponent, that amount will be doubled to 400 yen and delivered to your opponent. If your opponent chooses to pass 200 yen to you, then you will receive 400 yen.
The amount you will receive in Experiment 3 depends on your answer and your opponent’s answer. As such, there are four possible outcomes:
Outcome 1: Both you and your opponent choose “pass 200 yen”
In the event that you and your opponent choose to pass 200 yen, you will lose 200 of your initial 300 yen, but receive 400 yen from the opponent. In this case:
300 yen (initial amount) − 200 yen (amount passed) + 400 yen (amount passed to you) = 500 yen (final amount received)
In this outcome, your opponent would receive the same amount.
Outcome 2: You select “pass 200 yen” and your opponent selects “do not pass it”
In the event that you pass 200 yen to your opponent, but your opponent does not pass anything to you, you will simply lose 200 yen from your initial amount without receiving any in return. In this case:
300 yen (initial amount) − 200 yen (amount passed) = 100 yen (final amount received)
In this outcome, your opponent would receive 700 yen.
Outcome 3: You select “do not pass it” and your opponent selects “pass 200 yen”
In the event that you do not pass any amount to your opponent, but your opponent passes 200 yen to you, you will receive 400 yen from your opponent to add to your initial 300 yen. In this case:
300 yen (initial amount) + 400 yen (amount passed to you) = 700 yen.
In this outcome, your opponent would receive 100 yen.
Outcome 4: Both you and your opponent select “do not pass it”
In the event that neither you, nor your opponent decide to pass 200 yen, you will both retain your original 300 yen.
The decision to pass 200 yen or not will be made either simultaneously or sequentially (with a 50% chance of either). If the decision is made simultaneously, you and your opponent will make your selections at the same time, meaning you will not know your opponent’s decision. In a sequential decision, you and the opponent will select one after the other (the order of which will be determined randomly with a 50% chance of either). The first player will make a decision that the second player will have knowledge of. With that knowledge, the second player will then make a decision.
Although the order of your decisions will be randomly determined via computer lottery, you will first make decisions in all possible scenarios about whether you will “pass 200 yen” or “do not pass” In particular, you will provide responses to four cases:
(1)
You and your opponent make your decisions simultaneously,
(2)
You and your opponent make your decisions sequentially, with you being the first player,
(3)
You and your opponent make your decisions sequentially, with you being the second player and observing your opponent deciding to “Pass 200 yen”, and
(4)
You and your opponent make your decisions sequentially, with you being the second player and observing your opponent deciding “do not pass it”.
After making your decisions in each of these respective cases, the actual order of decisions (simultaneously or sequentially) and your role (first or second player) will be randomly determined by computer lottery. Rewards provided for Experiment 3 will be determined on the basis of the responses given by you and your opponent.
The next page will describe how you will answer on the computer screen.
We omit the explanation of how the experimental participants answer via computer in this translated version of the instruction. Please refer to the original version of the instruction if you have some interest.

References

  1. Preston, S.H. Children and the elderly: Divergent paths for America’s dependents. Demogr 1984, 21, 435–457. [Google Scholar] [CrossRef]
  2. MacManus, S.A. Taxing and spending: a generational perspective. J. Pol. 1995, 75, 607–629. [Google Scholar] [CrossRef]
  3. Poterba, J.M. Demographic change, intergenerational linkages, and public education. Am. Econ. Rev. 1998, 88, 315–320. [Google Scholar]
  4. McDonald, M.D.; Budge, I. Elections, Parties, Democracy: Conferring the Median Mandate; Oxford University Press: Oxford, UK, 2005. [Google Scholar]
  5. Disney, R. Population ageing and the size of the welfare state: Is there a puzzle to explain? Eur. J. Pol. Econ. 2007, 23, 542–553. [Google Scholar] [CrossRef]
  6. Demeny, P. Pronatalist polices in low-fertility countries: Patterns, performance, and prospects. Popul. Dev. Rev. 1986, 12, 335–358. [Google Scholar] [CrossRef]
  7. Sanderson, W.C.; Scherbov, S. A near electoral majority of pensioners: Prospects and policies. Popul. Dev. Rev. 2007, 33, 543–554. [Google Scholar] [CrossRef]
  8. Aoki, R.; Vaithianathan, R. Is Demeny Voting the Answer to Low Fertility in Japan? Discussion Paper; Center of Intergenerational Studies, Hitotsubashi University: Tokyo, Japan, 2009. [Google Scholar]
  9. Vaithianathan, R.; Aoki, R.; Sbai, E. Support for Franchise Extension for Children: Evidence on Japanese Attitude to Demeny Voting; Technical Report; Hitosubashi University: Tokyo, Japan, 2013; Available online: http://hermes-ir.lib.hit-u.ac.jp/rs/bitstream/10086/26002/1/DP610.pdf (accessed on 2 July 2019).
  10. Corak, M. Public Policies for Equality and Social Mobility in Canada. Background Paper of Canada 2020. Available online: https://kingston.liberal.ca/wp-content/uploads/sites/61/2013/11/policiesequalitymobilityCanada-milesc.pdf (accessed on 2 July 2019).
  11. Thompson, D.F. Representing future generations: Political presentism and democratic trusteeship. Crit. Rev. Int. Soc. Pol. Philos. 2010, 13, 17–37. [Google Scholar] [CrossRef]
  12. Saijo, T. Future Design. In Future of Economic Design: The Continuing Development of a Field as Envisioned by Its Researchers; Laslier, M., Sanver, Z., Eds.; Springer: Berlin, Germany, 2019. [Google Scholar]
  13. Van Parijs, P. The disfranchisement of the elderly, and other attempts to secure intergenerational justice. Philos. Public Aff. 1998, 27, 292–333. [Google Scholar] [CrossRef]
  14. Wolf, S.; Goldschmidt, N.; Petersen, T. Votes on behalf of children: A legitimate way of giving them a voice in politics. Constitut. Pol. Econ. 2015, 26, 356–374. [Google Scholar] [CrossRef]
  15. Brennan, G.; Lomasky, L. Democracy and Decision; Cambridge University Press: Cambridge, UK, 1993. [Google Scholar]
  16. Brennan, G.; Hamlin, A. Expressive voting and electoral equilibrium. Public Choice 1998, 95, 149–175. [Google Scholar] [CrossRef]
  17. Leibenstein, H. Bandwagon, snob, and Veblen effects in the theory of consumers’ demand. Quart. J. Econ. 1950, 64, 183–207. [Google Scholar] [CrossRef]
  18. Zech, C.E. Leibenstein’s bandwagon effect as applied to voting. Public Choice 1975, 21, 117–122. [Google Scholar] [CrossRef]
  19. Montero, M.; Sefton, M.; Zhang, P. Enlargement and the balance of power: An experimental study. Soc. Choice Welf. 2008, 30, 69–87. [Google Scholar] [CrossRef]
  20. Guerci, E.; Hanaki, N.; Watanabe, N.; Esposito, G.; Lu, X. A methodological note on a weighted voting experiment. Soc. Choice Welf. 2014, 43, 827–850. [Google Scholar] [CrossRef] [Green Version]
  21. Feddersen, T.; Gailmard, S.; Sandroni, A. Moral bias in large elections: Theory and experimental evidence. Am. Pol. Sci. Rev. 2009, 103, 175–192. [Google Scholar] [CrossRef]
  22. Shayo, M.; Harel, A. Non-consequentialist voting. J. Econ. Behav. Org. 2012, 81, 299–313. [Google Scholar] [CrossRef] [Green Version]
  23. Kamenica, E.; Brad, L.E. Voters, dictators, and peons: Expressive voting and pivotality. Public Choice 2014, 159, 159–176. [Google Scholar] [CrossRef]
  24. Wildschut, T.; Insko, C.A. Explanations of interindividual-intergroup discontinuity: A review of the evidence. Eur. Rev. Soc. Psych. 2007, 18, 175–211. [Google Scholar] [CrossRef]
  25. Charness, G.; Sutter, M. Groups make better self-interested decisions. J. Econ. Perspect. 2012, 26, 157–176. [Google Scholar] [CrossRef]
  26. Kamijo, Y.; Komiya, A.; Mifune, N.; Saijo, T. Negotiating with the future: Incorporating imaginary future generations into negotiations. Sustain. Sci. 2017, 12, 409–420. [Google Scholar] [CrossRef]
  27. Fehr, E.; Schmidt, K.M. The economics of fairness, reciprocity and altruism—Experimental evidence and new theories. In Handbook of the Economics of Giving, Altruism and Reciprocity; Kolm, S.C., Ythier, J.M., Eds.; Elsevier: Amsterdam, The Netherlands, 2006; Volume 1, pp. 615–694. [Google Scholar]
  28. Riker, W.H.; Ordeshook, P.C. A theory of the calculus of voting. Am. Pol. Sci. Rev. 1968, 62, 25–43. [Google Scholar] [CrossRef]
  29. Brennan, G.; Buchanan, J. Voter choice: Evaluating political alternatives. Am. Behav. Sci. 1984, 28, 185–201. [Google Scholar] [CrossRef]
  30. Scheussler, A.A. A Logic of Expressive Choice; Princeton University Press: Princeton, NJ, USA, 2000. [Google Scholar]
  31. Hillman, A.L. Expressive behavior in economics and politics. Eur. J. Pol. Econ. 2010, 26, 403–418. [Google Scholar] [CrossRef]
  32. Wiese, R.; Jong-A-Pin, R. Expressive voting and political ideology in a laboratory democracy. Eur. J. Pol. Econ. 2017, 50, 54–74. [Google Scholar] [CrossRef] [Green Version]
  33. Robbett, A.; Matthews, H.P. Partisan bias and expressive voting. Eur. J. Pol. Econ. 2018, 157, 107–120. [Google Scholar] [CrossRef]
  34. McAllister, I.; Studlar, D.T. Bandwagon, underdog, or projection? Opinion polls and electoral choice in Britain, 1979–1987. J. Pol. 1991, 53, 720–741. [Google Scholar] [CrossRef]
  35. Tyran, J.R. Voting when money and moral conflict: An experimental test of expressive voting. J. Public Econ. 2004, 88, 1645–1664. [Google Scholar] [CrossRef]
  36. Fischbacher, U. z-Tree: Zurich toolbox for ready-made economic experiments. Exp. Econ. 2007, 10, 171–178. [Google Scholar] [CrossRef] [Green Version]
  37. Bohnet, I.; Frey, B.S. The sounds of silence in prisoner’s dilemma and dictator games. J. Econ. Behav. Org. 1999, 38, 43–57. [Google Scholar] [CrossRef]
  38. Brosig, J. Identifying cooperative behavior: Some experimental results in a prisoner’s dilemma game. J. Econ. Behav. Org. 2002, 47, 275–290. [Google Scholar] [CrossRef]
  39. Steposh, J.P.; Gallo, P.S., Jr. Asymmetry of payoff structure and cooperative behavior in the prisoner’s dilemma game. J. Confl. Resolut. 1973, 17, 321–333. [Google Scholar] [CrossRef]
  40. Beckenkamp, M.; Hennig-Schmidt, H.; Maier-Rigaud, F.P. Cooperation in Symmetric and Asymmetric Prisoner’s Dilemma Games. Available online: https://papers.ssrn.com/sol3/papers.cfm?abstract_id=968942 (accessed on 6 August 2019).
  41. Mifune, N.; Hizen, Y.; Kamijo, Y.; Okano, Y. Preemptive striking in individual and group conflict. PLoS ONE 2016, 11, e0154859. [Google Scholar] [CrossRef]
  42. Levitt, S.D.; List, J.A. What do laboratory experiments measuring social preferences reveal about real world? J. Econ. Perspect. 2007, 21, 153–174. [Google Scholar] [CrossRef]
  43. Falk, A.; Heckman, J.J. Lab experiments are a major source of knowledge in the social sciences. Science 2009, 326, 535–538. [Google Scholar] [CrossRef]
  44. Kamijo, Y.; Tamura, T.; Hizen, Y. Mother’s paradox: Proxy vote for children lowers parents’ altruism for future society. 2019; Manuscript in Preparation. [Google Scholar]
Figure 1. Experimental design.
Sustainability 11 04271 g001
Figure 2. Proportion of votes for Choice A (future-oriented option) by voting schemes and experimental conditions.
Sustainability 11 04271 g002
Table 1. Two distribution plans between present and future generations.
Present Generation 1Present Generation 2Future Generation
Choice A (sustainable or future-oriented option)500 JPY500 JPY500 JPY
Choice B (present-oriented option)600 JPY600 JPY300 JPY
Table 2. Summary of models, predictions, and presumptions.
Frequency of the Future-Oriented Voting (i.e., Voting for Choice A)
Asymmetric Voting PowerProxy Vote
Ordinary Voting (OV) vs. Non-Proxy Voting (NPV)Proxy Voting (PV) vs. NPV
Expressive voting preference modelE1. NPV > OVE2. NPV > PV
Bandwagon preference modelB1. OV = NPVB2. PV > NPV
Presumptions of the predictions
1)
In NPV, the vote splits rarely occur.
2)
In PV, the second vote is cast more for Choice A.
3)
The frequency of the future-oriented voting is less than 50% in all situations except for the second vote in PV.
Table 3. Descriptive statistics.
VariablesPV TreatmentNPV TreatmentPV vs. NPV
MeanStd. Dev.MeanStd. Dev.p-Value
(1) Choice in OV0.370.480.350.480.648
(2) Choice of single-ballot voter in PV and NPV0.380.490.300.460.099 *
(3) Choice of two-ballot voter in PV (self)0.310.47---
(3) Choice of two-ballot voter in PV (proxy-vote)0.730.45---
(3) Choice of two-ballot voter in NPV--0.310.46-
(3) Split vote of two-ballot voter in PV and NPV0.430.500.180.39
Order 1 [(1) ≥ (2) ≥ (3)]0.160.370.160.370.936
Order 2 [(1) ≥ (3) ≥ (2)]0.120.330.180.380.186
Order 3 [(2) ≥ (1) ≥ (3)]0.150.360.110.320.280
Order 4 [(2) ≥ (3) ≥ (1)]0.160.370.140.350.578
Order 5 [(3) ≥ (1) ≥ (2)]0.240.430.260.440.723
Order 6 [(3) ≥ (2) ≥ (1)]0.160.370.160.370.936
Choice in DG185.2216.8184.9211.70.937
Choice in Simultaneous PD0.200.400.180.390.730
Choice in Sequential PD (First)0.300.460.290.450.891
Choice in Sequential PD (Second after C)0.360.480.310.460.344
Choice in Sequential PD (Second after D)0.020.160.010.110.423
Male0.590.490.530.500.350
Location (Take value 1 for Kansai and 0 for Kochi)0.430.500.430.500.884
Note: Significance level: * p < 0.1; we conducted chi-square tests of independence to examine the difference between the PV and the NPV treatments for all variables except “Choice in DG” (range = 0–1000; we performed a non-parametric Mann–Whitney U-test).
Table 4. Results of probit regression analysis of single-ballot voters.
Choice of Single-Ballot Voter in PV and NPVModel 1Model 2Model 3
MEStd. Err.MEStd. Err.MEStd. Err.
PV Dummy0.122 **0.0600.120 **0.0600.103 *0.059
Choice in OV0.655 **0.0500.654 ***0.0500.650 ***0.052
Choice in DG0.0004 ***0.00020.0004 ***0.00020.0003 *0.0002
Choice in PD----0.0970.085
Choice in Sequential PD (First Mover)----−0.0750.072
Choice in Sequential PD (Second Mover after C)----0.242 ***0.077
Choice in Sequential PD (Second Mover after D)----0.1000.131
Control (Orders in voting experiment and Location)Yes Yes Yes
Control (Gender)No Yes Yes
Log Pseudo-likelihood−118.1 −118.1 −111.8
Pseudo R20.426 0.426 0.457
Sample Size321 321 321
Notes: Robust standard errors are used; significance level: *** p < 0.01, ** p < 0.05, * p < 0.1; we estimated marginal effects (ME) in a probit regression model on the probability of single-ballot voters voting for Choice A.

