Article

Impact of Frequency of Visits and Time Spent in Urban Green Space on Subjective Well-Being

1
Department of Forestry and Landscape Architecture, Konkuk University, Gwangjin-gu, Seoul 05029, Korea
2
Department of Ecological Landscape Architecture Design, Kangwon National University, Chuncheon 24341, Korea
3
Graduate Program, Department of Environmental Science, Konkuk University, Gwangjin-gu, Seoul 05029, Korea
*
Author to whom correspondence should be addressed.
Sustainability 2019, 11(15), 4189; https://doi.org/10.3390/su11154189
Submission received: 11 June 2019 / Revised: 20 July 2019 / Accepted: 1 August 2019 / Published: 2 August 2019

Abstract

:
Exposure to green spaces can reduce the negative effects of stress. This study examines how frequency of visits and time spent in urban green spaces (UGS) affect urban dwellers’ subjective well-being. We also investigated the numbers of respondents visiting UGS, their primary motivation, and constraints on their ability to visit. Using quota sampling, an online survey was conducted of 400 residents of Daejeon City, South Korea. ANOVA results indicated no significant interactions between visit frequency and time spent in UGS. Respondents who had visited UGS within the past two weeks expressed higher positive and lower negative emotions than did non-visitors, regardless of visit frequency, and regular visitors showed higher general life satisfaction levels. These positive effects were confirmed by estimated structural equation models. However, the time spent in UGS did not affect emotions or life satisfaction in general. Heavy users mostly visited UGS to walk, and light/non-users cited the lack of urban green spaces near their home as the major constraint on visiting UGS. The estimated structural equation models clearly show positive effects from motivation and negative effects of constraints and access time to UGS on visit frequency. To improve urban dwellers’ subjective well-being, UGS should prioritize good walking environments and accessibility.

1. Introduction

A growing body of evidence strongly indicates that living in vegetated areas in urban environments has various positive effects for urban dwellers, such as improving physical health [1,2,3], decreasing distress [4,5,6], increasing general life satisfaction and happiness [6,7,8], and reducing psychiatric morbidity [4,5,6,9]. In addition, exposure to natural environments alleviates stress [10,11,12,13], improves cognitive performance [14,15,16,17], enhances positive mood [18,19,20], and lowers stress-related illnesses [21]. Social science studies also reported that vegetation can reduce crime, enhance social safety [22,23], increase a sense of attachment [24], improve neighborhood satisfaction [25,26,27,28], and provide opportunities for frequent social interactions [23,29,30,31,32,33], which, in turn, increase community cohesion and improve the mental health of residents because loneliness and a perceived shortage of social support can be mediated by frequent social contacts [23,32,34,35].
These various positive effects of green spaces on urban dwellers’ health and well-being are associated with three mechanisms: attention restoration theory [36,37], stress reduction theory (or psycho-evolutionary theory, PET) [13,38], and biophilia hypothesis [39,40]. The attention restoration theory explains that urban environments are not restorative and require high levels of attention to process the great amount of information (i.e., stress) derived from complex urban systems and that, because of the evolutionary heritage of humans, green spaces can provide an opportunity to rest the brain and replenish depleted resources (e.g., [14,15]). Stress reduction theory suggests that exposure to green spaces is beneficial for restoration through helping stressed urban dwellers recover a relaxed emotional state (e.g., [41,42,43,44]); it can significantly contribute to better health, promote mental well-being, enhance social interactions among urban dwellers (e.g., [23,30,31,32,33,45,46]), and increase physical activities [47,48]. The biophilia hypothesis indicates that humans have effortless emotional and psychological preference for green spaces because humans have evolved in natural environments for thousands of years [36,49,50]. Hartig [51] integrates the attention restoration theory and stress reduction theory—suggesting an “intertwining of the mechanisms”—and finds that the attractiveness and use of open spaces are dependent upon the perceived potential restrictiveness of open spaces [52]. At the same time, the underlying assumption of both the attention restoration theory and stress reduction theory is effortless exposure to green spaces for resting and restoration effects, and all humans can experience similar positive effects from green space regardless of geographic location. In this regard, both attention restoration theory and stress reduction theory can be considered as a part of the biophilia hypothesis. Although emphasis of each mechanism is slightly different, all mechanisms share a common denominator: complex urban environments are not restorative and have adverse psychological and physical effects on urban dwellers, and natural environments can recover depleted states and even enhance positive states in urban dwellers’ minds and bodies. Thus, green spaces, including grass, shrubs, trees, and water are critical for the psychological and physical well-being of urban dwellers.
Among various indicators, well-being has been most widely used to measure the positive effects of green spaces in urban environments. In general, individual well-being is defined as a multi-dimensional concept that includes physical health, psychological and social functioning, and subjective well-being (SWB) [53]. Particularly, SWB is an abstract measure of individual well-being [53] and a key concept to quantify well-being in psychological studies [54,55]. In general, SWB refers to “how people experience and evaluate their lives and specific domains and activities in their lives” [56] and has two aspects: hedonic (emotional) aspect and eudaimonic (cognitive) aspect [53,55]. The hedonic approach defines happy individuals as those who experience positive emotions more frequently than they do negative emotions [57,58,59]. According to this perspective, frequent visits to urban green spaces (UGS) can reduce the frequency of negative emotions and increase the opportunity for positive emotions, leading to a feeling of happiness in daily life. Interestingly enough, happiness is related to greater success in various life dimensions, such as marriage, work, community involvement, money, mental health, physical health, and longevity [58]. From this viewpoint, the success–happiness connection is not one directional, rather, it should be understood as a reciprocal relationship. It is widely acknowledged that urban dwellers actively seek activities to sustain increased levels of well-being [60], and small frequent pleasures (e.g., visiting UGS) in daily life have cumulative significant impacts on SWB [61].
There are three basic components of SWB, which are positive affect, negative affect, and life satisfaction in general. Positive affect and negative affect represent the emotional aspects of SWB, whereas life satisfaction in general represents the cognitive aspect of SWB [55,57]. Often, positive affect has been shown to be associated with the experience of pleasant (i.e., positive) emotions and negative affect with unpleasant (i.e., negative) emotions [62,63,64]. Clark and Watson [62] reported that low positive affect and high negative affect are closely tied with depression and anxiety. Meanwhile, life satisfaction in general refers to a subjective global self-assessment of an individual’s quality of life according to his/her chosen criteria [65]. SWB is often identified as “happiness,” and it can considerably contribute to one’s health and longevity [53,66]. In this context, one becomes happier in terms of satisfying one’s own life (i.e., life satisfaction in general) and experiences more positive affect and less (or an absence of) negative affect. These three components (i.e., positive affect, negative affect, and life satisfaction in general) are closely correlated to each other, but they should be measured separately to understand the comprehensive aspects of one’s SWB [67,68,69]. According to the bottom-up theory of life satisfaction, life satisfaction is influenced by satisfaction with a number of core life domains, such as health, leisure, family, and social life, and each satisfaction can be influenced by lower levels of life concerns within the domain [70]. Hence, positive experiences in UGS can improve life satisfaction through satisfaction in the leisure domain [71,72,73]. Numerous prior studies have shown that visiting UGS can increase satisfaction not only in the leisure domain but also in other domains, such as mental health (e.g., [4,5,6,9,72]), physical health (e.g., [1,2,3,74]), social life (e.g., [23,29,30,31,32,33,34,35,75,76,77,78,79,80]), and family [58,81,82]. Prior studies strongly suggest that UGS is critical infrastructure for sustaining the well-being of urban residents and that expanding UGS and management are valuable investments on individual, social, and national levels.
Previous studies have reported that the SWB of urban dwellers can be greatly enhanced by exposure to natural environments, and the positive effects of natural environments on SWB can be influenced by various personal and cultural factors, such as age, gender, socioeconomic status, race, personal preference, personality traits, and past experiences [16,83,84,85,86,87,88]. Despite the rich evidence supporting the positive effects of green space on urban dwellers’ SWB, these effects can be significantly influenced by many personal, socio-cultural, and spatiotemporal factors, which makes the relationship a complex entity. Thus, the true nature of the relationships between natural environments and SWB, as well as the effects of various factors, is not fully understood.
From the perspective of urban dwellers’ well-being, demand for urban green space (UGS) has been continuously increasing globally. The majority of the population in developed countries resides in urban areas where access to natural environments is limited [21,89,90]. According to numerous studies, urban dwellers have been experiencing more serious psychiatric disorders such as depression, psychosis, and anxiety disorders than people living in rural or natural areas (e.g., [91,92,93,94]). SWB is a critical modern public health issue with continuing urbanization worldwide [55,90,92] because SWB is closely tied with psychological and physical health on individual, community, and societal levels. Particularly, it is an urgent issue for highly urbanized regions and countries. For example, in Korea, where approximately 90% of the population resides in urbanized areas, the Korean government and local authorities have been continuously trying to provide more urban green spaces for years to meet the increasing demand [95,96,97].
Despite numerous previous studies that investigated the influences of various factors on the relationship between UGS and SWB, our understanding of the complex nature of mediating effects is not clear enough. According to the broaden-and-build theory [98], experiencing positive emotions can expand one’s awareness and encourage exploratory behaviors. One’s behavioral skills increase, and life can be enhanced through implementing these additional resources over time, resulting in enhanced emotional well-being in a virtuous cycle. Similarly, hedonic contingent models argue that an individual with an enhanced level of well-being more actively seeks out activities to sustain the enhanced level of well-being, since hedonic rewards are more dependent on hedonic consequences in happy states rather than sad states [60]. Both the broaden-and-build theory and hedonic contingent models emphasize that the prior experience of positive emotion impacts people’s tendency to proactively seek out activities to sustain enhanced well-being.
The main purpose of this study was to investigate the effects of visit frequency and time spent in UGS on positive/negative affect and life satisfaction in general; these are fundamental components of urban dwellers’ SWB, and estimations of these effects were inconsistent across previous studies. On the basis of the broaden-and-build theory and hedonic contingent models, we hypothesized that frequent visits and more time spent in UGS can enhance urban dwellers’ SWB (i.e., high levels of positive affect and life satisfaction in general, and low level of negative affect). The second purpose of the study was to identify the main motivations for and constraints on visiting UGS. In the constraint-effect-mitigation model (CEM, [99]), motivations and constraints play critical roles in determining whether to participate in leisure activities, including visiting UGS, and are therefore important factors for planners and policy-makers in enhancing the subjective well-being of urban residents. Lastly, we estimated two structural equation models (SEMs) for affect and life satisfaction by integrating sociodemographic characteristics, the frequency of visiting UGS, motivation, constraints, and access time from home to UGS. By estimating SEMs, it was possible to identify the relative contributions of motivation, constraints with holding other covariates.

2. Materials and Methods

2.1. Study Area

The study was conducted in 2017 in the city of Daejeon in South Korea. As a major city, Daejeon is approximately 539,919 km2 and has a population of 1.5 million. Daejeon is located in the center of the country and therefore it is the hub of national transportation systems including railroads and highways. The annual temperature and precipitation are 13.0 °C and 1458 mm, respectively. Daejeon experiences great seasonal variations in monthly average temperatures ranging from −1 °C in January to 25.6 °C in August [100], which may affect people’s use of green spaces. About 55.4% (299.3 km2) of the city is designated as green spaces, including urban natural forests, neighborhood parks, pocket parks, and children’s parks, which is higher than any other major city in the country. Daejeon is surrounded by a number of densely forested mountains and shares a boundary with the Dae-Chung dam (64.3 km2 surface areas) at its northeast border. The land use/land cover (LULC) map of Daejeon shows the typical spatial distribution pattern of large cities in South Korea: intensified developed areas in the center, a mixture of natural and developed areas outside of the city center, and areas with more vegetation along the city’s borders, with the exception of the northern part of the city (Figure 1).

2.2. Sampling and Survey

An online survey of 400 Daejeon residents was conducted by a polling agency between 31 July and 13 August 2017. We provided sampling quotas, basic definitions of subjective well-being and urban green space, and scales of positive affect, negative affect, and life satisfaction. Prior to the main survey, the polling agency conducted a pilot test to ensure the quality of the questionnaire, using a small number of randomly selected respondents. Using quota sampling by age (from 20 to 59 years old) and gender, the assigned quota for each age group was 97 for 20–29 years, 97 for 30–39 years, 110 for 40–49 years, and 96 for 50–59 years. The quota for gender groups was the same for male (50%) and female (50%) respondents (Table 1).

2.3. UGS

According to the Forest Resources Establishment and Management Act in Korea, UGS refers to “planted and managed forests or trees in urbanized areas for enhancing urban dwellers’ health, recreation opportunity, resting, and emotional integrity.” On the basis of this definition, UGS may include almost all vegetated spaces in urban areas, such as urban parks, street trees, green walls, and amusement parks, which is too broad for urban dwellers. For these reasons, the Korean Forest Service restricted the definition of UGS to “easily accessible UGS in daily life with minimal time and financial costs” [96]. We adopted this definition of UGS for this study because it places more emphasis on UGS in living areas (neighborhoods) and excludes high mountainous forests or large recreational forests that are located far from respondents’ homes.

2.4. Measuring Positive Affect, Negative Affect, and Life Satisfaction in General

To understand SWB, we measured positive affect, negative affect, and life satisfaction in general. The Scale of Positive and Negative Experience (SPANE) [101] was used to measure respondents’ positive affect (SPANE-P) and negative affect (SPANE-N). SPANE was developed by Diener et al. [101] to assess a broad range of emotions by asking respondents to recall activities and experiences in UGS over the past four weeks through 12 questions (six questions for positive affect and six questions for negative affect), with answer options on a five-point Likert scale. Of the six questions for positive affect and negative affect, three items address emotional experiences in general (e.g., positive affect or negative affect), and the other three items ask about specific emotional experiences, such as “joyful” and “sad,” during the past four weeks. The reliability and validity of SPANE has been examined in a number of studies (e.g., [71,101,102,103]), and various time frames (e.g., yesterday, past week, past two weeks, or in general) have been used to measure positive affect and negative affect in association with SWB (e.g., [54,71,102,103]). Thus, the time frame is not fixed when using SPANE, and we chose the past two weeks as the time frame for the survey to minimize the possible adverse effects due to respondents’ memory. This time frame has previously been used effectively in a similar study in Korea (e.g., [71]).
Life satisfaction in general was assessed with the Satisfaction with Life Scale (SWLS), which contains five items with answer responses on a seven-point Likert scale [104]. Since every person assesses his/her own life in different ways, a definition that reflects an individual’s perspectives is required. SWLS has shown to be an effective measure of an individual’s life satisfaction in general by allowing the integration of an individual’s perspectives on life satisfaction. A number of previous studies have demonstrated the reliability and validity of this scale, and it has been widely implemented with a broad range of age groups and areas of study (e.g., [69,71,105,106,107,108,109]).
In the literature, SWB has been shown to be more strongly associated with the frequency and duration of an individuals’ positive feelings, not with the intensity of those feelings [101]. Thus, it was rationalized that one’s affective well-being is determined by the frequency of experiencing positive affect and negative affect, not by the intensity of those experiences. In light of this, we surveyed the frequency of visits and time spent in UGS in relation to positive affect, negative affect, and life satisfaction in general.

2.5. Conceptualized Effects of Motivations and Constraints

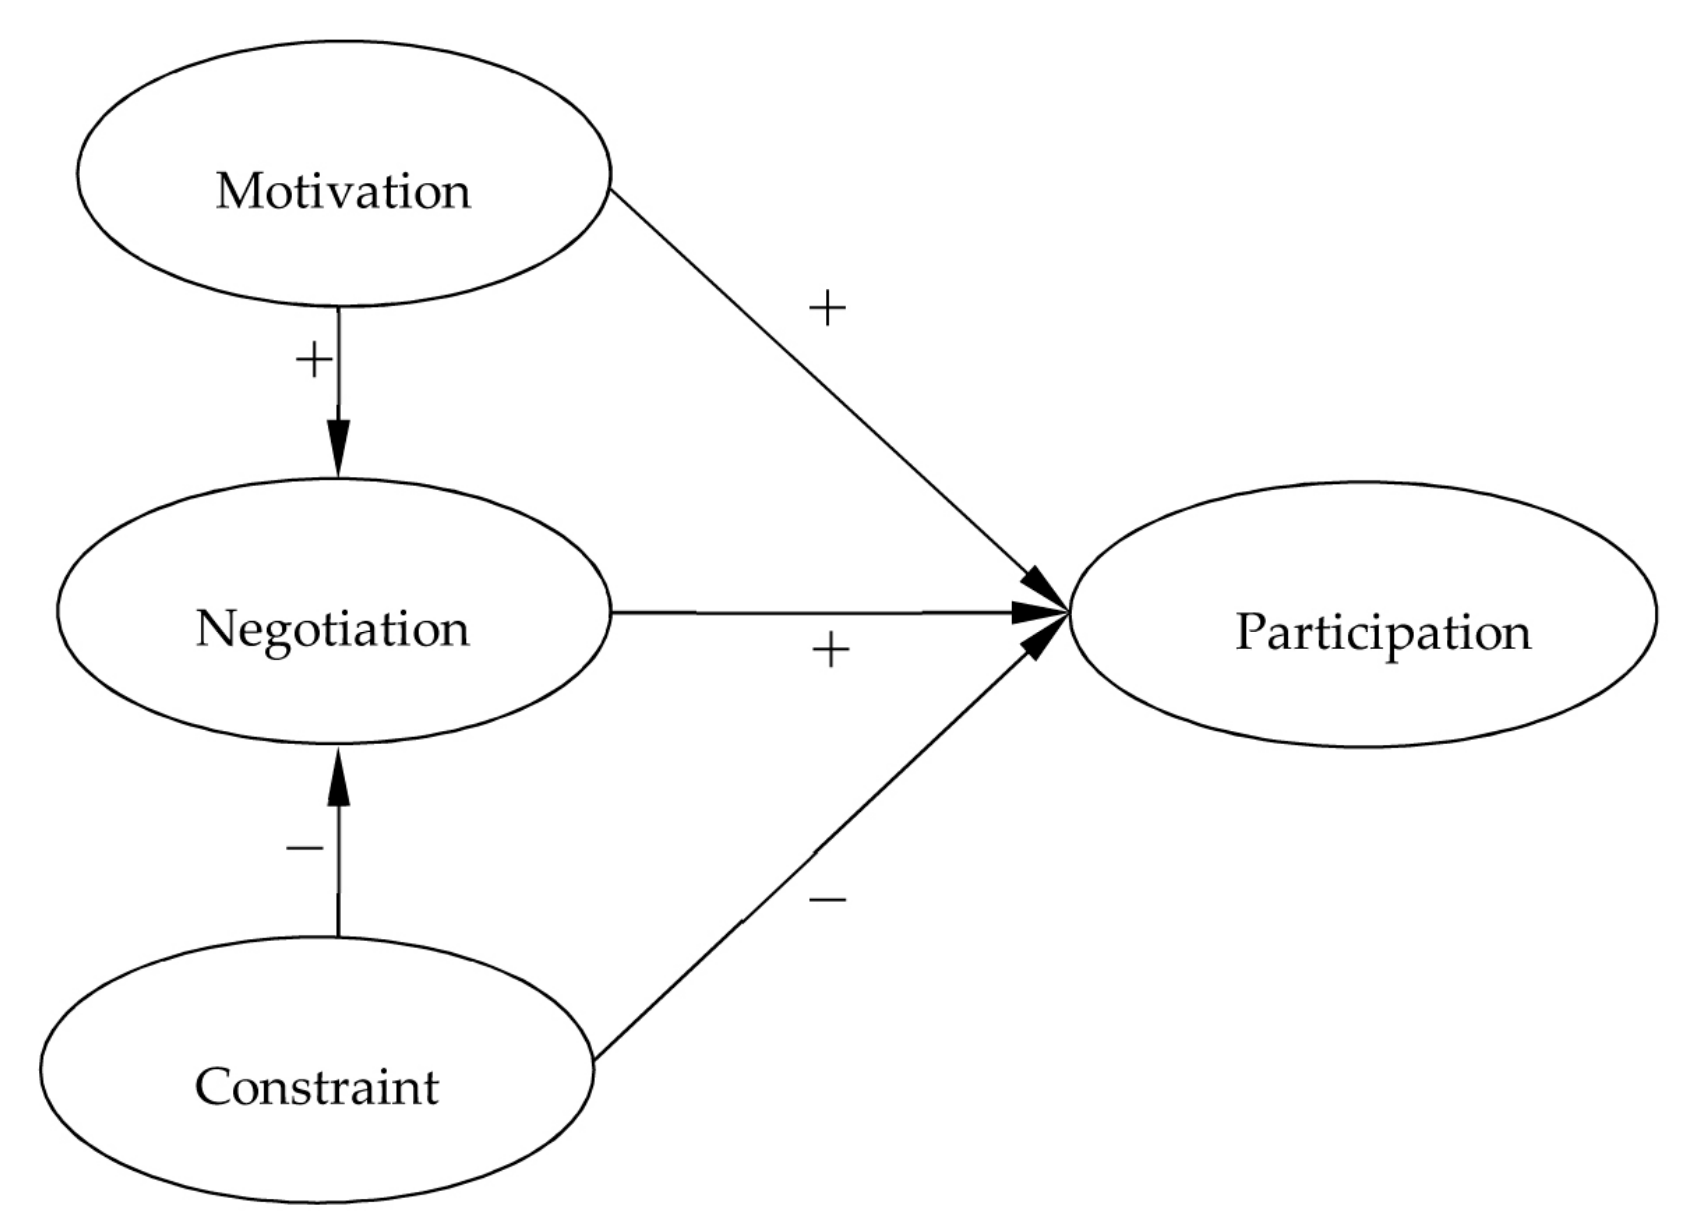
According to the constraint-effect-mitigation model (CEM) proposed in leisure and recreation, “motivation” and “constraint” are determinants for one’s participation in certain activities (e.g., visiting an urban forest). In the CEM model, motivation and constraint directly impact participation, as well as indirectly impact participation through the “negotiation” process based on one’s previously structured value system [99] (Figure 2). The outcome (i.e., visiting or not visiting UGS) of the negotiation process is largely determined by the relative strength of, and interactions between, motivation and constraint factors [110]. The constraint factors negatively affect visiting UGS. However, the constraint factors can be overcome through negotiation if the motivation factors to visit UGS are strong enough. In our study, motivation was defined as the desire to enhance positive affect, to lower negative affect, and to increase life satisfaction by visiting UGS (e.g., [111]). At the same time, constraints were factors that inhibit visiting UGS or limit satisfaction (e.g., [112]), and negotiation was conceptualized as a variety of tactics and resources that attenuate the negative influences of constraints on visiting UGS (e.g., [113]).

2.6. Estimating Structural Equation Models

We integrated sociodemographic characteristics (e.g., gender, age, presence of children, marital status, education levels, and monthly income levels) and access time to UGS to quantify the relative contributions of motivations and constraints on visit frequency and amount of time spent in UGS. It was hypothesized that sociodemographic variables, access time to UGS, motivation, and constraint affected visit frequency and the amount of time spent in UGS, and that positive affect, negative affect, and life satisfaction were affected by visit frequency and time spent in UGS. The fact that we estimated SEM as a confirmative tool to verify the study results is significant. Two separate models for affect and life satisfaction were estimated using AMOS for SPSS (IBM Statistics Version 25) with the same explanatory variables (i.e., sociodemographic variables, access time to UGS, motivation, and constraints). We used the UGS visit frequency within the previous two weeks for the affect model and the usual use of UGS for the life satisfaction model.

3. Results

3.1. Validity and Reliability Test of Measurements

A principal component factor analysis with a varimax rotation was conducted to examine the validity of surveyed SPANE and SWLS. Two factors (i.e., positive affect and negative affect) from SPANE and a single factor (i.e., life satisfaction in general) from SWLS were extracted from the factor analysis. All of Cronbach’s α values of loaded variables of positive affect, negative affect, and life satisfaction in general were greater than 0.7, indicating an acceptable level of reliability [114]. Percentage of variance explained by each factor for positive affect, negative affect, and life satisfaction in general was 32.29%, 31.17%, and 73.89%, respectively (Table 2).

3.2. Measuring Frequency of Visits and Time Spent in UGS

All variables were collected for the past two weeks and usual use. In cases of the past two weeks, the most common frequency reported was visiting 1–2 times per week (95 respondents, 23.8%). The percentage of respondents who did not visit an UGS in the past two weeks was considerably higher (47.5%) than cases of usual use (9.8%) because a week of surveying time overlapped with the rainy season. However, respondents visited UGS more frequently after the rainy season ended. For a particular timeframe, the percentage of weekly visitors (more than once per week) within the past two weeks was greater than the percentage for usual use. Approximately 47.1% of respondents spent 1–2 h in UGS, and the second most common frequency reported was less than 1 h (28.6%).
In usual use cases, 123 respondents reported that they visited UGS 1–3 times per month, which was the most common group (30.8%), and the second most common group reported visits at least once per year (110 respondents, 27.5%). The combination of these two groups consisted of more than 50% of the respondents, suggesting that UGS is an important leisure destination for Daejeon residents. Regarding time spent in the UGS, approximately 45% of respondents reported that they spent 1–2 h per visit. Only 24 respondents (6.7%) spent more than 3 h in UGS, suggesting that most residents in the study area spent less than 3 h in UGS (Table 3).

3.3. Segmentation by Frequency and Time Spent

To test SWB caused by frequency of visits and time spent in UGS, respondents were classified into three groups for both positive affect/negative affect and life satisfaction in general. Since there are no known objective criteria in the literature, classification was decided on the basis of respondents’ distributions. Due to the high temporal and short-term stability of emotional experience (i.e., positive affect and negative affect), we classified respondents who visited UGS more than once per week within the past two weeks as the “heavy user group” (Hgroup, 131 respondents). The “moderate user group” (Mgroup, 79 respondents) consisted of respondents who visited UGS once within the past two weeks, and respondents who did not visit UGS in the past two weeks were classified as the “non-user group” (Ngroup, 190 respondents). Similarly, respondents were also classified into the “long-stay group” (more than 2 h per visit, 51 respondents), “medium-stay group” (1–2 h per visit, 99 respondents), and “short-stay group” (less than 1 h per visit, 60 respondents) based on the average time they spent in UGS per visit. The Ngroup (190 respondents) was excluded from the classification based on time spent because it is not possible to examine the effects of time spent in UGS on positive affect, negative affect, and life satisfaction in general for non-visitors (Table 4).
As for usual use of UGS, we classified respondents into three groups: “heavy user group” (Hgroup, more than once per week), “moderate user group” (Mgroup, 1–3 times per month), and “light/non-user group” (LNgroup, 1–3 times per year or no visits). The number of respondents classified as Hgroup, Mgroup, and LNgroup was 110 (27.5%), 123 (30.8%), and 167 (41.8%), respectively. Respondents were also classified into three groups based on average time spent in UGS. The groups were “long stay group” (more than 2 h per visit, 108 respondents), “medium-stay group” (1–3 h per visit), and “short-stay group” (less than 1 h, 91 respondents). However, 39 respondents who reported no visits were excluded from this classification (Table 4).

3.4. Effects of the Frequency of Visits and Time Spent in UGS on SWB

Prior to examining the effects of visiting UGS, we tested for the possible existence of interaction effects between the frequency of visits and time spent in UGS. An analysis of variance (ANOVA) was conducted for positive affect and negative affect experienced in the past two weeks with interaction effects. The results indicated that there were no interaction effects between frequency of visits and time spent in UGS on positive affect and negative affect. Also, no interaction effects were observed between frequency of visits and time spent on life satisfaction in general. Specifically, the F-statistic of interaction effects for positive affect, negative affect, and life satisfaction in general was 1.3, 0.37, and 0.37, respectively, and none of them were significant (>0.05), indicating the absence of interaction effects between frequency of visits and time spent in UGS (Table 5).
Additional ANOVAs were conducted for positive affect, negative affect, and life satisfaction in general without interaction effects of two independent variables in order to detect whether there were differences in group means. The F-statistic of frequency of visits for positive affect, negative affect, and life satisfaction in general was 15.11, 11.68, and 4.7, respectively, and their p-values were less than 0.01 (Table 6). The results of the F-test indicated that there were significant group mean differences for positive affect and negative affect based on the frequency of visits to UGS within the past two weeks. However, there were no significant differences in the distributions of positive affect and negative affect based on the amount of time spent in UGS. Similarly, the distribution of life satisfaction in general was significantly different based on the frequency of visits to UGS for usual users; however, there was no significant difference for life satisfaction in general based on the amount of time spent in UGS. In sum, it was evident that variances of positive affect, negative affect, and life satisfaction in general of the respondents were significantly related to the frequency of visits to UGS.
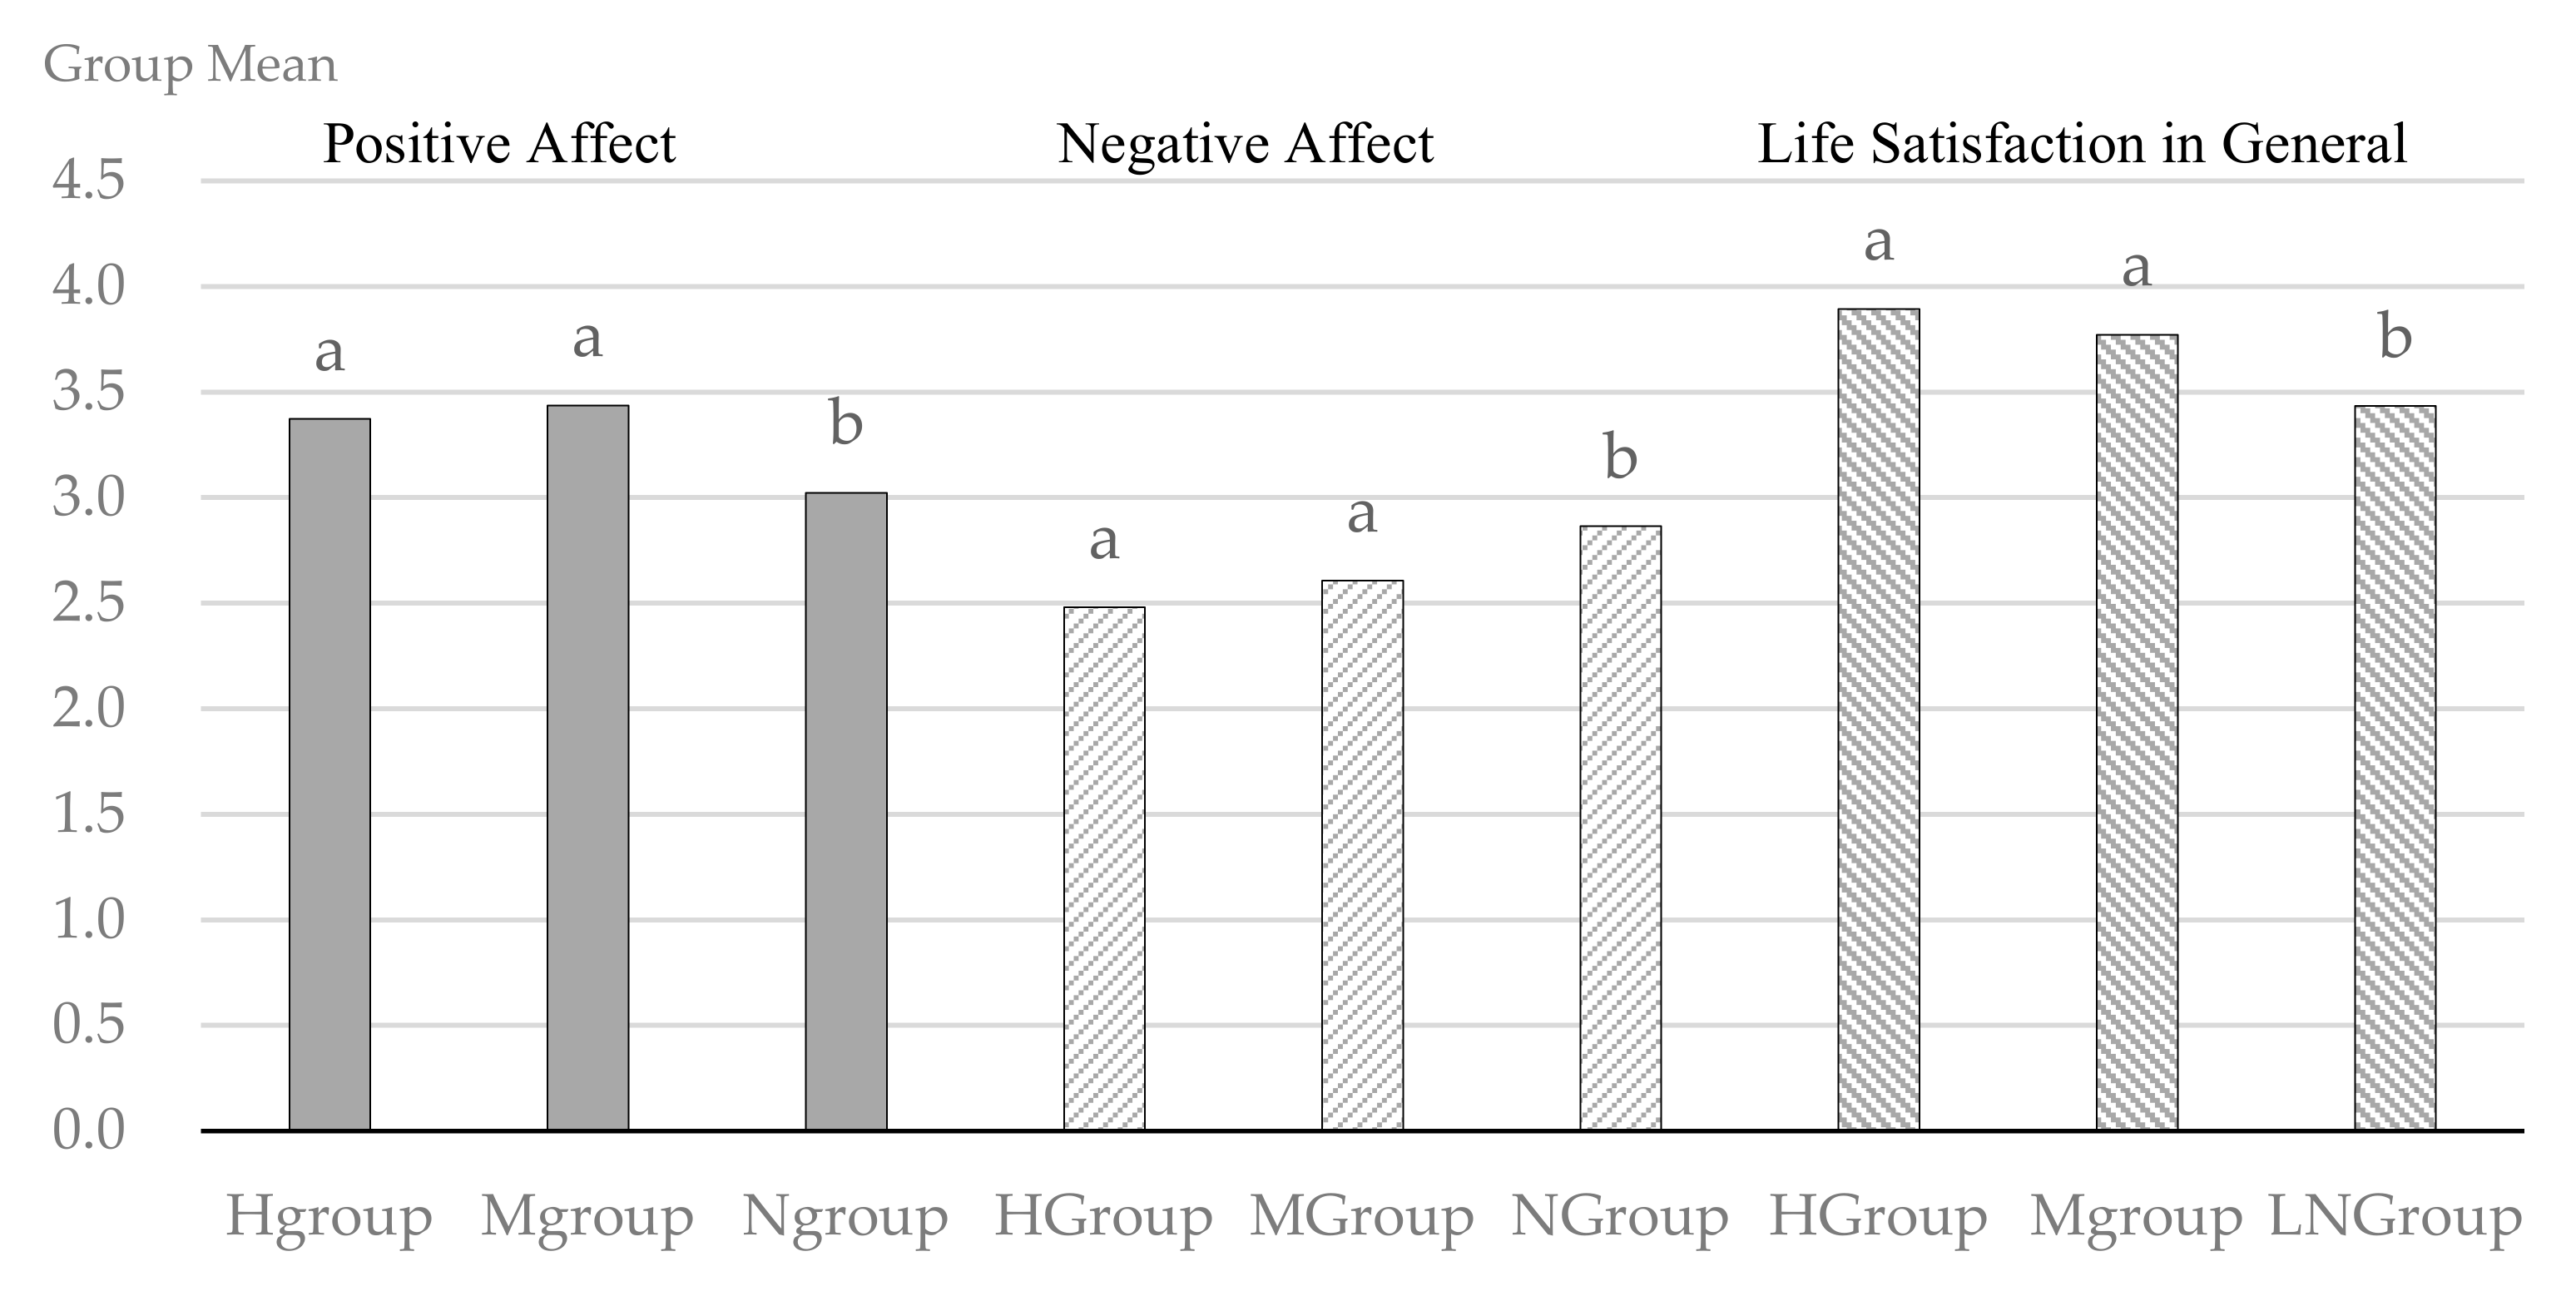
Multiple comparison tests (i.e., Duncan test) were used to determine whether there were differences in the means of positive affect and negative affect among groups classified by the frequency of visits within the past two weeks (Figure 3). The results indicated that there was a significant difference in the means of positive affect between the user groups (i.e., Hgroup and Mgroup) and non-user group (Ngroup). Specifically, the mean positive affect of both the Hgroup (m = 3.3741) and the Mgroup (m = 3.4367) was significantly higher than the mean positive affect of the Ngroup (m = 3.0535). However, we did not observe a significant difference in mean positive affect between the two user groups (i.e., Hgroup and Mgroup). Thus, respondents who visited UGS within the past two weeks had higher levels of positive affect. In contrast, the mean negative affect of both the Hgroup (m = 2.4809) and the Mgroup (m = 2.6047) was significantly lower than the mean negative affect of the Ngroup (m = 2.8649). Thus, the results of the Duncan test showed that respondents who visited UGS at least once within the past two weeks experienced considerably lower negative affect than those who did not. However, there was no significant difference in the means of negative affect between the two user groups (i.e., Hgroup and Mgroup), despite that the Hgroup had a slightly lower mean of negative affect than the Mgroup.
In sum, the user groups in the short-term (i.e., past two weeks) had a significantly higher mean positive affect and lower mean negative affect than the non-user group, regardless of the frequency of visits. Our results emphasize the importance of regular visits to UGS for sustaining positive affect and retaining low levels of negative emotions. Respondents in the Hgroup and Mgroup were likely to experience positive emotions more frequently by visiting UGS than respondents in the Ngroup, and negative emotions of respondents in the Hgroup and Mgroup can be mediated by more frequently experiencing positive emotions. Our study results indicated that this mediation effect is unlikely to occur for respondents in the Ngroup. Another important aspect of the results is the recreational needs of urban dwellers; the recreational demands of respondents in the Hgroup and Mgroup could be additionally satisfied by visiting UGS. However, respondents in the non-user group did not have an opportunity to fulfill their recreational demands in UGS, resulting in a low level of positive affect and high level of negative affect.
Regarding life satisfaction in general, respondents were classified into three groups: heavy user group (Hgroup, visit 1 or more times per week), moderate user group (Mgroup, visit 1–3 times per month), and light/non-user group (LNgroup, visit 1–3 times per year or no visits) (see Table 4). A Duncan test was also conducted to detect the means of life satisfaction in general for those three groups. User groups (i.e., Hgroup and Mgroup) had a significantly higher mean life satisfaction in general than the LNgroup (m = 3.4335). The Hgroup (m = 3.8927) had a slightly higher mean life satisfaction in general than the Mgroup (m = 3.7707), but the difference was not significant (Figure 3).

3.5. Motivation and Constraint

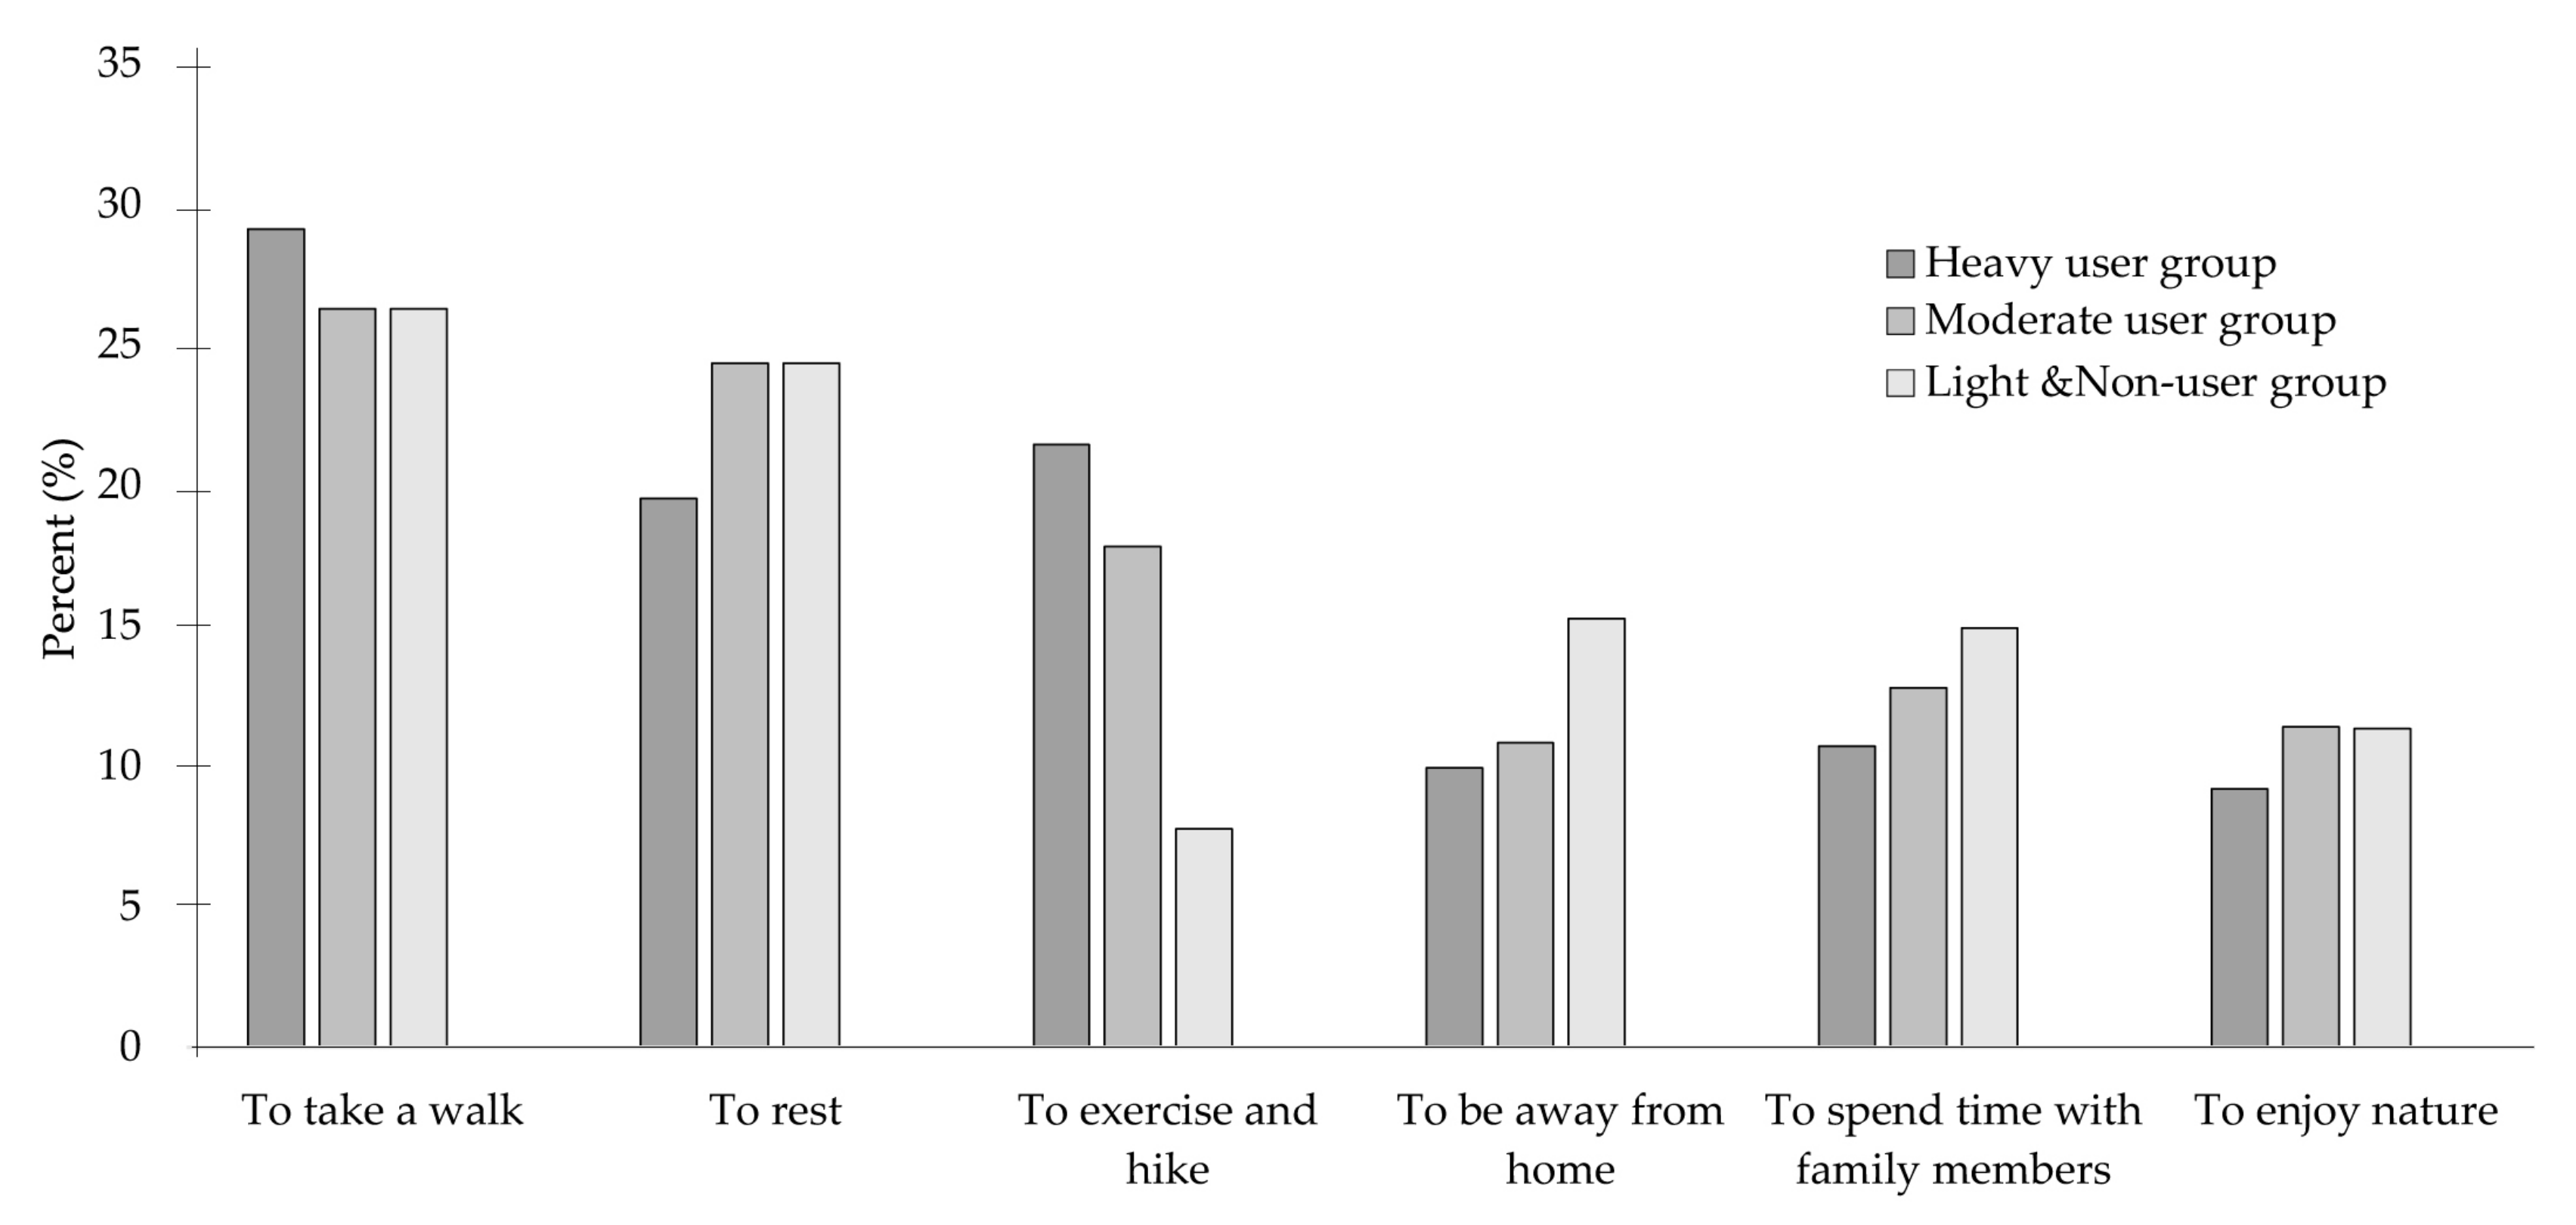
In our study, we assessed various motivations for visiting UGS using multiple response options in the survey, such as “to take a walk,” “to rest,” “to exercise and hike,” “to be away from home,” “to spend time with family members,” and “to enjoy nature” (Figure 4). We found that user groups (i.e., Hgroup and Mgroup) were more motivated by “to exercise and hike” than the LNgroup. Considering that health has been recognized as one of the most important life domains [115,116] and that the study area is a densely urbanized environment with a lack of space for exercising, the higher SWB of user groups than the LNgroup can be explained by the satisfaction of the health motivation of visitors to UGS. Compared to user groups, respondents in the LNgroup reported higher motivations “to rest,” “to be away from home,” and “to spend time with family members.” The Hgroup’s major motivations for visiting UGS were “to take a walk” and “to exercise and hike,” while the Mgroup’s primary motivations were “to take a walk” and “to rest.”
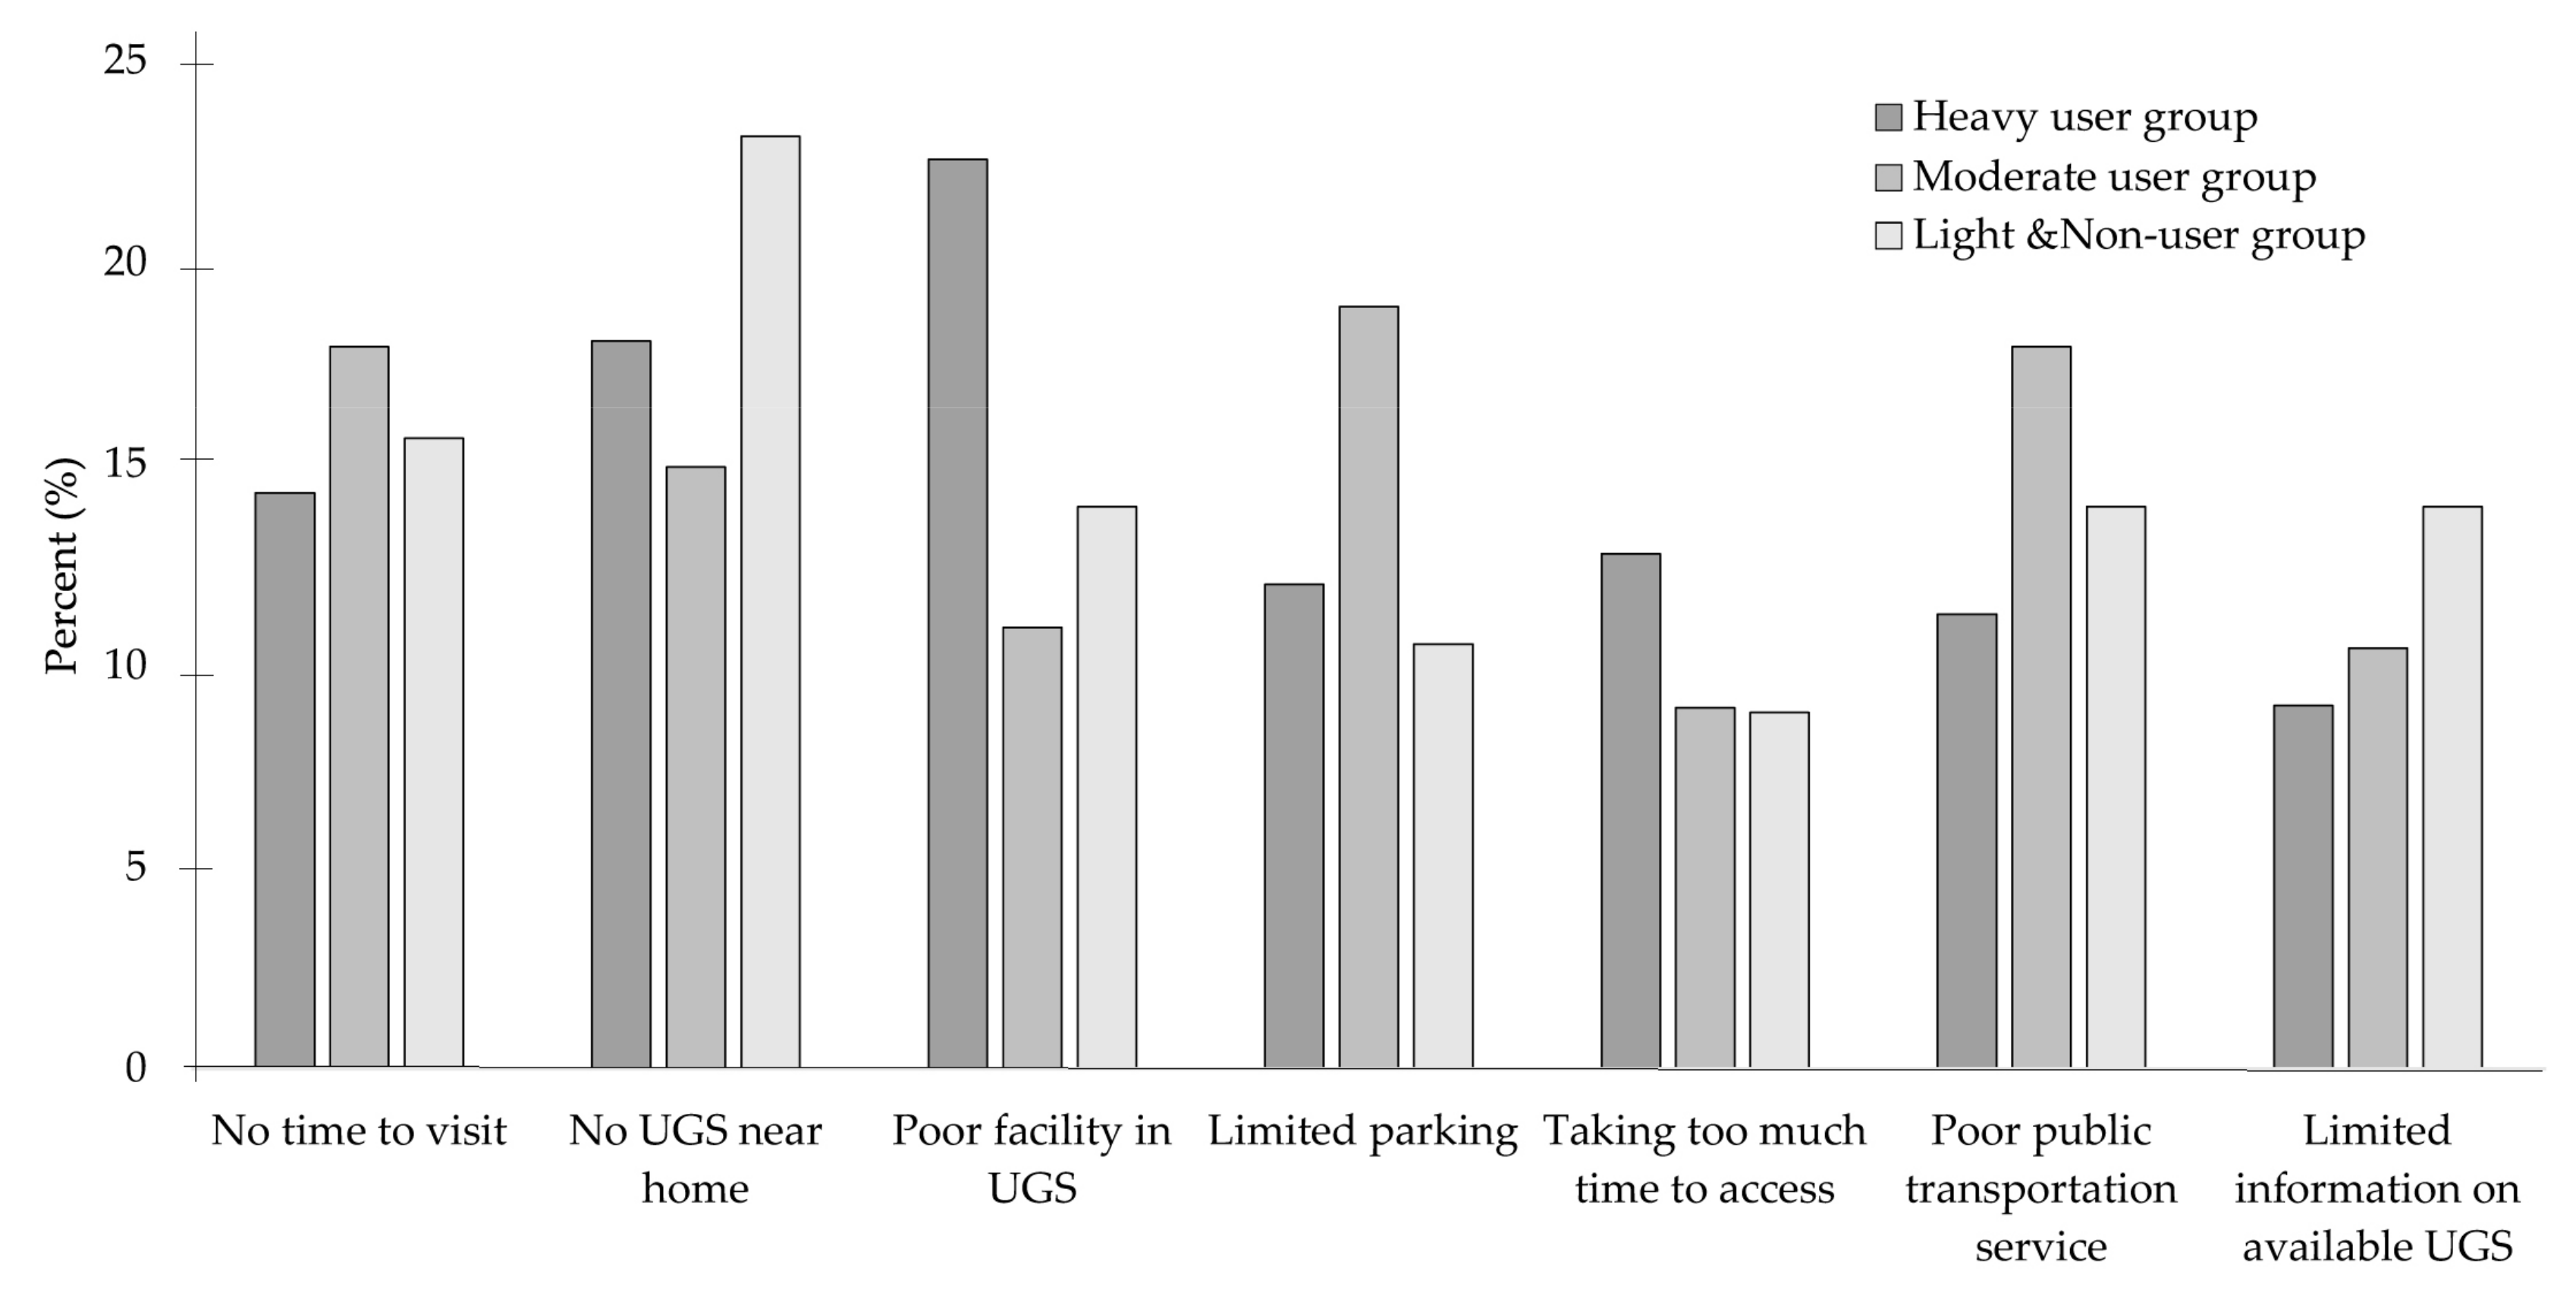
The frequency analysis of constraints indicated that all groups were greatly influenced by constraints (Figure 5). Heavy and moderate users sought to enhance SWB using negotiation strategies despite being influenced by constraints as much as non-users. The major constraints for the Hgroup were “poor facilities in UGS” and “no UGS near home,” whereas the Mgroup cited “no time to visit,” “limited parking,” and “poor public transportation service” as the primary constraints. Notably, the LNgroup reported “no UGS near home” as the primary constraint. Respondents in the Hgroup cited “limited information on available UGS” the least as a constraint, implying that heavy users actively seek out information on available UGS even if the information is difficult to find. Meanwhile, light and non-users reported “limited information on available UGS” as a fairly significant constraint.

3.6. Structural Equation Models for Positive/Negative Affect and Life Satisfaction

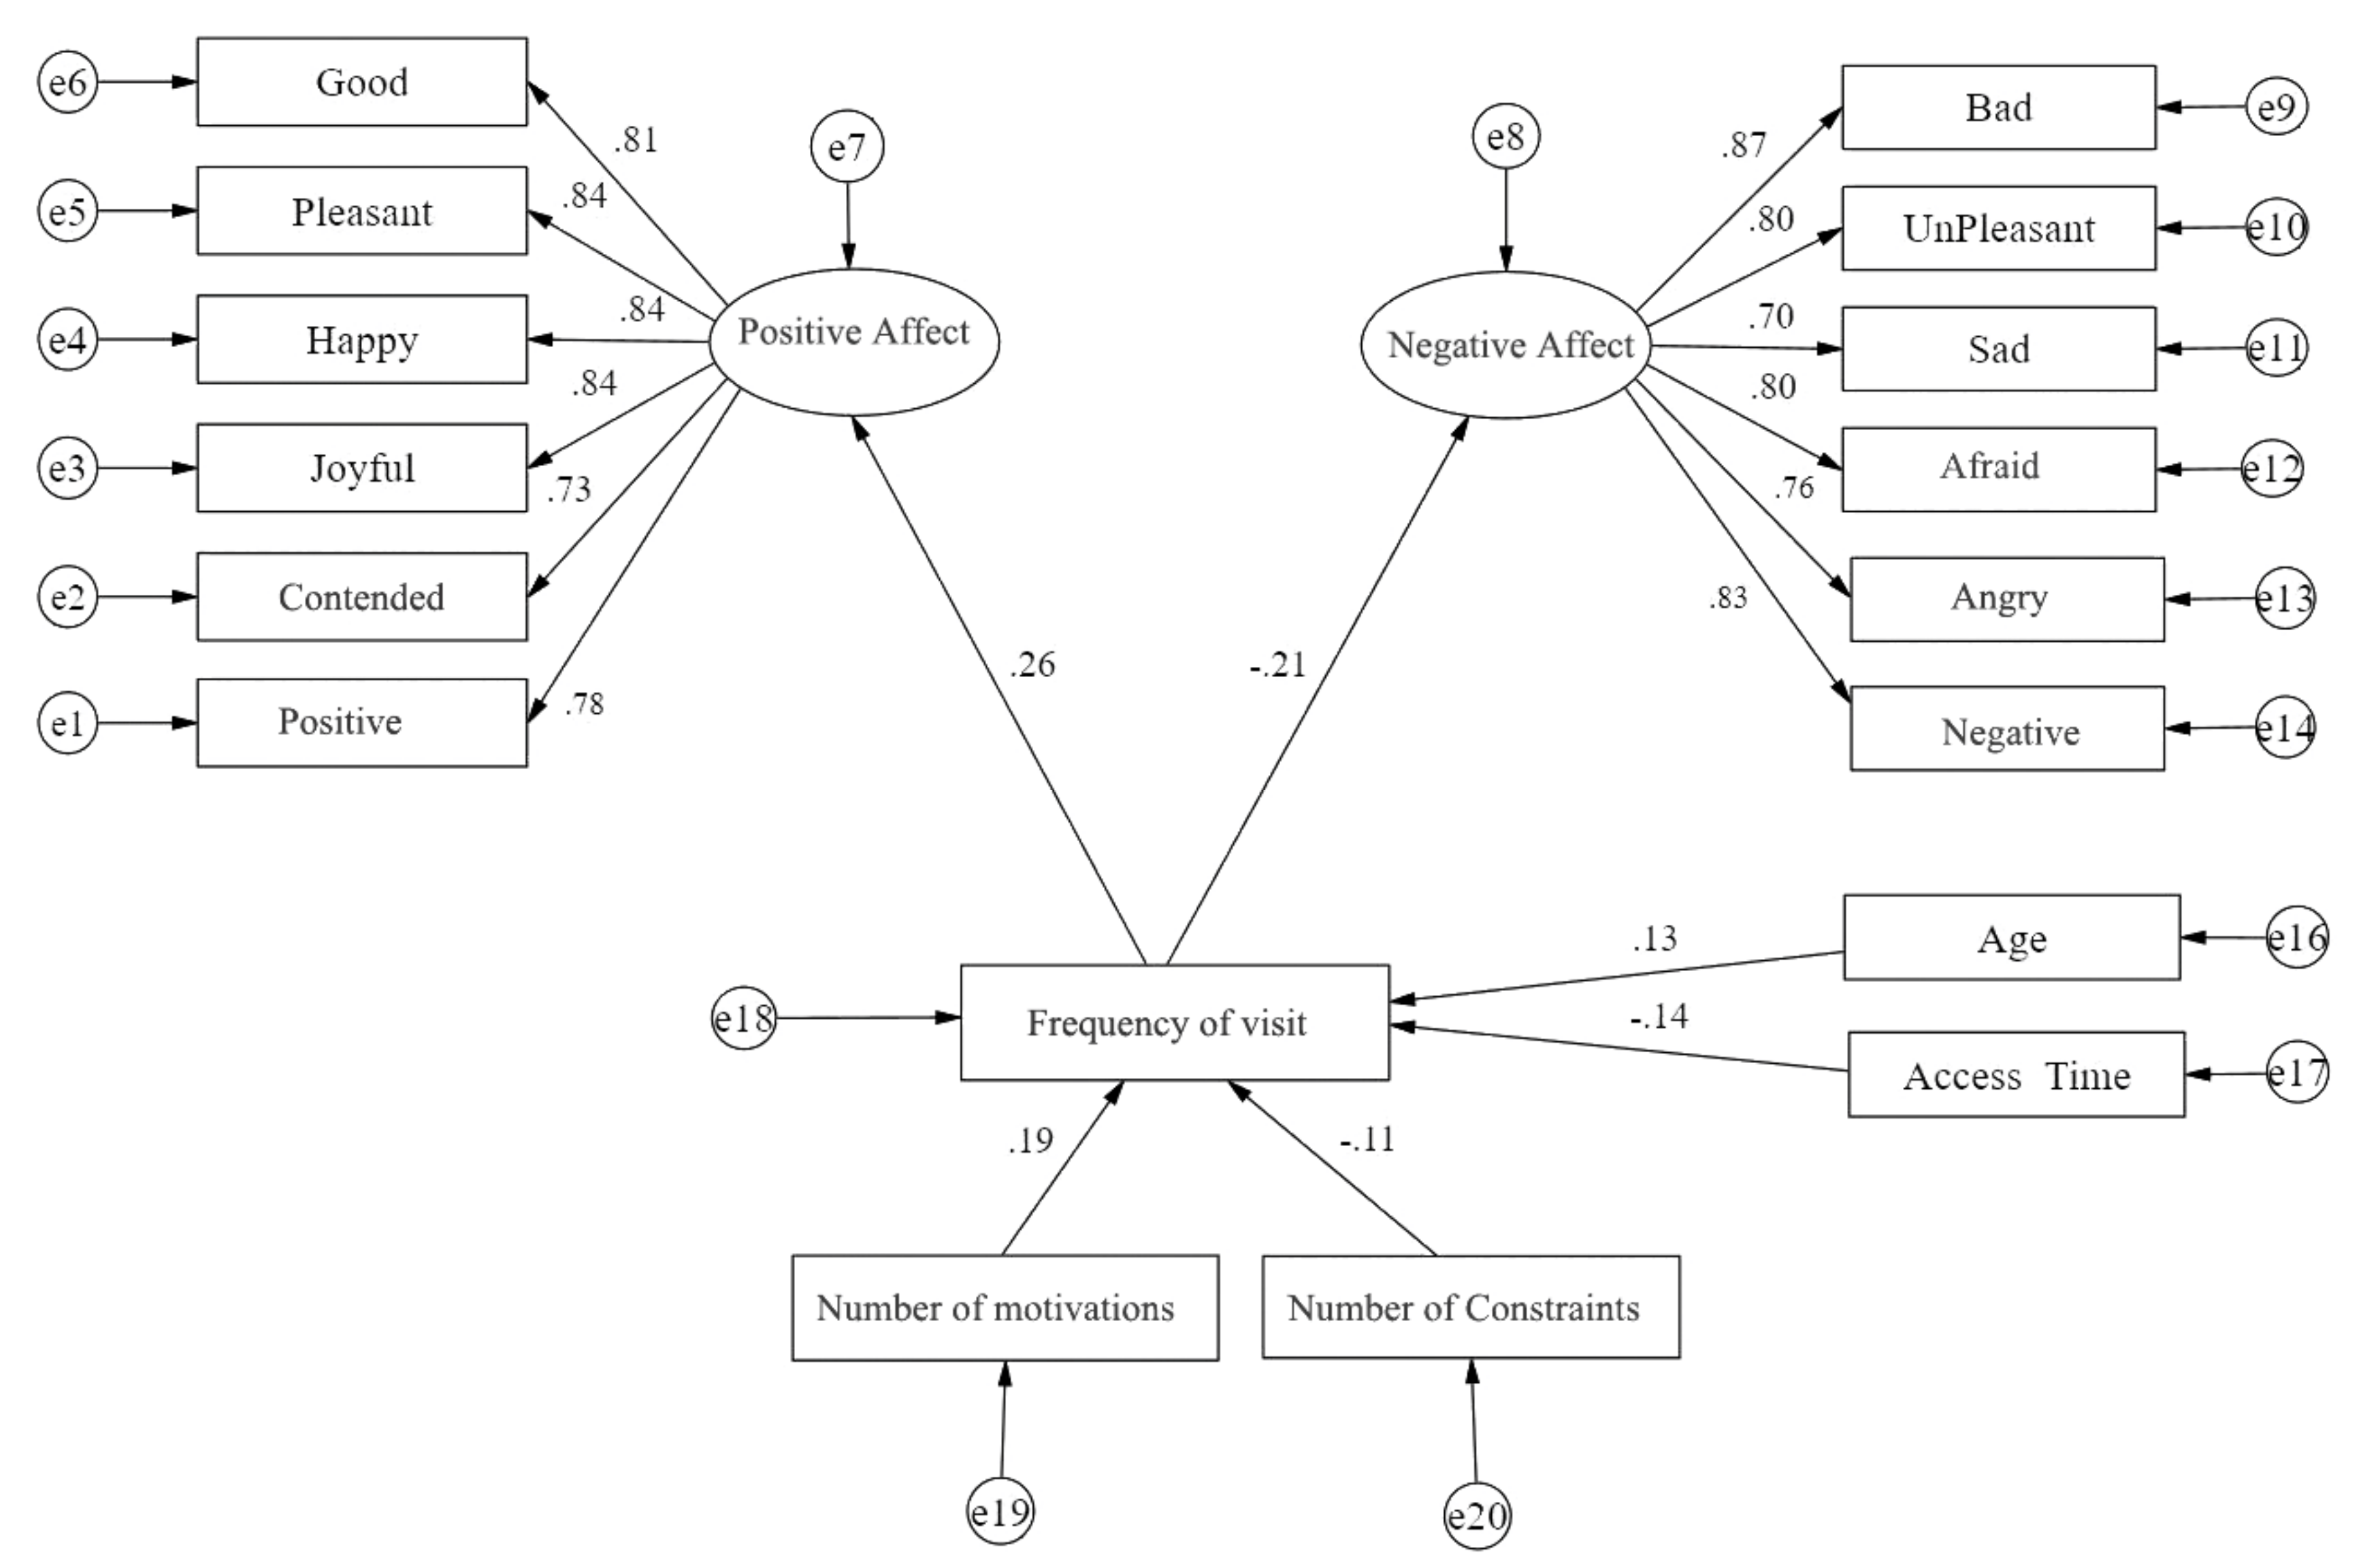
The study results above indicate that the UGS visit frequency had a significant impact on positive/negative affect and life satisfaction. Thus, we included only the UGS visit frequency in the estimated SEMs for positive/negative affect and life satisfaction. The estimated model for positive/negative affect revealed that the number of motivations positively affected the frequency of visiting urban green space within the previous two weeks while the number of constraints negatively affected it. The UGS visit frequency was likely to be high if respondents had a greater number of motivations and fewer constraints (Figure 6). Thus, visit frequency was partially determined by the number of motivations and constraints. Visit frequency within the previous two weeks was also affected by age and the access time from home to UGS. In addition, older respondents were likely to have visited UGS more frequently within the previous two weeks than younger respondents. However, other sociodemographic characteristics, gender, marital status, education level, monthly income level, and the presence of children (elementary school) did not show a significant effect on UGS visit frequency. The access time from home to urban green space negatively affected visit frequency, suggesting that the visit frequency was likely to be low if there was no available UGS near home. The comparison of the standardized coefficients of paths indicated that the number of motivations (0.19) was a more critical factor in determining the visit frequency than other variables, such as the number of constraints (−0.11), age (0.13), and access time (−0.14). Clearly, the UGS visit frequency within the previous two weeks increased positive affect (0.26) and lowered negative affect (−0.21), confirming the ANOVA results (Table 5).
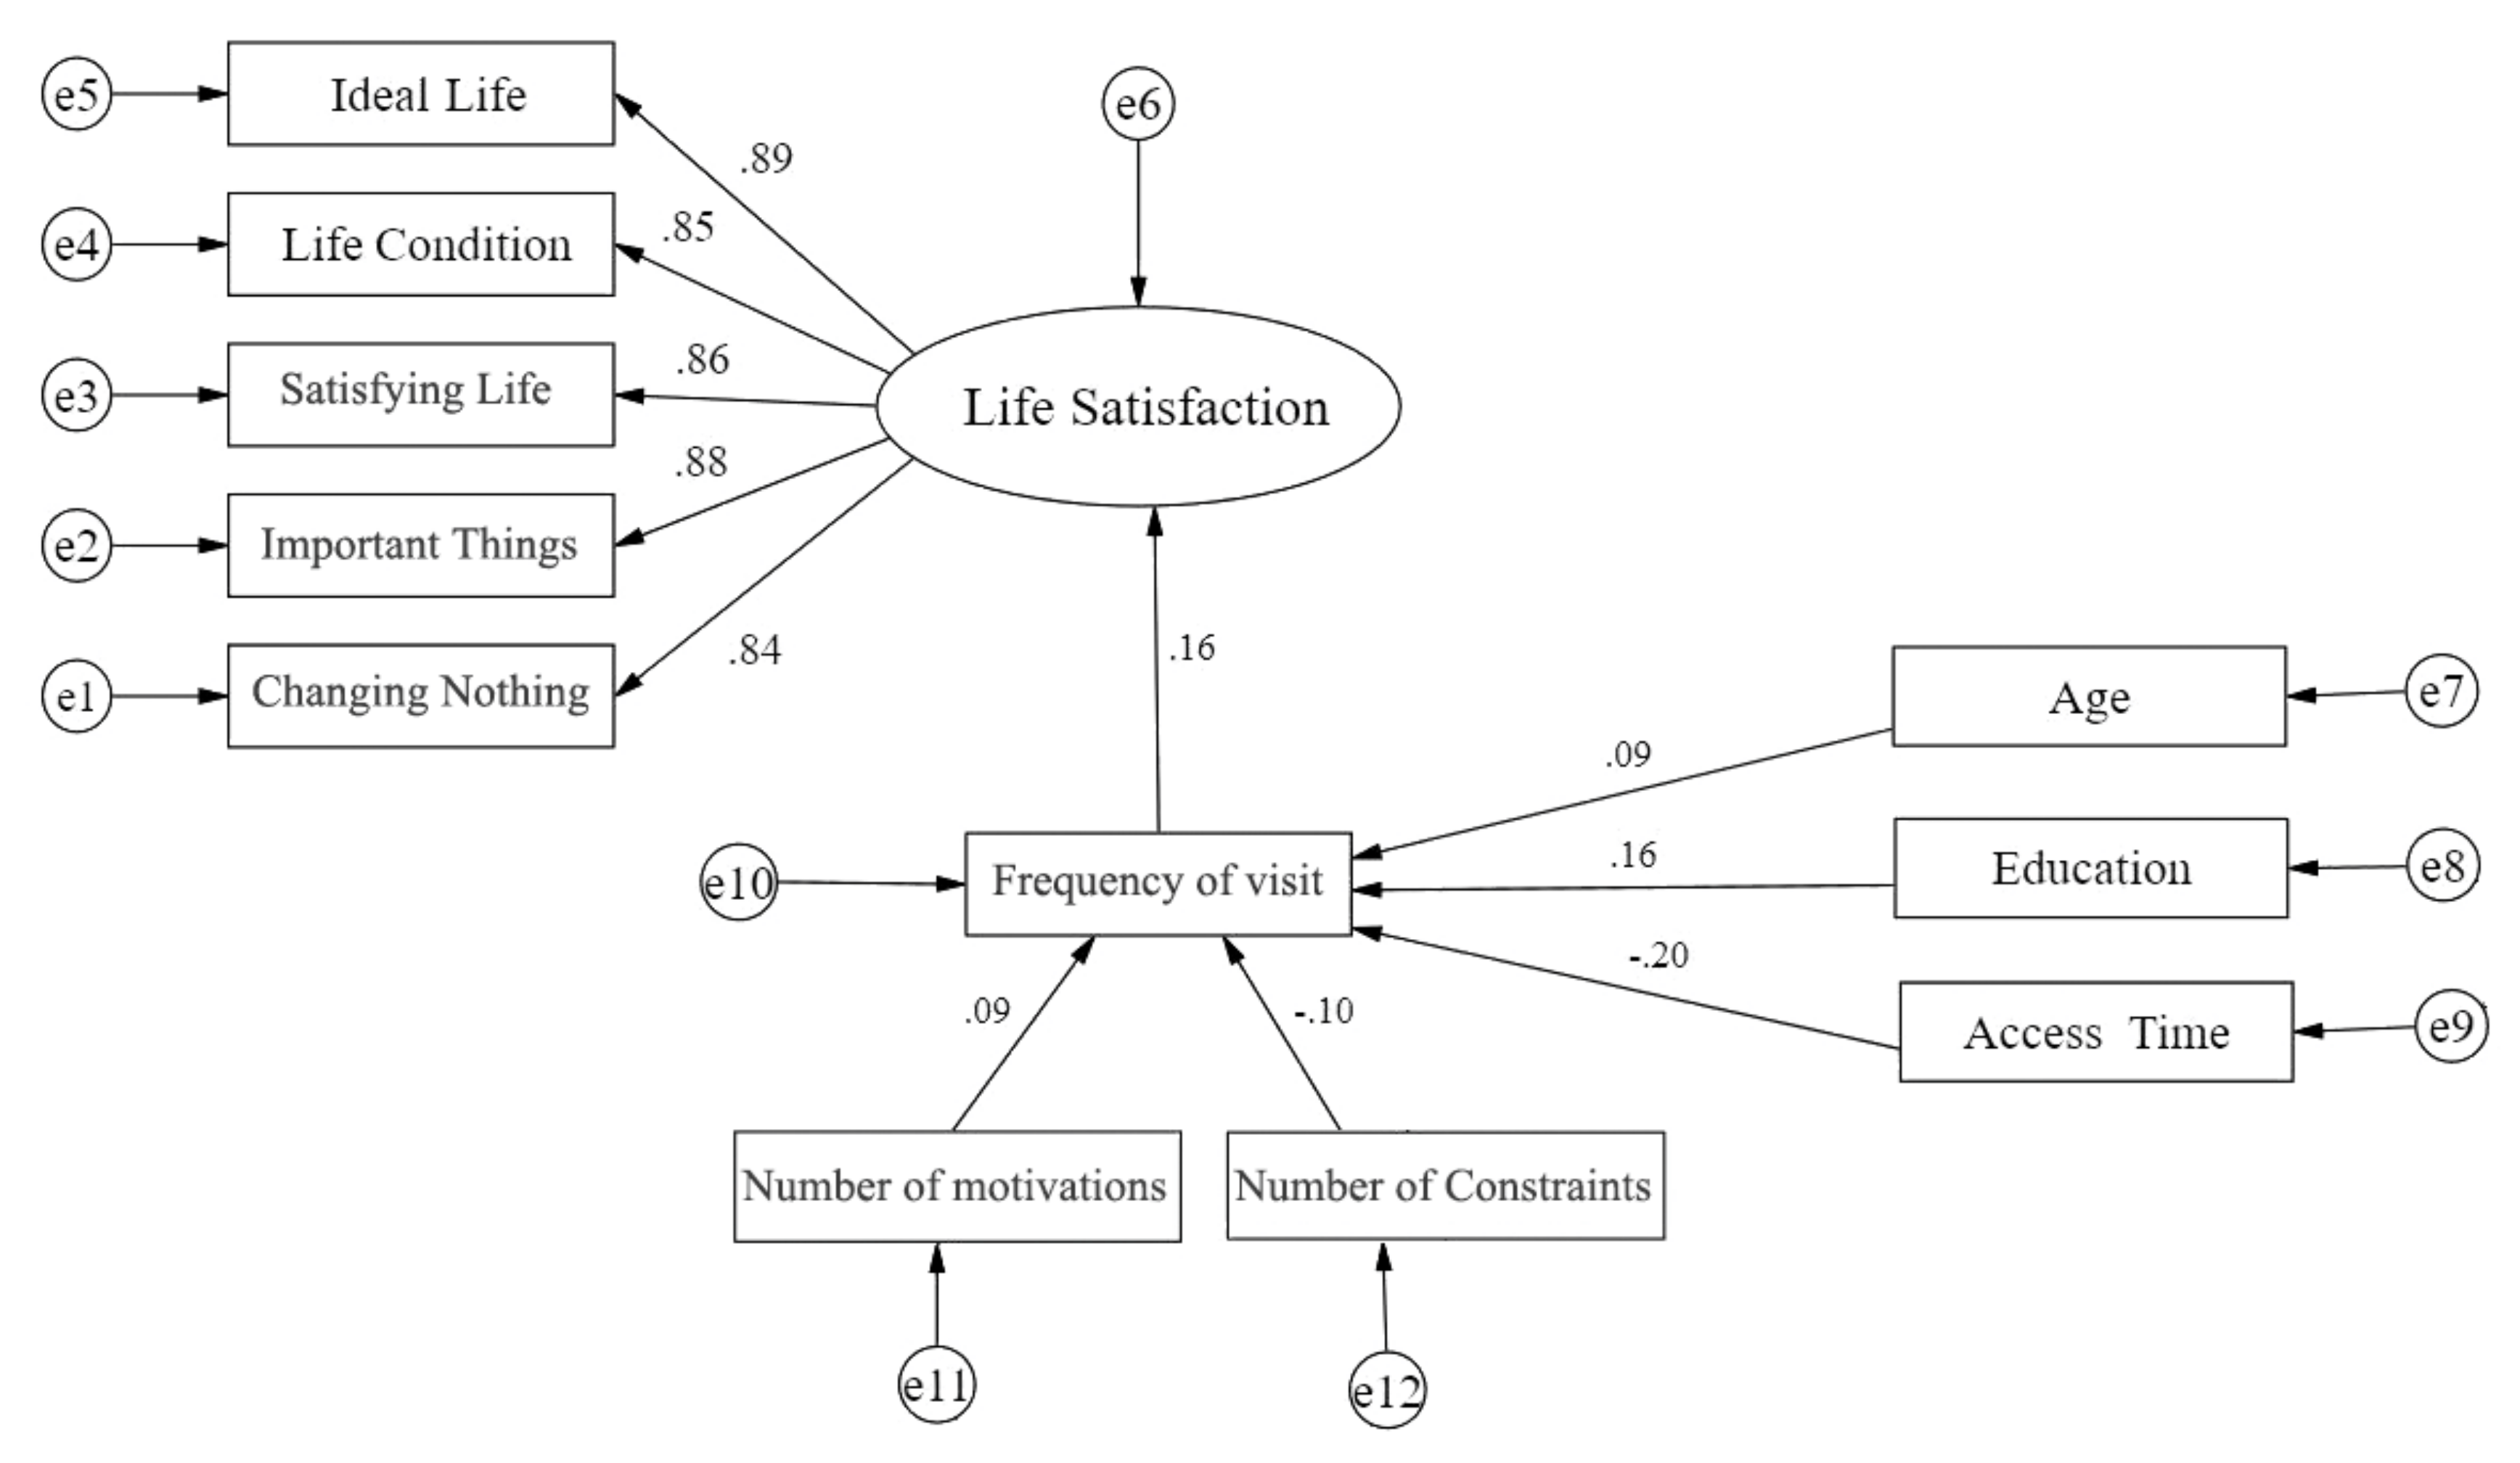
A SEM for life satisfaction in general was also estimated with the same variable (Figure 7). For estimating the model, we used the UGS visit frequency by usual use. This frequency was positively affected by the number of motivations (0.09) and negatively affected by the number of constraints (−0.1). Thus, the frequency of visiting urban green space was in part dependent on how many motivations or constraints each individual had. At the same time, visit frequency was negatively affected by access time from home to UGS and positively affected by age and education level. Thus, the UGS visit frequency by usual use was likely to be high if one had a greater number of motivations, a lower number of constraints, was older, had a higher education level, and if access time to UGS was short. However, visit frequency was not affected by other sociodemographic characteristics, such as gender, income level, presence of children, and marital status. Access time from home to urban green spaces showed a stronger effect on the visit frequency (−0.2) than the number of motivations (0.09), the number of constraints (−0.1), education level (0.16), or age (0.09) in the estimated life satisfaction model. As reported earlier (Table 5), the frequency of visiting urban green space revealed a positive effect on life satisfaction in general.
In sum, both SEMs for positive/negative affect and life satisfaction revealed that the UGS visit frequency had positive effects on positive/negative affect and life satisfaction. At the same time, the positive effect of age and negative effect of access time were consistent in both SEMs. Other sociodemographic characteristics did not show a significant effect on the frequency within the previous two weeks and usual use. Thus, it was clear that older urban dwellers were likely to visit UGS more frequently than younger people. In addition, access time from home to UGS appeared as a critical factor for the UGS visit frequency. Longer access time to UGS decreased the visit frequency, which in turn decreased positive affect and life satisfaction in general and increased negative affect. Also, both SEMs reinforced the importance of motivations and constraints in using urban green spaces. The number of motivations consistently increased the visit frequency, resulting in increased positive affect and life satisfaction and decreased negative affect.
The goodness-of-fit index of two estimated models was compared with recommended multicriteria including probability of X2, goodness-of-fit index (GFI), adjusted goodness-of-fit index (AGFI), comparative fit index (CFI), root mean square error of approximation (RMSEA), normed fit index (NFI), and parsimony normed fit index (PNFI) [117]. All indicators of the estimated two models were in the acceptable range, indicating that the models fitted with the observed relationships of positive/negative affect and life satisfaction with sociodemographic variables, accessibility, frequency of visit, motivation, and constraints (Table 7).

4. Discussion

4.1. Effects of Frequency of Visits and Time Spent in UGS on SWB

Studies have shown that various variables modify the relationship between natural environments and SWB, such as the quality of green space [118,119], biodiversity/variation in vegetation types [120,121,122], untended or poorly managed green space conditions [32,123,124], types of activities available [7], the degree of crowding [122], the degree of naturalness [124,125], proximity to green space [126], accessibility [125], and perceived sense of safety [127].
Our results of ANOVA and SEMs demonstrated that visiting UGS increased respondents’ positive affect and life satisfaction in general and decreased negative affect. Specifically, respondents who visited UGS within the past two weeks showed significantly higher positive affect and lower negative affect than those who did not visit UGS. Similarly, respondents who regularly visited on a weekly or monthly basis showed a higher level of life satisfaction in general than those who did not visit UGS at all or only visited a few times (e.g., 1–3 times a year). This was also confirmed by estimated SEMs for affect and life satisfaction. Regarding the effects of frequency of visits, we did not observe any difference between heavy users and moderate users in positive affect, negative affect, and life satisfaction in general. The amount of time spent in UGS was an insignificant factor for all components of SWB (i.e., positive affect, negative affect, and life satisfaction in general). These results are likely due to the unique characteristics of affective well-being components (i.e., positive affect and negative affect) and life satisfaction (i.e., life satisfaction in general). According to the broaden-and-build theory, experiencing positive emotions can broaden one’s momentary thought-action repertoires, and, in turn, serve to build one’s enduring personal resources, such as physical, intellectual, social, and psychological resources. In addition, experiencing positive emotions may initiate reciprocal interactions between positive emotions and broadened thinking, and lead to increases in emotional well-being over time [98]. Overall, experiencing pleasant emotions (e.g., visiting UGS) did not persistently produce an increase in positive emotions. Ong et al. [128] reported that repeatedly experiencing high levels of positive emotions can mediate the negative influence of stress on one’s current negative emotions, and this mediation effect can extend until the following day. In addition, aroused positive affect can be used as a continuous resource for enhancing one’s ability to respond to new circumstances, resulting in a low level of negative affect [81]. Repeatedly visiting UGS might evoke a low level of positive emotions, but such accumulated experiences of positive emotions could enhance individuals’ long-term SWB [129]. In addition, prior research has shown that the emotional aspects (i.e., positive affect and negative affect) of SWB have high temporal stability and sensitivity to short-term fluctuations while life satisfaction in general is relatively stable over time [70]. In theory, life satisfaction (i.e., life satisfaction in general) is a distinct concept from emotional well-being (i.e., positive affect, negative affect). An individual’s positive or negative emotions can be derived from his/her cognitive evaluation, and an individual considers these emotions (i.e., positive affect, negative affect) as criteria when judging his/her life satisfaction [108]. From this perspective, positive affect/negative affect and life satisfaction in general are interrelated. In general, positive affect/negative affect is a reaction to or appraisal of ongoing events, whereas life satisfaction in general is a more comprehensive, long-term evaluation of one’s life [130,131]. Due to these interactive characteristics of life satisfaction in general and positive affect/negative affect, respondents’ experienced an increased positive affect after visiting forests which enhanced their daily life and life satisfaction in general.
In this context, the results of this study suggest that the positive emotions of urban dwellers may be enhanced by small but frequent pleasurable experiences by visiting UGS in their daily lives, and such enhanced positive emotions may broaden their coping skills in certain circumstances. For example, coping resources and friendships can be considerably expanded through the increase in positive emotions, enabling individuals to cope flexibly and creatively with different circumstances. However, revisiting UGS sustains the increased positive emotions and broadens coping resources, thereby building a positive cycle of visiting UGS, enhancing positive emotions, and increasing/broadening coping ability. This positive cycling structure provides critical evidence supporting the need for urban dwellers to visit UGS and for providing UGS.
We did not observe any significant effects based on the amount of time spent in UGS on SWB. This was possibly because respondents evaluated visiting UGS overall as a positive experience and did not evaluate individual activities experienced during each visit. This was, in part, associated with the scale used in the study. Specifically, SPANE is a scale for measuring how often respondents experienced positive/negative emotions. Visitors who spend more time in UGS might experience relatively more positive and negative emotions than those who spend less time in UGS. However, the amount of time spent in UGS did not appear to be a significant factor because respondents comprehensively evaluated visiting UGS based on the difference in frequency of experiencing the two emotions [132]. In addition, the amount of time spent in UGS might be associated with the intensity of experienced emotions. However, we were unable to assess the intensity of emotions experienced during visits with SPANE. Our results are consistent with the findings of prior studies (e.g., [48,133,134,135,136,137] that indicate that SWB is influenced more by frequency of experience (i.e., the frequency of visits to UGS) than intensity of experience (i.e., amount of time spent in UGS).
However, it is noteworthy that some studies have reported that the amount of time spent is as important for SWB as frequency of visit (e.g., [115,138,139,140,141]). For example, university students who reported longer amounts of time spent in green spaces showed high levels of life satisfaction and low levels of stress (e.g., [115,139]). Korpela et al. [138] also reported that longer amounts of time spent in nature-based recreation are associated with restorative experiences and perceived emotional well-being, despite being reluctant to conclude that the time spent in urban forests is not associated with SWB. In addition, the concept of regularity may be more important for life satisfaction than simply frequency. As discussed earlier, life satisfaction is temporally stable, and there are accumulated effects of experiencing positive emotions on life satisfaction. In this context, the temporal stability of life satisfaction may be associated more with regularity of visits to UGS than frequency of visits (e.g., [48,55]). However, this argument must be confirmed in further studies with separate measures for effects of regular and irregular visits, while controlling for the total number of visits.

4.2. Effects of Motivation and Constraint

The estimated SEMs for positive/negative and life satisfaction with motivations and constraints provided significant insight into improving the SWB of urban dwellers. In the estimated models, the number of motivations increased the frequency of visits to UGS while the number of constraints showed negative impacts. Also, we identified the primary motivation and constraint. Thus, the fundamental strategy for improving SWB in urbanized areas must satisfy the primary motivations while minimizing the constraints. In our study, the most frequently reported motivations included certain terms such as “walk,” “away from home,” and “nature.” These terms belong to the “being away” dimension of the attention restoration theory, proposed by Kaplan and Kaplan [36]. In the urban context, the “being away” dimension is closely associated with visiting or moving to a different physical environment (e.g., UGS and natural areas) or mentally engaging in a completely different activity (e.g., recreational activities in forests or natural areas) as a break from daily urban life. The negative impacts of access time to UGS on the frequency of visiting UGS were consistent in both SEMs for positive/negative affect and life satisfaction. At the same time, the number of constraints negatively affected the UGS visit frequency in the estimated SEMs. An easier way of minimizing the constraints on visiting UGS may be to focus on the physical aspects of constraints reported by the LNgroup in the study, such as the distribution of UGS, accessibility to forests, and poor facilities. Previous studies have also reported the importance of the physical aspects of urban forests to promote visitation of forests, such as good accessibility, maintained natural areas, and well-designed marked paths (e.g., [115,142]). In similar contexts, recent studies have emphasized the importance of urban forest types [118,119], quality of forests [120], context [47,143], and maintenance of facilities [32,123,124].
However, these terms are very vague and too broad for implementation in the design and planning process, as well as in the management stage. Landscape designers, planners, and managers need more information regarding specific attributes of UGS, such as trails, distributions, and maintenance. To acquire such specific information of UGS attributes, the conjoint choice model may be beneficial because it is able to make direct predictions on choices of respondents in the form of a logit model by calculating the part-worth of attribute levels obtained from choice-type data [144]. For example, Hong et al. [97] found that the primary salient attributes affecting whether people visit urban forests were forest type, paving material of trail, topography, and travel time from home. At the same time, they were able to specify attribute levels for each forest attribute preferred by forest visitors. Hypothetically, for example, it may be interesting to consider implementing our findings into a conjoint choice model study, such as specifying attribute levels (e.g., soil-type pavement, wooden deck, or porous elastic pavement) of paving materials in the urban forest to satisfy the motivation “to take a walk” on the basis of people’s choices.
In terms of considering motivations and constraints, personality traits may play significant roles in the negotiation process and even the way in which residents interact with UGS. Recently, Holt et al. [115] classified green space users (i.e., undergraduate students) into active and passive users by interaction types and reported that active users were more likely to report a high quality of life, low stress, and the experience of positive emotions, whereas passive users of green space (e.g., sitting, studying, eating, or socializing in a natural setting) did not experience any change in well-being. However, we did not collect data to verify the role of respondents’ personality traits in the negotiation process or the association with their interaction with UGS in this study.
Additional personal and environmental factors have been found to be associated with the use of UGS, such as perception of access, perception of features, sense of safety, lifestyle, and urban sprawl (e.g., [1,16,83,84,85,86,87,88,142,145,146,147,148,149]); outdoor temperature (e.g., [55]); percentage of green space (e.g., [55]); and familiarity with forests (e.g., [10,149,150,151]), despite some inconsistency in the results among the studies. These factors are presumably used as resources in the negotiation process based on individuals’ value systems but were outside the scope of this study. Such factors may be explored in future studies to better understand these relationships.

5. Conclusions

There is rich evidence indicating the numerous positive effects of UGS on urban dwellers, such as enhancing physical/mental health, social interactions, and SWB, based on the attention restoration theory, stress reduction theory, and the biophilia hypothesis. In this study, we examined the effects of frequency of visits and time spent in UGS on the SWB of urban dwellers in the Deajeon, Korea. In addition, we investigated the primary motivations and constraints of visiting UGS for heavy, moderate, and light/non-users.
This paper makes a number of contributions to the literature on SWB. First, this study reinforces the importance of urban green spaces for the subjective well-being of urban dwellers. Second, the results of ANOVA and SEMs reveal that the frequency of visiting UGS positively affects the likelihood of experiencing a higher level of positive affect, life satisfaction in general, and a lower level of negative affect for urban dwellers. However, the amount of time spent in urban green space did not show any significant effects on positive affect, negative affect, or life satisfaction in general. Third, this study identifies the primary motivations for and constraints on visiting urban green spaces. The most frequent are, respectively, ‘to take a walk’ and ‘no urban green space near home.’ However, the most frequent motivations and constraints might vary across cities and countries because urban settings vary considerably different. Finally, the estimated SEMs for positive/negative affect and life satisfaction in general clearly showed the positive roles of motivation and the negative roles of constraints in visiting UGS. However, we were not able to delineate the true nature of the negotiation process in the study. As briefly discussed earlier, many variables such as personality traits, various environmental factors, motivations, and constraints might be involved in each individual’s negotiation mechanism. To understand these complex processes, a further study might require a more sophisticated and comprehensive study design integrating sociodemographic characteristics, previous experiences, and the given environmental conditions of a respondent, as well as various properties of urban green spaces.
This study has several limitations. First, the age range of the respondents was limited to 20–59 years because of costs and the survey method. Particularly, older residents (≥60 years old) were excluded from the target sample based on our use of an online survey method; we were not confident that older residents are familiar enough with the online survey method. Leisure activities, such as visiting UGS, are particularly important for older urban residents, and this group is more likely to visit UGS than any other age group because of the availability of time. In general, older individuals tend to feel “happiness” from common and frequent experiences, instead of from extraordinary experiences [152]. Thus, inclusion of older residents might have produced different results. Second, we were unable to include personality traits in the study. The influence of personality traits on SWB is particularly important to understand the affective component of SWB [153,154], and extraversion has been shown to be associated with experiencing more pleasure while neuroticism has been shown to be related with experiencing more displeasure [155]. Thus, personality traits could be considered in a future study to further delineate the nature of happiness associated with visiting UGS. Third, Oishi et al. [156] argued that one’s satisfaction in the value-congruent domain was more strongly related to global life satisfaction than satisfaction with particular domain. This suggests that the level of life satisfaction can differ among individuals despite visiting the same UGS. This is because the relative importance of each domain is different in each individual’s value system [59]. To reduce the complexity of the study dimension, we were unable to integrate this issue into the study, and separate further investigations are required to examine the possible connections between individuals’ relative importance of each domain and life satisfaction from visiting UGS. In a way, these limitations highlight the importance of individual value systems. Presumably, one’s value systems can vary by life stage, and personality traits significantly affect the establishment of value systems. Relative importance of each domain in life satisfaction can be understood as a critical characteristic of an individual’s value system derived by one’s life stage and personality traits. In addition, we strongly believe that these factors are significantly associated with the negotiation process with one’s own motivations and constraints. In the study, we investigated the effects of motivations and constraints using SEMs for affect and life satisfaction models, and we found consistent positive effects for motivations and negative effects for constraints. However, we were not able to examine how the negotiation process operated in the context of an individual’s life stage, personality traits, spatial property, and given urban setting, as well as motivations and constraints. The detailed negotiation process of an individual with relevant factors could be investigated in an additional study with a more sophisticated study design and survey.

Author Contributions

S.-K.H. was responsible for the data acquisition and statistical analysis. S.-W.L. and M.Y. wrote the manuscript and performed additional statistical analysis. H.-K.J. was the principal investigator of this project and performed the preliminary study prior to the main survey.

Funding

This study was conducted with the support of the ‘R&D Program for Forest Science Technology (Project No. 2017043B10-1919-BB01)’ provided by the Korea Forest Service (Korea Forestry Promotion Institute).

Conflicts of Interest

The authors declare no conflicts of interest.

References

  1. Barton, J.L.; Pretty, J. What is the best dose of nature and green exercise for improving mental health? A multi-study analysis. Environ. Sci. Technol. 2010, 44, 3947–3955. [Google Scholar] [CrossRef] [PubMed]
  2. Jones, A.; Hillsdon, M.; Coombes, E. Greenspace access, use, physical activity and obesity: Understanding the effects of area deprivation. Prev. Med. 2009, 49, 500–505. [Google Scholar] [CrossRef] [PubMed]
  3. Nielsen, T.S.; Hansen, K.B. Do green areas affect health? Results from a Danish survey on the use of green areas and health indicators. Health Place 2007, 13, 839–850. [Google Scholar] [CrossRef] [PubMed]
  4. Alcock, I.; White, M.P.; Wheeler, B.W.; Fleming, L.E.; Depledge, M.H. Longitudinal Effects on Mental Health of Moving to Greener and Less Green Urban Areas. Environ. Sci. Technol. 2014, 48, 1247–1255. [Google Scholar] [CrossRef] [PubMed]
  5. Weimann, H.; Rylander, L.; Albin, M.; Skärbäck, E.; Grahn, P.; Östergren, P.-O.; Björk, J. Effects of changing exposure to neighbourhood greenness on general and mental health: A longitudinal study. Health Place 2015, 33, 48–56. [Google Scholar] [CrossRef] [PubMed]
  6. White, M.P.; Alcock, I.; Wheeler, B.W.; Depledge, M.H. Would You Be Happier Living in a Greener Urban Area? A Fixed-Effects Analysis of Panel Data. Psychol. Sci. 2013, 24, 920–928. [Google Scholar] [CrossRef] [PubMed]
  7. Bratman, G.N.; Hamilton, J.P.; Daily, G.C. The impacts of nature experience on human cognitive function and mental health. Ann. N. Y. Acad. Sci. 2012, 1249, 118–136. [Google Scholar] [CrossRef] [PubMed]
  8. Marselle, M.R.; Irvine, K.N.; Warber, S.L. Walking for Well-Being: Are Group Walks in Certain Types of Natural Environments Better for Well-Being than Group Walks in Urban Environments? Int. J. Environ. Res. Public Health 2013, 10, 5603–5628. [Google Scholar] [CrossRef] [PubMed] [Green Version]
  9. Astell-Burt, T.; Mitchell, R.; Hartig, T. The association between green space and mental health varies across the life course. A longitudinal study. J. Epidemiol. Community Health 2014, 68, 578–583. [Google Scholar] [CrossRef] [PubMed]
  10. Irvine, K.N.; Warber, S.L.; Devine-Writght, P.; Gaston, K.J. Understanding urban green space as a health resource: A qualitative comparison of visit motivation and derived effects among park users in Sheffield, UK. Int. J. Environ. Res. Public Health 2013, 10, 417–442. [Google Scholar] [CrossRef] [PubMed]
  11. Korpela, K.M.; Ylén, M.P. Effectiveness of Favorite-Place Prescriptions: A Field Experiment. Am. J. Prev. Med. 2009, 36, 435–438. [Google Scholar] [CrossRef]
  12. Tyrväinen, L.; Ojala, A.; Korpela, K.; Lanki, T.; Tsunetsugu, Y.; Kagawa, T. The influence of urban green environments on stress relief measures: A field experiment. J. Environ. Psychol. 2014, 38, 1–9. [Google Scholar] [CrossRef]
  13. Ulrich, R.S.; Simons, R.F.; Losito, B.D.; Fiorito, E.; Miles, M.A.; Zelson, M. Stress recovery during exposure to natural and urban environments. J. Environ. Psychol. 1991, 11, 201–230. [Google Scholar] [CrossRef]
  14. Berman, M.G.; Jonides, J.; Kaplan, S. The Cognitive Benefits of Interacting with Nature. Psychol. Sci. 2008, 219, 1207–1212. [Google Scholar] [CrossRef] [PubMed]
  15. Hartig, T.; Evans, G.W.; Jamner, L.D.; Davis, D.S.; Gärling, T. Tracking restoration in natural and urban field settings. J. Environ. Psychol. 2003, 23, 109–123. [Google Scholar] [CrossRef]
  16. Keniger, L.E.; Gaston, K.J.; Irvine, K.N.; Fuller, R.A. What are the Benefits of Interacting with Nature? Int. J. Environ. Res. Public Health 2013, 10, 913–935. [Google Scholar] [CrossRef] [PubMed] [Green Version]
  17. Park, B.J.; Tsunetsugu, Y.; Kasetani, T.; Kagawa, T.; Miyazaki, Y. The physiological effects of Shinrin-yoku (taking in the forest atmosphere or forest bathing): Evidence from field experiments in 24 forests across Japan. Environ. Health Prev. Med. 2010, 15, 18. [Google Scholar] [CrossRef] [PubMed]
  18. Bratman, G.N.; Daily, G.C.; Levy, B.J.; Gross, J.J. The benefits of nature experience: Improved affect and cognition. Landsc. Urban Plan. 2015, 138, 41–50. [Google Scholar] [CrossRef]
  19. Pilotti, M.; Klein, E.; Golem, D.; Piepenbrink, E.; Kaplan, K. Is Viewing a Nature Video After Work Restorative? Effects on Blood Pressure, Task Performance, and Long-Term Memory. Environ. Behav. 2015, 47, 947–969. [Google Scholar] [CrossRef]
  20. Ulrich, R.S. View Through a Window May Influence Recovery from Surgery. Science 1984, 224, 420–421. [Google Scholar] [CrossRef] [Green Version]
  21. Grahn, P.; Stigsdotter, U.A. Landscape planning and stress. Urban For. Urban Green. 2003, 2, 1–18. [Google Scholar] [CrossRef] [Green Version]
  22. Kuo, F.E.; Sullivan, W.C. Environment and crime in the inner city: Does vegetation reduce crime? Environ. Behav. 2001, 33, 343–367. [Google Scholar] [CrossRef]
  23. Sullivan, W.C.; Kuo, F.E.; Depooter, S.F. The Fruit of Urban Nature: Vital Neighborhood Spaces. Environ. Behav. 2004, 36, 678–700. [Google Scholar] [CrossRef]
  24. Williams, D.R.; Stewart, S.I. Sense of place: An elusive concept that is finding a home in ecosystem management. J. For. 1998, 96, 18–23. [Google Scholar] [CrossRef]
  25. Ellis, C.D.; Lee, S.W.; Kweon, B.S. Retail land use, neighborhood satisfaction and the urban forest: An investigation into the moderating and mediating effects of trees and shrubs. Landsc. Urban. Plan. 2006, 74, 70–78. [Google Scholar] [CrossRef]
  26. Kaplan, R. Nature at the doorstep: Residential satisfaction and the nearby environment. J. Archit. Plan. Res. 1985, 2, 115–127. [Google Scholar]
  27. Kaplan, R. The Nature of the View from Home: Psychological Benefits. Environ. Behav. 2001, 33, 507–542. [Google Scholar] [CrossRef]
  28. Talbot, J.F.; Kaplan, R. The benefits of nearby nature for elderly apartment residents. Int. J. Aging Hum. Dev. 1991, 33, 119–130. [Google Scholar] [CrossRef]
  29. Barton, J.L.; Pretty, J. Urban ecology and human health and wellbeing. In Urban Ecology, 1st ed.; Gaston, K.J., Ed.; Cambridge University Press: Cambridge, UK, 2010; pp. 202–229. ISBN 978-0-521-76097-3. [Google Scholar]
  30. Dadvand, P.; Bartoll, X.; Basagaña, X.; Dalmau-Bueno, A.; Martinez, D.; Ambros, A.; Cirach, M.; Triguero-Mas, M.; Gascon, M.; Borrell, C.; et al. Green spaces and General Health: Roles of mental health status, social support, and physical activity. Environ. Int. 2016, 91, 161–167. [Google Scholar] [CrossRef] [Green Version]
  31. Fan, Y.; Das, K.V.; Chen, Q. Neighborhood green, social support, physical activity, and stress: Assessing the cumulative impact. Health Place 2011, 17, 1202–1211. [Google Scholar] [CrossRef]
  32. Maas, J.; van Dillen, S.M.E.; Verheij, R.A.; Groenewegen, P.P. Social contacts as a possible mechanism behind the relation between green space and health. Health Place 2009, 15, 586–595. [Google Scholar] [CrossRef] [PubMed] [Green Version]
  33. Weinstein, N.; Balmford, A.; DeHaan, C.R.; Gladwell, V.; Bradbury, R.B.; Amano, T. Seeing Community for the Trees: The Links among Contact with Natural Environments, Community Cohesion, and Crime. BioScience 2015, 65, 1141–1153. [Google Scholar] [CrossRef] [Green Version]
  34. Cacioppo, J.T.; Hughes, M.E.; Waite, L.J.; Hawkley, L.C.; Thisted, R.A. Loneliness as a specific risk factor for depressive symptoms: Cross-sectional and longitudinal analysis. Psychol. Aging 2006, 21, 140–151. [Google Scholar] [CrossRef] [PubMed]
  35. Uchino, B.N. Social Support and Health: A Review of Physiological Processes Potentially Underlying Links to Disease Outcomes. J. Behav. Med. 2006, 29, 377–387. [Google Scholar] [CrossRef] [PubMed]
  36. Kaplan, R.; Kaplan, S. The Experience of Nature: A Psychological Perspective; Cambridge University Press: Cambridge, UK, 1989; ISBN 978-0521349390. [Google Scholar]
  37. Kaplan, S. The restorative benefits of nature: Toward an integrative framework. J. Environ. Psychol. 1995, 15, 169–182. [Google Scholar] [CrossRef]
  38. Ulrich, R.S. Human responses to vegetation and landscapes. Landsc. Urban Plan. 1986, 13, 29–44. [Google Scholar] [CrossRef]
  39. Wilson, E.O. Biophilia; Harvard University Press: Cambridge, MA, USA, 1984; ISBN 0674074416. [Google Scholar]
  40. Wilson, E.O. Biophilia and the Conservation Ethic. In The Biophilia Hypothesis, 1st ed.; Kellert, S.R., Wilson, E.O., Eds.; Island Press: Washington, DC, USA, 1993; pp. 31–41. ISBN 9781559631488. [Google Scholar]
  41. Carrus, G.; Scopelliti, M.; Lafortezza, R.; Colangelo, G.; Ferrini, F.; Salbitano, F.; Agrimi, M.; Portoghesi, L.; Semenzato, P.; Sansei, G. Go greener, feel better? The positive effects of biodiversity on the well-being of individuals visiting urban and peri-urban green areas. Landsc. Urban Plan. 2015, 134, 221–228. [Google Scholar] [CrossRef]
  42. Jiang, B.; Chang, C.Y.; Sullivan, W.E. A dose of nature: Tree cover, stress reduction, and gender differences. Landsc. Urban Plan. 2014, 132, 26–36. [Google Scholar] [CrossRef]
  43. Nordh, H.; Østby, K. Pocket parks for people: A study of park design and Use. Urban For. Urban Green. 2013, 12, 12–17. [Google Scholar] [CrossRef]
  44. Staats, H.; Van Gemerden, E.; Hartig, T. Preference for Restorative Situations: Interactive Effects of Attentional State, Activity-in-Environment, and Social Context. Leis. Sci. 2010, 32, 401–417. [Google Scholar] [CrossRef]
  45. Dempsey, N.; Brown, C.; Bramley, G. The key to sustainable urban development in UK cities? The influence of density on social sustainability. Prog. Plan. 2012, 77, 89–141. [Google Scholar] [CrossRef]
  46. Lachowycz, K.; Jones, A.P. Towards a better understanding of the relationship between greenspace and health: Development of a theoretical framework. Landsc. Urban Plan. 2013, 118, 62–69. [Google Scholar] [CrossRef]
  47. Maas, J.; Verheij, R.A.; De Vries, S.; Spreeuwenberg, P.; Groenewegen, P.P. Green space, urbanity, and health: How strong is the relation? J. Epidemiol. Community Health 2006, 60, 587–592. [Google Scholar] [CrossRef]
  48. Mitchell, R. Is physical activity in natural environments better for mental health than physical activity in other environments? Soc. Sci. Med. 2013, 91, 130–134. [Google Scholar] [CrossRef]
  49. Falk, J.H.; Balling, J.D. Evolutionary Influence on Human Landscape Preference. Environ. Behav. 2009, 42, 479–793. [Google Scholar] [CrossRef]
  50. Ulrich, R.S. Biophilia, Biophobia, and Natural Landscapes. In The Biophilia Hypothesis, 2nd ed.; Kellert, S.R., Wilson, E.O., Eds.; Island Press: Washington, DC, USA, 1995; pp. 73–137. ISBN 9781559631471. [Google Scholar]
  51. Hartig, T. Green Space, Psychological Restoration, and Health Inequality. Lancet 2008, 372, 1614–1615. [Google Scholar] [CrossRef]
  52. Ewert, A.; Chang, Y. Levels of Nature and Stress Response. Behav. Sci. 2018, 8, 49. [Google Scholar] [CrossRef]
  53. Silva, R.A.; Rogers, K.; Buckley, T.J. Advancing Environmental Epidemiology to Assess the Beneficial Influence of the Natural Environment on Human Health and Well-Being. Environ. Sci. Technol. 2018, 52, 9545–9555. [Google Scholar] [CrossRef] [Green Version]
  54. MacKerron, G.; Mourato, S. Happiness is greater in natural environments. Glob. Environ. Chang. 2013, 23, 992–1000. [Google Scholar] [CrossRef] [Green Version]
  55. Saw, L.E.; Lim, F.K.S.; Carrasco, L.R. The Relationship between Natural Park Usage and Happiness Does Not Hold in a Tropical City. PLoS ONE 2015, 10, e0133781. [Google Scholar] [CrossRef]
  56. National Research Council. The Subjective Well-Being: Measuring Happiness, Suffering, and Other Dimensions of Experience; Stone, A.A., Mackie, C., Eds.; The National Academies Press: Washington, DC, USA, 2013; ISBN 978-0-309-29446-1. [Google Scholar]
  57. Diener, E. Subjective well-being: The science of happiness and a proposal for a national index. Am. Psychol. 2000, 55, 34–43. [Google Scholar] [CrossRef]
  58. Lyubomirsky, S.; King, L.; Diener, E. The benefits of frequent positive affect: Does Happiness Lead to Success? Psychol. Bull. 2005, 131, 803–855. [Google Scholar] [CrossRef]
  59. Wegener, D.T.; Petty, R.E. Mood management across affective states: The hedonic contingency hypothesis. J. Personal. Soc. Psychol. 1994, 66, 1034–1048. [Google Scholar] [CrossRef]
  60. Fredrickson, B.L. The Role of Positive Emotions in Positive Psychology: The Broaden-and-Build Theory of Positive Emotions. Am. Psychol. 2001, 56, 218–226. [Google Scholar] [CrossRef]
  61. Dunn, E.W.; Gilbert, D.T.; Wilson, T.D. If money doesn’t make you happy, then you probably aren’t spending it right. J. Consum. Psychol. 2011, 21, 115–125. [Google Scholar] [CrossRef]
  62. Clark, L.A.; Watson, D. Mood and the mundane: Relations between daily life events and self-reported mood. J. Personal. Soc. Psychol. 1988, 54, 296–308. [Google Scholar] [CrossRef]
  63. Watson, D. Positive Affectivity: The Disposition to Experience Positive Emotional States. In Handbook of Positive Psychology; Snyder, C.R., Lopez, S.J., Eds.; Oxford University Press: New York, NY, USA, 2002; pp. 106–119. ISBN 9780195135336. [Google Scholar]
  64. Watson, D.; Clark, L.A.; Tellegen, A. Development and validation of brief measures of positive and negative affect: The PANAS scales. J. Personal. Soc. Psychol. 1988, 54, 1063–1070. [Google Scholar] [CrossRef]
  65. Shin, D.C.; Johnson, D.M. Avowed happiness as an overall assessment of the quality of life. Soc. Indic. Res. 1978, 5, 475–492. [Google Scholar] [CrossRef]
  66. Diener, E.; Chan, M.Y. Happy people live longer: Subjective well-being contributes to health and longevity. Appl. Psychol. Health Well Being 2011, 3, 1–43. [Google Scholar] [CrossRef]
  67. Diener, E.; Seligman, M.E.P. Beyond Money: Toward an Economy of Well-Being. Psychol. Sci. Public Interest 2004, 5, 1–31. [Google Scholar] [CrossRef]
  68. Kahneman, D.; Deaton, A. High income improves evaluation of life but not emotional well-being. Proc. Natl. Acad. Sci. USA 2010, 107, 16489–16493. [Google Scholar] [CrossRef] [Green Version]
  69. Pavot, W.; Diener, E. Review of the Satisfaction with Life Scale. Psychol. Assess. 1993, 5, 164–172. [Google Scholar] [CrossRef]
  70. Eid, M.; Diener, E. Global Judgments of Subjective Well- Being: Situational Variability and Long-Term Stability. Soc. Indic. Res. 2004, 65, 245–277. [Google Scholar] [CrossRef]
  71. Hong, S.-K.; An, K.-J.; Jang, H.-C. Interactional effects of travel experience and traumatic event on subjective well-being. J. Korean Inst. Landsc. Archit. 2017, 45, 1–10. [Google Scholar] [CrossRef]
  72. Chen, Y.; Lehto, X.Y.; Cai, L. Vacation and well-being: A study of chinese tourists. Ann. Tour. Res. 2013, 42, 284–310. [Google Scholar] [CrossRef]
  73. Loewe, N.; Bagherzadeh, M.; Araya-Castillo, L.; Thieme, C.; Batista-Foguet, J.M. Life Domain Satisfactions as Predictors of Overall Life Satisfaction Among Workers: Evidence from Chile. Soc. Indic. Res. 2014, 118, 71–86. [Google Scholar] [CrossRef]
  74. Bird, W. Natural Fit: Can Green Space and Biodiversity Increase Levels of Physical Activity? Royal Society for the Protection of Birds, October 2004. Available online: https://ww2.rspb.org.uk/images/natural_fit_full_version_tcm9-133055.pdf (accessed on 23 May 2019).
  75. Baumeister, R.F.; Tice, D.M. Anxiety and social exclusion. J. Soc. Clin. Psychol. 1990, 9, 165–195. [Google Scholar] [CrossRef]
  76. House, J.S.; Landis, K.R.; Umberson, D. Social relationships and health. Science 1988, 241, 540–545. [Google Scholar] [CrossRef]
  77. Morris, N. Health, Well-Being and Open Space: Literature Review. OPENspace, July 2003. Available online: http://www.openspace.eca.ed.ac.uk/wp-content/uploads/2015/10/Health-Well-being-and-Open-Space-literature-review.pdf (accessed on 22 May 2019).
  78. Peters, K.; Elands, B.; Buijs, A. Social interactions in urban parks: Stimulating social cohesion? Urban For. Urban Green. 2010, 9, 93–100. [Google Scholar] [CrossRef] [Green Version]
  79. Sugiyama, T.; Leslie, E.; Giles-Corti, B.; Owen, N. Associations of neighbourhood greenness with physical and mental health: Do walking, social coherence and local social interaction explain the relationships? J. Epidemiol. Community Health 2008, 62, e9. [Google Scholar] [CrossRef]
  80. Wood, L.J.; Giles-Corti, B. Is there a place for social capital in the psychology of health and place? J. Environ. Psychol. 2008, 28, 154–163. [Google Scholar] [CrossRef]
  81. Biedenweg, K.; Scott, R.P.; Scott, T.A. How does engaging with nature relate to life satisfaction? Demonstrating the link between environment-specific social experiences and life satisfaction. J. Environ. Psychol. 2017, 50, 112–124. [Google Scholar] [CrossRef]
  82. Chen, E.; Miller, G.E.; Shalowitz, M.U.; Story, R.E.; Levine, C.S.; Hayen, R.; Sbihi, H.; Brauer, M. Difficult Family Relationships, Residential Greenspace, and Childhood Asthma. Pediatrics 2017, 139, e20163056. [Google Scholar] [CrossRef] [Green Version]
  83. Bell, S.L.; Phoenix, C.; Lovell, R.; Wheeler, B.W. Green space, health and wellbeing: Making space for individual agency. Health Place 2014, 30, 287–292. [Google Scholar] [CrossRef]
  84. Capaldi, C.A.; Dopko, R.L.; Zelenski, J.M. The relationship between nature connectedness and happiness: A meta-analysis. Front. Psychol. 2014, 5, 976. [Google Scholar] [CrossRef]
  85. Cervinka, R.; Röderer, K.; Hefler, E. Are nature lovers happy? On various indicators of well-being and connectedness to nature. J. Health Psychol. 2012, 17, 379–388. [Google Scholar] [CrossRef]
  86. Frumkin, H.; Bratman, G.N.; Breslow, S.J.; Cochran, B.; Kahn, P.H., Jr.; Lawler, J.J.; Levin, P.S.; Tandon, P.S.; Varanasi, U.; Wolf, K.L.; et al. Nature Contact and Human Health: A Research Agenda. Environ. Health Perspect. 2017, 125, 075001. [Google Scholar] [CrossRef]
  87. Hartig, T.; Mitchell, R.; de Vries, S.; Frumkin, H. Nature and health. Annu. Rev. Public Health 2014, 35, 207–228. [Google Scholar] [CrossRef]
  88. Markevych, I.; Schoierer, J.; Hartig, T.; Chudnovsky, A.; Hystad, P.; Dzhambov, A.M.; de Vries, S.; Triguero-Mas, M.; Brauer, M.; Niewenhuijsen, M.J.; et al. Exploring pathways linking greenspace to health: Theoretical and methodological guidance. Environ. Res. 2017, 158, 301–317. [Google Scholar] [CrossRef]
  89. Thompson, C.W.; Roe, J.; Aspinall, P.; Mitchell, R.; Clow, A.; Miller, D. More green space is linked to less stress in deprived communities: Evidence from salivary cortisol patterns. Landsc. Urban Plan. 2012, 105, 221–229. [Google Scholar] [CrossRef] [Green Version]
  90. World Health Organization. The Global Burden of Disease: 2004 Update; World Health Organization: Geneva, Switzerland, 2008; Available online: https://apps.who.int/iris/handle/10665/43942 (accessed on 23 May 2019).
  91. McKenzie, K.; Murray, A.; Booth, T. Do urban environments increase the risk of anxiety, depression and psychosis? An epidemiological study. J. Affect. Disord. 2013, 150, 1019–1024. [Google Scholar] [CrossRef] [Green Version]
  92. Peen, J.; Dekker, J.; Schoevers, R.A.; ten Have, M.; de Graaf, R.; Beekman, A.T. Is the prevalence of psychiatric disorders associated with urbanization? Soc. Psychiatry Psychiatr. Epidemiol. 2007, 42, 984–989. [Google Scholar] [CrossRef] [Green Version]
  93. Peen, J.; Schoevers, R.A.; Beekman, A.T.; Dekker, J. The current status of urban-rural differences in psychiatric disorders. Acta. Psychiatr. Scand. 2010, 121, 84–93. [Google Scholar] [CrossRef]
  94. Romans, S.; Cohen, M.; Forte, T. Rates of depression and anxiety in urban and rural Canada. Soc. Psychiatry Psychiatr. Epidemiol. 2011, 46, 567–575. [Google Scholar] [CrossRef]
  95. Korea Forest Service. Statistics of Urban Forest; Korea Forest Service: Daejeon, Korea, 2014. [Google Scholar]
  96. Korea Forest Service. Statistics of Urban Forest; Korea Forest Service: Daejeon, Korea, 2016. [Google Scholar]
  97. Hong, S.-K.; Kim, J.-M.; Jo, H.-K.; Lee, S.-W. Monetary Valuation of Urban Forest Attributes in Highly Developed Urban Environments: An Experimental Study Using a Conjoint Choice Model. Sustainability 2018, 10, 2461. [Google Scholar] [CrossRef]
  98. Fredrickson, B.L. What good are positive emotions? Rev. Gen. Psychol. 1998, 2, 300–319. [Google Scholar] [CrossRef]
  99. Hubbard, J.; Mannell, R.C. Testing Competing Models of the Leisure Constraint Negotiation Process in a Corporate Employee Recreation Setting. Leis. Sci. 2001, 23, 145–163. [Google Scholar] [CrossRef]
  100. Daejeon Metropolitan City Home Page. Available online: https://www.daejeon.go.kr/ (accessed on 25 July 2018).
  101. Diener, E.; Wirtz, D.; Biswas-Diener, R.; Tov, W.; Kim-Prieto, C.; Choi, D.-W.; Oishi, S. New Measures of Well-Being. In Assessing Well-Being: The Collected Works of Ed Diener, 1st ed.; Diener, E., Ed.; Springer: Dordrecht, The Netherlands, 2009; Volume 39, pp. 247–266. ISBN 978-90-481-2353-7. [Google Scholar]
  102. White, M.P.; Dolan, P. Accounting for the Richness of Daily Activities. Psychol. Sci. 2009, 20, 1000–1008. [Google Scholar] [CrossRef]
  103. White, M.P.; Pahl, S.; Wheeler, B.W.; Fleming, L.E.F.; Depledge, M.H. The ‘Blue Gym’: What can blue space do for you and what can you do for blue space? J. Mar. Biol. Assoc. UK 2016, 96, 5–12. [Google Scholar] [CrossRef]
  104. Diener, E.; Larsen, R.J.; Levine, S.; Emmons, R.A. Intensity and Frequency: Dimensions Underlying Positive and Negative Affect. J. Personal. Soc. Psychol. 1985, 48, 1253–1265. [Google Scholar] [CrossRef]
  105. Arrindell, W.A.; Heesink, J.; Feij, J.A. The Satisfaction With Life Scale (SWLS): Appraisal with 1700 healthy young adults in The Netherlands. Personal. Individ. Differ. 1999, 26, 815–826. [Google Scholar] [CrossRef]
  106. Gadermann, A.M. Satisfaction with Life Scale Adapted for Children. In Encyclopedia of Quality of Life and Well-Being Research, 1st ed.; Michalos, A.C., Ed.; Springer: Dordrecht, The Netherlands, 2014; ISBN 978-94-007-0753-5. [Google Scholar] [CrossRef]
  107. Pavot, W. The validity and utility of global measures of subjective well-being. Pol. Psychol. Bull. 2013, 44, 50–58. [Google Scholar] [CrossRef]
  108. Van Beuningen, J. The Satisfaction WITH Life Scale Examining Construct Validity; Statistics Netherlands: Hague, The Netherlands, September 2012. [Google Scholar]
  109. Vassar, M. Satisfaction with Life Scale Score Reliability. In Encyclopedia of Quality of Life and Well-Being Research, 1st ed.; Michalos, A.C., Ed.; Springer: Dordrecht, The Netherlands, 2014; ISBN 978-94-007-0753-5. [Google Scholar] [CrossRef]
  110. Jackson, E.L.; Crawford, D.W.; Godbey, G. Negotiation of Leisure Constraints. Leis. Sci. 1993, 15, 1–11. [Google Scholar] [CrossRef]
  111. White, D.D. A Structural Model of Leisure Constraints Negotiation in Outdoor Recreation. Leis. Sci. 2008, 30, 342–359. [Google Scholar] [CrossRef]
  112. Jackson, E.L. Leisure constraints: A survey of past research. Leis. Sci. 1988, 10, 203–215. [Google Scholar] [CrossRef]
  113. Lyu, S.O. Using the Leisure Constraints Negotiation Process to Understand Participants’ Leisure Involvement and Benefit Realization. Ph.D. Thesis, Michigan State University, East Lansing, MI, USA, 2012. [Google Scholar]
  114. Nunnally, J. Psychometric Theory, 2nd ed.; McGraw-Hill: New York, NY, USA, 1978; ISBN 0070474656 9780070474659. [Google Scholar]
  115. Holt, E.W.; Lombard, Q.K.; Best, N.; Smiley-Smith, S.; Quinn, J.E. Active and Passive Use of Green Space, Health, and Well-Being amongst University Students. J. Environ. Res. Public Health 2019, 16, 424. [Google Scholar] [CrossRef]
  116. Dolnicar, S.; Yanamandram, V.; Cliff, K. The contribution of vacations to quality of life. Ann. Tour. Res. 2012, 39, 59–83. [Google Scholar] [CrossRef] [Green Version]
  117. Hair, J.F., Jr.; Black, W.C.; Babin, B.J.; Anderson, R.E. Multivariate Data Analysis, 7th ed.; Prentice Hall: Upper Saddle River, NJ, USA, 2010; ISBN 9780138132637. [Google Scholar]
  118. Taylor, L.; Hochuli, D.F. Creating better cities: How biodiversity and ecosystem functioning enhance urban residents’ wellbeing. Urban Ecosyst. 2015, 18, 747–762. [Google Scholar] [CrossRef]
  119. Wheeler, B.W.; Lovell, R.; Higgins, S.L.; White, M.P.; Alcock, I.; Osborne, N.J.; Husk, K.; Sabel, C.E.; Depledge, M.H. Beyond greenspace: An ecological study of population general health and indicators of natural environment type and quality. Int. J. Health Geogr. 2015, 14, 17. [Google Scholar] [CrossRef]
  120. Francis, J.; Wood, L.J.; Knuiman, M.; Giles-Corti, B. Quality or quantity? Exploring the relationship between Public Open Space attributes and mental health in Perth, Western Australia. Soc. Sci. Med. 2012, 74, 1570–1577. [Google Scholar] [CrossRef]
  121. Nordh, H.; Hartig, T.; Hagerhall, C.M.; Fry, G. Components of small urban parks that predict the possibility for restoration. Urban For. Urban Green. 2009, 8, 225–235. [Google Scholar] [CrossRef]
  122. Nordh, H.; Alaouch, C.; Hartig, T. Assessing restorative components of small urban parks using conjoint methodology. Urban For. Urban Green 2011, 10, 95–103. [Google Scholar] [CrossRef]
  123. Gatersleben, B.; Andrews, M. When walking in nature is not restorative: The role of prospect and refuge. Health Place 2013, 20, 91–101. [Google Scholar] [CrossRef]
  124. Van den Berg, A.E.; Jorgensen, A.; Wilson, E.R. Evaluating restoration in urban green spaces: Does setting type make a difference? Landsc. Urban Plan. 2014, 127, 173–181. [Google Scholar] [CrossRef]
  125. Twedt, E.; Rainey, R.M.; Proffitt, D.R. Designed Natural Spaces: Informal Gardens Are Perceived to Be More Restorative than Formal Gardens. Front. Psychol. 2016, 7, 88. [Google Scholar] [CrossRef]
  126. Beyer, K.M.M.; Kaltenbach, A.; Szabo, A.; Bogar, S.; Nieto, F.J.; Malecki, K.M. Exposure to Neighborhood Green Space and Mental Health: Evidence from the Survey of the Health of Wisconsin. Int. J. Environ. Res. Public Health 2014, 11, 3453–3472. [Google Scholar] [CrossRef] [Green Version]
  127. Cooper-Marcus, C.; Sachs, N.A. Therapeutic Landscapes: An Evidence-Based Approach to Designing Healing Gardens and Restorative Outdoor Spaces; Wiley: Hoboken, NJ, USA, 2014; ISBN 9781118231913. [Google Scholar]
  128. Ong, A.D.; Bergeman, C.S.; Bisconti, T.L.; Wallace, K.A. Psychological resilience, positive emotions, and successful adaptation to stress in later life. J. Personal. Soc. Psychol. 2006, 91, 730–749. [Google Scholar] [CrossRef]
  129. Hurley, D.B.; Kwon, P. Savoring helps most when you have little: Interaction between savoring the moment and uplifts on positive affect and satisfaction with life. J. Happiness Stud. 2013, 14, 1261–1271. [Google Scholar] [CrossRef]
  130. Lucas, R.E.; Diener, E.; Suh, E.K. Discriminant validity of well-being measures. J. Personal. Soc. Psychol. 1996, 71, 616–628. [Google Scholar] [CrossRef]
  131. Diener, E. Assessing subjective well-being: Progress and op-portunities. Soc. Indic. Res. 1994, 31, 103–157. [Google Scholar] [CrossRef]
  132. Diener, E.; Sandvik, E.; Pavot, W. Happiness is the frequency, not the intensity, of positive versus negative affect. In Subjective Well-Being: An Inter-Disciplinary Perspective; Strack, F., Argyle, M., Schwarz, N., Eds.; Pergamon Press: New York, NY, USA, 1991; Volume 21, pp. 119–139. ISBN 978-0080372648. [Google Scholar]
  133. Dzhambov, A.; Hartig, T.; Markevych, I.; Tilov, B.; Dimitrova, D. Urban residential greenspace and mental health in youth: Different approaches to testing multiple pathways yield different conclusions. Environ. Res. 2018, 160, 47–59. [Google Scholar] [CrossRef]
  134. Kamitsis, I.; Francis, A. Spirituality mediates the relationship between engagement with nature and psychological wellbeing. J. Environ. Psychol. 2013, 36, 136–143. [Google Scholar] [CrossRef]
  135. Triguero-Mas, M.; Donaire-Gonzalez, D.; Seto, E.; Valentín, A.; Smith, G.; Martínez, D.; Carrasco-Turigas, G.; Masterson, D.; Van den Berg, M.; Ambròs, A.; et al. Living Close to Natural Outdoor Environments in Four European Cities: Adults’ Contact with the Environments and Physical Activity. Int. J. Environ. Res. Public Health 2017, 14, 1162. [Google Scholar] [CrossRef]
  136. van den Berg, M.; van Poppel, M.; van Kamp, I.; Andrusaityte, S.; Balseviciene, B.; Cirach, M.; Danileviciute, A.; Ellis, N.; Hurst, G.; Masterson, D.; et al. Visiting green space is associated with mental health and vitality: A cross-sectional study in four European cities. Health Place 2016, 38, 8–15. [Google Scholar] [CrossRef]
  137. Thompson, C.W.; Aspinall, P.; Roe, J. Access to Green Space in Disadvantaged Urban Communities: Evidence of salutogenic effects based on biomarker and self-report measures of wellbeing. Procedia Soc. Behav. Sci. 2014, 153, 10–22. [Google Scholar] [CrossRef]
  138. Korpela, K.; Borodulin, K.; Neuvonen, M.; Paronen, O.; Tyrväinen, L. Analyzing the mediators between nature-based outdoor recreation and emotional well-being. J. Environ. Psychol. 2014, 37, 1–7. [Google Scholar] [CrossRef]
  139. McFarland, A.L.; Waliczek, T.M.; Zajicek, J.M. The Relationship between Student Use of Campus Green Spaces and Perceptions of Quality of Life. Horttechnology 2008, 18, 232–238. [Google Scholar] [CrossRef]
  140. Wells, N.M.; Lekies, K.S. Nature and the Life Course: Pathways from Childhood Nature Experiences to Adult Environmentalism. Child. Youth Environ. 2006, 16, 1–24. [Google Scholar]
  141. Zhang, J.W.; Howell, R.T.; Iyer, R. Engagement with natural beauty moderates the positive relation between connectedness with nature and psychological well-being. J. Environ. Psychol. 2014, 38, 55–63. [Google Scholar] [CrossRef]
  142. James, P.; Banay, R.F.; Hart, J.E.; Laden, F. A Review of the Health Benefits of Greenness. Curr. Epidemiol. Rep. 2015, 2, 131–142. [Google Scholar] [CrossRef]
  143. Verheij, R.A.; Maas, J.; Groenewegan, P.P. Urban-Rural Health Differences and the Availability of Green Space. Eur. Urban Reg. Stud. 2008, 15, 307–316. [Google Scholar] [CrossRef]
  144. Louviere, J.J.; Woodworth, G. Design and Analysis of Simulated Consumer Choice or Allocation Experiments: An Approach Based on Aggregate Data. J. Mark. Res. 1983, 20, 350–367. [Google Scholar] [CrossRef]
  145. Bancroft, C.; Joshi, S.; Rundle, A.; Hutson, M.; Chong, C.; Weiss, C.C.; Genkinger, J.; Neckerman, K.; Lovasi, G. Association of proximity and density of parks and objectively measured physical activity in the United States: A systematic review. Soc. Sci. Med. 2015, 138, 22–30. [Google Scholar] [CrossRef]
  146. Bowler, D.E.; Buyung-Ali, L.M.; Knight, T.M.; Pullin, A.S. A systematic review of evidence for the added benefits to health of exposure to natural environments. BMC Public Health 2010, 10, 456. [Google Scholar] [CrossRef]
  147. Calogiuri, G.; Chroni, S. The impact of the natural environment on the promotion of active living: An integrative systematic review. BMC Public Health 2014, 14, 873. [Google Scholar] [CrossRef]
  148. Coon, J.T.; Boddy, K.; Stein, K.; Whear, R.; Barton, J.; Depledge, M.H. Does Participating in Physical Activity in Outdoor Natural Environments Have a Greater Effect on Physical and Mental Wellbeing than Physical Activity Indoors? A Systematic Review. Environ. Sci. Technol. 2011, 45, 1761–1772. [Google Scholar] [CrossRef]
  149. Lee, A.C.K.; Maheswaran, R. The health benefits of urban green spaces: A review of the evidence. J. Public Health 2011, 33, 212–222. [Google Scholar] [CrossRef]
  150. Gobster, P.H.; Nassauer, J.I.; Daniel, T.C.; Fry, G. The shared landscape: What does aesthetics have to do with ecology? Landsc. Ecol. 2007, 22, 959–972. [Google Scholar] [CrossRef]
  151. Speake, J.; Edmondson, S.; Nawaz, H. Everyday encounters with nature: Students’ perceptions of and use of university campus green spaces. Hum. Geogr. 2013, 7, 21–31. [Google Scholar] [CrossRef]
  152. Bhattacharjee, A.; Mogilner, C. Happiness from ordinary and extraordinary experiences. J. Consum. Res. 2014, 41, 1–17. [Google Scholar] [CrossRef]
  153. Pavot, W.; Fujita, F.; Diener, E. The relation between self-aspect congruence, personality, and subjective well-being. Personal. Individ. Differ. 1997, 22, 183–191. [Google Scholar] [CrossRef]
  154. McCrae, R.R.; John, O.P. An Introduction to the Five-Factor Model and its Applications. J. Personal. 1992, 60, 175–215. [Google Scholar] [CrossRef]
  155. Bryant, F. Savoring Beliefs Inventory (SBI): A scale for measuring beliefs about savouring. J. Ment. Health 2003, 12, 175–196. [Google Scholar] [CrossRef]
  156. Oishi, S.; Diener, E.; Suh, E.K.; Lucas, R.E. Value as a moderator in subjective well-being. J. Personal. 1999, 67, 157–184. [Google Scholar] [CrossRef]
Figure 1. Spatial distributions of land use/land cover (LULC), including urban green spaces (UGS), major mountains and rivers, and the dam surrounding the city. Most urban green spaces are located on the outer rim of the city, and there are insufficient urban green spaces near residents’ homes (areas in red).
Sustainability 11 04189 g001
Figure 2. A conceptual diagram of the constraint-effect-mitigation (CEM) model (modified from [99]).
Sustainability 11 04189 g002
Figure 3. Duncan test for comparing the mean of positive affect, negative affect, and life satisfaction among groups classified by the frequency of visits to UGS within the past two weeks (positive/negative affect) and usual use (life satisfaction).
Sustainability 11 04189 g003
Figure 4. Frequency (%) of motivations for visiting UGS among heavy, moderate, and light/non-user groups.
Sustainability 11 04189 g004
Figure 5. Frequency (%) of motivations for visiting UGS among heavy, moderate, and light/non-user groups.
Sustainability 11 04189 g005
Figure 6. A structural equation model (SEM) for positive/negative affect with sociodemographic variables, access time to urban green space, visit frequency, number of motivations, and number of constraints. Numbers along the paths indicate significant standardized effects of variables (p < 0.05).
Sustainability 11 04189 g006
Figure 7. A structural equation model for life satisfaction in general with sociodemographic variables, access time to urban green space, frequency of visit, number of motivations, and number of constraints. Numbers along the paths indicate significant standardized effects of variables (p < 0.05).
Sustainability 11 04189 g007
Table 1. Sampling quota by age and gender groups.
QuotaGroupsNumber of Respondents (%)Total
Age20–2997 (24.3)400
30–3997 (24.3)
40–49110 (27.5)
50–5996 (24.0)
GenderMale200 (50.0)400
Female200 (50.0)
Table 2. Results of factor analysis with a varimax rotation and reliability test of measurement scale. Two factors (i.e., positive affect and negative affect) were extracted from the Scale of Positive and Negative Experience (SPANE), and one factor (i.e., life satisfaction in general) was extracted from the Satisfaction with Life Scale (SWLS). All of Cronbach’s α values of loaded variables were significantly higher than 0.7.
CategoryVariablesFactor 1Factor 2Cronbach’s α
Positive affectGood0.7778−0.1824
Pleasant0.8125−0.1813
Happy0.8057−0.1517
Joyful0.8103−0.18280.9176
Contended0.7302−0.1390
Positive0.7527−0.2383
Negative affectBad−0.16140.8315
Unpleasant−0.11780.7823
Sad−0.16250.7007
Afraid−0.21190.74520.9099
Angry−0.15040.7520
Negative−0.26660.7914
Life satisfaction in generalIn most ways, my life is close to my ideal.0.8777
The conditions of my life are excellent.0.8475
I am satisfied with my life.0.8567 0.9374
So far, I have gotten the important things I want in life.0.8751
If I could live my life over, I would change almost nothing.0.8403
Table 3. Frequency of visits and amount of time spent in the UGS within the past two weeks and usual use.
VariablesPast Two WeeksUsual Use
GroupPercent of Respondent (%)GroupPercent of Respondent (%)
Number of visitsAlmost everyday1.5Almost everyday2.3
5–6 times/week0.34–6 times/week2.3
3–4 times/week7.21–3 times/week23.0
1–2 times/week23.81–3 times/month30.8
1 time/2 weeks19.81–3 times/year27.5
No visit47.51 time/years4.5
No visit9.8
Total100.0%Total100.0
Amount of time spent *Less than 1 h28.6Less than 1 h25.2
1–2 h47.11–2 h44.9
2–3 h18.62–3 h23.3
3–4 h4.33–4 h5.5
4–5 h1.04–5 h0.6%
More than 5 h0.5More than 5 h0.6
Total *100.0%Total *100.0
* 190 and 39 non-visitors were excluded from the data under the past two weeks and usual use, respectively.
Table 4. Segmented respondent groups by frequency of visit and amount of time spent in UGS.
VariablesPositive Affect/Negative Affect 1Life Satisfaction 2
GroupClassification CriteriaPercent of Respondents (%)GroupClassification CriteriaPercent of Respondents (%)
Number of visitsHeavy user group1 or more times/week32.8Heavy user group1 or more times/week27.5
Moderate user group1 time/2 weeks19.8Moderate user group1–3 times/month30.8
Non-user groupNo visit47.5Light & Non-user group1–3 times/year, and no visit41.8
Total 100Total 100
Amount of time spentLong stay groupmore than 2 h/visit24.3Long stay group2 h or more/visit29.9
Medium stay group1–2 h/visit47.1Medium stay group1–2 h/visit44.9
Short stay groupless than 1 h/visit28.6Short stay groupless than 1 h/visit25.2
Total 3 100Total 3 100
1 Past two weeks, 2 usual use, 3 190 and 39 non-visitors were excluded from affective components and life satisfaction, respectively.
Table 5. The results of ANOVA for testing the possible presence of interaction effects between the frequency of visits and time spent in UGS.
CategoryVariabledfSSMSF-Valuep-Value
Positive affectFrequency of visits10.19350.19350.510.4766
Time spent22.19491.09742.880.0582
Interaction20.98830.49411.300.2751
Negative affectFrequency of visits10.79080.79081.640.2019
Time spent20.25700.12850.270.7665
Interaction20.35310.17660.370.6940
Life satisfactionFrequency of visits210.11235.05612.920.0554
Time spent20.51460.25730.150.8621
Interaction42.53480.63370.370.8331
df = degrees of freedom, SS = sum of squares and MS = mean squares.
Table 6. The analyses of variance for positive affect, negative affect, and life satisfaction in general due to the frequency of visits and amount of time spent in UGS.
CategoryVariabled.f.SSMSF-Valuep-Value
Positive affectFrequency of visits212.00516.002515.11<0.0001
Time spent22.19491.09742.880.0582
Negative affectFrequency of visits212.07516.037511.68<0.0001
Time spent20.25700.12850.270.7659
Life satisfactionFrequency of visits216.02618.01304.700.0096
Time spent20.51460.25730.150.8626
Table 7. Summary of the estimated model fit. All recommended goodness-of-fit indexes of the estimated affect and life satisfaction models were in the acceptable range.
Goodness-of-Fit IndexCriteriaAffect ModelLSG * Model
Probability of Χ2p < 0.05<0.00<0.00
Goodness-of-fit index (GFI)>0.900.930.94
Adjusted goodness-of-fit index (AGFI)>0.800.910.91
Comparative fit index (CFI)>0.900.950.94
Root mean square error of approximation (RMSEA)<0.080.050.07
Normed fit index (NFI)>0.900.920.92
Parsimony normed fit index (PNFI)>0.600.790.74
* LSG = life satisfaction in general.