Article

Roles of Climate Change and Increasing CO2 in Driving Changes of Net Primary Productivity in China Simulated Using a Dynamic Global Vegetation Model

1
International Institute for Earth System Science, School of Geography and Ocean Sciences, Jiangsu Provincial Key Laboratory of Geographic Information Science and Technology, Nanjing University, Nanjing 210023, China
2
Jiangsu Center for Collaborative Innovation in Geographic Information Resource Development and Application, Nanjing 210023, China
3
School of Public Administration, Nanjing University of Finance & Economics, Nanjing 210023, China
*
Author to whom correspondence should be addressed.
Sustainability 2019, 11(15), 4176; https://doi.org/10.3390/su11154176
Submission received: 24 June 2019 / Revised: 28 July 2019 / Accepted: 31 July 2019 / Published: 2 August 2019

Abstract

:
Net primary productivity (NPP) is the key component of the terrestrial carbon cycle, and terrestrial NPP trends under increasing CO2 and climate change in the past and future are of great significance in the study of the global carbon budget. Here, the LPJ-DGVM was employed to simulate the magnitude and pattern of China’s terrestrial NPP using long-term series data to understand the response of terrestrial NPP to increasing CO2 concentration and climate change. The results showed that total NPP of China’s terrestrial ecosystem increased from 2.8 to 3.6 Pg C yr−1 over the period of 1961–2016, with an annual average of 3.1 Pg C yr−1. The average NPP showed a gradient decrease from the southeast to northwest. Southwest China and Northwest China, comprising mostly arid and semi-arid regions, exhibited the largest increase rate in total NPP among the six geographical regions of China. Additionally, large interannual variability around the NPP trends was presented, and NPP anomalies in China’s terrestrial ecosystem are strongly associated with the El Niño-Southern Oscillation (ENSO). Southwest China made the largest contribution to the interannual variability of national total NPP. The total NPP of China’s terrestrial ecosystem continuously increased with the concurrent increase in the CO2 concentration and climate change under different scenarios in the future. During the period from 2091 to 2100, the average total NPP under the A2 and RCP85 scenarios would reach 4.9 and 5.1 Pg C yr−1 respectively, higher than 4.2 and 3.9 Pg C yr−1 under the B1 and RCP45 scenarios. Forests, especially temperate forests, make the largest contribution to the future increase in NPP. The increase in CO2 concentration would play a dominant role in driving further NPP increase in China’s terrestrial ecosystems, and climate change may slightly attenuate the fertilization effect of CO2 on NPP.

1. Introduction

The increase rate of CO2 in the 20th century was faster than any stages during the past 22000 years [1]. According to observed data from Mauna Loa, Hawaii, USA, the mean CO2 concentration reached 408.3 ppm in 2018, which was an increase of 29% compared to the observed value (316.0 ppm) in 1959 and an increase of 45% compared to the value (277 ppm) in the pre-industrial period. Global CO2 emissions are still increasing sharply. The cumulative CO2 emissions from anthropogenic sources reached 615 ± 80 Pg C between 1870 and 2017; of these emissions, 425 ± 20 Pg C was from fossil fuel and industrial processes and 190 ± 75 Pg C was from deforestation and other land use changes [2]. Approximately half of these CO2 emissions remained in the atmosphere over the long term (250 ± 5 Pg C, 41%); others were sequestered by terrestrial ecosystems (190 ± 50 Pg C, 31%) and ocean ecosystems (150 ± 20 Pg C, 4%), while the fate of 4% (25 Pg C) of CO2 emissions is unknown. The retention of CO2 in the atmosphere causes an increase in the CO2 concentration and has become one of the main drivers for global warming.
Net primary productivity (NPP) is the net carbon fixed by plants through photosynthesis. It quantifies the conversion of atmospheric CO2 into plant biomass, and is identified as a key variable for sustainability [3,4], biodiversity [5] and environmental degradation (e.g., desertification, deforestation) [6,7]. In recent years, carbon sequestration in terrestrial ecosystem has an uptrend and great interannual variability [8,9,10]. However, there were large uncertainties in the current estimates of terrestrial carbon sinks due to the complexity and diversity of terrestrial ecosystems. The terrestrial carbon sink is the residual of NPP minus heterotrophic respiration. Therefore, accurate estimation of NPP is the prerequisite for constraining the uncertainties in estimated terrestrial carbon sinks.
China covers a vast land area, i.e., 9.6 million km2, and the regional climate is dominated by Asian monsoon, with diverse climate types ranging from tropical to cold-temperate and from humid to extremely dry [11]. China has experienced explosive economic growth in recent decades; this growth has been detrimental to the environment through land-use change, consumption of resources, and pollution. The extensive economy led to the largest annual CO2 emissions in the world, and a series of policies on climate change and CO2 emissions, such as adjustments in the energy structure, improvements in the energy efficiency, and reforestation [12], have been implemented to achieve global emission-reduction targets. Therefore, China is one of the most critical and sensitive regions in the global climate system, and studies of NPP and its dynamics in China are helpful for improving our understanding of the carbon balance at both the regional and global scales.
A number of studies have been conducted to examine the magnitude and pattern of NPP in China with statistical model [13], light use efficiency models [14,15,16,17,18], and process-based biogeochemical models [19,20,21,22,23,24,25]. These estimates of total NPP in China range from 1.44 to 4.64 Pg C yr−1, owing to differences in model structure, parameters, and input data. Large uncertainties were still present in the estimation of the total NPP in China. Total NPP in China presented increasing trend in recent years [11,19,24,26], where the total NPP changed obviously, and the reasons for this are still unclear. In addition, a few studies have been conducted to investigate the response of terrestrial NPP to different future scenarios of climate change and increasing CO2 in China. Therefore, the assessment of long-term trends in the magnitude and patterns of terrestrial NPP in China was one of the objectives of this study.
Climatic extremes, such as droughts and heat waves, have significant impacts on NPP. In parallel with global warming, climatic extremes occurred much more frequently in recent years in China, for example, the low temperature freezing in early 2008 [27], severe national droughts in 2011[28] and six consecutive years of spring droughts in Yunnan province since 2009 and so on. These extremes might be related to EI Niño-Southern Oscillation (ENSO) [29]. The ENSO is a coupled ocean-atmosphere phenomenon and characterized by irregular fluctuations between warming and cooling of sea surface temperature (SST) in tropical eastern Pacific (EP) or central pacific (CP) every 2−7 years. The warming and cooling anomalies are known as EI Niño and La Niña events, respectively. ENSO is a major driver for interannual and seasonal anomalies of regional and even global climates [29,30]. A number of studies have indicated that precipitation and temperature anomalies caused by the ENSO have large impacts on NPP of terrestrial ecosystems [9,31,32,33,34]. For instance, the transition from EI Niño to La Niña during 1997–1998 caused a reduction of terrestrial NPP in eastern Africa related to decreased precipitation [31]. The prevalent La Niña since 2010 caused up to six consecutive seasons of increased precipitation in Australia, which resulted in a remarkable increase in terrestrial ecosystem carbon sequestration in 2011 [34]. The global gross primary productivity (GPP) changed concurrently with ENSO, and GPP anomalies were more strongly associated with the ENSO than La Niña [9]. However, the influence of ENSO on terrestrial NPP in China has not been well investigated. Analyzing the linkage between total NPP of terrestrial ecosystems in China and ENSO was also one of the objectives of this study.
CO2 fertilization induces global warming and concurrently enhances vegetation growth. For example, 12 free air CO2 enrichment (FACE) experiments in different global regions indicated that CO2 increases of 50% would cause NPP increases of 12% [35]. However, CO2 fertilization effect may be limited by various factors, such as water availability [36]. Positive effects of CO2 fertilization in arid and temperate grassland ecosystems appeared in sufficient water conditions [37]. Furthermore, effects of CO2 fertilization was influenced by the precipitation at different times of year. Increasing spring precipitation would promote the effects of CO2 fertilization, while increasing non-spring precipitation would inhibit this effect [38]. At the same time, warmer climatic conditions resulting from increasing CO2 may increase vegetation moisture stress [9] and attenuate the direct positive effects of CO2 increase on NPP, especially in semi-arid ecosystem [37]. Compared with the averaged total NPP from 2000–2012, climate change alone simulated by the LPJ model would reduce global terrestrial NPP by 12.5% and 7.5% under A2 and RCP85 scenarios during the period of 2091–2100, respectively [39]. The extent to which CO2 fertilization and climate change affect terrestrial NPP in China is unclear; examining this question is another objective of this study.

2. Materials and Methods

2.1. LPJ Model

As a tool used in this study, the Lund-Potsdam-Jena dynamic global vegetation model (LPJ) is a process-based, coupled, non-equilibrium biogeography-biogeochemistry model, which has adopted many features from the BIOME family of models [40,41]. This model defines 10 different plant functional types (PFTs) to describe the vegetation composition in each grid cell. Each PFT has different forms of vegetation phenology (evergreen, summergreen and raingreen), leaf shape (broad-leaved and needle-leaved), climate zone (tropical, temperate and boreal), and photosynthetic pathway (C3 and C4). Different bioclimatic and biochemical parameters are set to account for the variety of structure and functioning among vegetation types. Key ecosystem processes such as vegetation growth, carbon allocation, resource competition, mortality, population establishment, fire disturbance, and litter decomposition are represented in the model to simulate the terrestrial vegetation dynamics and exchanges of carbon and water between the land and atmosphere. Details about the LPJ model can be found in [42,43]. Now, the LPJ model has been widely used to calculate the global carbon budget [2], to assess the impact of plant water balance on agriculture [44,45], to quantify the impact of climate change on agriculture productivity [46], and to estimate the bioenergy production potential [47]. It has acted as a tool to identify the contribution of permafrost soil to the global carbon budget [48] and to investigate the influence of fire on the terrestrial carbon cycle [49] and the regulation of the nitrogen cycle on the dynamic global vegetation, hydrology, and crop growth [50].

2.2. Input Data

The LPJ model was driven by meteorological data, annual CO2 data, and soil texture data. Monthly fields of mean meteorological data, including monthly mean air temperature, precipitation, cloud cover, and the number of wet days at a spatial resolution of 0.5° × 0.5° from 1901 to 2016, were taken from the Climate Research Unit (CRU), University of East Anglia, called CRU TS3.25 [51,52]. The annual historical global atmospheric CO2 data from 1901 to 1958 were obtained from the Carbon Cycle Model Linkage Project [53,54], which was extended to 2016 using the atmospheric CO2 data from the Mauna Loa observatory. The soil texture data were retrieved from the FAO soil data set [55,56,57].
This study also used outputs from two climate models (National Center for Atmospheric Research-Community Climate System Model (NCAR-CCSM) and the National Centre for Meteorological Research-Coupled Model (CNRM-CN)) under four IPCC SRES emission scenarios (AR4 A2 & B1 scenarios and AR5 RCP45 & RCP85 scenarios) to investigate the impacts of future climate and CO2 changes on NPP of terrestrial ecosystems in China. Eight future climate scenarios (Table 1) from CMIP3 and CMIP5 (Coupled Model Intercomparison Project Phase 5) were used to generate the future climates of 2017–2100.
The monthly fields of mean temperature, precipitation, and cloud cover in CMIP3 and CMIP5 during 2001–2100 were downloaded from the World Data Center for Climate (https://cera-www.dkrz.de/WDCC/ui/cerasearch/) and the LASG (http://www.lasg.ac.cn/), respectively. All the data were interpolated into 0.5° × 0.5° grids. The monthly wet days from 2001 to 2100 were calculated with projected precipitation and historical averages of monthly precipitation and wet days [51] as follows:
w e t = ( p r e * w e t ¯ 1 0.45 p r e ¯ ) 0.45
where pre is the monthly precipitation in the future, p r e ¯ is the historical mean monthly precipitation, and w e t ¯ is the historical mean number of monthly wet days.
To adjust for climate model bias, the additive departures of projected temperature and multiplicative departures of projected precipitation were calculated to produce time series of the future climates for each grid during 2017–2100 [22]. Departures of projected temperature and precipitation were estimated according to anomalies of projected climates in CMIP3 during 2001–2016 and CMIP5 during 2006–2016 relative to historical climates from CRU TS3.25 during 2001–2016. The time series of the mean annual temperature (MAT) and mean annual precipitation (MAP) over China are shown in Figure 1. Overall, the MAT in China obviously increases, while the MAP has no clear tendency. The MAT in China changed from 6.36 °C to 8.24 °C during 1961–2016, with an average of 7.21 ± 0.48 °C and an increase rate of 0.024 °C∙yr−1. The increasing rates (average of NCAR and CNRM outputs) of the MAT under the A2 and RCP85 scenarios were 0.053 °C∙yr−1 and 0.054 °C∙yr−1 during 2017–2100, respectively, which were significantly larger than those under the B1 (0.013 °C yr−1) and RCP45 (0.022 °C yr−1) scenarios. The MAP in China changed from 563 mm to 721 mm during 1961–2016, with an average of 631 ± 32mm. There were large interannual fluctuations in MAP during 2017–2100 in the different models, especially under the AR4 scenario.
The data set of the global CO2 concentration under the IPCC AR4 and AR5 scenarios during 2017–2100 were downloaded from the IPCC DDC (http://www.ipcc-data.org/) and RCP Database (http://www.iiasa.ac.at/web-apps/tnt/RcpDb), respectively. The average of the references estimated from the ISAM and BERN-CC models was used in AR4. The CO2 concentrations under the AR4 and AR5 scenarios over 10 years were interpolated into yearly CO2 concentration values using the Fourier-fitting method. The results are shown in Figure 2. The observed CO2 concentration increased from 317.64 ppm in 1961 to 404.21 ppm in 2016, with an annual rate of 1.52 ppm. Under the AR5 RCP85 scenario (AR5_RCP85), the CO2 concentration increased to 935.87 ppm in 2100, which was the highest for the scenario without the inclusion of climate policy [58]. This scenario was followed by the AR4 A2 scenario (AR4_A2), with a value of 846 ppm in 2100. B1 (AR4_B1) and RCP45 (AR5_RCP45) are the medium stabilization scenarios, and the CO2 concentration increased to 544.50 ppm and 538.36 ppm in 2100, respectively.

2.3. Modelling Protocol

The LPJ simulation starts from ‘bare ground’ and ‘spins up’ for 1000 model years until an approximate equilibrium has been reached with respect to the carbon pools and vegetation cover [42]. In this study, the LPJ model was driven with CRU data and CO2 from 1901 to 1930 to spin up for 1000 model years; then, the standard simulation was run from 1901 to 2016. By comparing the simulated spatial distribution of the PFTs with the land cover maps of China (http://www.resdc.cn) in 2000, we revised the model parameters and repeated the above process until the simulated PFT spatial distribution was in general agreement with the land cover of China [23].
The calibrated model was applied to simulate the NPP of China over the period from 1901 to 2100 at a spatial resolution of 0.5° × 0.5°. The historical (1901–2016) climate and 8 future climate scenarios (2017–2100) were used together with the corresponding CO2 to drive the model. Furthermore, we conducted two control experiments to analyze the influences of only climate change and only increasing CO2 on NPP in the future. In one control experiment, only climate would change in the future, while the CO2 concentration was set to at the observed value in 2016. In another experiment, only CO2 would change in the future while the climate was set to a random climate in 2007–2016. Configurations of historical and future climate and CO2 in different simulations are listed in Table 2.

3. Results and Discussion

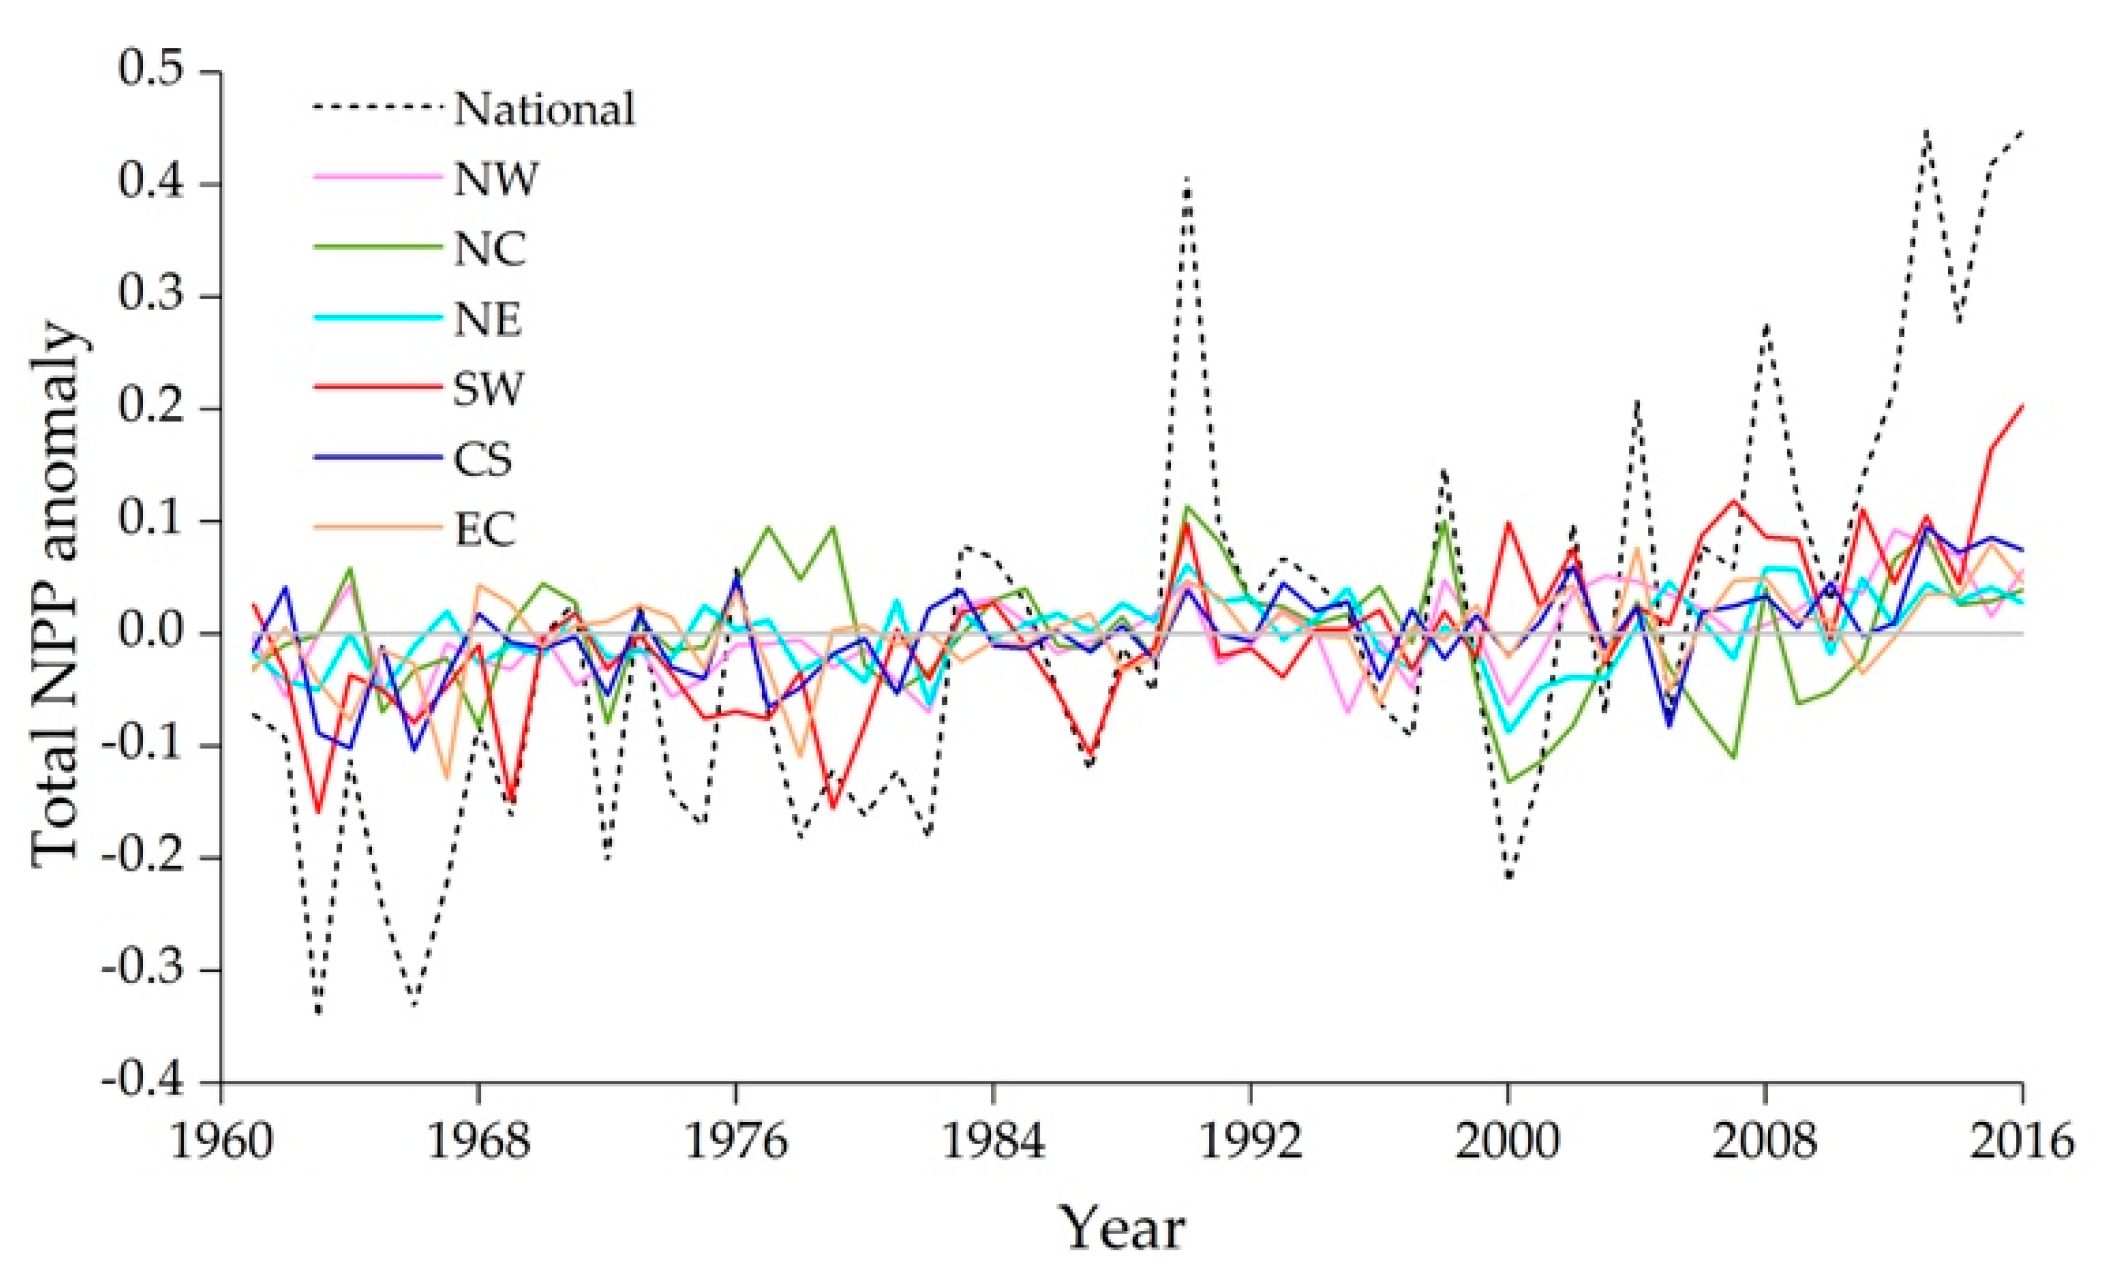
3.1. Temporal Trends of Terrestrial NPP in China and Linkage with ENSO

The national total simulated NPP in China changed with fluctuations, from 2.8 Pg C yr−1 to 3.6 Pg C yr−1, over the period of 1961–2016 (Figure 3), with an average of 3.1 ± 0.2 Pg C yr−1. Total NPP increased at a rate of 0.0076 Pg C yr−1 since 1961. Based on the mean of 251 published global terrestrial NPP estimates from 1862 to 2011 by Ito [7], the total NPP of China accounted for approximately 5.52% of the global total NPP (mean of 251 estimates: 56.2 Pg C yr−1).
The annual total NPP demonstrated distinct trends in different stages during 1961–2016. The average NPP over the periods of 1961–1980, 1981–2000, and 2001–2016 were 2.98 ± 0.11 Pg C yr−1, 3.11 ± 0.14 Pg C yr−1, and 3.27 ± 0.18 Pg C yr−1, respectively, and increased at rates of 0.0049 Pg C yr−1, 0.0006Pg C yr−1, and 0.0306 Pg C yr−1 in these periods. The increasing rate of national total NPP was higher in the period of 2001–2016 than those in the periods of 1961–1980 and 1981–2000. Meanwhile, larger interannual fluctuations were observed during 1981–2000. In the period of 1991–2000, the total NPP declined with fluctuations.
The analyzing linkage of total NPP with ENSO was made to explain the interannual fluctuations of terrestrial NPP in China. The magnitude and pattern of precipitation in eastern China during summer and winter were greatly affected by the ENSO [59,60,61]. For example, during the development stage of the ENSO, deficient precipitation occurred over most of eastern China, with as much as 30%–50% decreases in precipitation in some areas. In contrast, abundant precipitation was observed in the Yangtze-Huai Plain. During the attenuation stage of the ENSO, precipitation mostly increases in the area of the middle-lower Yangtze plains and declines in the Yellow River basin and in northern, southern, and southwestern China [59]. Such ENSO-induced anomalies of precipitation would definitely affect NPP. Tao [62] found that NPP in China declined remarkably in some EI Niño years.
Since 1951, 14 global EI Niño events have been recorded, and the EI Niño events in 1982/1983, 1997/1998, and 2015/2016 were “super level”. In addition, the EI Niño events in 1965/1966, 2004/2005, 2009/2010, and 2015/2016 were CP EI Niño, while others were EP EI Niño [29]. We used MEI provided by NOAA-CPC to define the ENSO events [63], and associated these events with NPP in China during 1961–2016. As shown in Figure 3, the terrestrial NPP of China declined remarkably in the EP EI Niño years and increased in the CP EI Niño years. Before 2000, all ENSO events were EP EI Niño except for the events in 1965/1966, and the total NPP simulated by the LPJ model had relatively low values in these ESNO years. After 2000, the ENSO events were mostly CP EI Niño, and the total NPP had relatively high values in these ESNO years. Additionally, the NPP often increased in the La Niña year. However, continuous La Niña events (1973–1975, 1998–2000) might induce NPP to decrease.

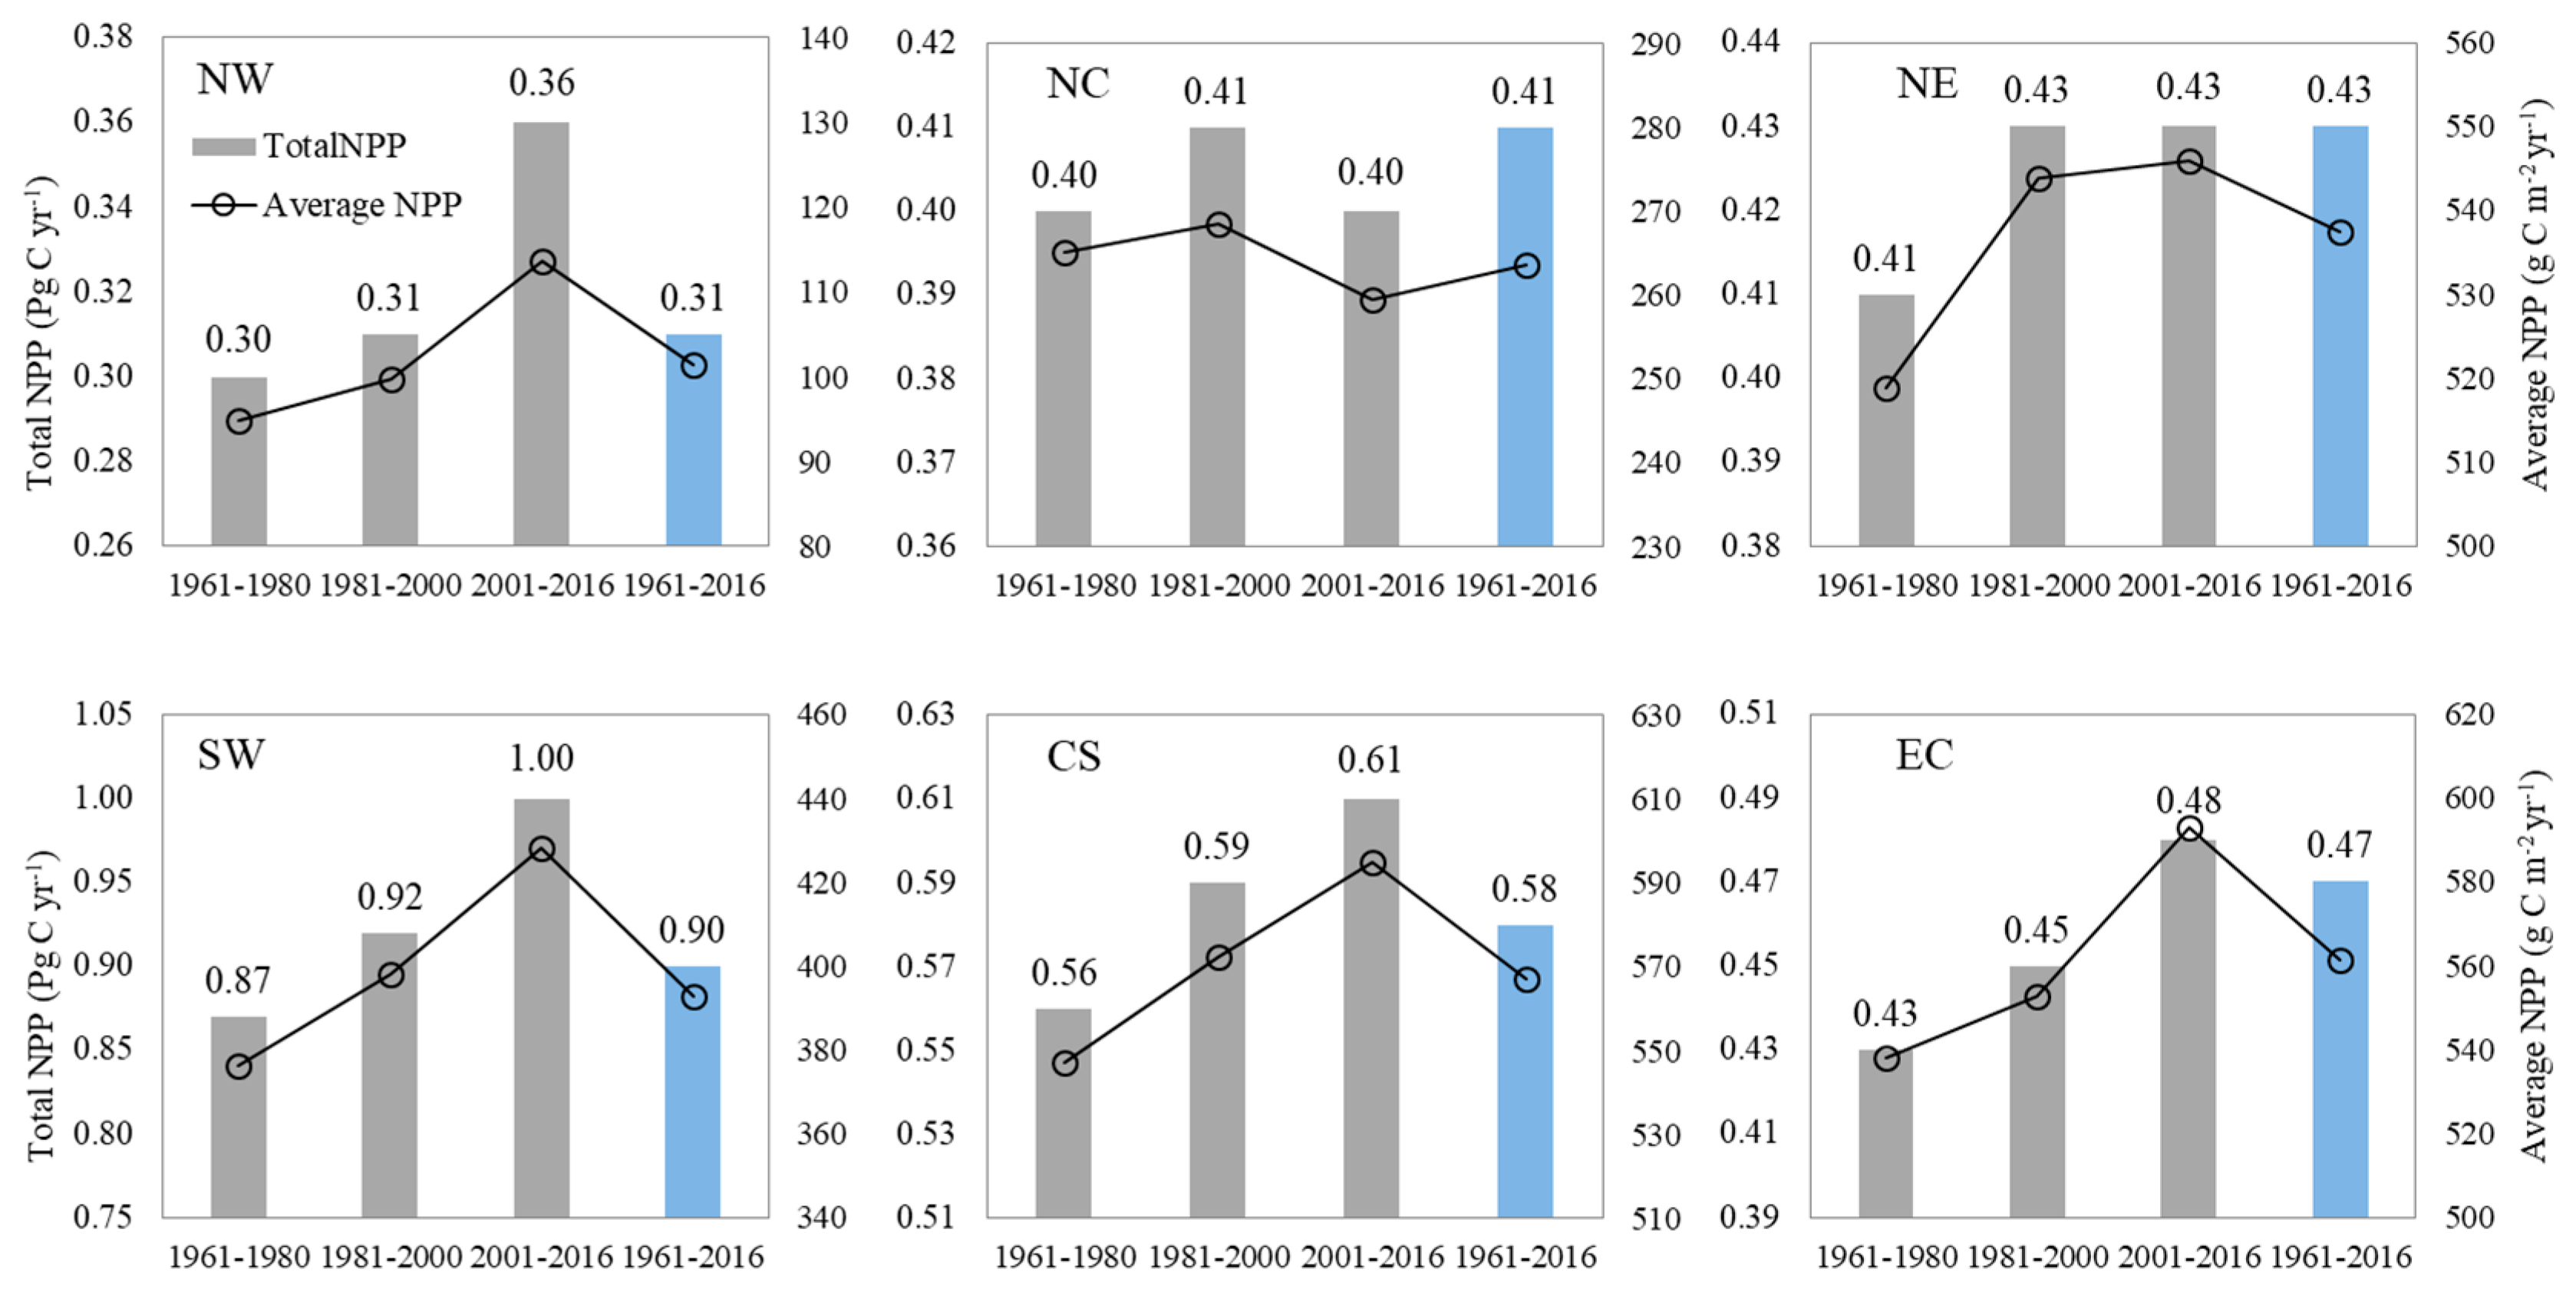
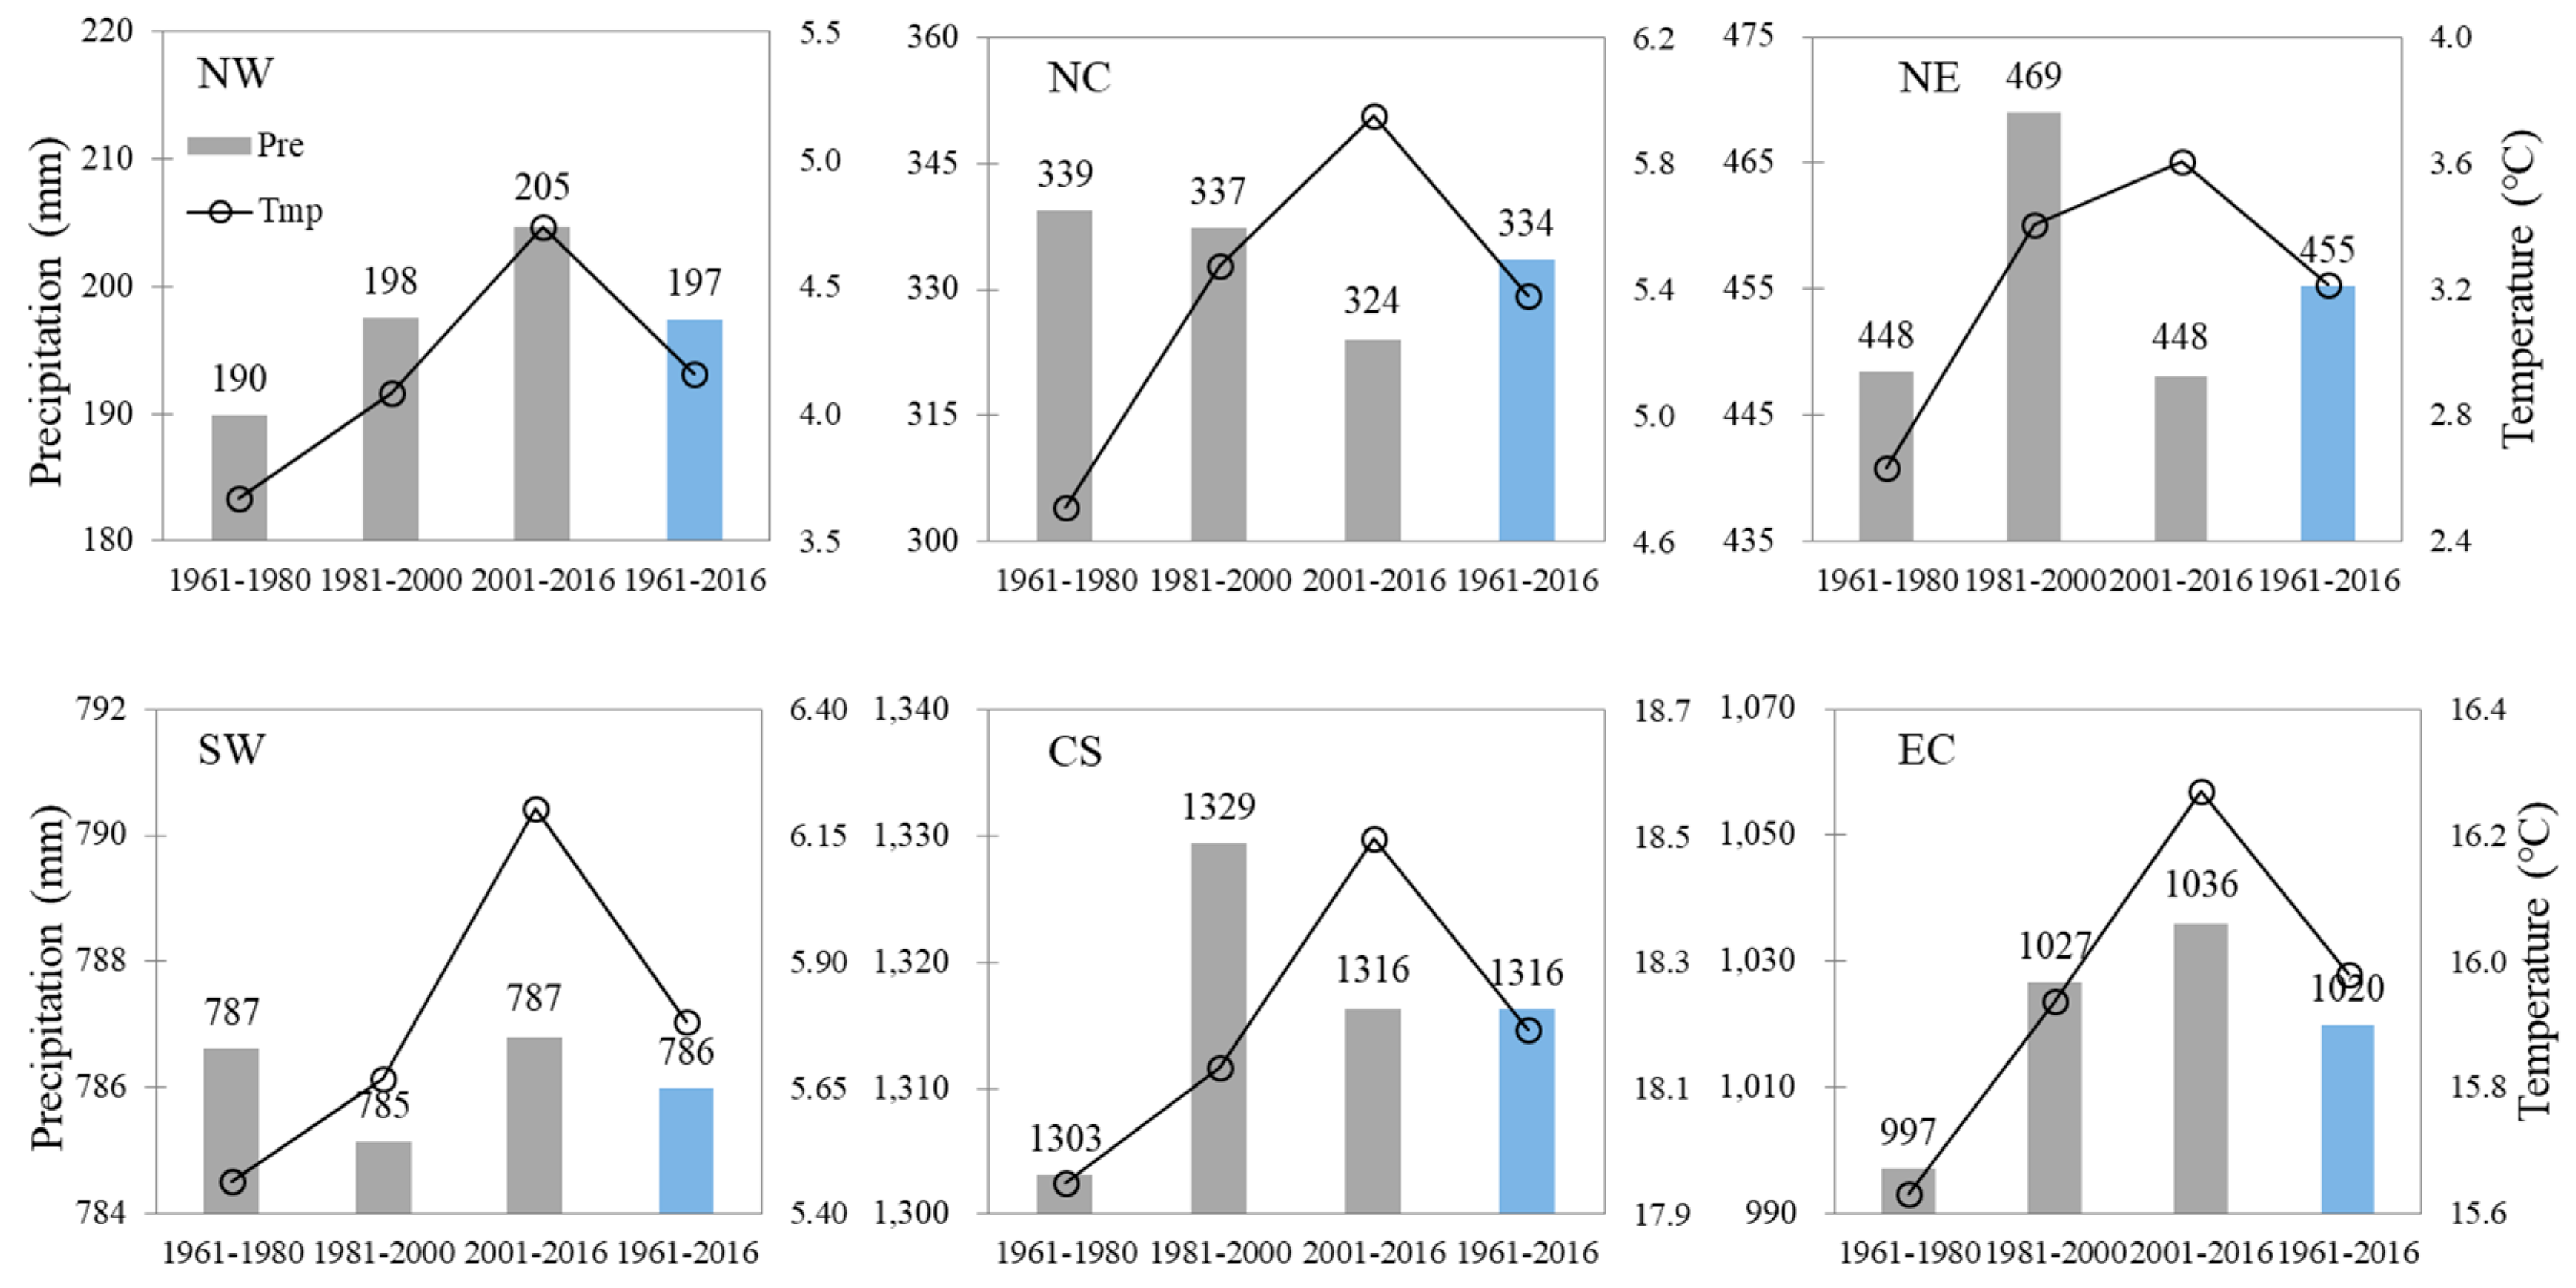
3.2. Spatial Pattern of Terrestrial NPP in China

National average NPP in China was 322.05 g C m−2 yr−1 over the period of 1961–2016. As shown in Figure 4, NPP in China showed a gradient decreasing from the southeast to the northwest. The annual NPP was mostly below 50 g C m−2 yr−1 in extensive areas of Northwest China and western areas of Inner Mongolia covered with desert or the Gobi. In these areas, the climate is characterized by low temperatures and scarce precipitation. In the Greater and Lesser Xing’an and Changbai mountain areas of Northeast China, temperate needle forests or temperate deciduous broad-leaved forests are extensively distributed, and the annual NPP was in the range of 500 to 600 g C m−2 yr−1. Southwest, South central and East China lie in the subtropical monsoon climate zone, where abundant precipitation and warm temperatures are suitable for vegetation growth. The annual NPP in these areas was above 500 g C m−2 yr−1. Among these areas, Hainan province had the highest NPP, i.e., above 800 g C m−2 yr−1, in which tropical rain forests and monsoon forests were widely distributed. In the Yunnan-Guizhou Plateau, the Hengduan mountains areas, and the southeastern coastal areas, the vegetation types were mixed with tropical rain forests, subtropical evergreen broad-leaved forests and temperate transitional forests, and the NPP ranged from 600 to 700 g C m−2 yr−1.
In addition, the northeastern Plain and North China Plain are major grain crop and economic crop production areas of China. Temperature and precipitation are colimiting factors of vegetation growth, and the annual NPP here ranged from 200 to 400 g C m−2 yr−1. The Sichuan Basin is also a well-developed agricultural area with suitable climate conditions for plant growth, and the mean NPP was in the range of 400–500 g Cm−2 yr−1. The Qinghai-Tibetan Plateau and Inner Mongolian Plateau are major pasture areas of China, where precipitation is the major limiting factor affecting vegetation growth. The mean NPP was in the range of 200–400 gCm−2 yr−1.
The total NPP varied greatly in different regions of China. Totals and averages of NPP were calculated for six geographical regions for the periods of 1961–1980, 1981–2000, 2001–2016, and 1961–2016 (Figure 5). Northwest China had the largest area (32.37% of the national total) but the lowest total NPP among the six geographical regions. The total NPP and average NPP in Northwest China were 0.31Pg C yr−1 (9.68% of the national total) and 101.43 g C m−2 yr−1, respectively, and both were much lower than those in other regions. Southwest China had the greatest portion of the national total NPP (0.90 Pg C yr−1, 29.05% of the national total) due to the second largest area (24.41% of the national total) and high average NPP (392.84 g C m−2 yr−1). South-central China had the highest average NPP (566.98 g C m−2 yr−1). Total NPP here was 0.58 Pg C yr−1. These regions were followed by East China, Northeast China and North China in the contribution to national total NPP. The total NPP in these three regions was 0.47, 0.43, and 0.41 Pg C yr−1, respectively, and their average NPP was 561.45, 537.38 and 263.69 g C m−2 yr−1.
The transient trends of annual NPP in six geographical regions of China averaged over the periods of 1961–1980, 1981–2000, and 2001–2016 are shown in Figure 5. The total NPP showed gradually increasing trends in Northwest China, Southwest China, South-central China, and East China. Especially in Northwest China and Southwest China, the total NPP over the period of 2001–2016 increased by 20.00% and 16.05%, respectively, compared with that during 1961–1980. However, the total NPP in Northeast China and North China had no significant trend.
As shown in Figure 6, the temperatures increased in six regions of China over the periods of 1961–1980, 1981–2000, and 2001–2016, while precipitation showed distinguishable differences. Generally, an increase (decrease) in precipitation caused an increase (decrease) in total NPP in Northwest China, East China, and North China, but a decrease in precipitation in South-central China, which located in humid areas, didn’t cause a decrease in total NPP. Temperature played an important role in the increasing NPP in high altitude regions such as Southwest China.
Distinguishable difference in total NPP trends in six geographical regions led to the interannual variability (IAV) of terrestrial NPP in China from 1961 to 2016. An index [9] was used to assess the contribution of individual regions to the national total NPP IAV.
f i = t N P P i , t | N P P t | N P P t t | N P P t |
where NPPi,t is the total NPP anomaly (departure from the average NPP from 1961 to 2016 in this study) for region i at time t (in years in this study), NPPt is the national total NPP anomaly, and |NPPt| is the absolute national total NPP anomaly. fi values are in the range of 0–1; a higher fi indicates a larger contribution to the national total NPP anomaly.
NPP anomalies of six geographical regions are shown in Figure 7. Southwest China was found to make the largest contribution (30.32%) to the national total NPP IAV, followed by South-central China (18.81%); the two regions contributed nearly 50% to the national total NPP IAV. Northwest China (13.98%), East China (13.50%), Northeast China (11.96%), and North China (11.43%) played a similar role in regulating national total NPP IAV.

3.3. Comparison with Previous Studies

Table 3 shows the total NPP of China reported previously and in this study. Reported total NPP ranged from 1.44 to 4.64 Pg C yr−1. The total NPP simulated by the CASA model ranged from 1.44 to 2.93 Pg C yr−1; several estimates were lower, ranging from 1.44 to 1.95 Pg C yr−1 [14,15,16]. The low total NPP output from the CASA model was possibly caused by the undervalue of maximum light use efficiency for some types of vegetation in China [64]. NPP simulated by the CASA model linearly changes with this parameter. Gao [65] analyzed the estimates of total NPP in China’s terrestrial ecosystems based on process-based models and remote sensing driven models in a meta-analysis, and the total NPP of these estimates averaged 2.83 ± 0.83 Pg C yr−1. Additionally, large interannual variability of NPP exhibited in these estimates. Most of the estimates showed that total NPP peaked in 1990, and that valleys of NPP appeared in 1992 and 1997, similar to our results. The average total NPP of China in this study was 3.10 ± 0.2 Pg C yr−1 during 1961–2016, higher than estimates of most previous studies. It should be kept in mind that the NPP estimated by the LPJ model is potential one, which is higher than actual NPP.
The Eddy Covariance (EC) technique has been widely used to measure the carbon and water fluxes at the ecosystem scale [70,71,72], and EC observations have also been used to assess the ecosystem models. The simulated annual GPP was validated with the flux data during the period of 2003–2010 summarized by Yu et al. [71]. As shown in Table 4 and Figure 8, the LPJ model performed well in simulating forest GPP, and the average error was 8.14% across 10 forest sites. At the DHS site located in Guangdong province, the vegetation type is subtropical evergreen broad-leaved forest, and the GPP here was overestimated by 42.91% compared with the observed value. In contrast, in the XSBN site of south Yunan, the vegetation is tropical rain forest, and the simulated GPP here was underestimated by 13.76%. The simulated GPP was obviously lower tower measurements at all cropland sites since cropland is not explicitly defined as a PFT, and was treated as grassland in the LPJ model. In China, intensive management, such as fertilizer application, the introduction of new varieties, and irrigation, enhance GPP. These mechanisms were not represented in the LPJ model. In grasslands and wetlands, the simulated GPP was overestimated. The mismatch of model spatial resolution and footprints of flux towers was one of the major reasons for the discrepancy between simulated and observed GPP. The spatial resolution in our simulations was 0.5° × 0.5°, while the footprints of flux towers were just a few square kilometers. The human-induced land cover change and spatial heterogeneity of climate and soil within 0.5° × 0.5° grids were not considered in the current study, which would at least partially explain the departure of simulated GPP from observations. Overall, the LPJ model was able to capture GPP variations among different sites (Figure 6).

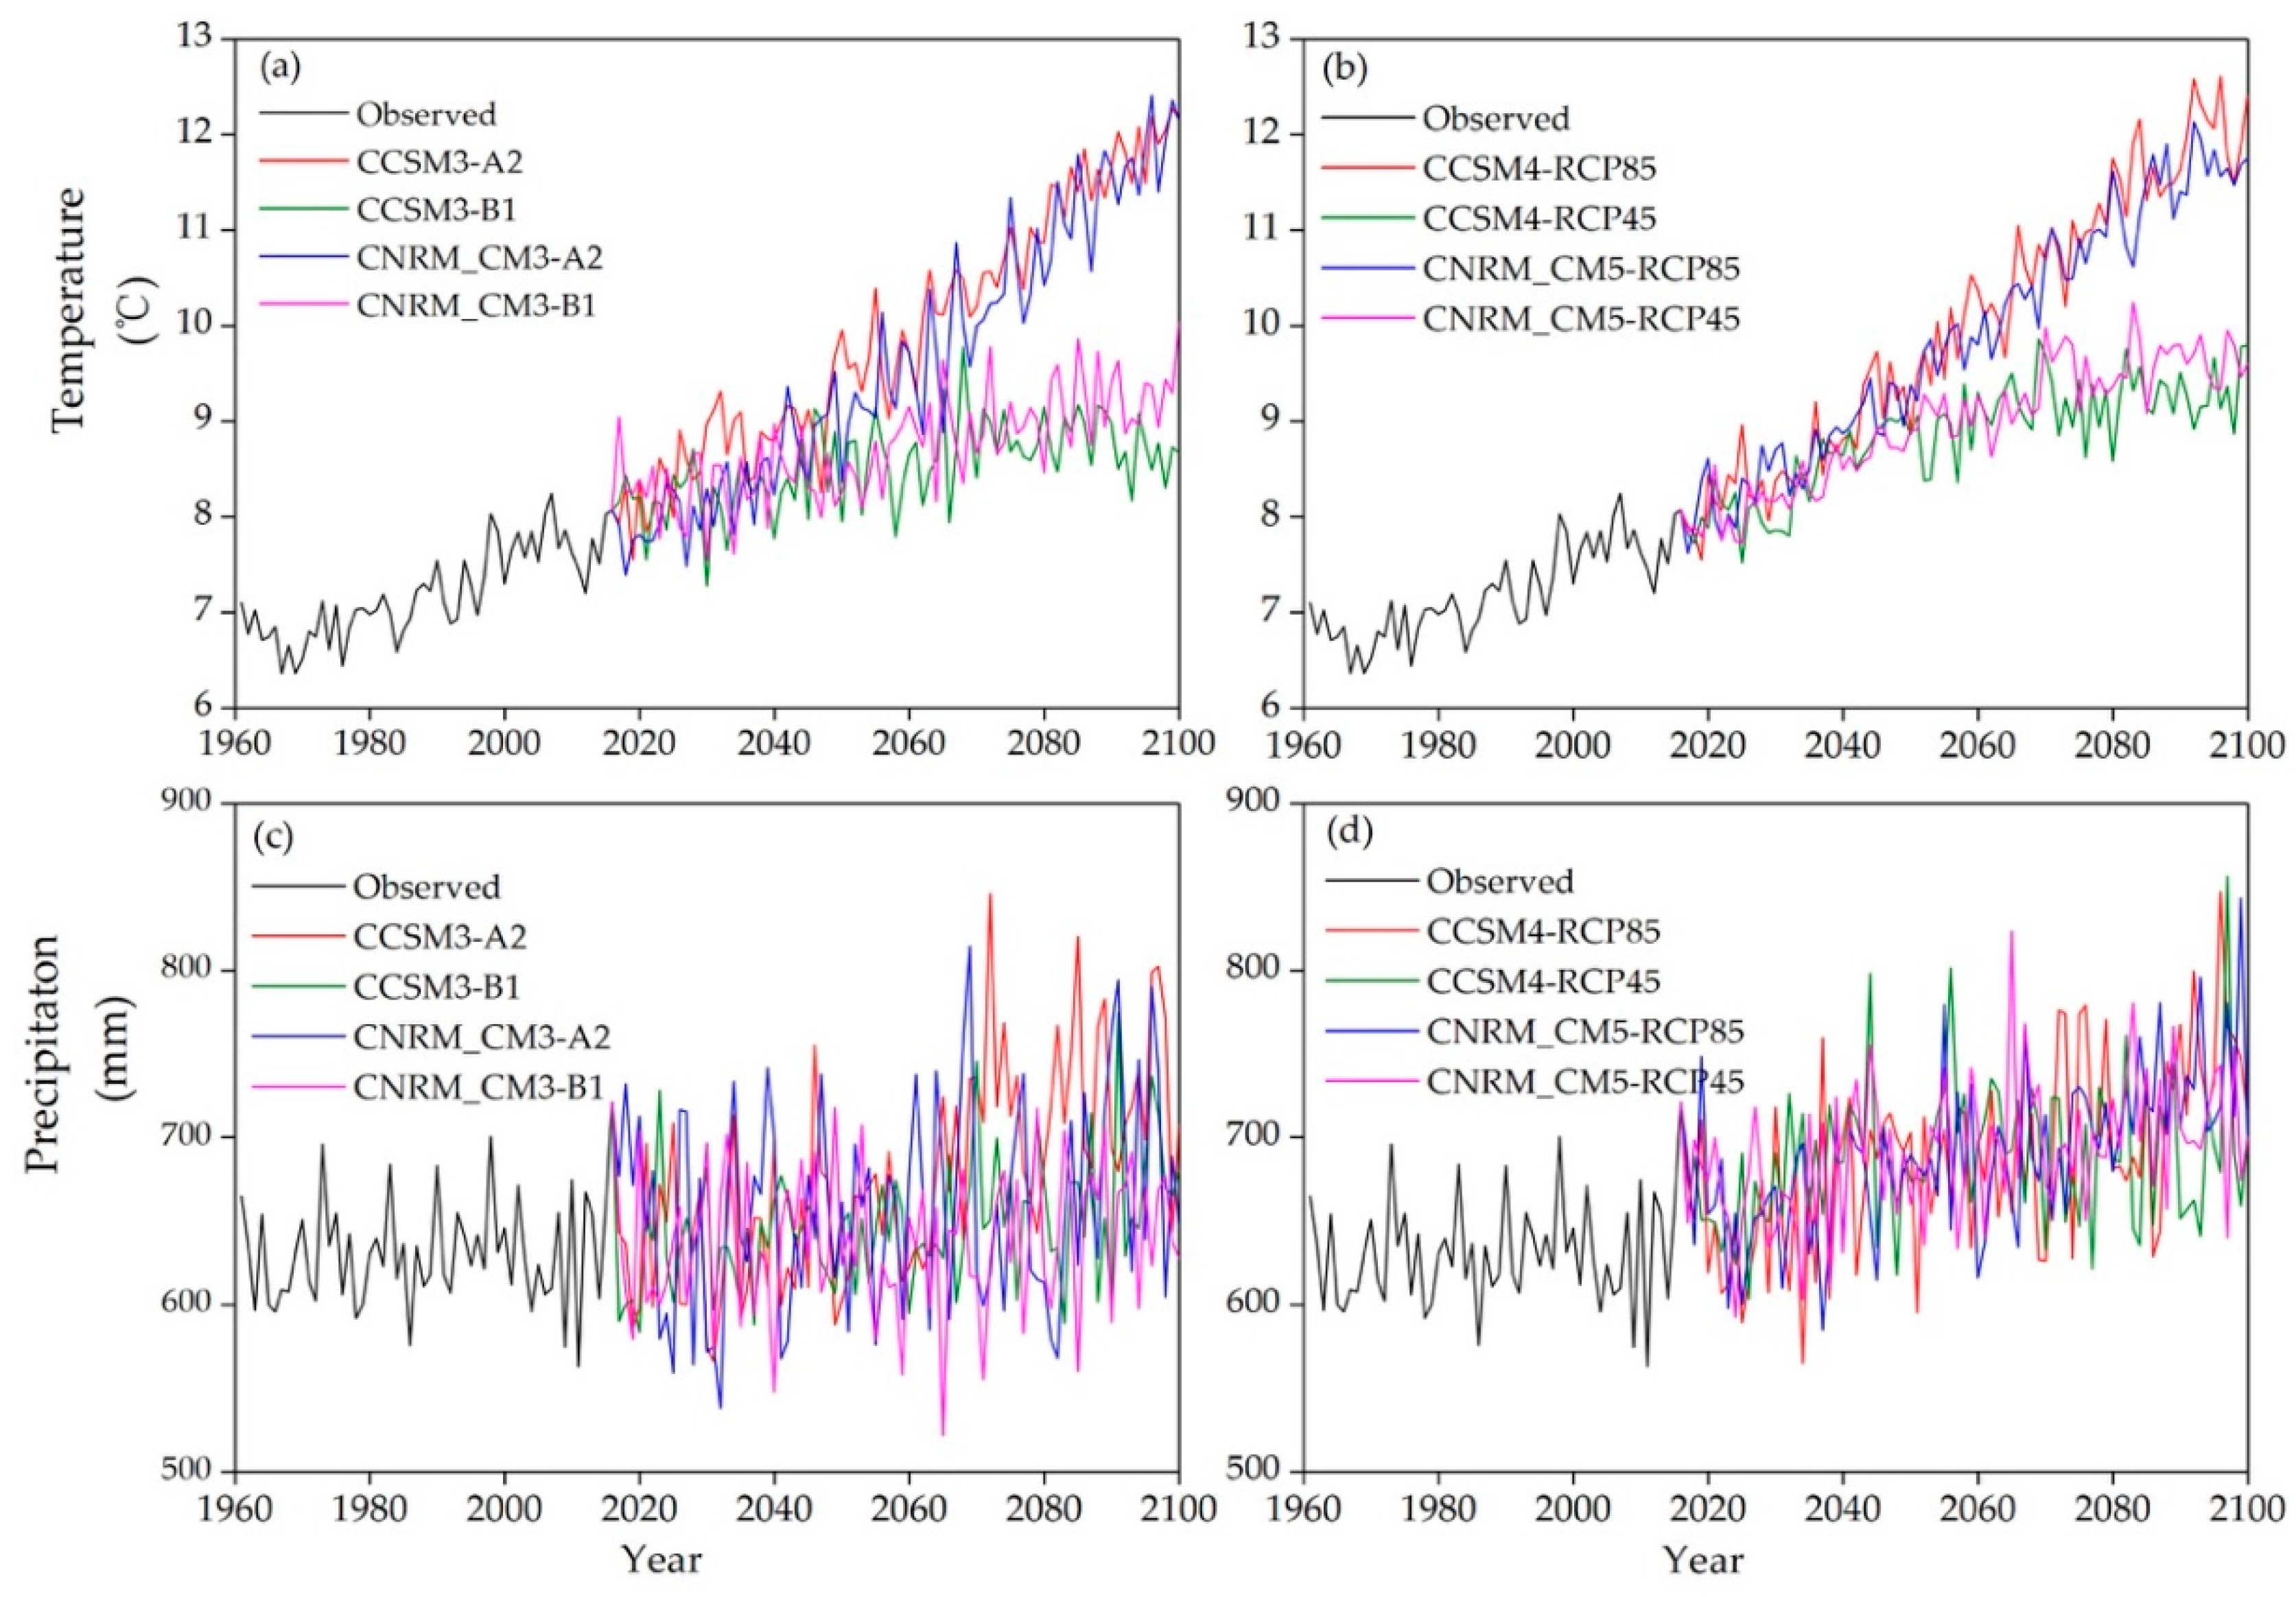
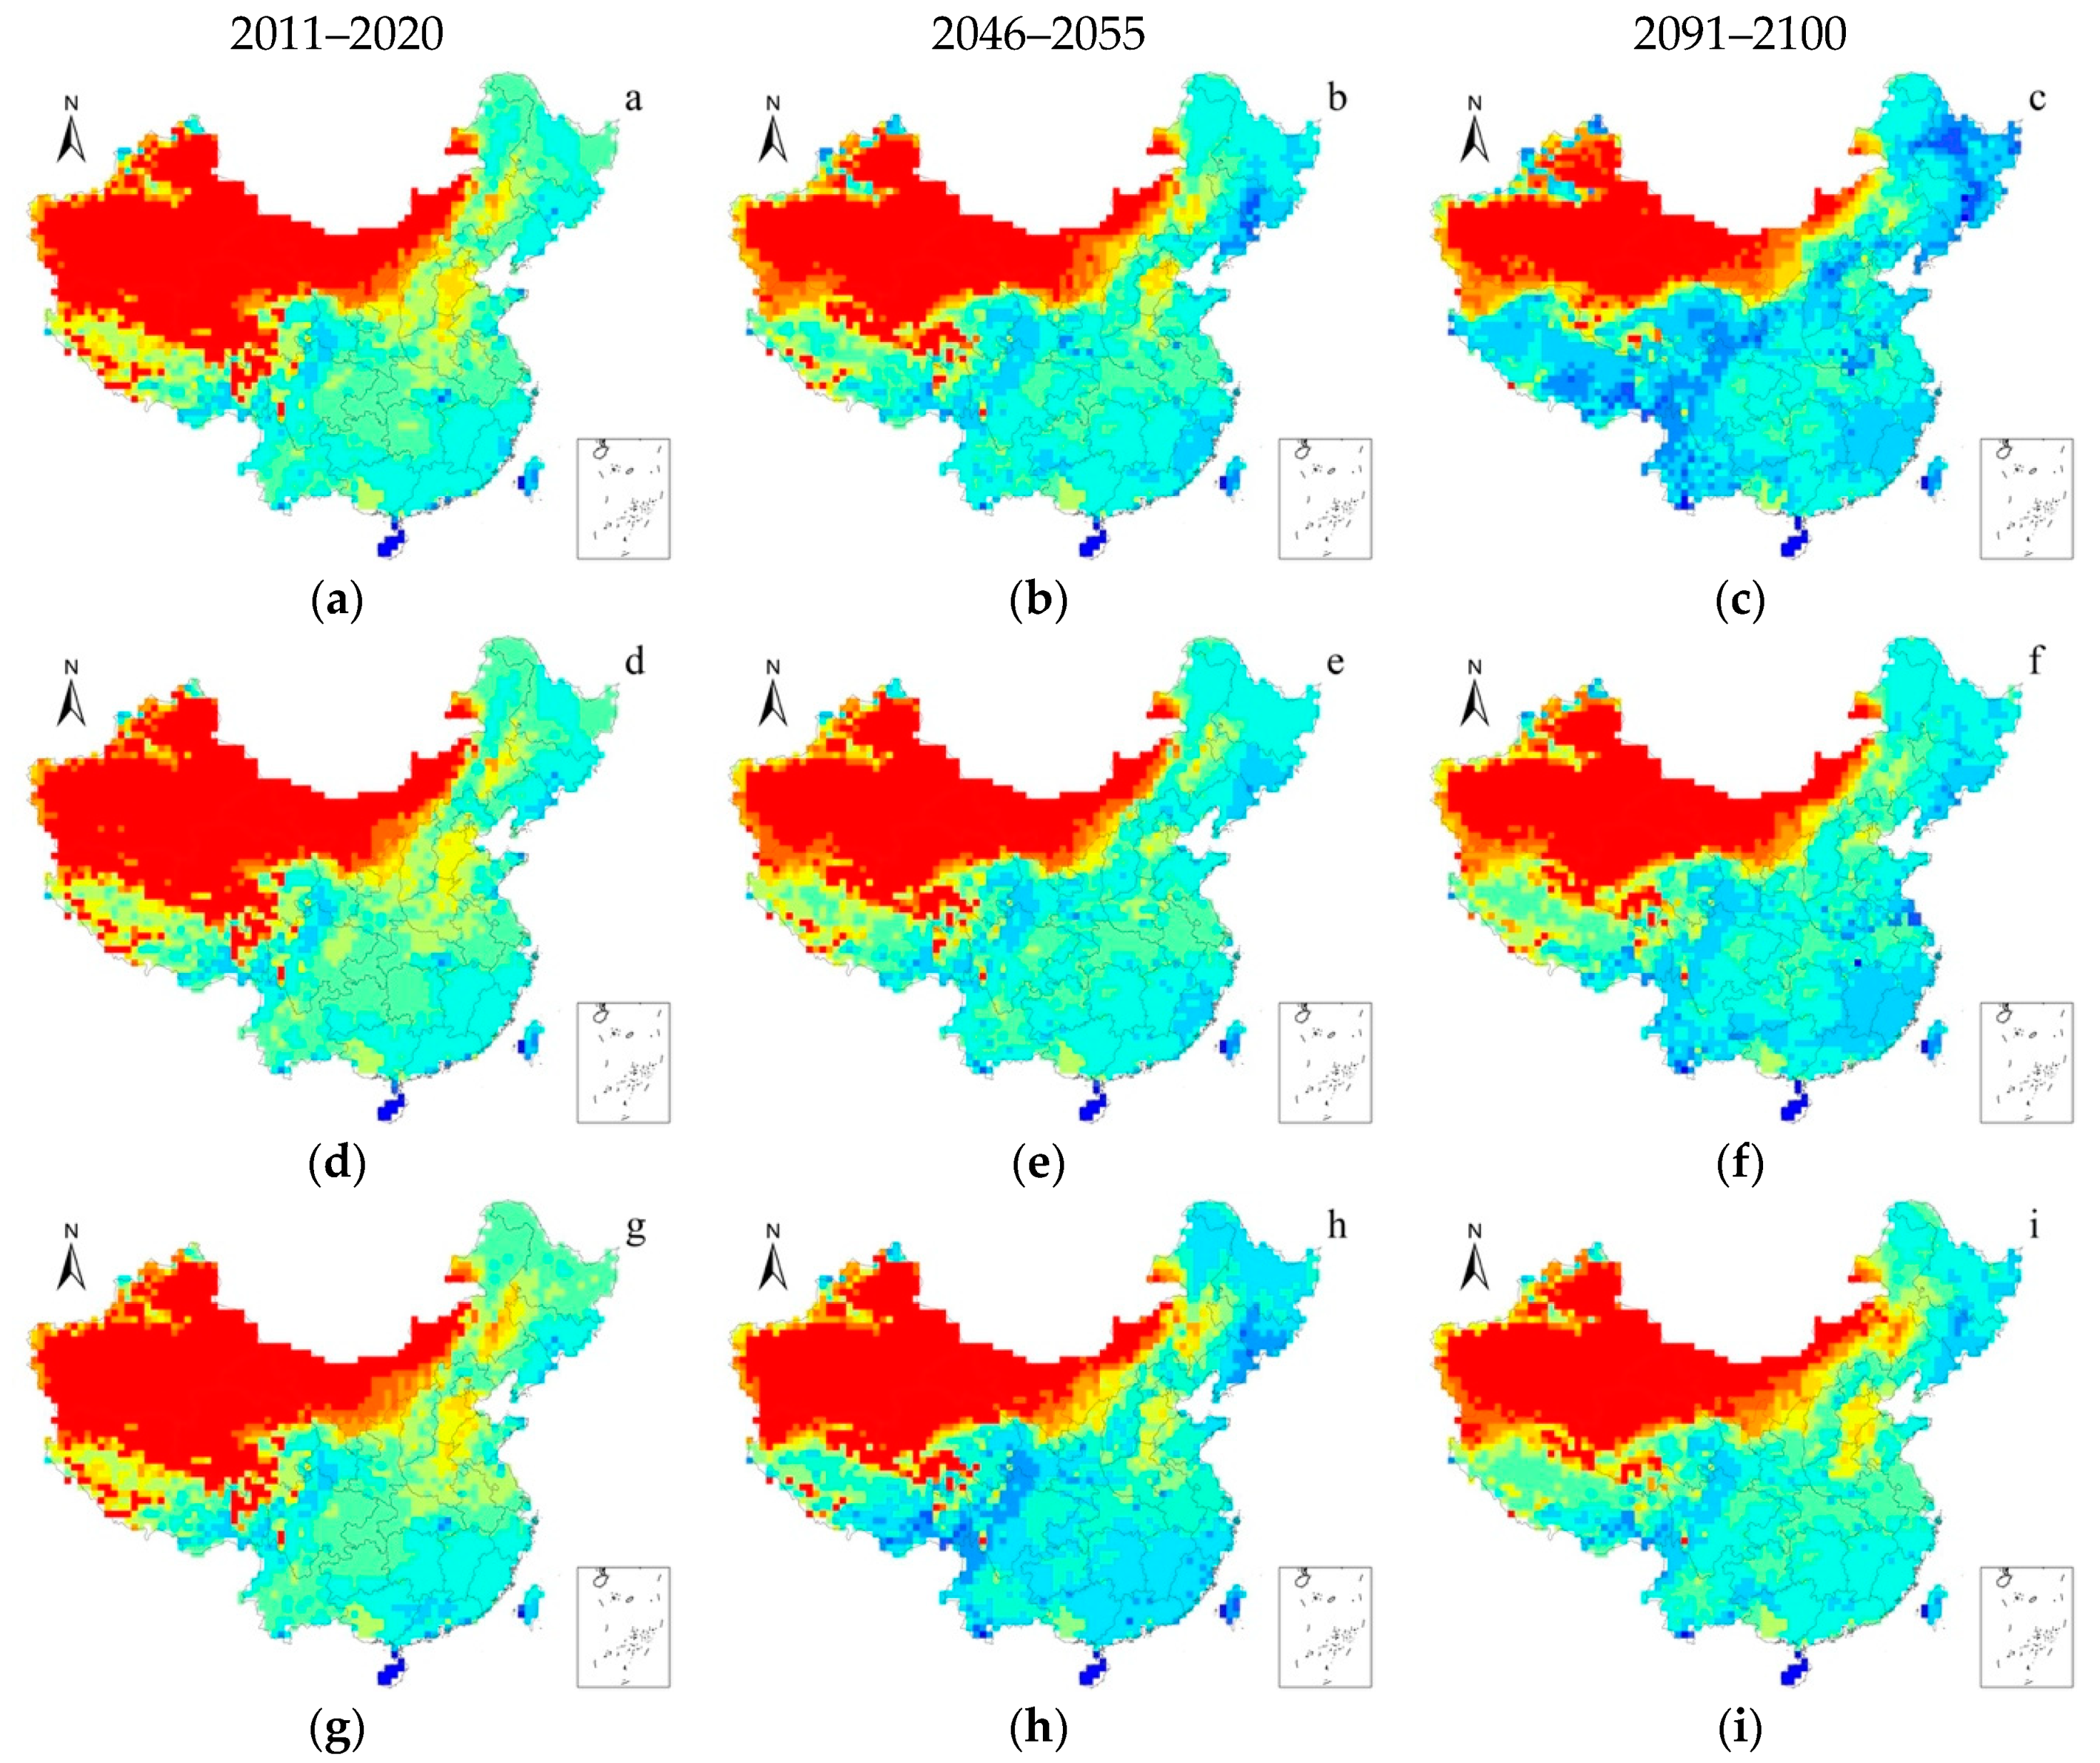
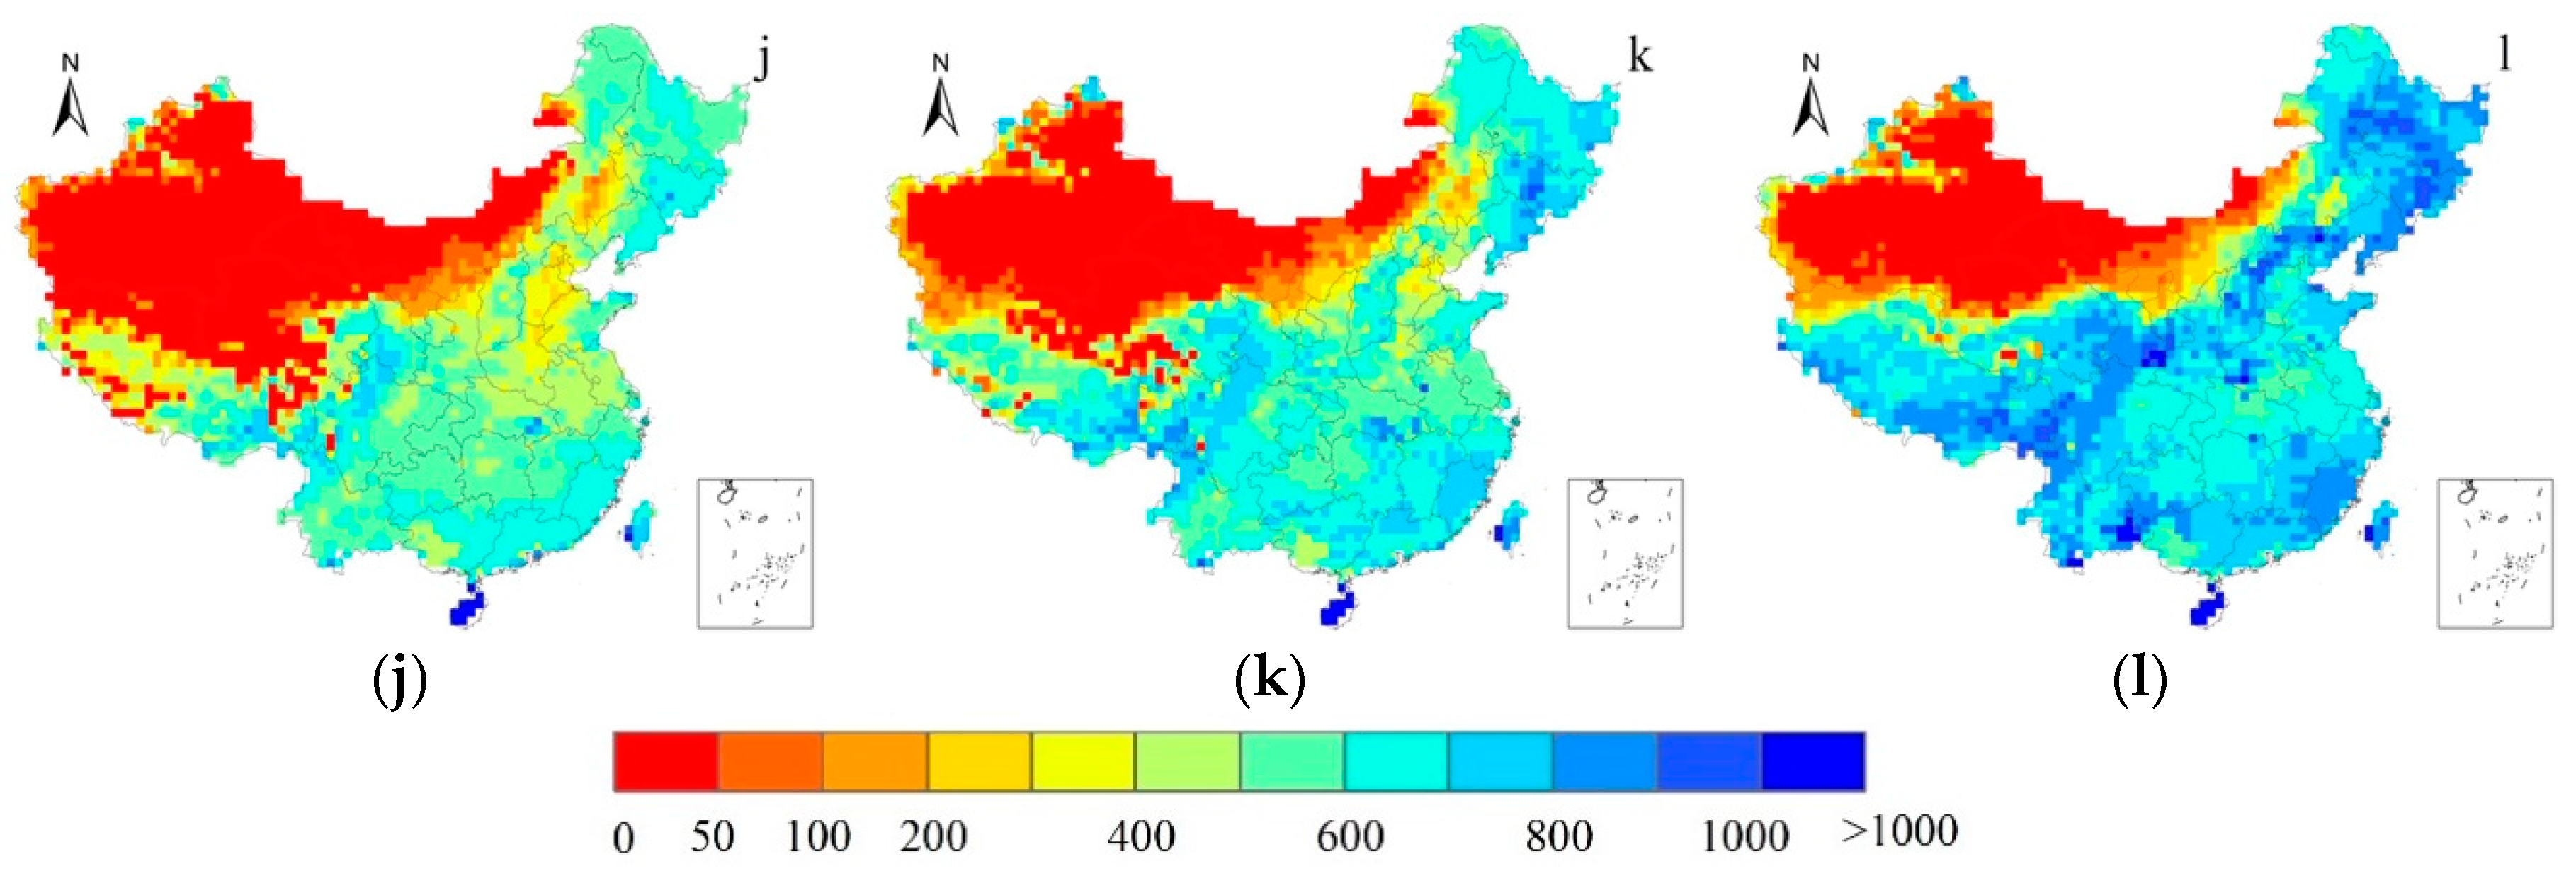
3.4. Changes of NPP in the Future

The total simulated NPP under different climate scenarios from 2017 to 2100 are shown in Table 3. Overall, the total NPP of China will continue to increase in the future under different climate change scenarios with increasing CO2 concentration and temperatures. The total NPP under the A2 and RCP85 scenarios would be significantly higher than those under the B1 and RCP45 scenarios, and the magnitude of deviation between them would be more remarkable after 2050. The average CO2 concentrations and temperatures under the A2 and RCP85 scenarios would be approximately 18.4 ppm and 20.2 ppm and 0.18 °C and 0.31 °C, respectively, higher than those under the B1 and RCP45 scenarios during 2011–2050. On average, total NPP would be just 0.01 Pg C yr−1 and 0.04 Pg C yr−1 higher under A2 and RCP85 scenarios than that under B1 and RCP45 scenarios during 2011–2050. When the gaps of CO2 concentrations and temperatures would increase to 175.0 ppm and 236.6 ppm and to 1.79 °C and 1.69 °C during 2051–2100, the gaps of the total NPP would widen to 0.48 Pg C yr−1 and 0.66 Pg C yr−1. Especially in the final period (2091–2100), the average total NPP in the A2 and RCP85 scenarios would reach 4.90 Pg C yr−1 and 5.10 PgC yr−1, which would be 0.70 Pg C yr−1 and 1.20 PgC yr−1 larger than that under the B1 and RCP45 scenarios.
As shown in Table 5 and Figure 9, there are differences in annual total simulated NPP using the climates projected by different climate models (NCAR and CNRM). The average NPP simulated using the climates projected by two climate models during the periods of 2011–2010, 2046–2055, and 2091–2100 was used to indicate the NPP changes in the early, middle, and late stages, respectively. The results showed that forests would make significant contributions to increases in NPP in the future. In most temperate forests, the NPP would experience a sustained increase. The NPP in tropical and subtropical forests would also increase, but to a lesser extent.
As shown in Figure 9, there are small differences in the spatial pattern of NPP simulated using projected climates under different scenarios during 2011–2020. During 2046–2055, the NPP pattern would vary more significantly under AR5 scenarios than under AR4 scenarios. NPP in temperate forests would increase obviously overall, NPP in the Greater and Lesser Xing’an, Changbaishan, and Hengduan mountain areas would increase from 500–600 g C m−2 yr−1 during 2011–2020 to 600–800 g C m−2 yr−1 during 2046–2055. NPP in subtropical forests in the southeastern coastal areas of China would also increase from 600–700 g C m−2 yr−1 during 2011–2020 to 700–900 g C m−2 yr−1 during 2046–2055. However, the NPP increases in the Northeast Plain, North China Plain, and middle-lower Yangtze River plain would be small from the period of 2011–2020 to the period of 2046–2055. The patterns of simulated NPP under four different scenarios would show distinguishable differences during 2091–2100. The NPP in most forests would continue to increase under the A2 and RCP85 scenarios, but would have no increase or even decline under the B1 and RCP45 scenarios.

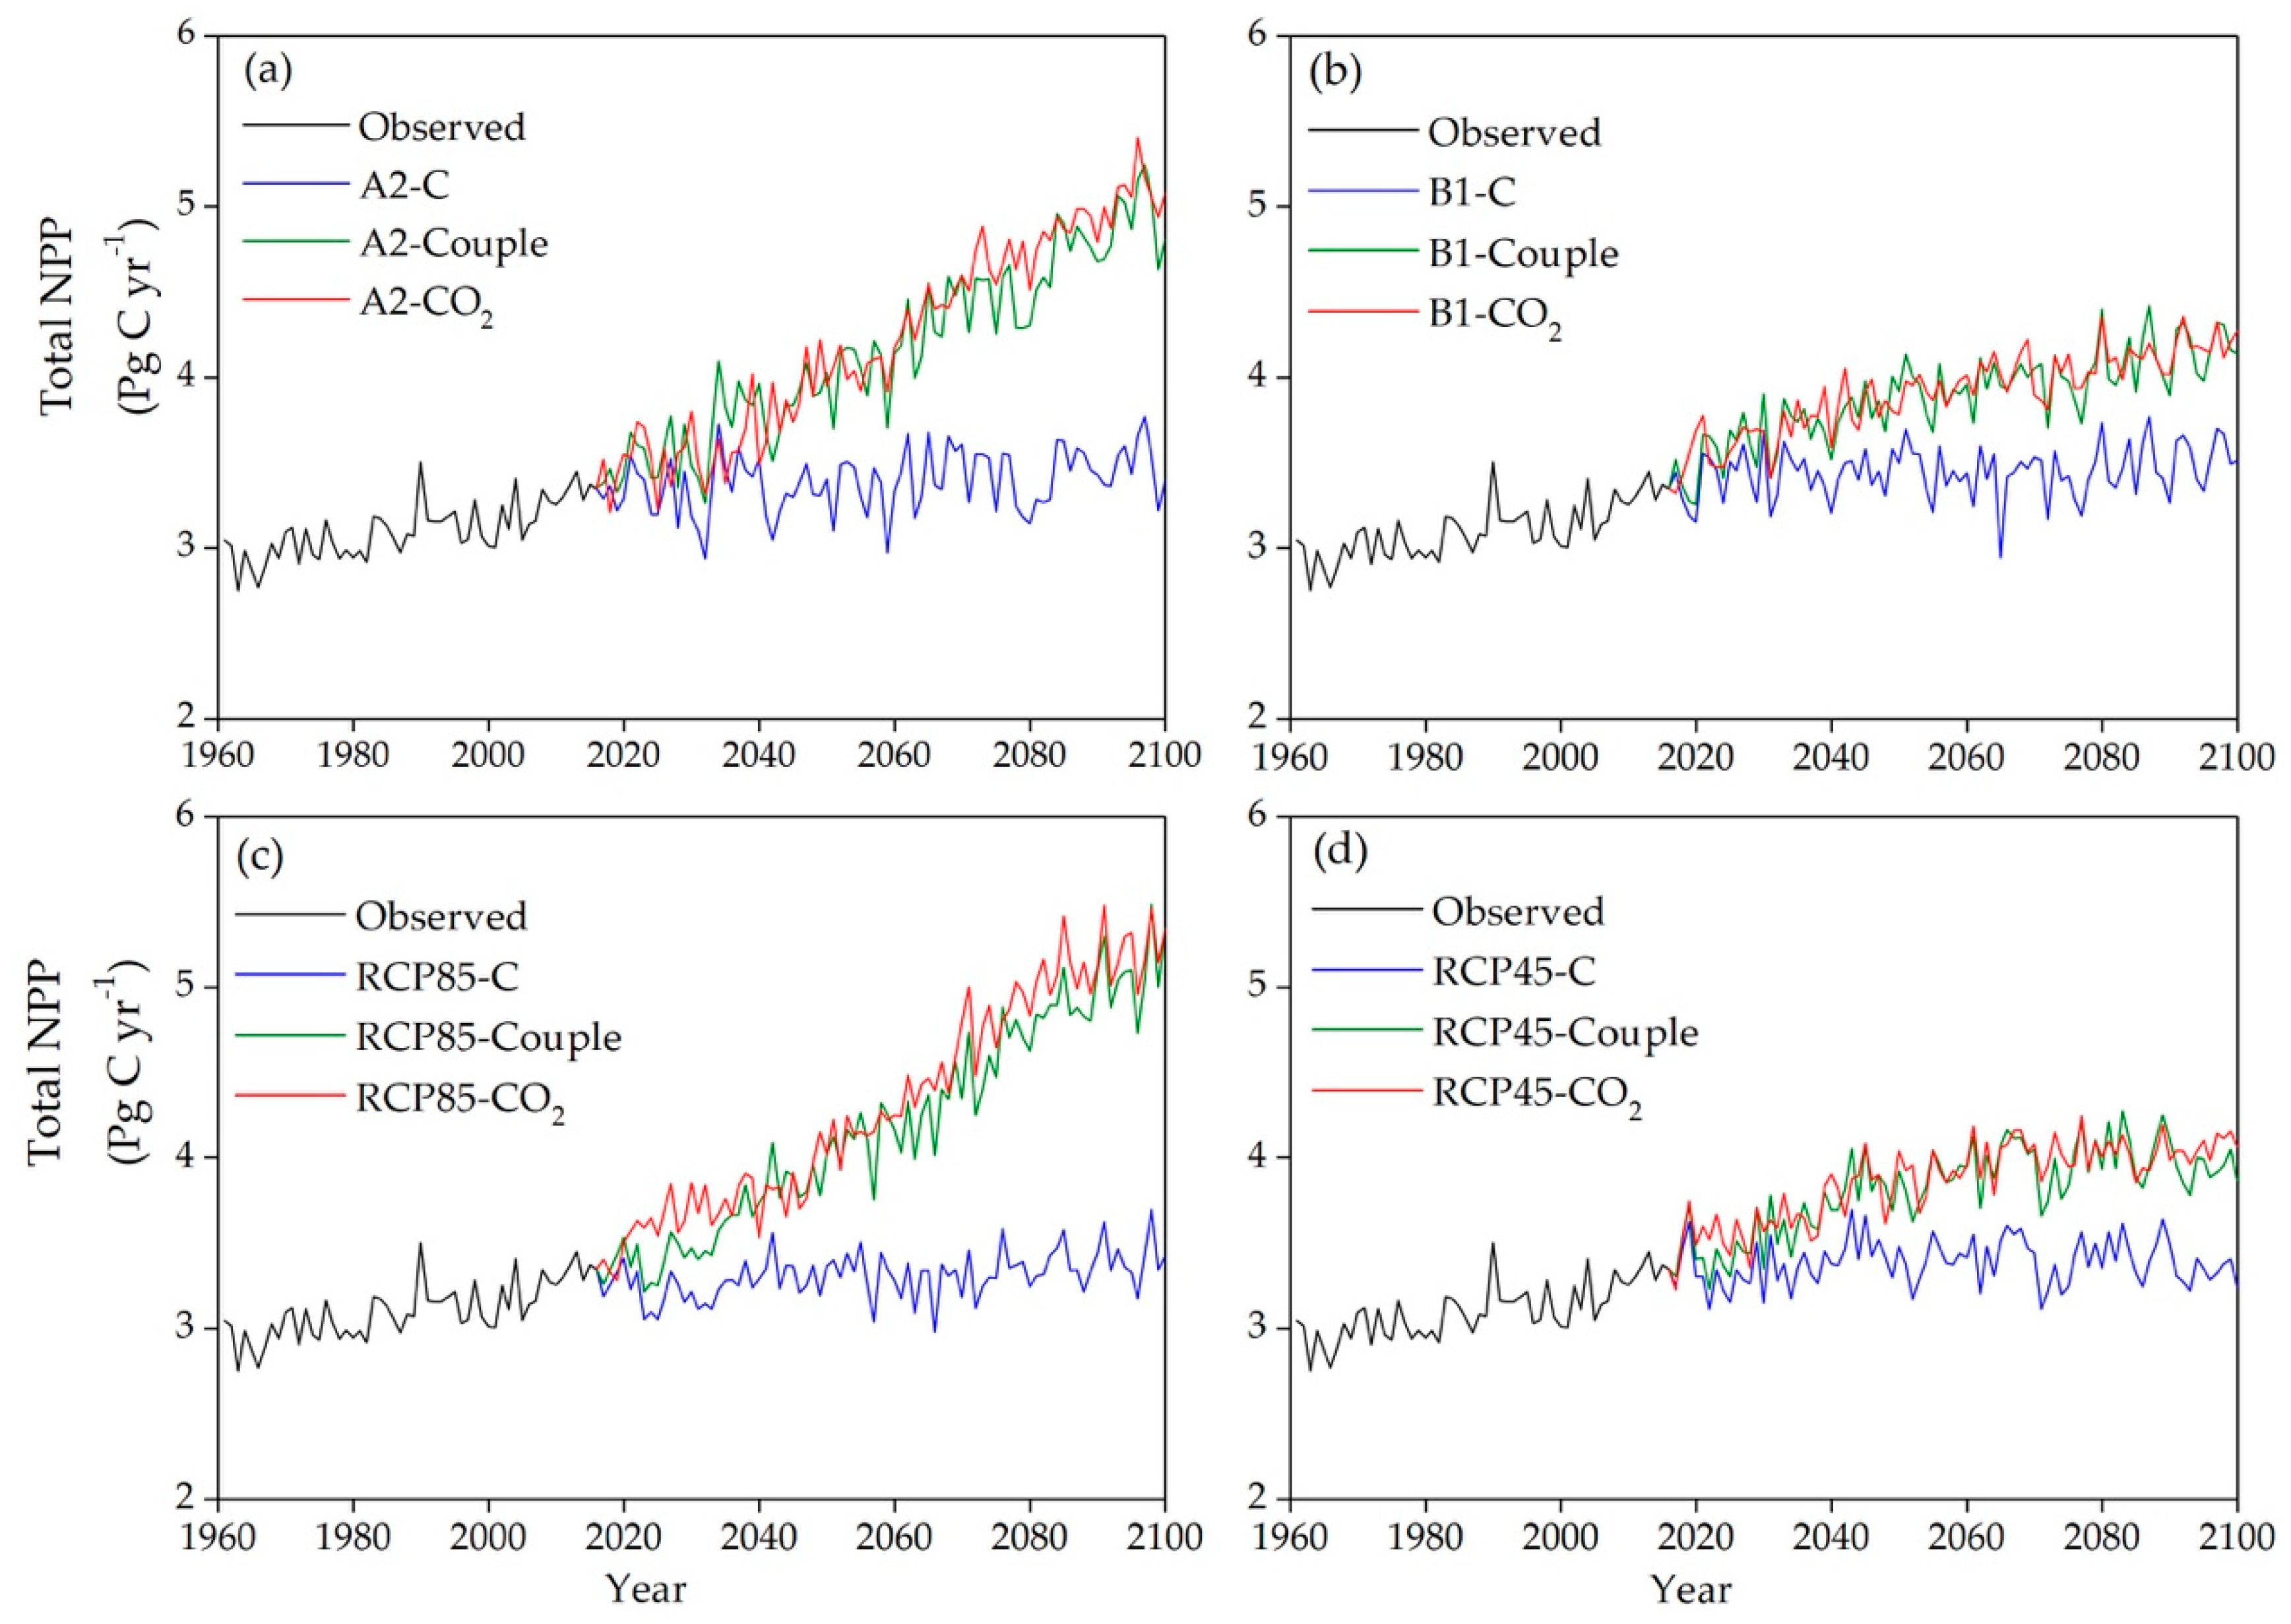
3.5. Influence of Future CO2 Increase and Climate Change on NPP

Our simulations indicated that continuous increase in CO2 concentrations would significantly enhance terrestrial NPP in China (Figure 10). The average CO2 concentration was 393.24 ppm during 2007–2016, and would increase to 817.15 ppm and 894.37 ppm under the A2 and RCP85 scenarios and to 547.67 ppm and 535.83 ppm under the B1 and RCP45 scenarios during 2091–2100. In the context of the above CO2 concentrations without corresponding climate change, the total of simulated NPP in China would reach 5.08 Pg C yr−1 and 5.23 Pg C yr−1 under the A2 and RCP85 scenarios during 2091–2100, respectively. These values are 1.68 Pg C yr−1 (49.49%) and 1.83 PgC yr−1 (53.86%) higher than the average NPP during 2007–2016 (3.40 Pg C yr−1). Under the B1 and RCP45 scenarios, CO2 concentration would increase at smaller magnitudes. As a consequence, the increases of NPP driven by sole CO2 increase would be 0.82 PgC yr−1 (24.02%) and 0.67 PgC yr−1 (19.57%) by the end of the 21st century, respectively, much smaller than the increases under A2 and RCP85 scenarios.
The NPP simulated with only increase in CO2 concentration was compared with the estimates that combined the effects of climate change and increasing CO2. The total NPP (only CO2 change) under the A2 and RCP85 scenarios would be 3.03% (0.15 Pg C yr−1) and 2.54% (0.13 Pg C yr−1) higher than couple scenarios during 2091–2100, respectively. The corresponding values would approximately 0.60% (0.03 Pg C yr−1) and 3.58% (0.14 Pg C yr−1) under B1 and RCP45 scenarios. The warmer climate in A2 and RCP85 scenarios induced slightly larger reductions of total NPP than B1 and RCP45 scenarios. As a whole, the warm climate in the future had a slightly negative influence on the NPP in China.
There are no obvious trends in the total NPP of China simulated with projected future climate under the A2, RCP85 and B1, RCP45 scenarios and CO2 concentration value in 2016 (Figure 10). Compared with the average NPP (3.4 PgC yr−1) in the past ten years (2007–2016), the solely future climate change would drive slight changes in total NPP with an increase of 0.78% (0.026 Pg C yr−1) and decreasing by 1.64% (0.056 Pg C yr−1) under the A2 and RCP85 scenarios respectively, and an increase of only 1.81% (0.062 Pg C yr−1) and decrease of 0.12% (−0.004 Pg C yr−1) under the B1 and RCP45 scenarios during 2051–2100, respectively. Previous studies have indicated that precipitation was the main limiting factor of increasing NPP, and that temperature was also an important assisting factor. In years of abundant (deficient) precipitation, the rise in temperature caused an increase (decrease) in NPP [19]. Interannual and spatial variations in precipitation in different regions of China led to trends and variability of NPP. Precipitation in Northwest China has increased with fluctuations since 1961, and the climate in Qinghai-Tibet Plateau area has become warmer and wetter [73]. The positive effect on NPP caused by increasing precipitation in the semi-arid ecosystems of China might offset the negative effect from warmer climates in other areas.
Compared with the estimates that combined the effect of climate change and concurrent increasing CO2, the simulated total NPP with only climate change (CO2 kept at the value in 2016) under the A2 and RCP85 scenarios would decreased by 1.44 Pg C yr−1 (29.28%) and 1.68 Pg C yr−1 (32.97%) during 2091–2100 (Figure 10a,c). The corresponding values would be 0.64 Pg C yr−1 (15.31%) and 0.60 Pg C yr−1 (15.40%) under the B1 and RCP45 scenarios (Figure 10b,d). Therefore, the future increase of NPP in China would be dominantly contributed to by the fertilization effect of CO2 enrichment.

4. Conclusions

The LPJ model was employed to analyze the historical and future spatial and temporal patterns of NPP and assess the contributions of climate change and CO2 enrichment to future NPP trend in China. The main findings of this study are:
(1)
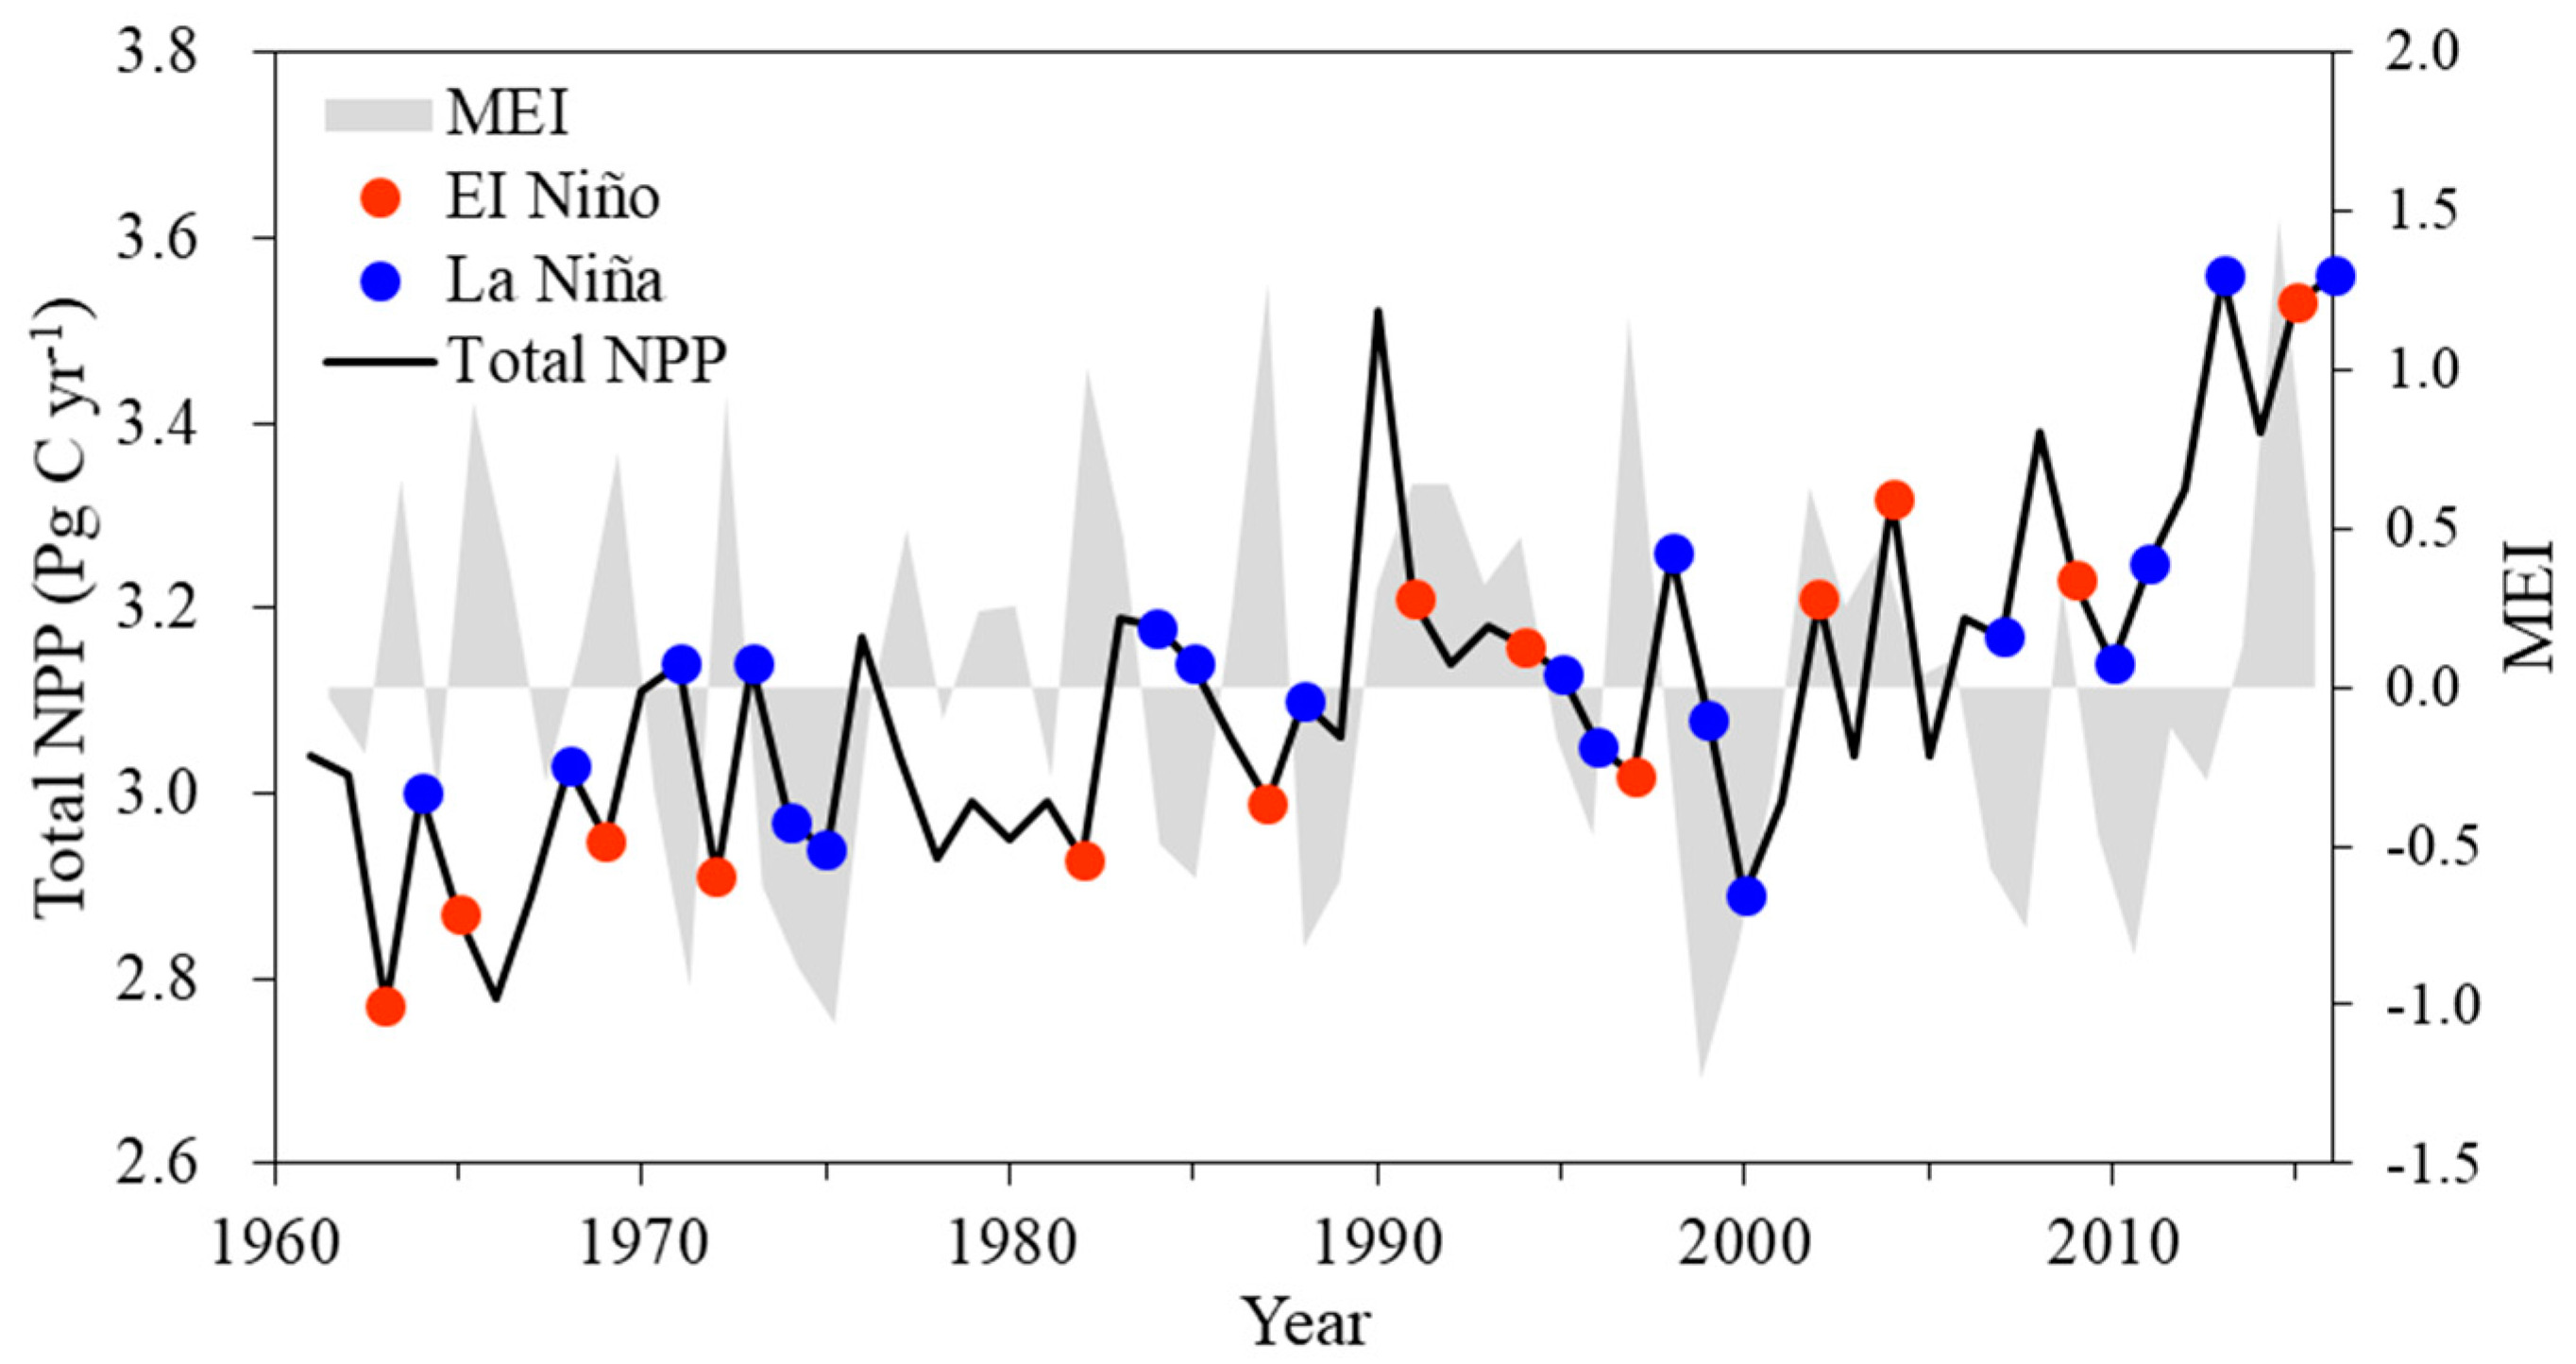
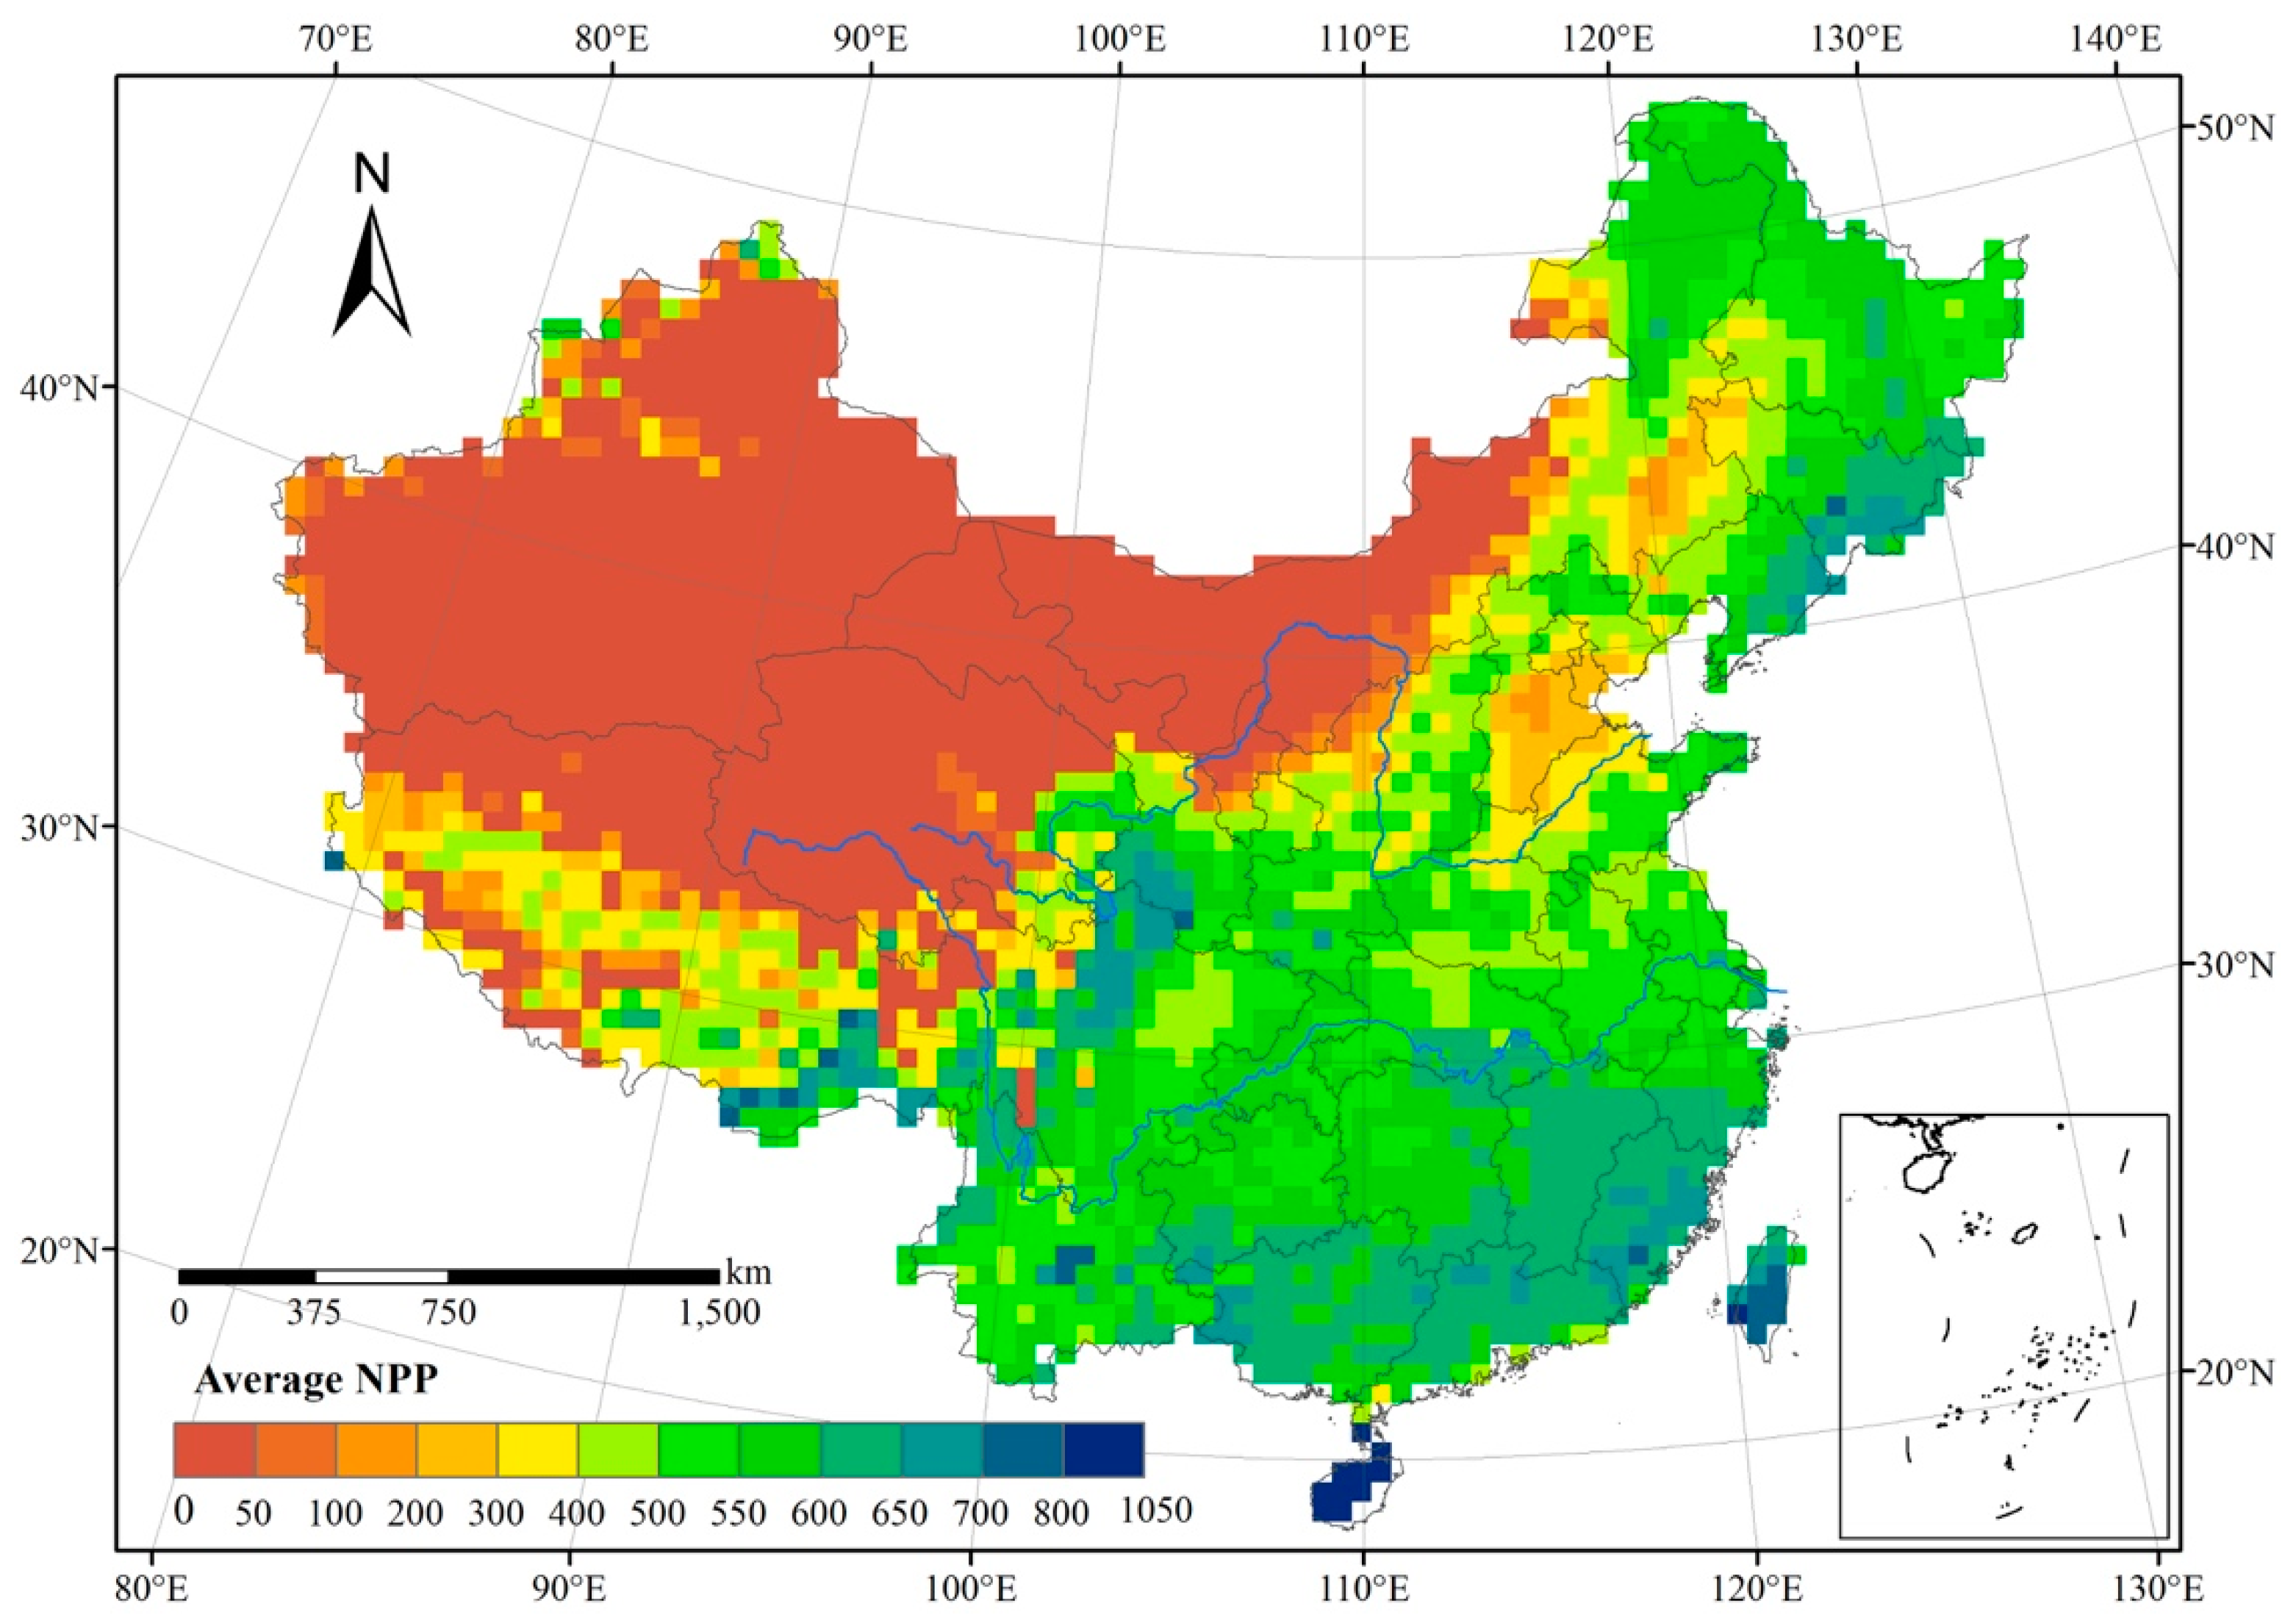
Total NPP of China’s terrestrial ecosystem increased from 2.8 to 3.6 Pg C yr−1 over the period of 1961–2016, with an annual average of 3.1 Pg C yr−1. Southwest China acted as the largest contributor to national total NPP among the six geographical regions of China, while Northwest China played the smallest role. Total NPP exhibited gradually increasing trends in Northwest China, Southwest China, South-central China, and East China.
(2)
National total NPP exhibited large interannual variability. NPP anomalies in China’s terrestrial ecosystems were strongly associated with the El Niño-Southern Oscillation (ENSO). Overall, the national total of NPP declined remarkably in the EP EI Niño year while increasing in the CP EI Niño year. The national total NPP often increased in the La Niña year. However, continuous La Niña events might induce NPP to decrease. Southwest China made the largest contribution to the interannual variability of national total NPP, the next is South-central China.
(3)
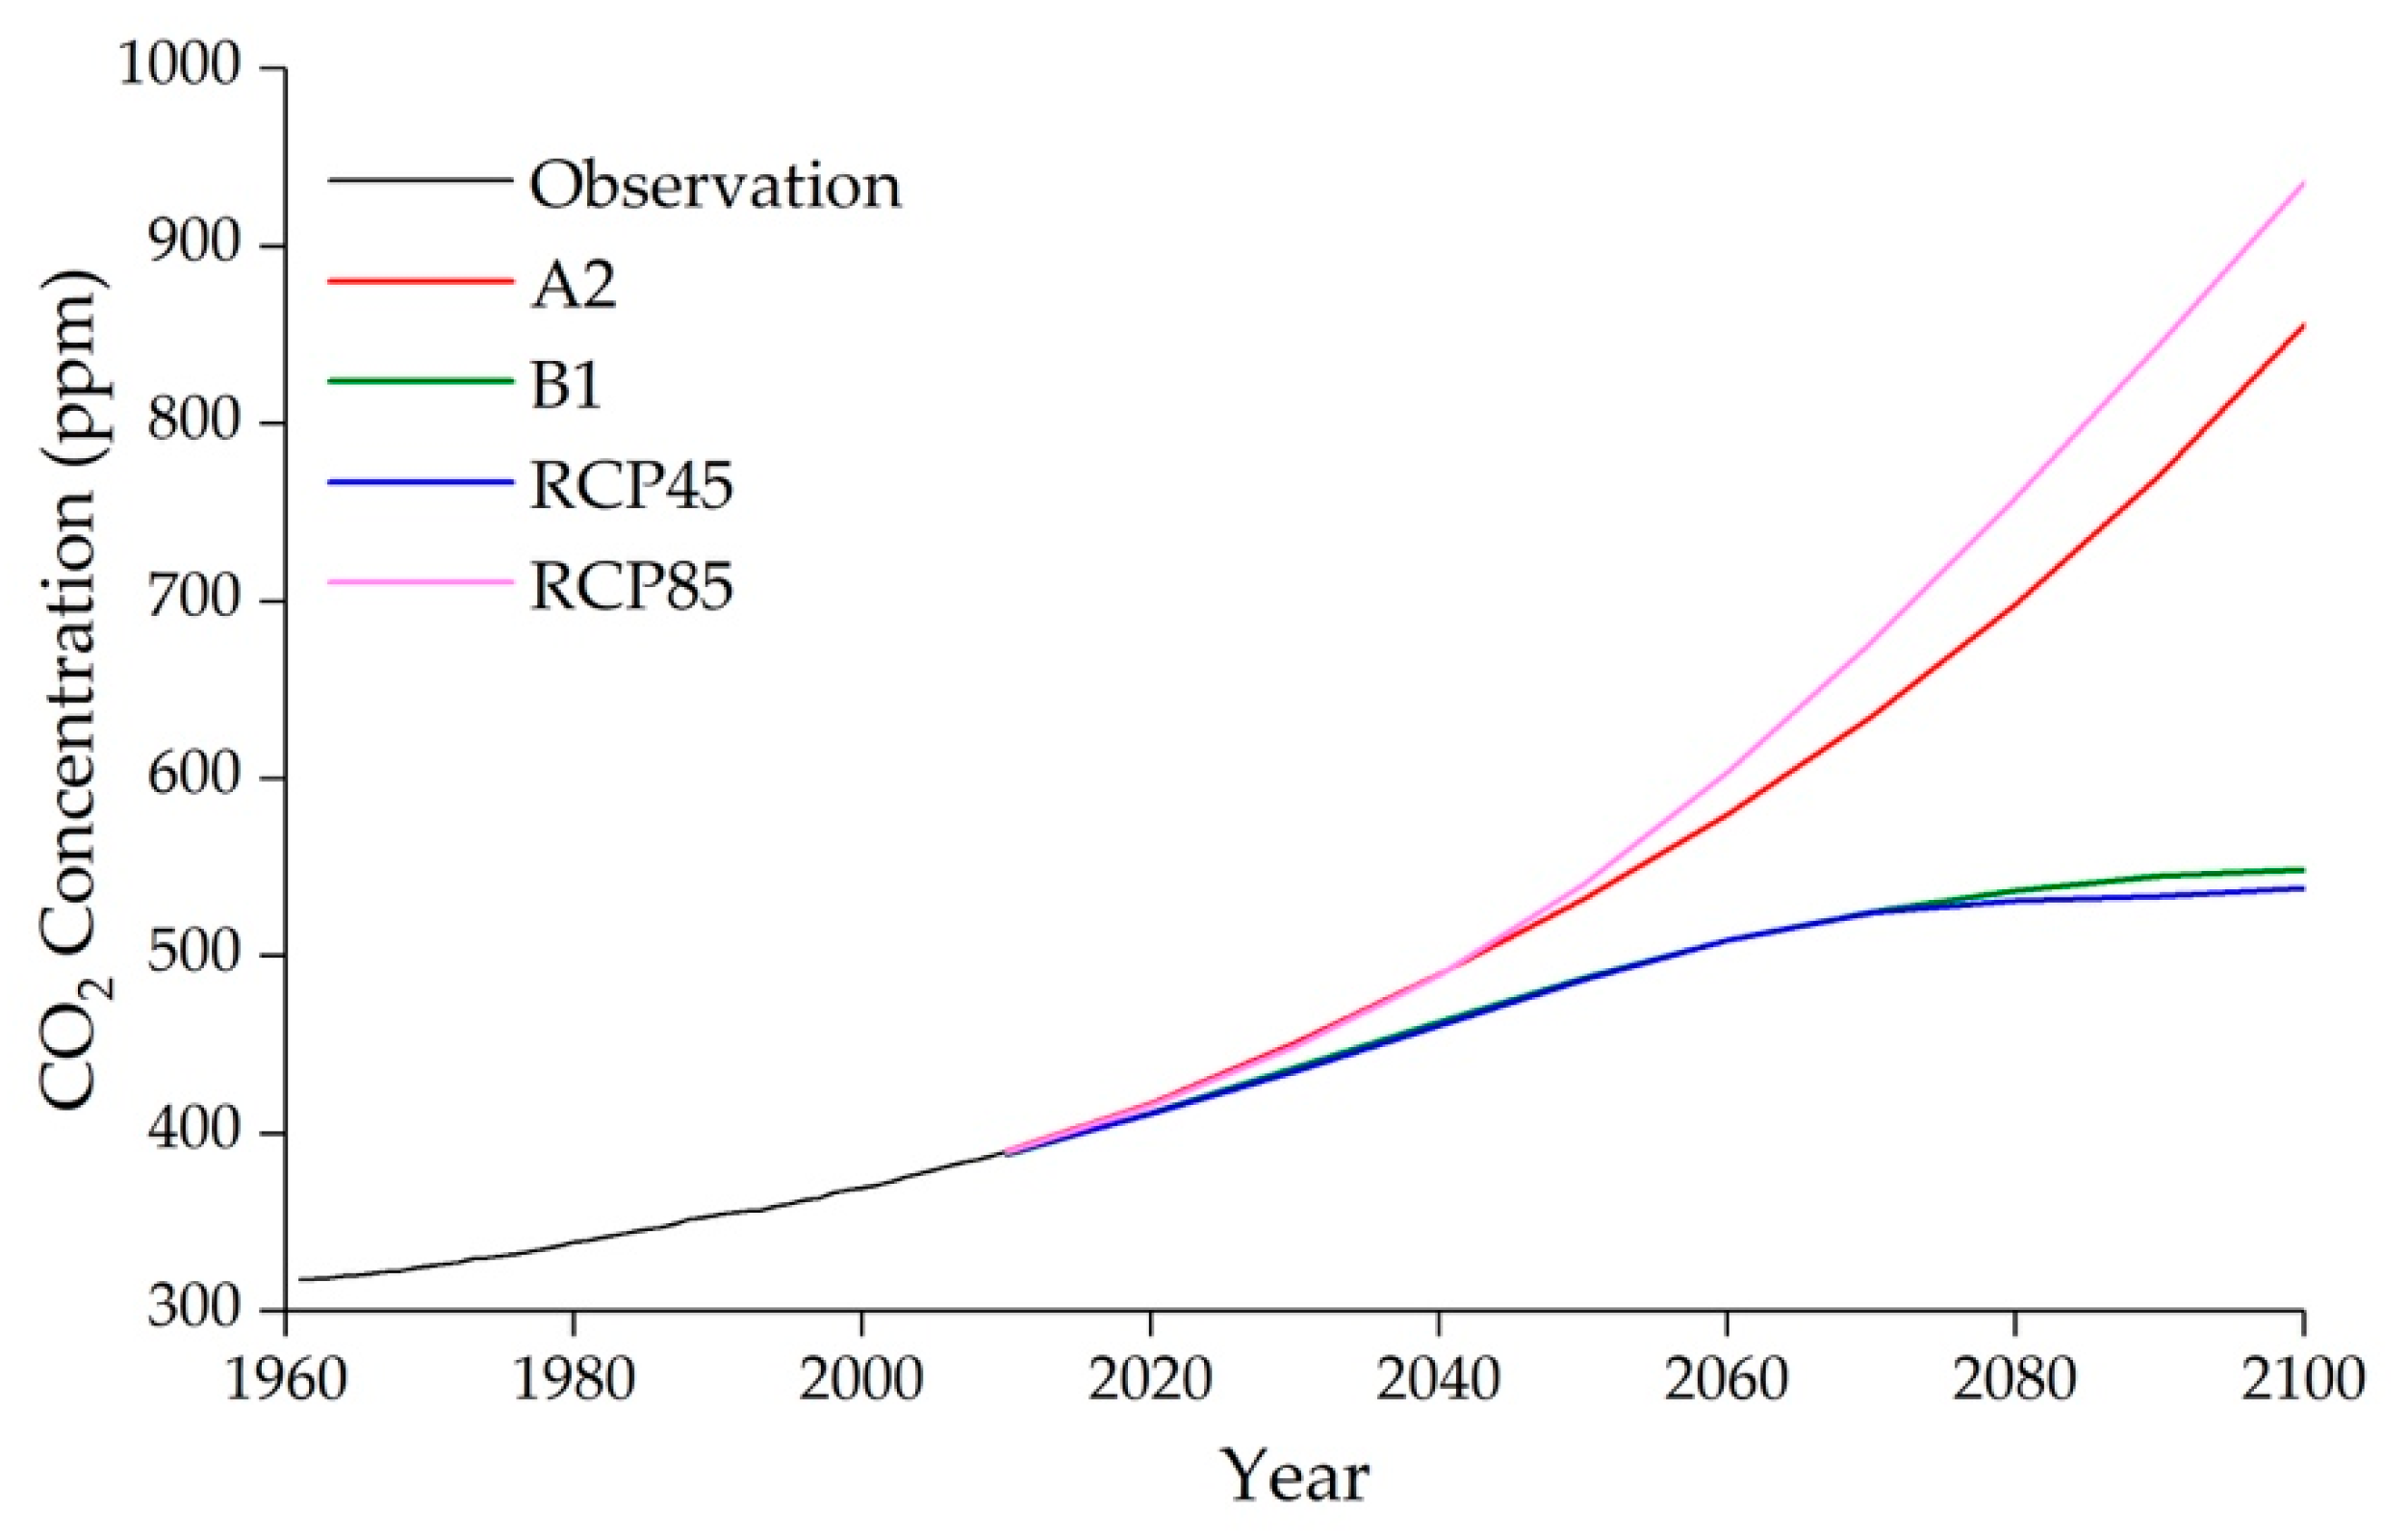
The total NPP in the A2 and RCP85 scenarios would be obviously larger than those in the B1 and RCP45 scenarios. During the period from 2091 to 2100, the average total NPP under the A2 and RCP85 scenarios would reach 4.9 and 5.1 Pg C yr−1 respectively, higher than 4.2 and 3.9 Pg C yr−1 under the B1 and RCP45 scenarios. The future increase of NPP in China would be dominantly contributed to by the fertilization effect of CO2, while the climate change would have slightly negative effects on NPP.

Author Contributions

All authors contributed extensively to this work. Conceptualization, Q.H. and W.J.; methodology, Q.H. and W.J.; data curation, Q.H. and F.Z.; formal analysis, Q.H., F.Z. and Q.Z.; writing-original draft preparation, Q.H.; writing-review and editing, W.J., F.Z. and Q.Z.

Funding

This research was funded by the National Key R&D Program of China (grant number. 2016YFA0600202), the Project of the University Natural Science Research of Jiangsu Province (grant number. 15KJB170004), the National Natural Science Foundation of China (grant number. 41701393), the Natural Science Foundation of Jiangsu Province for Youth (grant number. BK20170641), and the China Postdoctoral Science Foundation (grant number. 2018T110477).

Acknowledgments

We would like to acknowledge the support from the anonymous reviewers for their helpful comments to the improvement of the manuscript.

Conflicts of Interest

The authors declare no conflict of interest.

References

  1. Joos, F.; Spahni, R. Rates of change in natural and anthropogenic radiative forcing over the past 20,000 years. Proc. Natl. Acad. Sci. USA 2008, 105, 1425–1430. [Google Scholar] [CrossRef] [Green Version]
  2. Le Quéré, C.; Andrew, R.M.; Friedlingstein, P.; Sitch, S.; Hauck, J.; Pongratz, J.; Pickers, P.A.; Korsbakken, J.I.; Peters, G.P.; Canadell, J.G.; et al. Global carbon budget 2018. Earth Syst. Sci. Data. 2018, 10, 2141–2194. [Google Scholar] [CrossRef]
  3. Haberl, H.; Erb, K.-H.; Krausmann, F. Human Appropriation of Net Primary Production: Patterns, Trends, and Planetary Boundaries. Annu. Rev. Environ. Resour. 2014, 39, 363–391. [Google Scholar] [CrossRef]
  4. Zhang, F.; Pu, L.; Huang, Q. Quantitative assessment of the human appropriation of net primary production (HANPP) in the coastal areas of Jiangsu, China. Sustainability. 2015, 7, 15857–15870. [Google Scholar] [CrossRef]
  5. Waring, R.H.; Coops, N.C.; Ohmann, J.L. Interpreting woody plant richness from seasonal ratios of photosynthesis. Ecology. 2002, 83, 2964–2970. [Google Scholar] [CrossRef]
  6. Running, S.W.; Nemani, R.R.; Heinsch, F.A. A continuous satellite-derived measure of global terrestrial primary production. Bioscience. 2004, 54, 547–560. [Google Scholar] [CrossRef]
  7. Ito, A. A historical meta-analysis of global terrestrial net primary productivity: Are estimates converging? Glob. Chang. Boil. 2011, 17, 3161–3175. [Google Scholar] [CrossRef]
  8. Sarmiento, J.L.; Gloor, M.; Gruber, N. Trends and regional distributions of land and ocean carbon sinks. Biogeosciences. 2010, 7, 2351–2367. [Google Scholar] [CrossRef] [Green Version]
  9. Ahlström, A.; Raupach, M.R.; Schurgers, G.; Smith, B.; Arneth, A.; Jung, M.; Reichstein, M.; Canadell, J.G.; Friedlingstein, P.; Jain, A.K.; et al. The dominant role of semi-arid ecosystems in the trend and variability of the land CO2 sink. Science 2015, 348, 895–899. [Google Scholar] [CrossRef]
  10. Piao, S.; Huang, M.; Liu, Z.; Wang, X.; Ciais, P.; Canadell, J.G.; Wang, K.; Bastos, A.; Friedlingstein, P.; Houghton, R.A.; et al. Lower land-use emissions responsible for increased net land carbon sink during the slow warming period. Nat. Geosci. 2018, 11, 739–743. [Google Scholar] [CrossRef] [Green Version]
  11. Piao, S.L.; Ciais, P.; Lomas, M.; Beer, C.; Liu, H.; Fang, J.; Friedlingstein, P.; Huang, Y.; Muraoka, H.; Son, Y.; et al. Contribution of climate change and rising CO2 to terrestrial carbon balance in East Asia: A multi-model analysis. Glob. Planet. Chang. 2011, 75, 133–142. [Google Scholar] [CrossRef]
  12. Fang, J.Y.; Yu, G.; Liu, L.; Hu, S.; Chapin, F.S., III. Climate change, human impacts, and carbon sequestration in China. Proc. Natl. Acad. Sci. USA 2018, 115, 4015–4020. [Google Scholar] [CrossRef] [Green Version]
  13. Wang, Q.; Zheng, H.; Zhu, X.; Yu, G. Primary estimation of Chinese terrestrial carbon sequestration during 2001–2010. Sci. Bull. 2015, 60, 577–590. [Google Scholar] [CrossRef]
  14. Fang, J.Y.; Piao, S.L.; Field, C.B.; Pan, Y.; Guo, Q.; Zhou, L.; Peng, C.; Tao, S. Increasing Net Primary Production in China from 1982 to 1999. Front. Ecol. Environ. 2003, 1, 293. [Google Scholar] [CrossRef]
  15. Piao, S.L.; Fang, J.Y.; Guo, Q.H. Application of CASA model to the estimation of Chinese terrestrial net primary productivity. Chin. J. Plant Ecol. 2001, 25, 603–608. (In Chinese) [Google Scholar]
  16. Piao, S.L.; Fang, J.Y.; Guo, Q.H. Terrestrial net primary production and its spatio-temporal patterns in China during 1982–1999. Acta Sci. Nat. Univ. Pekin. 2001, 37, 563–569. (In Chinese) [Google Scholar]
  17. Sun, R.; Zhu, Q.J. Distribution and seasonal change of net primary productivity in China from April, 1992 to March, 1993. Acta Geogr. Sin. 2000, 55, 36–45. (In Chinese) [Google Scholar]
  18. Li, J.; Wang, Z.; Lai, C.; Wu, X.; Zeng, Z.; Chen, X.; Lian, Y. Response of net primary production to land use and land cover change in mainland China since the late 1980s. Sci. Total Environ. 2018, 639, 237–247. [Google Scholar] [CrossRef]
  19. Cao, M.K.; Prince, S.D.; Li, K.R.; Tao, B.; Small, J.; Shao, X. Response of terrestrial carbon uptake to climate interannual variability in China. Glob. Chang. Biol. 2003, 9, 536–546. [Google Scholar] [CrossRef]
  20. Liang, M.L.; Xie, Z.H. Simulations of Climate Effects on Vegetation Distribution and Net Primary Production in China. Clim. Environ. Res. 2006, 11, 582–592. (In Chinese) [Google Scholar]
  21. Feng, X.F.; Liu, G.; Chen, J.M.; Chen, M.; Liu, J.; Ju, W.M.; Sun, R.; Zhou, W. Net primary productivity of China’s terrestrial ecosystems from a process model driven by remote sensing. J. Environ. Manag. 2007, 85, 563–573. [Google Scholar] [CrossRef]
  22. Ju, W.M.; Chen, J.M.; Harvey, D.; Wang, S. Future carbon balance of China’s forests under climate change and increasing CO2. J. Environ. Manag. 2007, 85, 538–562. [Google Scholar] [CrossRef]
  23. Tao, F.; Zhang, Z. Dynamic responses of terrestrial ecosystems structure and function to climate change in China. J. Geophys. Res. Space Phys. 2010, 115. [Google Scholar] [CrossRef]
  24. Liu, Y.B.; Ju, W.M.; He, H.L.; Wang, S.; Sun, R.; Zhang, Y. Changes of net primary productivity in China during recent 11 years detected using an ecological model driven by MODIS data. Front. Earth Sci. 2013, 7, 112–127. [Google Scholar] [CrossRef]
  25. Pei, F.; Li, X.; Liu, X.; Lao, C. Assessing the impacts of droughts on net primary productivity in China. J. Environ. Manag. 2013, 114, 362–371. [Google Scholar] [CrossRef]
  26. Yang, Y.Z.; Ma, Y.D.; Jiang, H. Evaluating the carbon budget pattern of Chinese terrestrial ecosystem from 1960 to 2006 using Integrated Biosphere Simulator. Acta Ecol. Sin. 2016, 36, 3911–3922. (In Chinese) [Google Scholar]
  27. Shao, Q.; Huang, L.; Liu, J.; Kuang, W.; Li, J. Analysis of forest damage caused by the snow and ice chaos along a transect across southern China in spring 2008. J. Geogr. Sci. 2011, 21, 219–234. [Google Scholar] [CrossRef]
  28. Lu, E.; Luo, Y.; Zhang, R.; Wu, Q.; Liu, L. Regional atmospheric anomalies responsible for the 2009–2010 severe drought in China. J. Geophys. Res. Space Phys. 2011, 116, 21114. [Google Scholar] [CrossRef]
  29. Bi, B.G.; Zhang, X.L.; Dai, K. Characteristics of 2016 severe convective weather and extreme rainfalls under the background of super El Niño. Chin. Sci. Bull. 2017, 62, 928–937. (In Chinese) [Google Scholar] [CrossRef]
  30. Wolter, K.; Timlin, M.S. El Niño/Southern Oscillation behaviour since 1871 as diagnosed in an extended multivariate ENSO index (MEI.ext). Int. J. Clim. 2011, 31, 1074–1087. [Google Scholar] [CrossRef]
  31. Behrenfeld, M.J.; Randerson, J.T.; Mcclain, C.R.; Feldman, G.C.; Los, S.O.; Tucker, C.J.; Falkowski, P.G.; Field, C.B.; Frouin, R.; Esaias, W.E.; et al. Biospheric Primary Production During an ENSO Transition. Science 2001, 291, 2594–2597. [Google Scholar] [CrossRef] [Green Version]
  32. Nemani, R.R.; Keeling, C.D.; Hashimoto, H. Climate-driven increases in global terrestrial net primary production from 1982 to 1999. Science 2003, 300, 1560–1563. [Google Scholar] [CrossRef]
  33. Bastos, A.; Gouveia, C.; Trigo, R.M.; Running, S.W. The global NPP dependence on ENSO: La Niña and the extraordinary year of 2011. J. Geophys. Res. Biogeosci. 2013, 118, 1247–1255. [Google Scholar] [CrossRef]
  34. Poulter, B.; Frank, D.; Ciais, P.; Myneni, R.B.; Andela, N.; Bi, J.; Broquet, G.; Canadell, J.G.; Chevallier, F.; Liu, Y.Y.; et al. Contribution of semi-arid ecosystems to interannual variability of the global carbon cycle. Nature. 2014, 509, 600–603. [Google Scholar] [CrossRef] [Green Version]
  35. Nowak, R.S.; Ellsworth, D.S.; Smith, S.D. Functional responses of plants to elevated atmospheric CO2–do photosynthetic and productivity data from FACE experiments support early predictions? New Phytol. 2004, 162, 253–280. [Google Scholar] [CrossRef]
  36. Reich, P.B.; Hobbie, S.E.; Lee, T.D. Plant growth enhancement by elevated CO2 eliminated by joint water and nitrogen limitation. Nat. Geosci. 2014, 7, 920. [Google Scholar] [CrossRef]
  37. Smith, W.K.; Reed, S.C.; Cleveland, C.C. Large divergence of satellite and Earth system model estimates of global terrestrial CO2 fertilization. Nat. Clim. Chang. 2016, 6, 306. [Google Scholar] [CrossRef]
  38. Hovenden, M.J.; Leuzinger, S.; Newton, P.C.D.; Fletcher, A.; Fatichi, S.; Lüscher, A.; Reich, P.B.; Andresen, L.C.; Beier, C.; Blumenthal, D.M.; et al. Globally consistent influences of seasonal precipitation limit grassland biomass response to elevated CO2. Nat. Plants. 2019, 5, 167. [Google Scholar] [CrossRef]
  39. Chen, J.M.; Ju, W.M.; Liu, R.G. Calculation and Optimization Methods of Global Terrestrial Carbon Sink Based on Remote Sensing; Science Press: Beijing, China, 2015; pp. 162–164. (In Chinese) [Google Scholar]
  40. Prentice, I.C.; Cramer, W.; Harrison, S.P.; Leemans, R.; Monserud, R.A.; Solomon, A.M. Special paper: A global biome model based on plant physiology and dominance, soil properties and climate. J. Biogeogr. 1992, 19, 117–134. [Google Scholar] [CrossRef]
  41. Haxeltine, A.; Prentice, I.C. BIOME3: An equilibrium terrestrial biosphere model based on ecophysiological constraints, resource availability, and competition among plant functional types. Glob. Biogeochem. Cycles. 1996, 10, 693–709. [Google Scholar] [CrossRef]
  42. Sitch, S.; Smith, B.; Prentice, I.C.; Arneth, A.; Bondeau, A.; Cramer, W.; Kaplan, J.; Levis, S.; Lucht, W.; Sykes, M.T.; et al. Evaluation of ecosystem dynamics, plant geography and terrestrial carbon cycling in the LPJ dynamic global vegetation model. Glob. Chang. Boil. 2003, 9, 161–185. [Google Scholar] [CrossRef]
  43. Gerten, D.; Schaphoff, S.; Haberlandt, U.; Lucht, W.; Sitch, S. Terrestrial vegetation and water balance—Hydrological evaluation of a dynamic global vegetation model. J. Hydrol. 2004, 286, 249–270. [Google Scholar] [CrossRef]
  44. Rost, S.; Gerten, D.; Bondeau, A.; Lucht, W.; Rohwer, J.; Schaphoff, S. Agricultural green and blue water consumption and its influence on the global water system. Water Resour. Res. 2008, 44. [Google Scholar] [CrossRef] [Green Version]
  45. Fader, M.; Rost, S.; Muller, C.; Bondeau, A.; Gerten, D. Virtual water content of temperate cereals and maize: Present and potential future patterns. J. Hydrol. 2010, 384, 218–231. [Google Scholar] [CrossRef]
  46. Müller, C.; Robertson, R.D. Projecting future crop productivity for global economic modeling. Agric. Econ. 2014, 45, 37–50. [Google Scholar] [CrossRef]
  47. Beringer, T.; Lucht, W.; Schaphoff, S. Bioenergy production potential of global biomass plantations under environmental and agricultural constraints. Gcb Bioenergy 2011, 3, 299–312. [Google Scholar] [CrossRef]
  48. Schaphoff, S.; Heyder, U.; Ostberg, S.; Gerten, D.; Heinke, J.; Lucht, W. Contribution of permafrost soils to the global carbon budget. Environ. Res. Lett. 2013, 8, 014026. [Google Scholar] [CrossRef]
  49. Thonicke, K.; Spessa, A.; Prentice, I.C.; Harrison, S.P.; Dong, L.; Carmona-Moreno, C. The influence of vegetation, fire spread and fire behaviour on biomass burning and trace gas emissions: Results from a process-based model. Biogeosciences 2010, 7, 1991–2011. [Google Scholar] [CrossRef]
  50. Bloh, W.; Schaphoff, S.; Müller, C.; Rolinski, S.; Waha, K.; Zaehle, S. Implementing the nitrogen cycle into the dynamic global vegetation, hydrology, and crop growth model LPJmL (version 5.0). Geosci. Model Dev. 2018, 11, 2789–2812. [Google Scholar] [CrossRef] [Green Version]
  51. Harris, I.; Jones, P.D.; Osborn, T.J.; Lister, D.H. Updated high-resolution grids of monthly climatic observations–the CRU TS3. 10 Dataset. Int. J. Climatol. 2014, 34, 623–642. [Google Scholar] [CrossRef]
  52. Mitchell, T.D.; Jones, P.D. An improved method of constructing a database of monthly climate observations and associated high-resolution grids. Int. J. Climatol. 2005, 25, 693–712. [Google Scholar] [CrossRef]
  53. McGuire, A.D.; Sitch, S.; Clein, J.S. Carbon balance of the terrestrial biosphere in the twentieth century: Analyses of CO2, climate and land use effects with four process-based ecosystem models. Glob. Biogeochem. Cycles. 2001, 15, 183–206. [Google Scholar] [CrossRef]
  54. Kichlighter, D.W.; Bruno, M.; Donges, S. A first-order analysis of the potential role of the potential role of CO2 fertilization to affect the global carbon budget: A comparison of four terrestrial biosphere models. Tellus B 1999, 51, 343–366. [Google Scholar]
  55. Zöbler, L. A World Soil File for Global Climate Modelling; NASA Technical Memorandum; National Aeronautics and Space Administration, Goddard Space Flight Center, Institute for Space Studies: Washington, DC, USA, 1986.
  56. FAO. The Digitized Soil Map of the World (Release 1.0); Food and Agriculture Organization: Rome, Italy, 1991. [Google Scholar]
  57. Deb, P.; Debnath, P.; Denis, A.F.; Lepcha, O.T. Variability of soil physicochemical properties at different agroecological zones of Himalayan region: Sikkim, India. Environ. Dev. Sustain. 2018, 1–19. [Google Scholar] [CrossRef]
  58. Van Vuuren, D.P.; Edmonds, J.; Kainuma, M. The representative concentration pathways: An overview. Clim. Chang. 2011, 109, 5. [Google Scholar] [CrossRef]
  59. Jin, Z.H.; Tao, S.Y. A Study on the Relationships between ENSO Cycle and Rainfalls during summer and winter in Eastern China. Chin. J. Atmos. Sci. 1999, 23, 663–672. (In Chinese) [Google Scholar]
  60. Zhang, L.P.; Zhang, L.F. The relationships between ENSO and JJA rainfull over the east of China. J. Trop. Meteorol. 2012, 28, 177–186. (In Chinese) [Google Scholar]
  61. Fan, L.L.; Xu, F.; Xu, H. Spring and summer El Niño events and their influences on summer precipitation in China. Trans. Atmos. Sci. 2018, 41, 101–110. (In Chinese) [Google Scholar]
  62. Tao, B.; Li, K.; Shao, X. The temporal and spatial patterns of terrestrial net primary productivity in China. J. Geogr. Sci. 2003, 13, 163–171. (In Chinese) [Google Scholar]
  63. Timlin, M.S.; Wolter, K. Measuring the strength of ENSO events: How does 1997/98 rank? Weather 1998, 53, 315–324. [Google Scholar]
  64. Zhu, W.Q.; Pan, Y.Z.; Zhang, J.S. Estimation of net primary productivity of Chinese terrestrial vegetation based on remote sensing. Acta Phytoecol. Sin. 2007, 31, 413–424. (In Chinese) [Google Scholar]
  65. Gao, Y.N.; Yu, G.R.; Zhang, L.; Liu, M.; Huang, M.; Wang, Q. The changes of net primary productivity in Chinese terrestrial ecosystem: Based on process and parameter models. Prog Geogr. 2012, 31, 109–117. (In Chinese) [Google Scholar]
  66. Xiao, X.M.; Melillo, J.; Kicklighter, D.W.; Pan, Y. Net primary production of terrestrial ecosystems in China and its equilibrium response to changes in climate and atmospheric CO2 concentration. Acta Phytoecol. Sin. 1998, 22, 97–118. [Google Scholar]
  67. Gao, Z.Q.; Liu, J.Y. Simulation study of China’s net primary production. Chin. Sci. Bull. 2008, 53, 434–443. [Google Scholar] [CrossRef]
  68. Ji, J.J.; Huang, M.; Li, K.R. Prediction of carbon exchanges between China terrestrial ecosystem and atmosphere in 21st century. Sci. China. 2008, 51, 211–223. (In Chinese) [Google Scholar] [CrossRef]
  69. Sun, G.D. Simulation of potential vegetation distribution and estimation of carbon flux in China from 1981 to 1998 with LPJ dynamic global vegetation model. Clim. Environ. Res. 2009, 14, 341–351. (In Chinese) [Google Scholar]
  70. Baldocchi, D.; Falge, E.; Gu, L.; Olson, R.; Hollinger, D.; Running, S.; Anthoni, P.; Bernhofer, C.; Davis, K.; Evans, R.; et al. FLUXNET: A New Tool to Study the Temporal and Spatial Variability of Ecosystem–Scale Carbon Dioxide, Water Vapor, and Energy Flux Densities. Bull. Am. Meteorol. Soc. 2001, 82, 2415–2434. [Google Scholar] [CrossRef]
  71. Yu, G.R.; Zhu, X.J.; Fu, Y.L.; He, H.L.; Wang, Q.F.; Wen, X.F.; Li, X.R.; Zhang, L.M.; Zhang, L.; Su, W.; et al. Spatial patterns and climate drivers of carbon fluxes in terrestrial ecosystems of China. Glob. Chang. Boil. 2013, 19, 798–810. [Google Scholar] [CrossRef]
  72. Xiao, J.; Sun, G.; Chen, J. Carbon fluxes, evapotranspiration, and water use efficiency of terrestrial ecosystems in China. Agric. For. Meteorol. 2013, 182, 76–90. [Google Scholar] [CrossRef]
  73. Blue Book on Climate Change of China (2018); China Meteorological Administration Climate Change Center: Beijing, China, 2018. (In Chinese)
Figure 1. Time series of the MAT (a,b) and MAP (c,d) in China projected by different climate models under the AR4 (a,c) and AR5 (b,d) scenarios.
Sustainability 11 04176 g001
Figure 2. Times series of global atmospheric CO2 from 1961 to 2100 in four IPCC SRES.
Sustainability 11 04176 g002
Figure 3. The temporal variations of the total NPP (solid black line) in China and multivariate ENSO index (MEI) (gray chart) from 1961 to 2016. EI Niño and La Niña events are marked with red and blue circles, respectively.
Sustainability 11 04176 g003
Figure 4. Spatial distribution of simulated NPP (g C m−2 yr−1) averaged over the period from 1961 to 2016 in China.
Sustainability 11 04176 g004
Figure 5. Of total annual NPP and average NPP in six geographical regions of China from 1961 to 2016. Grey bars are averages of regional total NPP (Pg Cyr−1) in the periods of 1961–1980, 1981–2000, and 2001–2016, and the blue bars are the average total NPP of the regions between 1961 and 2016. The black lines are the average NPP (g C m−2 yr−1) in the periods of 1961–1980, 1981–2000, 2001–2016, and 1961–2016. NW: Northwest China (Xinjang, Qinghai, Gansu, Ningxia, and Shaanxi); NC: North China (Inner Mongolia, Shanxi, Hebei, Beijing, and Tianjing); NE: Northeast China (Heilongjiang, Jining, Liaoning); SW: Southwest China (Tibet, Sichuan, Chongqing, Yunnan, and Guizhou); CS: South-central China (Henan, Hubei, Hunan, Guangxi, Guangdong, Hainan, HongKong, and Macao); EC: East China (Shandong, Anhui, Shanghai, Jiangsu, Zhejiang, Jiangxi, Fujian, and Taiwan).
Sustainability 11 04176 g005
Figure 6. Trends of MAT and MAP in six geographical regions of China from 1961 to 2016. Grey bars are averages of regional precipitation (mm) in the periods of 1961–1980, 1981–2000, and 2001–2016, and the blue bars are the average precipitation of the regions between 1961 and 2016. The black lines are the average temperature (°C) in the periods of 1961–1980, 1981–2000, 2001–2016, and 1961–2016.
Sustainability 11 04176 g006
Figure 7. NPP anomaly (departure from the average NPP from 1961 to 2016) in six geographical regions of China from 1961 to 2016.
Sustainability 11 04176 g007
Figure 8. Locations of flux towers with measured GPP for validating simulated GPP (left) and the scatter plot of simulated GPP and observations (right).
Sustainability 11 04176 g008
Figure 9. Spatial distribution of annual NPP (g C m−2 yr−1) in China simulated with CO2 concentration and projected climate under different climate change scenarios in different periods. Values shown are averages of NPP simulated using climates projected by two different climate models. (ac) are results in the A2 scenario; (df) are results in the B1 scenario; (gi) are results in the RCP45 scenario; (jl) are results in the RCP85 Scenario.
Sustainability 11 04176 g009aSustainability 11 04176 g009b
Figure 10. The variation of total NPP under A2 (a), B2 (b), RCP85 (c) and RCP45 (d) scenarios: The red lines represent NPP simulated with only CO2 change and 2007–2016 random climate. The blue lines are NPP simulated with future climate change and CO2 in 2016; The green line is in condition of combined climate change and CO2 change.
Sustainability 11 04176 g010
Table 1. Details of eight future climate scenarios from CMIP3 and CMIP5.
NOScenariosProjectsGCMsSRES
1CNRM-CM3-A2CMIP3CNRM-CM3AR4-A2
2CCSM3-A2CMIP3NCAR-CCSM3AR4-A2
3CNRM-CM3-B1CMIP3CNRM-CM3AR4-B1
4CCSM3-B1CMIP3NCAR-CCSM3AR4-B1
5CNRM-CM5-RCP45CMIP5CNRM-CM5AR5-RCP45
6CCSM4-RCP45CMIP5NCAR-CCSM4AR5-RCP45
7CNRM-CM5-RCP85CMIP5CNRM-CM5AR5-RCP85
8CCSM3-RCP85CMIP5NCAR-CCSM4AR5-RCP85
Table 2. Configurations of historical and future climate and CO2 in different simulations.
SimulationsScenarioHistoryClimate ChangeCO2 Change
1A2_CO2CRUNoA2
2B1_CO2CRUNoB1
3RCP45_CO2CRUNoRCP45
4RCP85_CO2CRUNoRCP85
5A2_CCRUA2No
6B1_CCRUB1No
7RCP45_CCRURCP45No
8RCP85_CCRURCP85No
9A2_CoupleCRUA2A2
10B1_CoupleCRUB1B1
11RCP45_CoupleCRURCP45RCP45
12RCP85_CoupleCRURCP85RCP85
Table 3. National total NPP in China in previous and current studies.
ModelPeriodNPP (Pg C yr−1)Reference
TEM4modern3.65[66]
LUE model1992–19932.65[17]
CASA19971.95[15]
CASA1982–19991.80[16]
CASA1982–19991.44[14]
CEVSA, GLO-PEN1981–19983.05[19]
CEVSA1981–19983.09[23]
LPJ1961–20004.64[20]
Remote Sensing model1989–19933.12[65]
BEPS20012.24[21]
CEVSA,CASA et al.1980–20052.86[67]
AVIM21981–20002.94[68]
LPJ1981–19983.11[69]
BEPS2000–20102.74[24]
CASA1980–20102.54[25]
Statistical model2000–20103.89[13]
IBIS1960–20162.46[26]
CASA20152.93[18]
LPJ1961–20163.10This Study
Table 4. Comparison of annual GPP simulated by LPJ with observations.
CodeTypesLatitudeLongitudePeriodGPPobsLPJsimRPE%
DHSForest23.17112.532003–20081367.26 ± 78.421953.9842.91%
QYZForest26.73115.052003–20081798.74 ± 100.441926.077.08%
CBSForest42.40128.102003–20081338.84 ± 108.861437.487.37%
HZForest51.78123.022010962.751133.0217.69%
XSBNForest21.95101.202003–20082342.67 ± 174.102020.26−13.76%
ALSForest24.53101.022009–20101848.331791.98−3.05%
LSForest45.33127.67200413511472.649.00%
YYForest29.53112.862006–20071974.81948.72−1.32%
AQForest30.47116.992006–20071859.21948.234.79%
XPForest33.35113.9120101288.11425.9310.70%
YCCropland36.83116.572003–20081746.62 ± 139.351250.08−28.43%
TYCCropland44.57122.922004–2006444.33 ± 56.36356.00−19.88%
WSCropland36.65116.052007–200818381208.18−34.27%
NMGrassland44.53116.672004–2008231.66 ± 111.13329.2742.13%
XLDGrassland43.55116.672006294.44392.8333.42%
SJYGrassland34.35100.552006480.27701.1345.99%
DTZWetland31.58121.9020051512.631704.3112.67%
PJWetland41.13121.9020051298.161371.525.65%
Note: RPE means Relative Predictive Error and is calculated as (LPJsim-GPPobs)/ GPPobs ×100%.
Table 5. Averages of total NPP simulated using future CO2 concentration and projected climates by two climate models under different scenarios.
PeriodsA2RCP85B1RCP45
NCARCNRMNCARCNRMNCARCNRMNCARCNRM
2010s3.43.43.33.53.33.33.43.4
2020s3.73.43.63.73.43.43.43.5
2030s3.83.73.63.83.73.53.73.6
2040s3.93.83.74.04.03.83.83.9
2050s4.14.03.94.04.24.03.93.8
2060s4.54.23.93.94.54.14.04.1
2070s4.64.34.04.04.74.64.03.8
2080s4.94.63.94.24.94.94.04.1
2090s5.04.84.24.25.15.13.93.9

