Preventive Archaeology Based on Open Remote Sensing Data and Tools: The Cases of Sant’Arsenio (SA) and Foggia (FG), Italy


Abstract
1. Introduction
1.1. Copernicus Programme and Tools for Cultural Heritage
1.2. Purpose
2. Materials and Methods
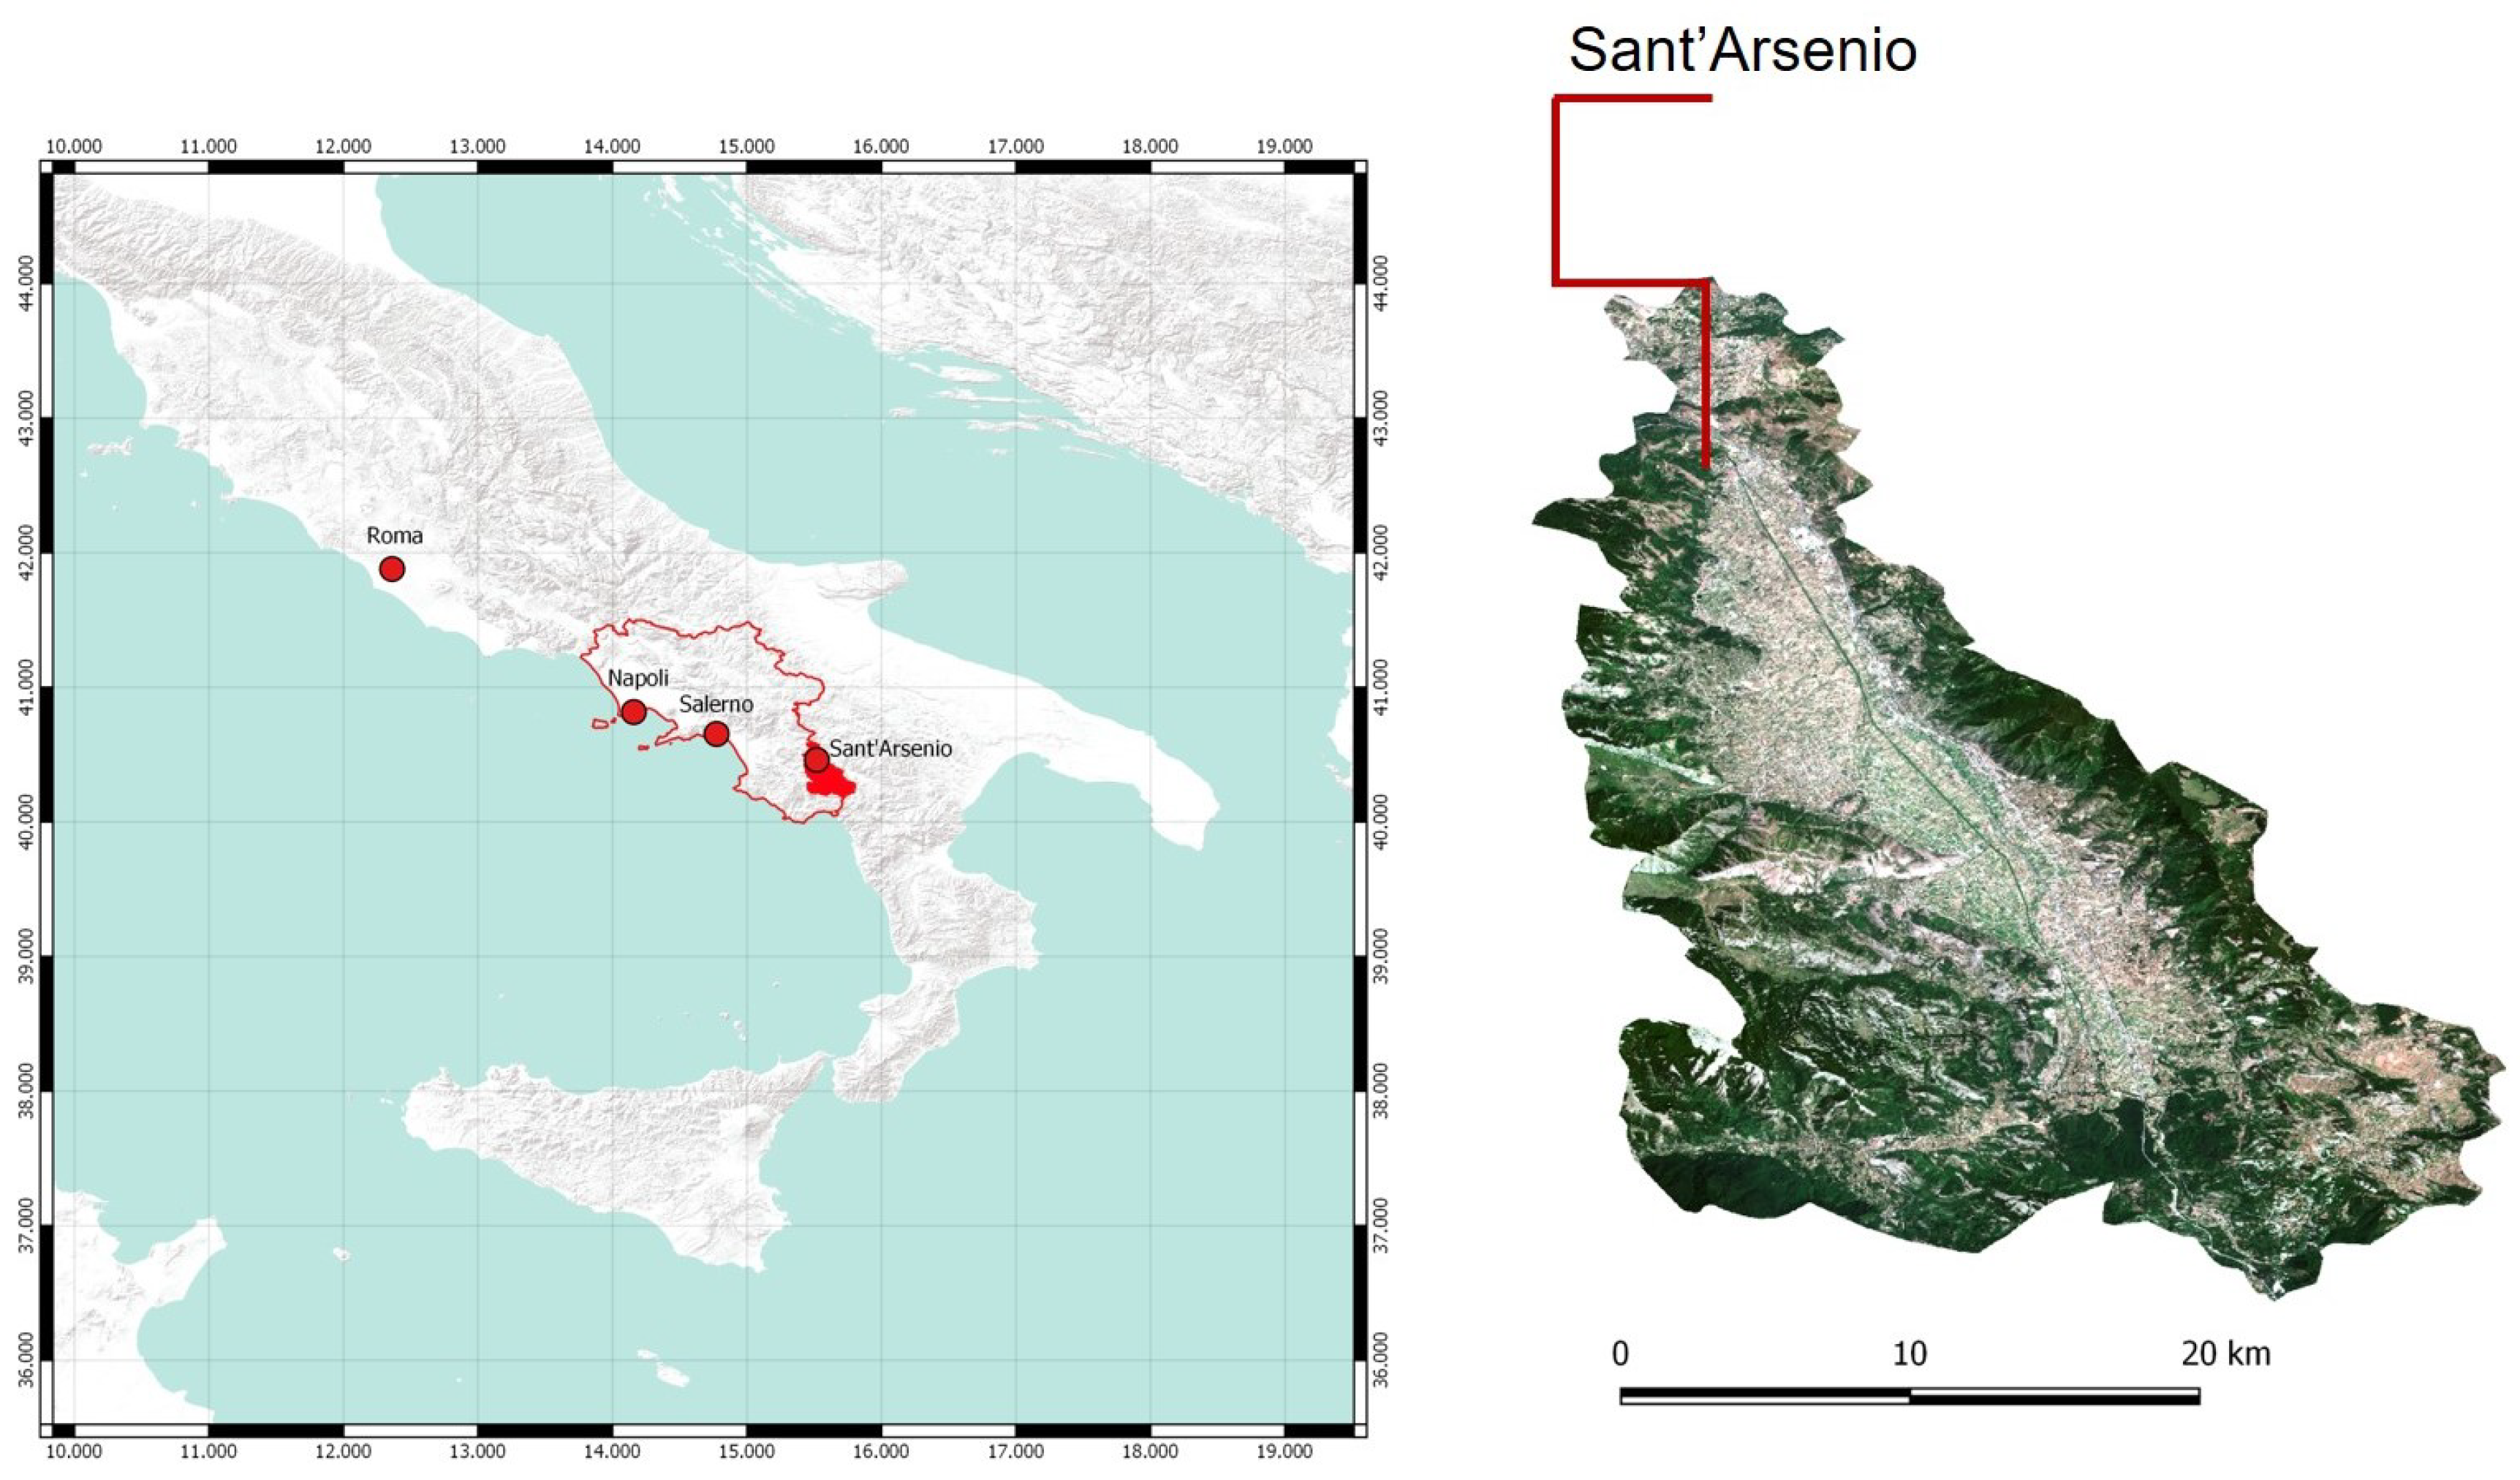
2.1. Sant’Arsenio
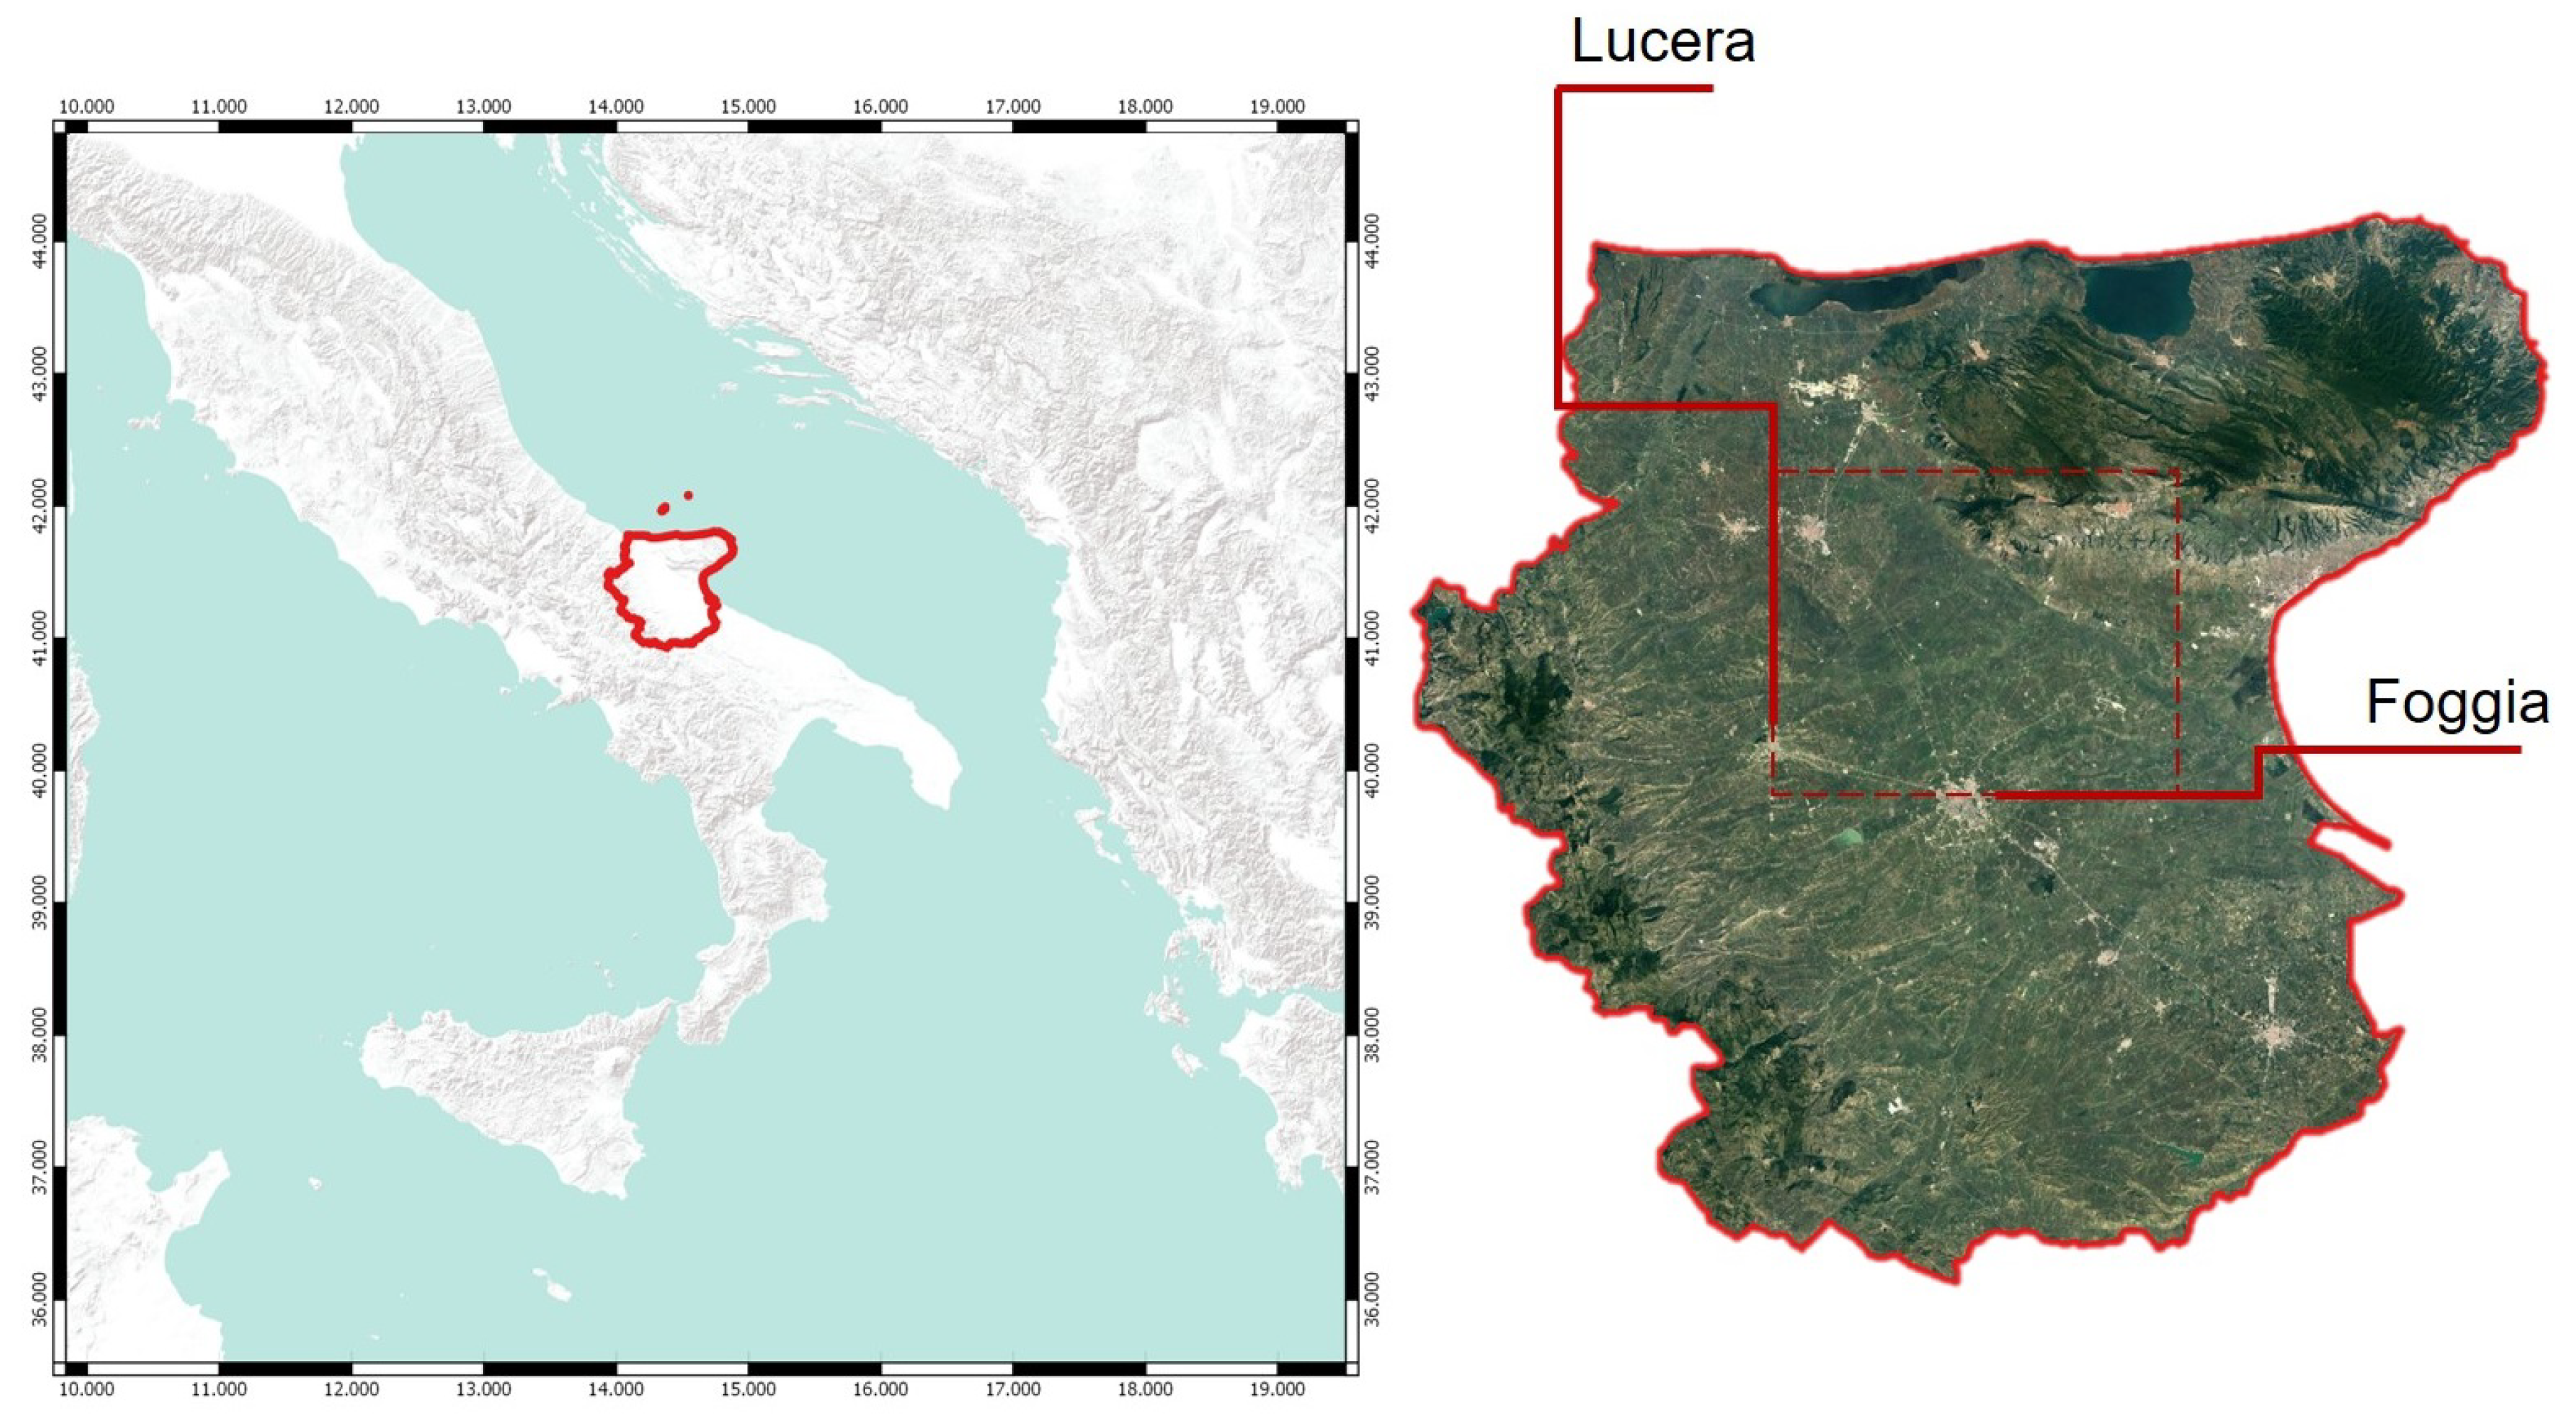
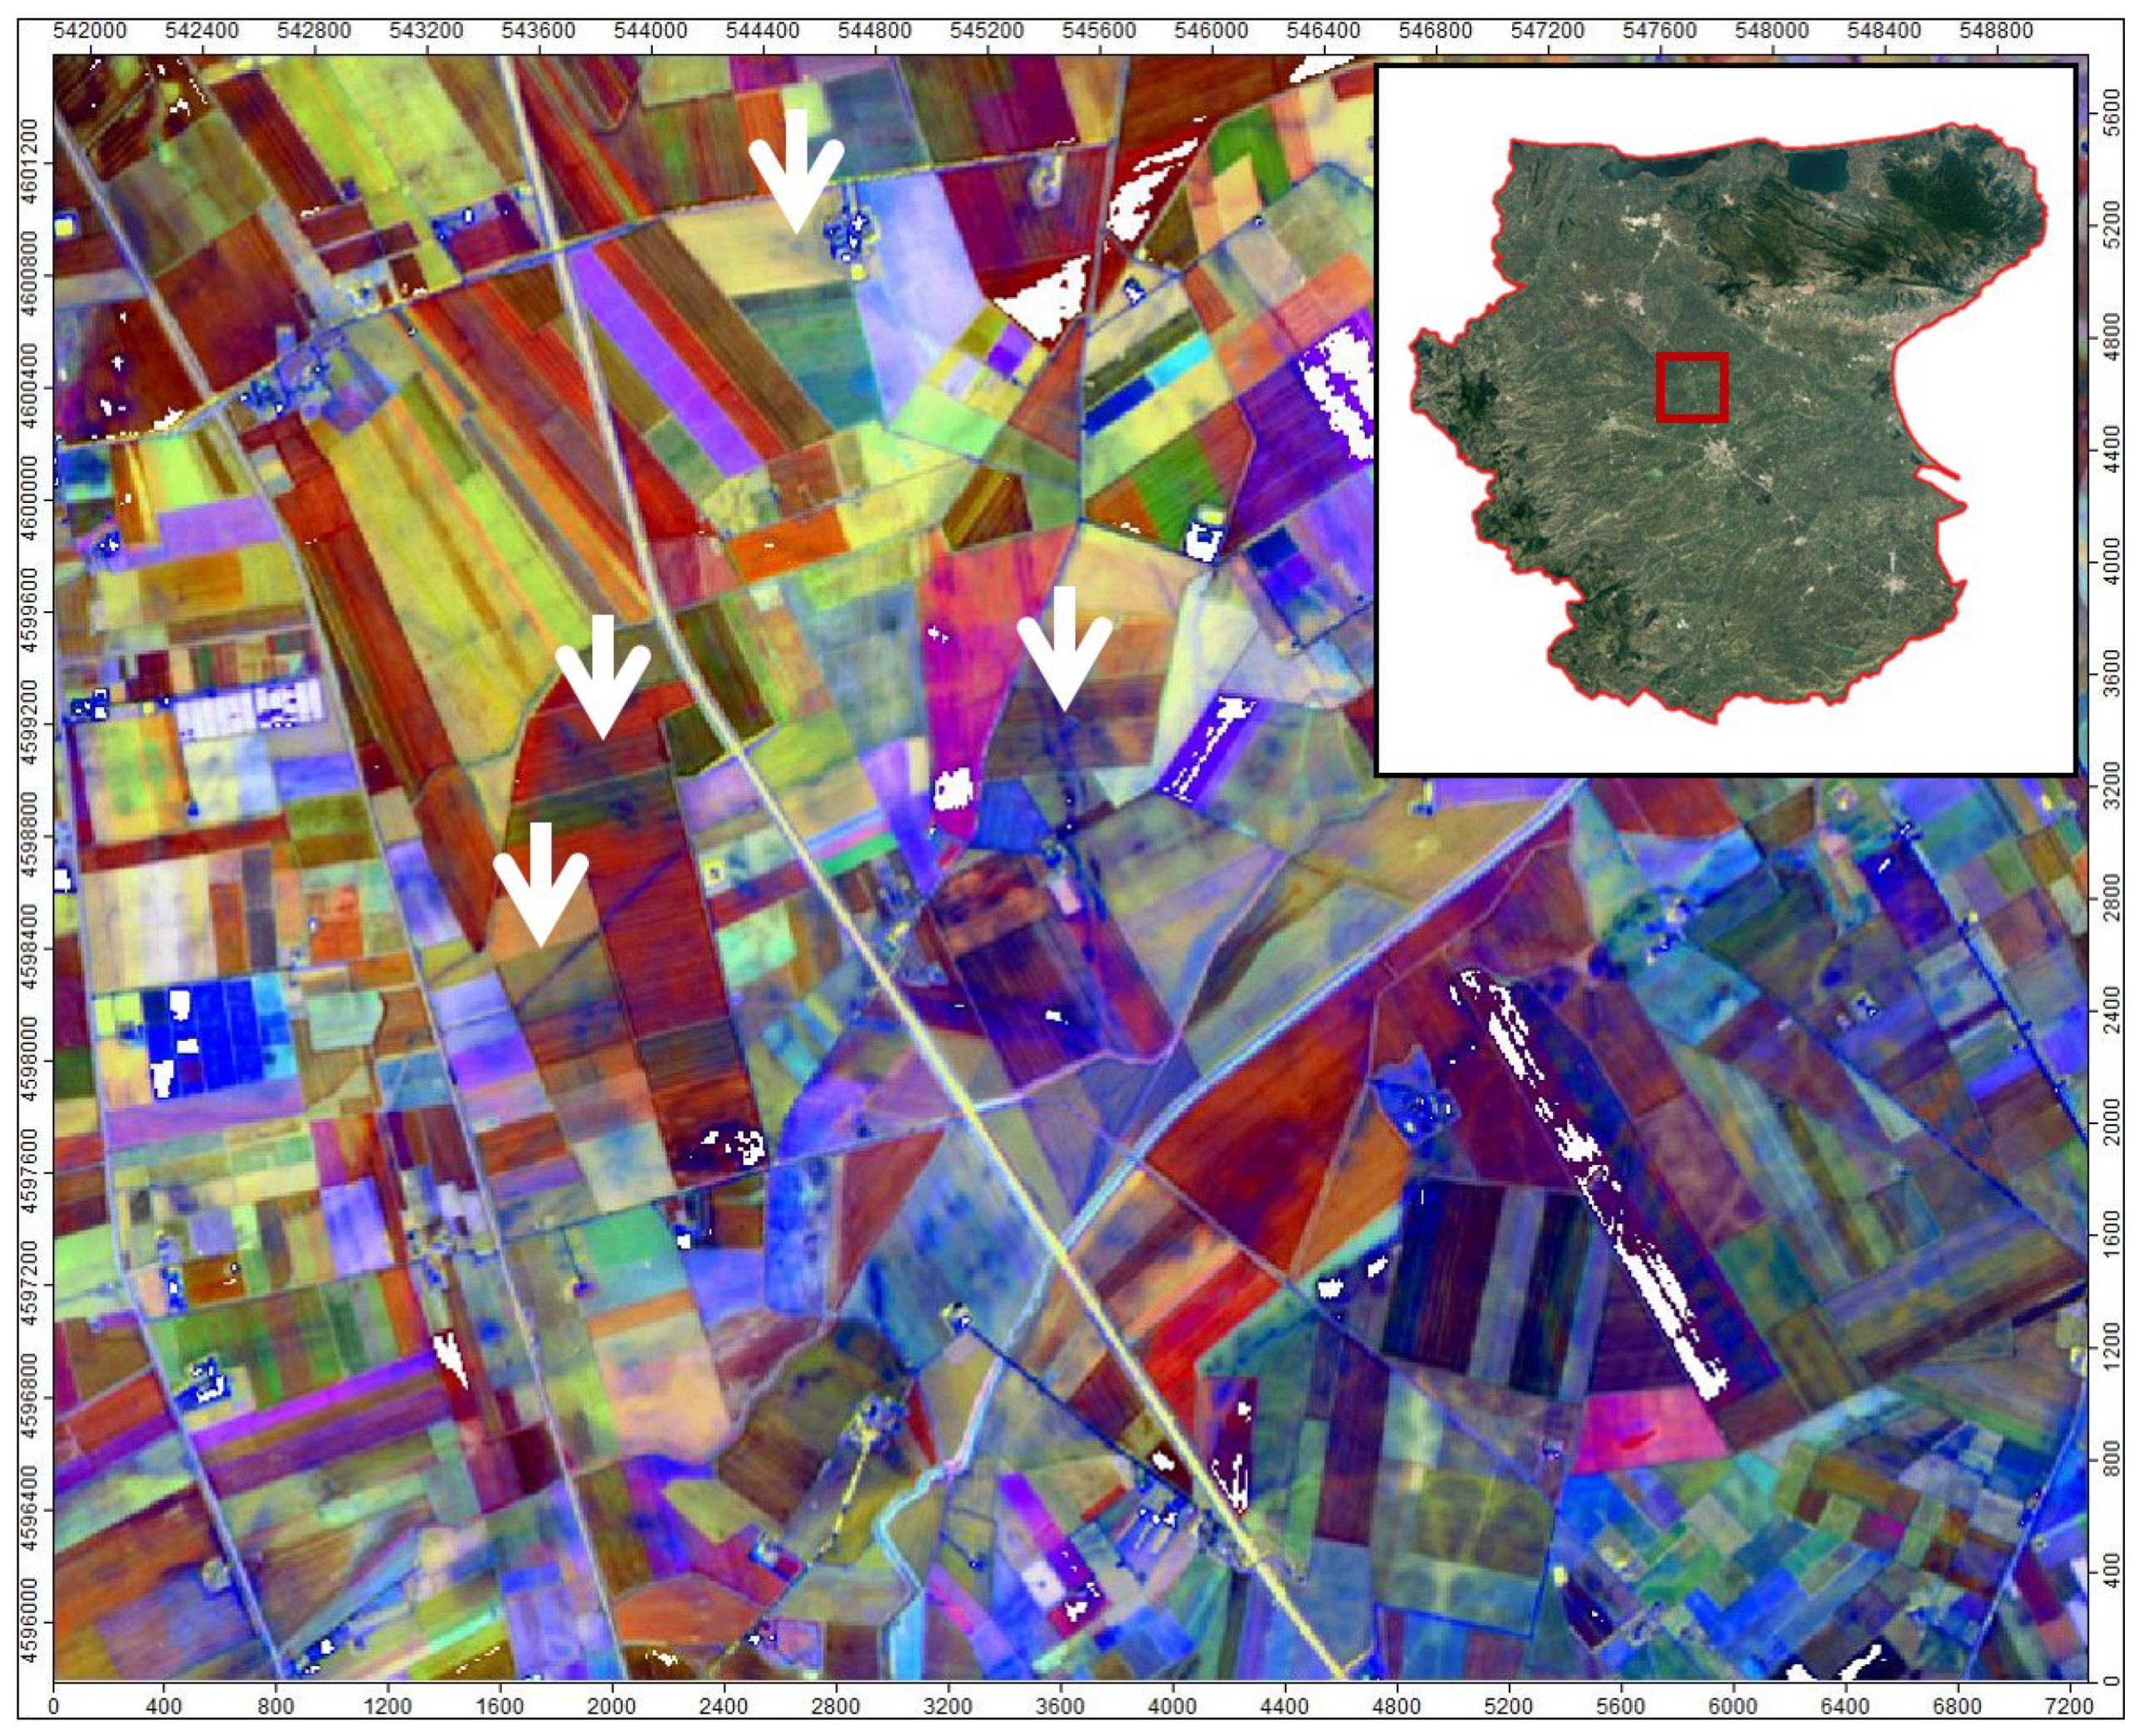
2.2. Foggia and Its Territory
2.3. Sentinel-2
2.4. Other Tools
2.4.1. Google Tools
2.4.2. National Service Tools
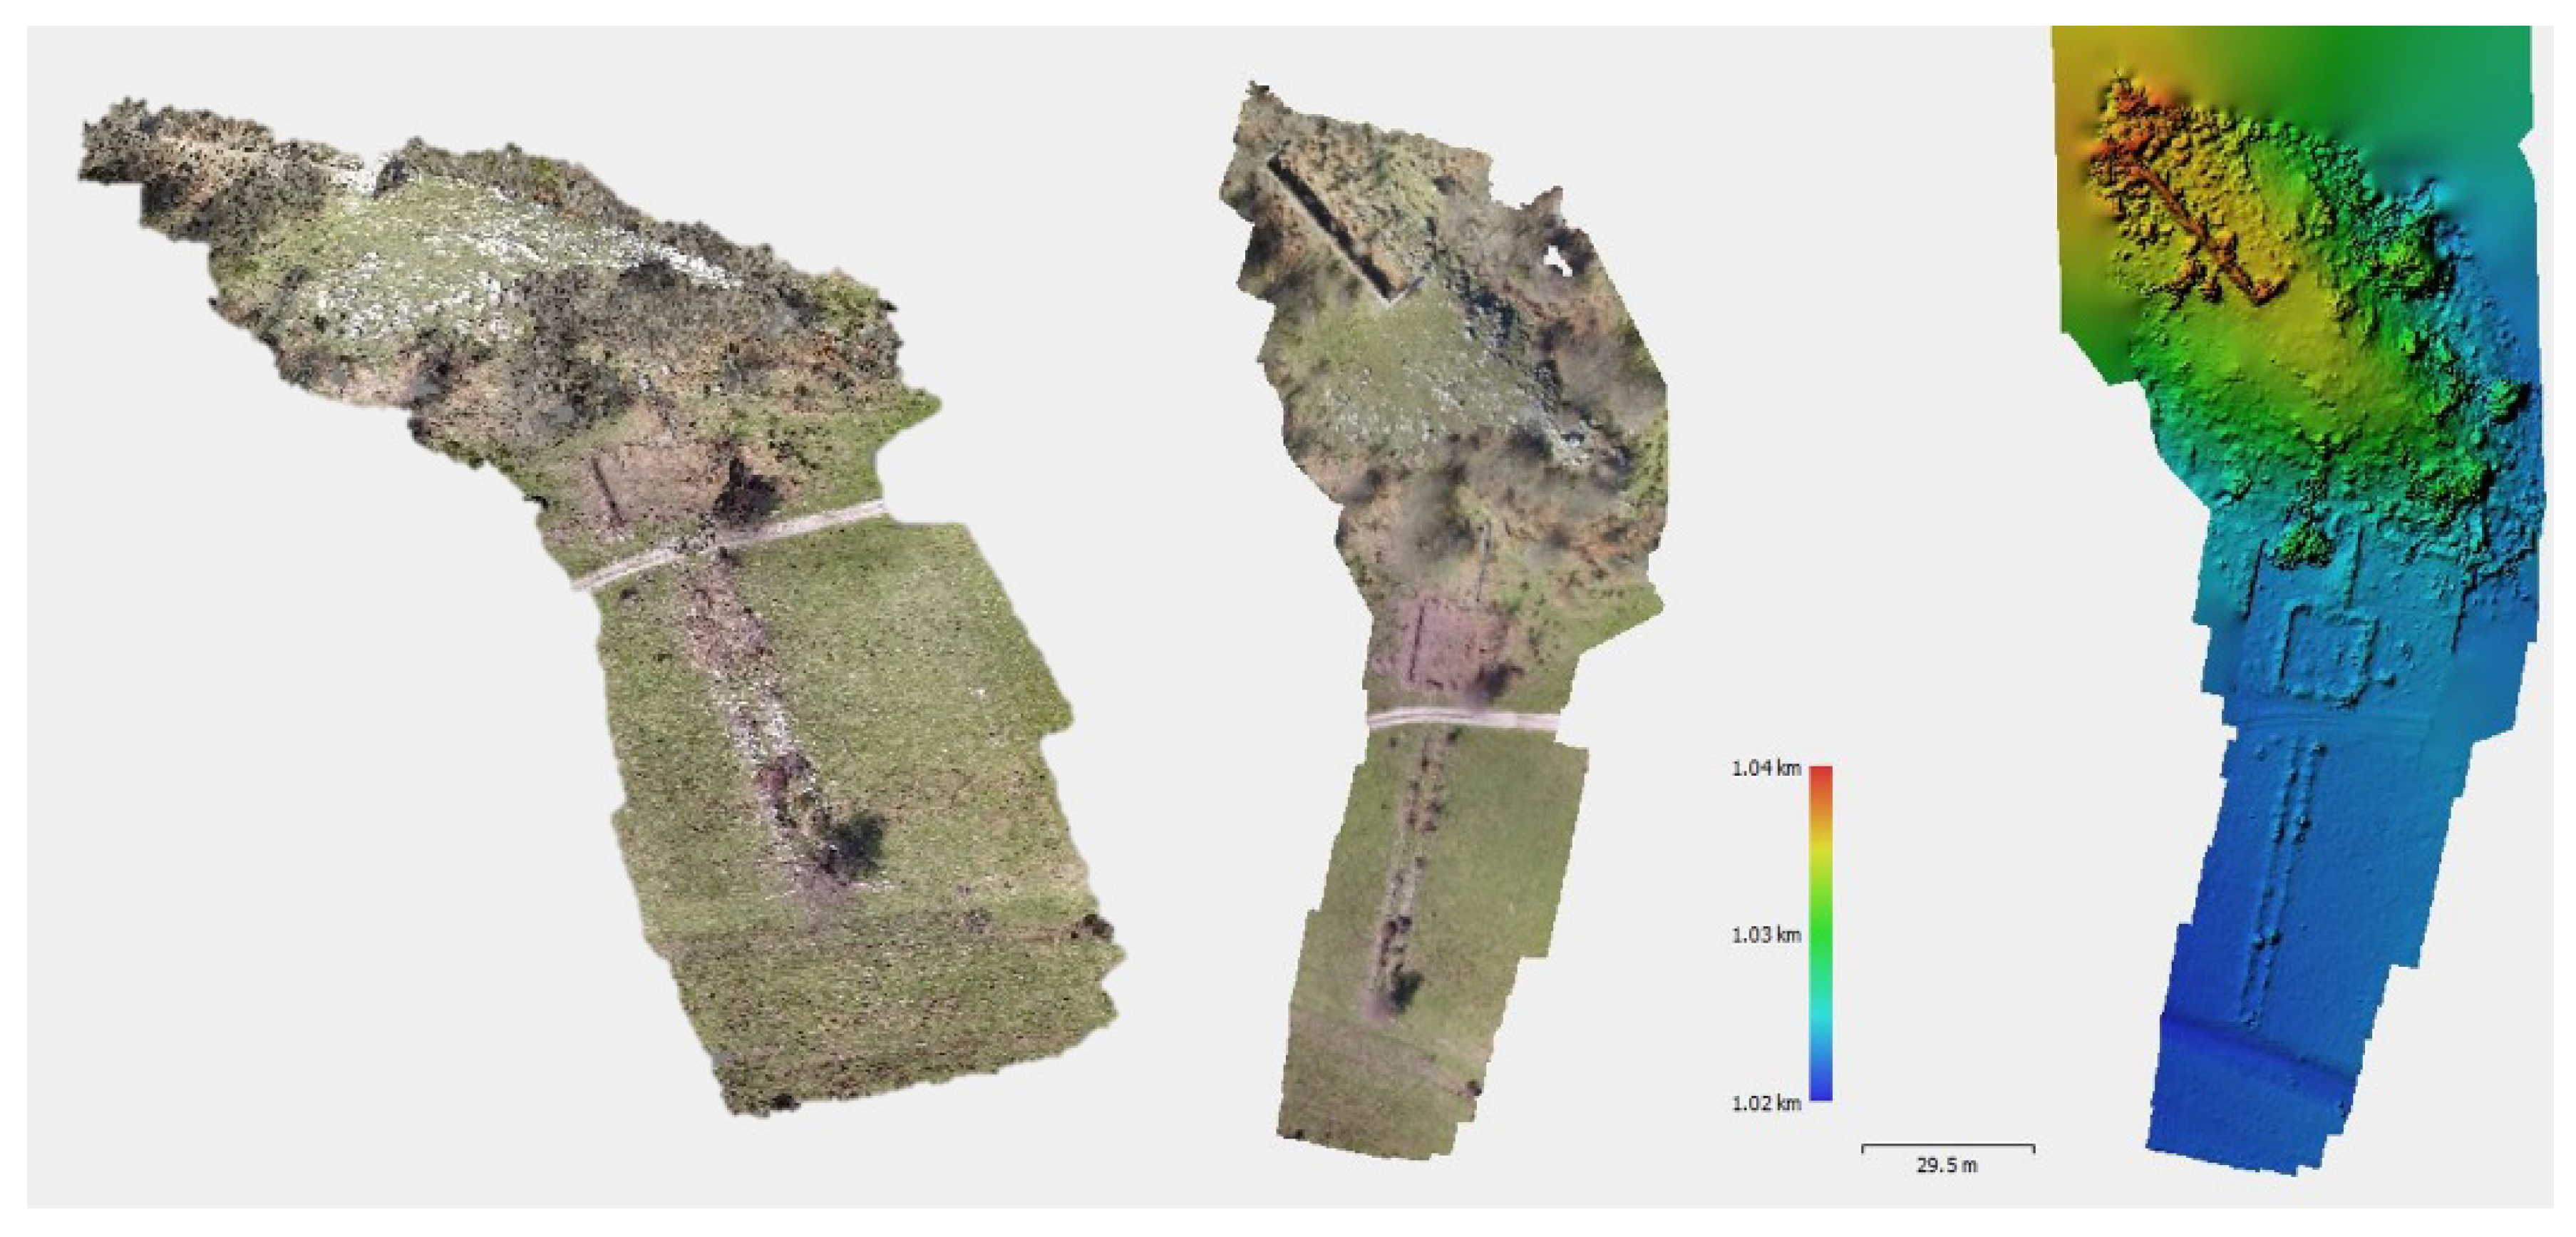
2.4.3. UAV for Cultural Heritage
3. Results
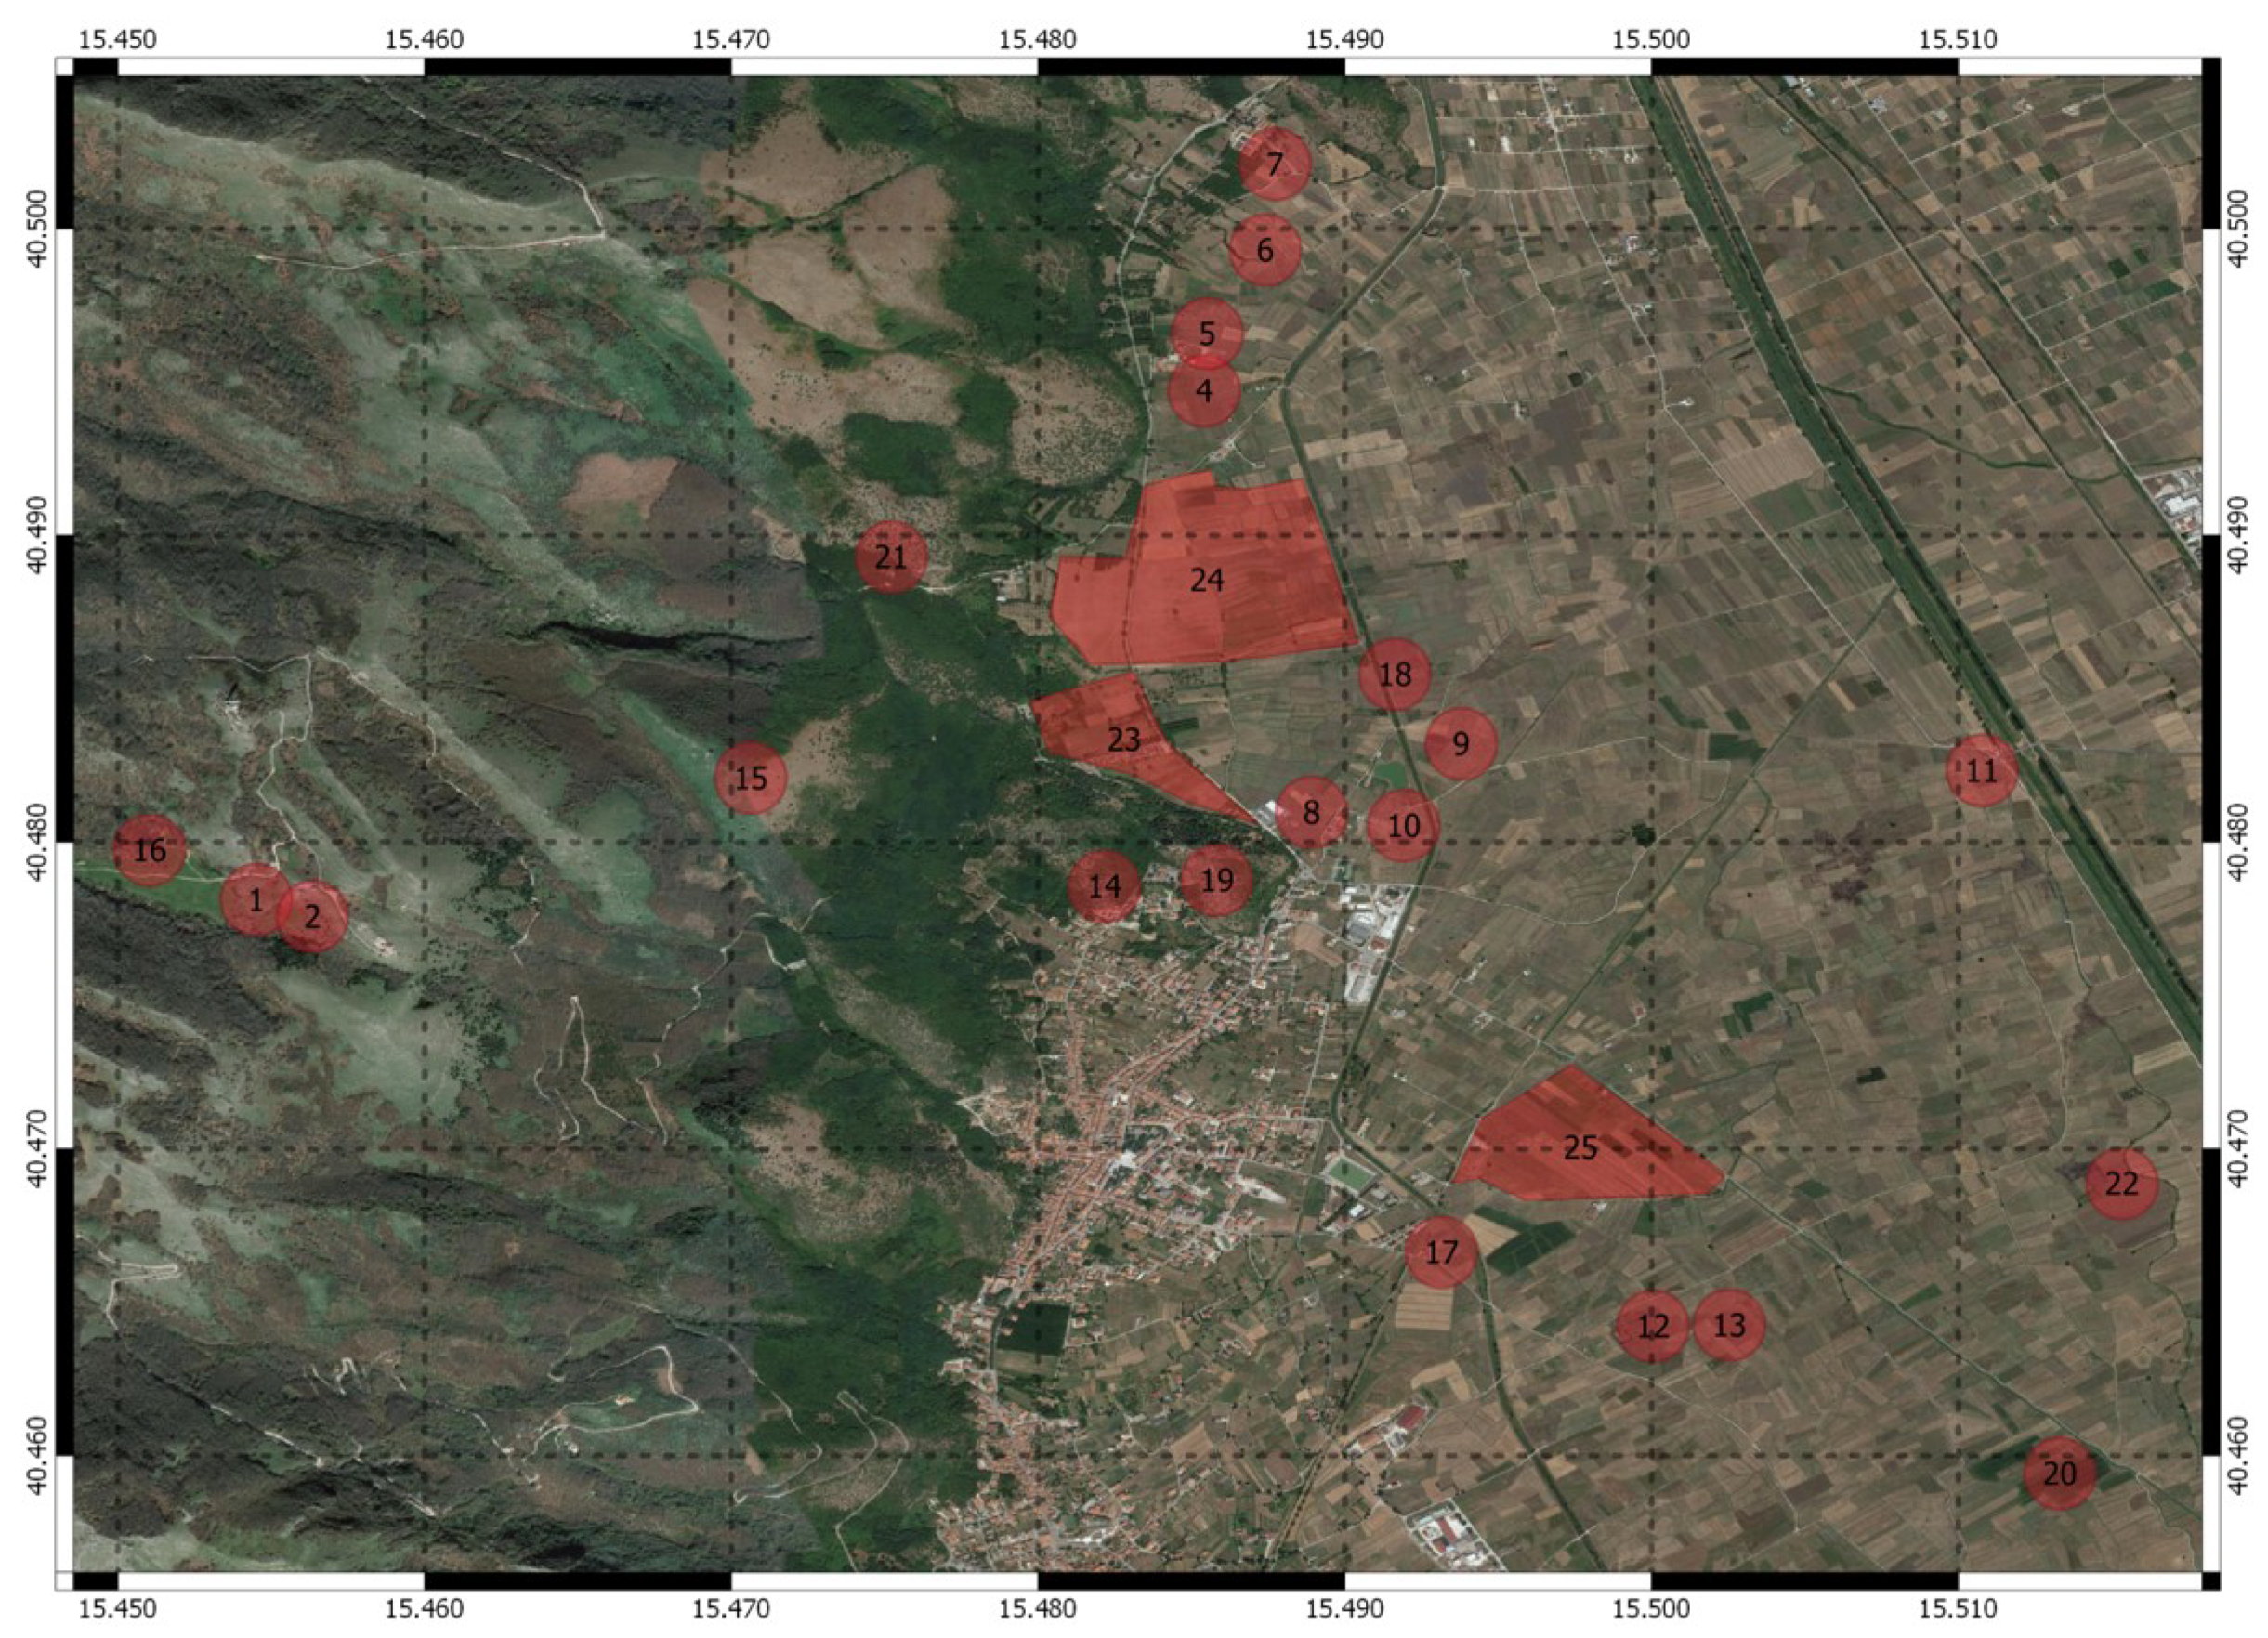
3.1. Sant’Arsenio
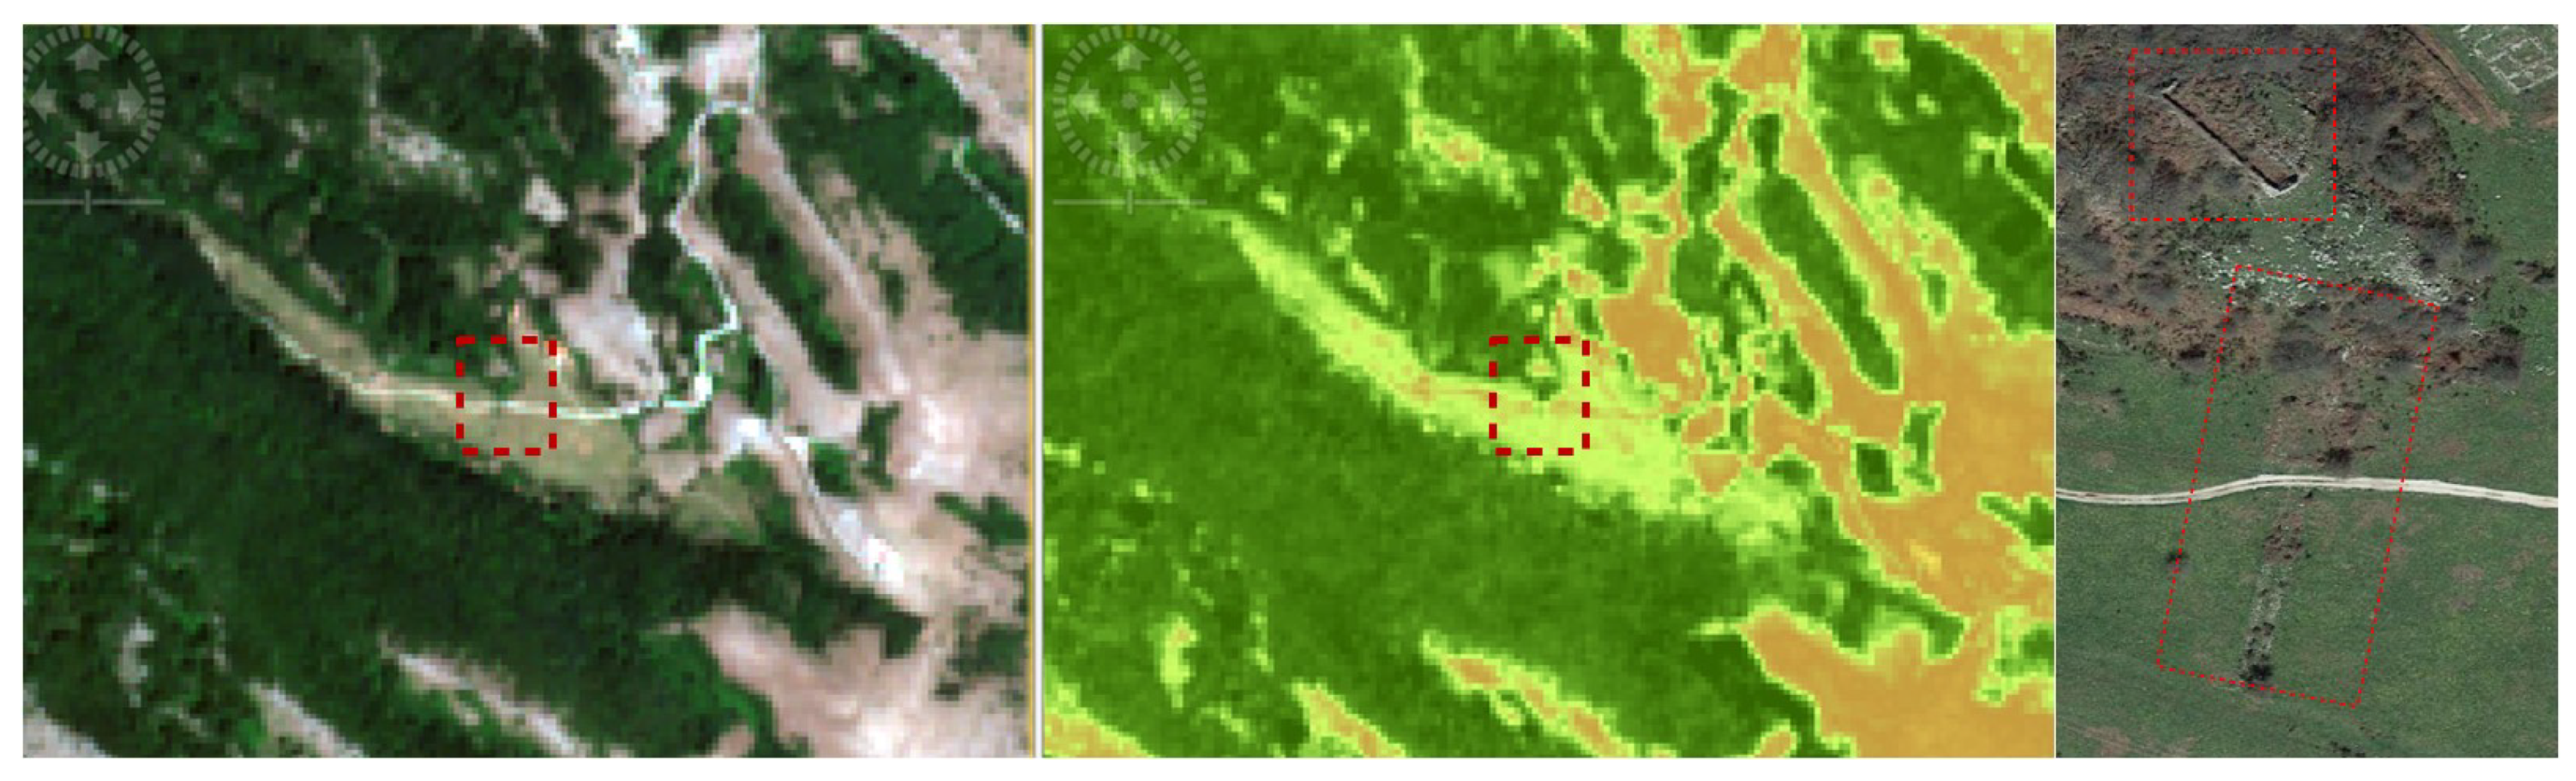
3.1.1. Serra la Compra
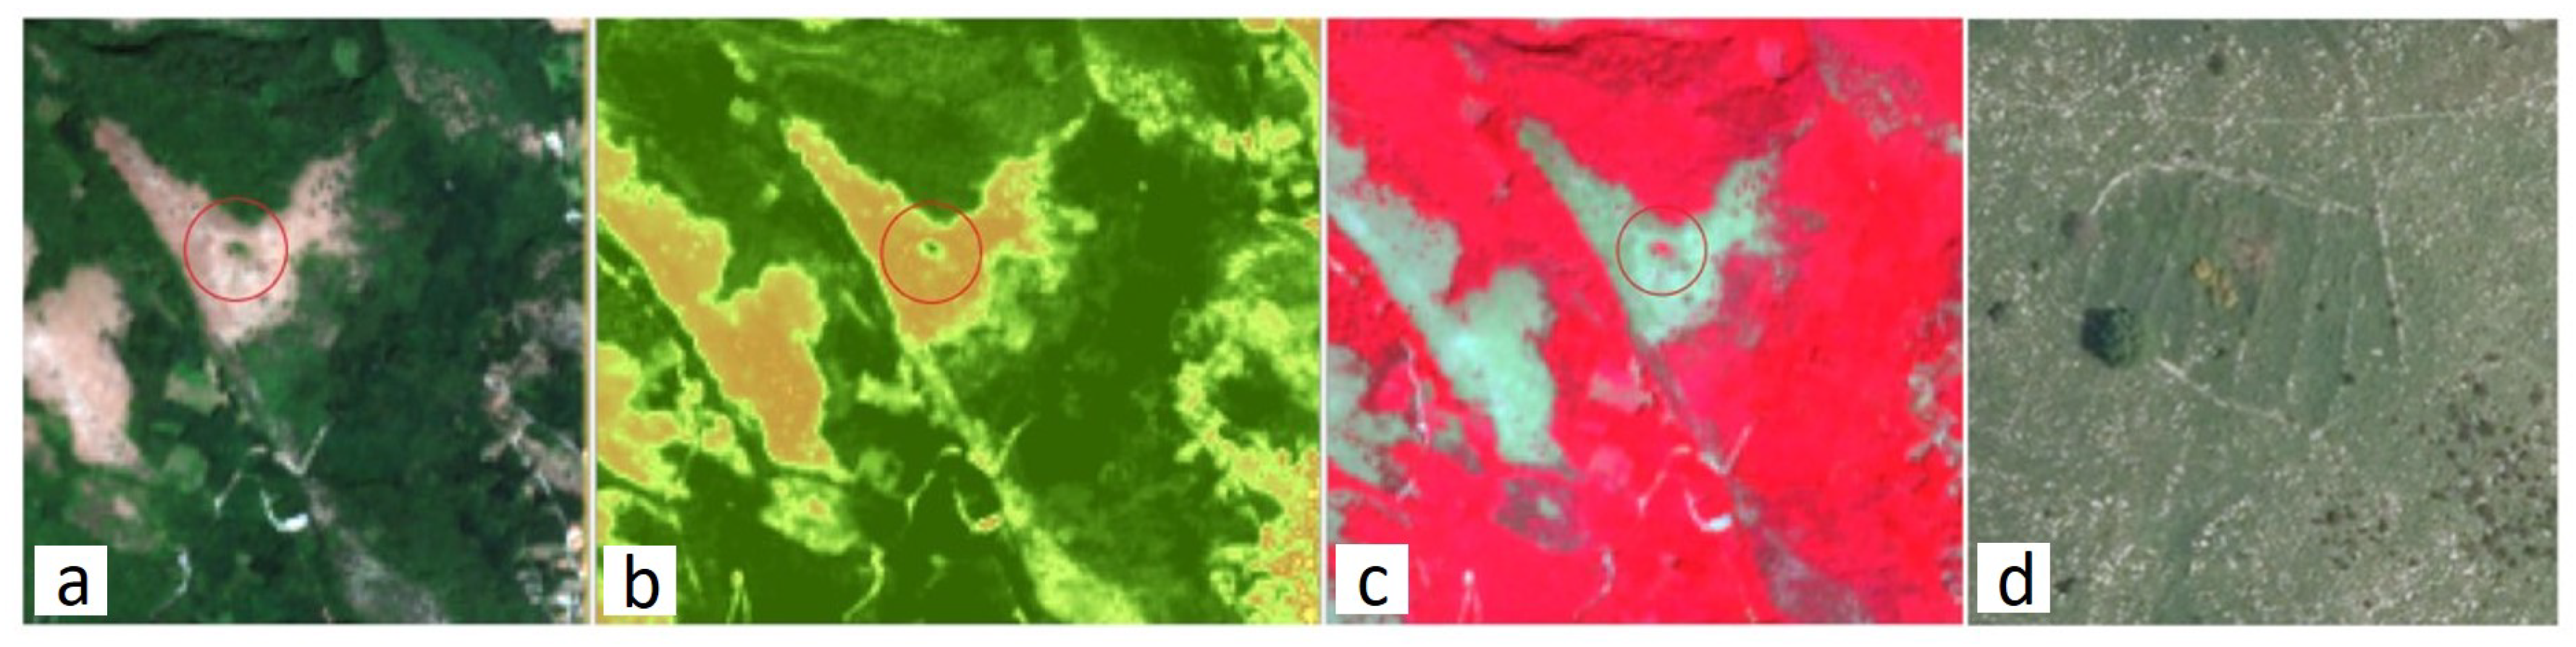
3.1.2. Mount Carmelo
3.1.3. Remote Sensing, Historical Sources and Archaeological Data
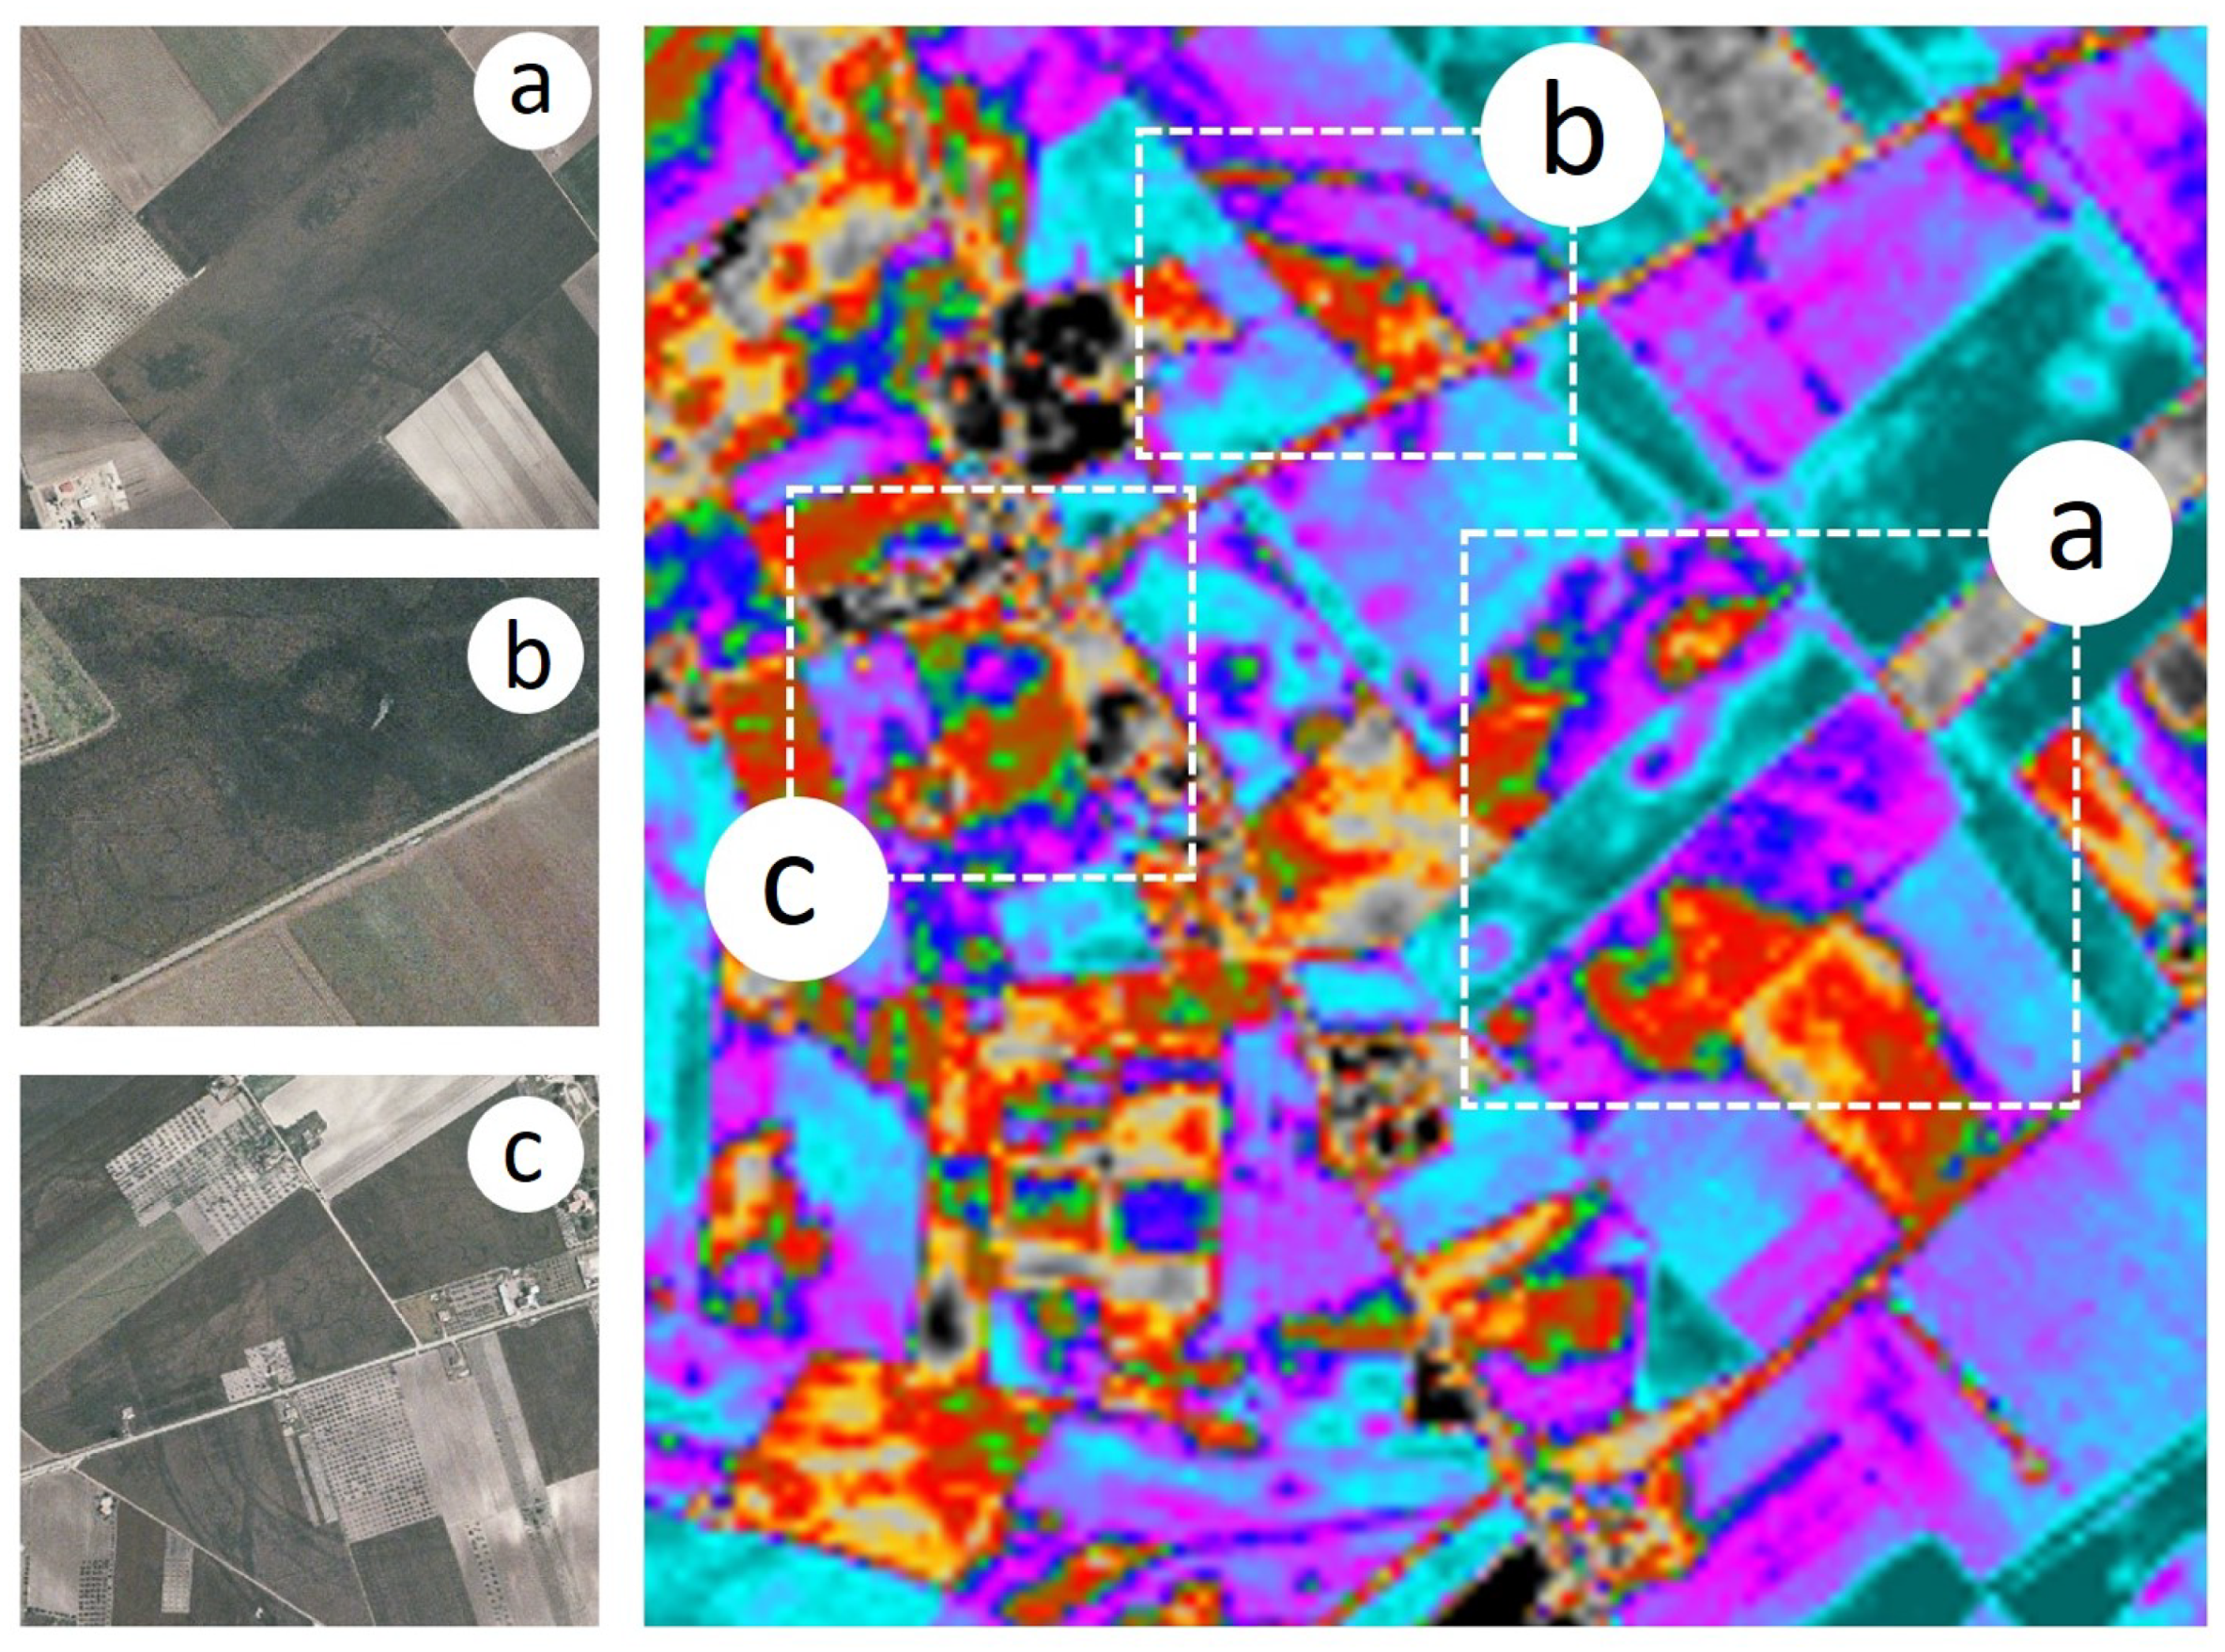
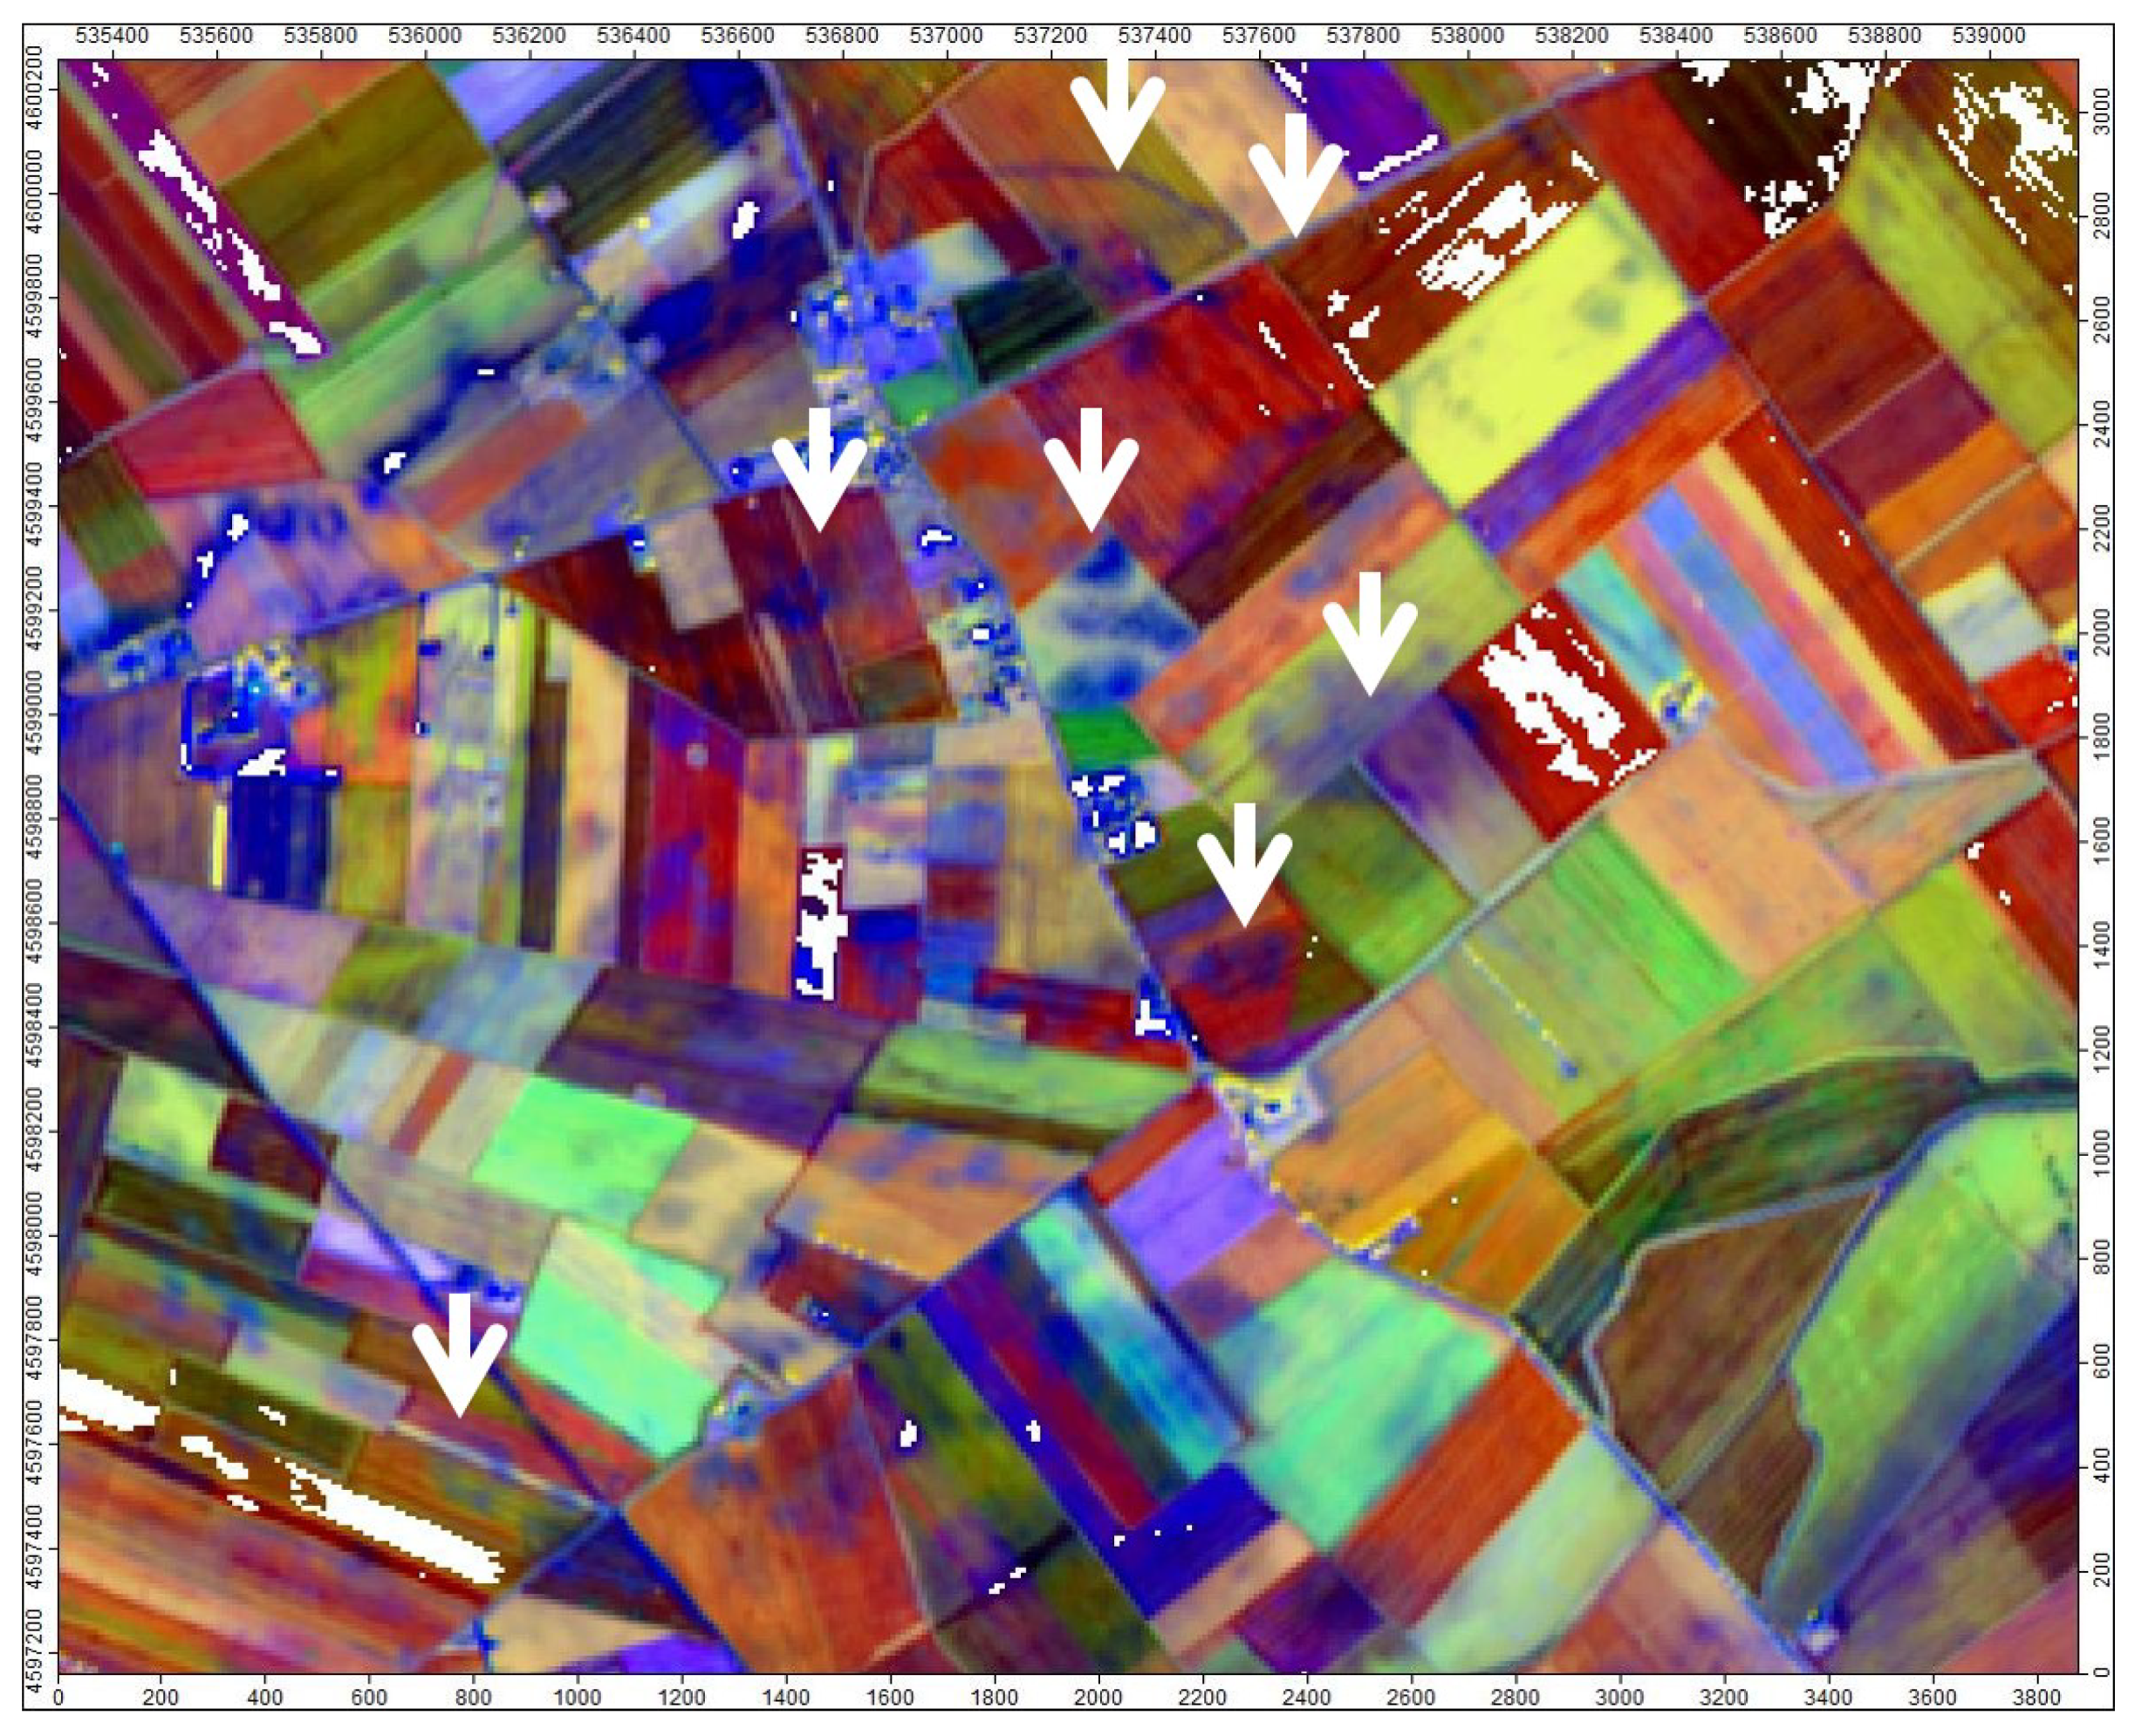
3.2. Foggia
4. Conclusions
Author Contributions
Funding
Acknowledgments
Conflicts of Interest
References
- Beck, A.R. Archaeological site detection: The importance of contrast. In Proceedings of the 2007 Annual Conference of the Remote Sensing and Photogrammetry Society, Newcastle Upon Tyne, UK, 11–14 September 2007; The Remote Sensing and Photogrammetry Society, Ed.; Curran Associates Inc.: New York, NY, USA, 2008; pp. 307–312. [Google Scholar]
- Lasaponara, R.; Masini, N. Detection of archaeological crop marks by using satellite QuickBird. J. Archaeol. Sci. 2007, 34, 214–221. [Google Scholar] [CrossRef]
- Ulisse, F. La tutela del bene culturale in Europa tra legislazione e strumenti operative. In Strumenti per L’Archeologia Preventiva. Esperienze, Normative, Tecnologie; D’Andrea, A., Guermandi, M.P., Eds.; Archaeolingua: Budapest, Hungary, 2008; pp. 107–116. [Google Scholar]
- Di Maio, G.; Santangelo, N.; Santo, A. Inquadramento geologico e dati preliminari sui riempimenti. In Risultati Delle Ricerche Alla Grotta del Pino (Sassano, Salerno): 1997–1998; Pellegrini, E., Ed.; Bullettino di Paletnologia Italiana: Roma, Italy, 2001; pp. 134–143. [Google Scholar]
- D’Agostino, B. Storia del Vallo di Diano, I. L’età Antica; Laveglia Editore: Salerno, Italy, 1981. [Google Scholar]
- Fiore, I.; Nomi, F.; Truffi, M. I resti faunistici dell’abitato appenninico del Cornaleto (Sant’Arsenio, SA). In 50 Riunione Scientifica dell’Istituto Italiano di Preistoria e Protostoria del cibo (Roma, Ottobre 2015); Istituto Italiano di Preistoria e Protostoria: Roma, Italy, 2017; pp. 1–11. [Google Scholar]
- Guidi, A.; Nomi, F. Centri d’altura della media età del bronzo nel Vallo di Diano e nelle aree limitrofe. Nuove evidenze dal progetto V.A.L.L.O. In Centri Fortificati Indigeni Della Calabria Dalla Protostoria All’età Ellenistica (Napoli, Gennaio 2014); Cicala, L., Pecciarelli, M., Eds.; Naus: Napoli, Italy, 2017; p. 479. [Google Scholar]
- Balio Modesti, G. Il periodo arcaico. In Storia del Vallo di Diano. I. L’età Antica; D’Agostino, B., Ed.; Laveglia Editore: Salerno, Italy, 1981; pp. 85–122. [Google Scholar]
- Greco, E. Magna Grecia (Guida Archeologica Laterza); Laterza: Roma/Bari, Italy, 2008. [Google Scholar]
- Sestieri, C. Appunti su una classe di vasi italici. Archeol. Class. 1951, 3, 129–137. [Google Scholar]
- Gilberti, L. Il Comune di Sant’Arsenio. Contributo Alla Storia Municape Dell’Italia Meridionale; Tip. Degli Artigianelli: Napoli, Italy, 1923. [Google Scholar]
- Pica, L. La Nuova Chiesa in Sant’Arsenio e la Valle del Tanagro (Salerno); Cantelmi: Salerno, Italy, 1971. [Google Scholar]
- Ebner, P. Chiesa, Baroni e Popolo nel Cilento. Voll. 2; Edizioni di Storia e Letteratura: Roma, Italy, 1982; pp. 570–579. [Google Scholar]
- Marazzi, F.; Raimondo, C. Monasteri Italogreci (Secoli VII–XI), Una Lettura Archeologica, Atti del Convegno Internazionale Svoltosi a Squillace (CZ), Italy, 23–24 March 2018; Volturnia Edizioni: Cerro al Volturno, Italy, 2018. [Google Scholar]
- Ambrogi, M. Sant’Arsenio tra Medioevo ed età Moderna. Storia, Arte e Caratteri Urbani di un Antico Casale Dello Stato di Diano; Lapelosa Printing: Sala Consilina, Italy, 2006; pp. 35–48. [Google Scholar]
- Visentin, B., II. Monastero di Sant’Arsenio e la presenza cavense nel Vallo di Diano (Secc. XI–XV). In Proceedings of the Atti del Convegno La Badia di Cava e il Vallo di Diano-Sant’Arsenio (SA), Sant’Arsenio, Italy, 20 Novembre 2010; Visentin, B., Ed.; Edizioni Laveglia-Carlone: Salerno, Italy, 2012; pp. 83–99. [Google Scholar]
- Vitolo, G. Dalla pieve rurale alla chiesa ricettizia. Istituzioni ecclesiastiche e vita religosa dall’alto Medioevo al Cinquecento pre-tridentino. In Storia del Vallo di Diano, II; Cilento, N., Ed.; Laveglia: Salerno, Italy, 1982; p. 146. [Google Scholar]
- Agapiou, A.; Lysandrou, V.; Lasaponara, R.; Masini, N. Study of the Variations of Archaeological Marks at Neolithic Site of Lucera, Italy Using High-Resolution Multispectral Datasets. Remote Sens. 2016, 8, 723. [Google Scholar] [CrossRef]
- Ciminale, M.; Gallo, D.; Lasaponara, R.; Masini, N. A Multiscale approach for reconstructing archaeological landscapes: Applicationsin northern Apulia (Italy). Archaeol. Prospect. 2009, 16, 143–153. [Google Scholar] [CrossRef]
- Gallo, D.; Ciminale, M.; Becker, H.; Masini, N. Remote sensing techniques for reconstructing a vast Neolithic settlement in Southern Italy. J. Archaeol. Sci 2009, 36, 43–50. [Google Scholar] [CrossRef]
- Brandford, J.S.P. Buried Landscapes in sourthern Italy. Antiquity 1949, 90, 58–72. [Google Scholar] [CrossRef]
- Genchi, F.; Muntoni, I.M.; Scopece, N. Indagini archeologiche nel villaggio neolitico di Masseria Pantano (Foggia). Primi risultati. In Proceedings of the Atti del XXXII Convegno Nazionale Sulla Preistoria- Protostoria-Storia Della Daunia, San Severo, Italy, 12–13 Novembre 2011; Gravina, A., Ed.; Archeoclub d’Italia: San Severo, Italy, 2012; pp. 3–14. [Google Scholar]
- Gravina, A. Atti del XXXVIII Convegno Nazionale Sulla Preistoria-Protostoria-Storia della Daunia. San Severo 18–19 Novembre 2017; Archeoclub d’Italia: San Severo, Italy, 2018. [Google Scholar]
- Guaitoli, M. Lo Sguardo di Icaro: Le Collezioni dell’Aerofototeca Nazionale per la Conoscenza del Territorio; Campisano Editore: Roma, Italy, 2003. [Google Scholar]
- Colucci, A. Arpi: La Città Perduta; Bastogi Editrice Italiana: Foggia, Italy, 2009. [Google Scholar]
- Pietropaolo, L. Sformate Immagini di Bronzo. Il Carrello di Lucera tra VIII e VII Secolo a.C. (Catalogo Della Mostra, Lucera 2002); C. Grenzi, Impr.: Foggia, Italy, 2002. [Google Scholar]
- Monaco, M. SLucera Nella Storia e Nell’Arte; Regione Puglia: Foggia, Italy, 2009. [Google Scholar]
- Otranto, G. Bizantini, Longobardi e Arabi in Puglia Nell’Altomedioevo, Atti del XX Congresso Internazionale di Studio Sull’Alto Medioevo. Savelletri di Fasano (BR), 3–6 Novembre 2001; CISAM: Spoleto, Italy, 2012. [Google Scholar]
- Martin, J.M. Foggia nel Medioevo; Congedo Editore: Galatina, Italy, 1998. [Google Scholar]
- Martin, J.M. I castelli federiciani nelle città del Mezzogiorno d’Italia. In Castelli e fortezze Nelle Città Italiane e Nei Centri Minori Italiani (Secoli XIII–XV); Panero, F., Pinto, G., Eds.; CISIMI: Cherasco, Italy, 2009; pp. 251–269. [Google Scholar]
- Agapiou, A.; Alexakis, D.; Sarris, A.; Hdjimitsis, D.G. Evaluating the Potentials of Sentinel-2 for Archaeological Perspective. Remote Sens. 2014, 6, 2176–2194. [Google Scholar] [CrossRef]
- Agapiou, A.; Lysandrou, V.; Hadjimitsis, D.G. Optical Remote Sensing Potentials for Looting Detection. Geosciences 2017, 7, 98. [Google Scholar] [CrossRef]
- Bini, M.; Isola, I.; Zanchetta, G.; Ribolini, A.; Ciampalini, A.; Baneschi, I.; Mele, D.; D’Agata, A.L. Identification of Leveled Archeological Mounds (Höyük) in the Alluvial Plain of the Ceyhan River (Southern Turkey) by Satellite Remote-Sensing Analyses. Remote Sens. 2018, 10, 241. [Google Scholar] [CrossRef]
- Tapete, D.; Cigna, F. Appraisal of Opportunities and Perspectives for the Systematic Condition Assessment of Heritage Sites with Copernicus Sentinel-2 High-Resolution Multispectral Imagery. Remote Sens. 2018, 10, 561. [Google Scholar] [CrossRef]
- Zanni, S.; Rosa, A.D. Remote Sensing Analyses on Sentinel-2 Images: Looking for Roman Roads in Srem Region (Serbia). Geosciences 2019, 9, 25. [Google Scholar] [CrossRef]
- Casana, J. Satellite Imagery-Based Analysis of Archaeological Looting in Syria. East. Archaeol. 2015, 78, 142. [Google Scholar] [CrossRef]
- Lasaponara, R.; Leucci, G.; Masini, N.; Persico, R. Investigating archaeological looting using satellite images and GEORADAR: The experience in Lambayeque in North Peru. J. Archaeol. Sci. 2014, 42, 216–230. [Google Scholar] [CrossRef]
- Contreras, A.D.; Brodie, N. The utility of publicly-aviable satellite imagery for investigating looting of archaeological sites in Jordan. J. Field Archaeol. 2010, 35, 101–114. [Google Scholar] [CrossRef]
- Masini, N.; Lasaponara, R. Sensing the past from space: Approaches to site detection. In Sensing the Past. From Artifact to Historical Site; Masini, N., Soldovieri, F., Eds.; Springer International: Cham, Switzerland, 2017; pp. 23–60. [Google Scholar]
- Park, H.; Choi, J.; Park, N.; Choi, S. Sharpening the VNIR and SWIR bands of Sentinel-2A imagery through modified selected and synthesized band schemes. Remote Sens. 2017, 9, 80. [Google Scholar] [CrossRef]
- Zheng, H.; Du, P.; Chen, J.; Xia, J.; Li, E.; Xu, Z.; Li, X.; Yokoya, N. Performance Evaluation of Downscaling Sentinel-2 Imagery for Land Use and Land Cover Classification by Spectral-Spatial Features. Remote Sens. 2017, 9, 1274. [Google Scholar] [CrossRef]
- Roy, D.; Li, J.; Zhang, H.; Yan, L. Best pratices for the reprojection and resampling of Sentinel-2 Multi Spectral Instrument Level 1C data. Remote Sens. Lett. 2016, 7, 1023–1032. [Google Scholar] [CrossRef]
- Lasaponara, R.; Masini, N. Image Enhancement, Feature Extraction and Geospatial Analysis Perspective. In Satellite Remote Sensing: A New Tool for Achaeology, Remote Sensing and Digital Image Processing 16; Lasaponara, R., Masini, N., Eds.; Springer International: Cham, Switzerland, 2012; pp. 17–65. [Google Scholar]
- De Guio, A. Cropping for a better future: Vegetation Indices in Archaeology. In Detecting and Understanding Historic Landscapes; Chavarria Arnau, A., Reynolds, A., Eds.; SAP Società Archeologica s.r.l.: Mantova, Italy, 2015; pp. 23–60. [Google Scholar]
- Rayne, L.; Bradbury, J.; Mattingly, D.; Philip, G.; Bewley, R.; Wilson, A. From Above and on the Ground: Geospatial Methods for Recording Endangered Archaeology in the Middle East and North Africa. Geosciences 2017, 7, 100. [Google Scholar] [CrossRef]
- White, D.C.; Williams, M.; Barr, S.L. Detecting sub-surface soil disturbance using hyperspectral first derivative band rations of associated vegetation stress. Int. Arch. Photogramm. Remote Sens. Spat. Inf. Sci. 2008, 37, 243–248. [Google Scholar]
- Kelong, T.; Yuqing, W.; Lin, Y.; Riping, Z.; Wei, C.; Yaobao, M. A new archaeological remote sensing technology. Proc. Int. Arch. Photogramm. Remote Sens. Spat. Inf. Sci. 2008, 37, 221–224. [Google Scholar]
- Agapiou, A.; Hadjimitsis, D.G.; Themistocleous, K.; Papadavid, G. Detection of Archaeological Crop Marks in Cyprus Using Vegation Indices from Landsat TM/ETM plus Satellite Images and Field Spectroscopy Measurements. In Proceedings of the SPIE-The International Society for Optical Engineering, Toulouse, France, 25 October 2010; Volume 7831. [Google Scholar]
- Chuvieco, E.; Martin, M.P.; Palacios, A. Assessment of different spectral indices in the red-near-infrared spectral domain for burned land discrimination. Int. J. Remote Sens. 2010, 23, 5103–5110. [Google Scholar] [CrossRef]
- Tucker, C.J. Red and photographic infrared linear combinations for monitoring vegetation. Remote Sens. Environ. 1979, 8, 127–150. [Google Scholar] [CrossRef]
- Huete, A.R.; Liu, H.Q.; Batchily, K.; van Leeuwen, W. A comparison of vegetation indices over a global set of TM images for EOS-MODIS. Remote Sens. Environ. 1997, 59, 440–451. [Google Scholar] [CrossRef]
- Gitelson, A.A.; Merzlyak, M.N. Remote Sensing of Chlorophyll Concentration in Higher Plant Leaves. Adv. Space Res. 1997, 59, 440–451. [Google Scholar] [CrossRef]
- Rouse, J.W.; Haas, R.H.; Schell, J.A.; Deering, D.W.; Harlan, J.C. Monitoring the Vernal Advancements and Retrogradation (Greenwave Effect) of Nature Vegetation; NASA: Washington, DC, USA, 1974.
- Calleja, J.F.; Pagés, O.R.; Diaz-Alvarez, N.; Peòn, J.; Gutiérrez, N.; Martìn-Hernàndez, E.; Relea, C.A.; Melendi, D.R.; Alvarez, P.F. Detection of buried archaeological remains with the combined use of satellite multispectral data and UAV data. Int. J. Appl. Earth Obs. Geoinf. 2018, 73, 555–573. [Google Scholar] [CrossRef]
- Cerra, D.; Agapiou, A.; Cavalli, R.M.; Sarris, A. An Objective Assessment of Hyperspectral Indicators for the Detection of Buried Archaeological Relics. Remote Sens. 2018, 10, 500. [Google Scholar] [CrossRef]
- Huete, A. Overview of the Radiometric and Biophysical Performance of the MODIS Vegetation Indices. Remote Sens. Environ. 2002, 83, 195–213. [Google Scholar] [CrossRef]
- Bennett, R.; Welham, K.; Hill, R.A.; Ford, A. The application of vegetation indices for the prospection of archaeological features in grass dominated environments. Archaeol. Prosp. 2012, 19, 209–218. [Google Scholar] [CrossRef]
- Moriarty, C.; Cowley, D.C.; Wade, T.; Nichol, C.J. Deploying multispectral remote sensing for multi-temporal analysis of archaeological crop stress at Ravenshall, Fife, Scotland. Archaeol. Prosp. 2019, 26, 33–46. [Google Scholar] [CrossRef]
- Agapiou, A.; Hadjimitsis, D.G.; Sarris, A.; Georgopoulos, A.; Alexakis, D.D. Optimum temporal and spectral window for monitoring crop marks over archaeological remains in the Mediterranean region. J. Archaeol. Sci. 2013, 40, 1479–1492. [Google Scholar] [CrossRef]
- Kaimaris, D.; Patias, P.; Tsakiri, M. Best period for high spatial resolution satellite images for the detection of marks of buried structures. Egypt. J. Remote Sens. Space Sci. 2012, 15, 9–18. [Google Scholar] [CrossRef]
- Kalayci, T.; Lasaponara, R.; Wainwright, J.; Masini, N. Multispectral Contrast of Archaeological Features: A Quantitative Evaluation. Remote Sens. 2019, 11, 913. [Google Scholar] [CrossRef]
- Masini, N.; Marzo, C.; Manzari, P.; Belmonte, A.; Sabia, C.; Lasaponara, R. On the characterization of temporal and spatial patterns of archaeological crop-marks. J. Cult. Herit. 2018, 32, 124–132. [Google Scholar] [CrossRef]
- Evans, D.; Traviglia, A. Uncovering Angkor: Integrated Remote Sensing Applications in the Archaeology of Early Cambodia. In Satellite Remote Sensing: A New Tool for Achaeology, Remote Sensing and Digital Image Processing 16; Lasaponara, R., Masini, N., Eds.; Springer International: Cham, Switzerland, 2012; pp. 197–230. [Google Scholar]
- Estornell, J.; Martì-Gavilà, J.M.; Sebastià, T.; Mengual, J. Principal component analysis applied to remote sensing. MSEL 2013, 6, 83–89. [Google Scholar] [CrossRef]
- Lillesand, T.M.; Kiefer, R.W.; Chipman, J.W. Remote Sensing and Image Interpretation; Wiley: New York, NY, USA, 2004. [Google Scholar]
- Lou, L.; Wang, X.; Guo, H.; Lasaponara, R.; Shi, P.; Bachagha, N.; Li, L.; Yao, Y.; Masini, N.; Chen, F.; et al. Google Earth as a Powerful Tool for Archaeological and Cultural Heritage Applications: A Review. Remote Sens. 2018, 10, 1558. [Google Scholar]
- Sabia, C.; Masini, N.; Lasaponara, R. On the visibility of crop marks through seasons preliminary results from multi-date Google Earth pictures and ground truth. In Earth Observation: A Window on the Past, Proceedings of the 4th EARSeL Workshop on Remote Sensing for Cultural Heritage, Matera, Italy, 6–7 June 2013; Lasaponara, R., Masini, N., Biscione, M., Hernandez, M., Eds.; EARSel: Hannover, Germany, 2013. [Google Scholar]
- Lesiv, M.; See, L.; Laso-Bayas, J.; Sturn, T.; Schepaschenko, D.; Karner, M.; Moorthy, I.; McCallum, I.; Fritz, S. A global snapshot of the spatial and temporal distribution of very high resolution satellite imagery in Google Earth and Bing Maps as of 11th of January, 2017. Pangea 2018, 10, 1594. [Google Scholar]
- Nex, F.; Redmondino, F. UAV for 3D mapping applications: A review. Appl. Geomat. 2014, 6, 1–15. [Google Scholar] [CrossRef]
- Chianramdo, F.; Lingua, A.; Rianudo, F.; Spano, A. Archaeological site monitoring: UAV photogrammetry can be an answer. In International Archives of the Photogrammetry, Remote Sensing and Spatial Information Sciences; Shortis, M., Mills, J., Eds.; ISPRS: Melbourne, Australia, 2012; Volume XXXIXB5, pp. 583–588. [Google Scholar]
- Redmondino, F.; El-Hakim, S. Image-based 3D modelling: A review. Photogramm. Rec. 2006, 21, 269–291. [Google Scholar] [CrossRef]


| Bands | Central Wavelength (nm) | Spatial Resolution |
|---|---|---|
| Band 1—Coastal aerosol | 0.443 | 60 m |
| Band 2—Blue | 0.490 | 10 m |
| Band 3—Green | 0.560 | 10 m |
| Band 4—Red | 0.665 | 10 m |
| Band 5—Vegetation Red Edge | 0.705 | 20 m |
| Band 6—Vegetation Red Edge | 0.740 | 20 m |
| Band 7—Vegetation Red Edge | 0.783 | 20 m |
| Band 8—NIR | 0.842 | 10 m |
| Band 8A—Vegetation Red Edge | 0.865 | 20 m |
| Band 9—Water vapour | 0.945 | 60 m |
| Band 10—SWIR (Cirrus) | 1.375 | 60 m |
| Band 11—SWIR | 1.610 | 20 m |
| Band 12—SWIR | 2.190 | 20 m |
| Index | Equation | Reference |
|---|---|---|
| Burned Area | ||
| Index (BAI) | [49] | |
| Difference Vegetation | ||
| Index (DVI) | [50] | |
| Enhanced Vegetation | ||
| Index (EVI) | [51] | |
| Green Difference | ||
| Vegetation Index (GDVI) | [52] | |
| Green Normalised | ||
| Difference Vegetation Index (GNDVI) | [52] | |
| Green Ratio | ||
| Vegetation Index (GRVI) | [52] | |
| Normalised Difference | ||
| VegetationIndex (NDVI) | [53] | |
| Normalised Archaeological | ||
| Index (NAI) | [31] | |
| Modified Chlorophyll | ||
| Absorption in Reflectance Index | [54] | |
| Soil band | [54] | |
| Crop band | [54] | |
| Normalised Difference | ||
| Moisture Index (NDMI) | [55] | |
| Soil Adjusted | ||
| Vegetation Index (SAVI) | [56] | |
| Simple Ratio Nir/Red | [57] |
© 2019 by the authors. Licensee MDPI, Basel, Switzerland. This article is an open access article distributed under the terms and conditions of the Creative Commons Attribution (CC BY) license (http://creativecommons.org/licenses/by/4.0/).
Share and Cite
Abate, N.; Lasaponara, R. Preventive Archaeology Based on Open Remote Sensing Data and Tools: The Cases of Sant’Arsenio (SA) and Foggia (FG), Italy. Sustainability 2019, 11, 4145. https://doi.org/10.3390/su11154145
Abate N, Lasaponara R. Preventive Archaeology Based on Open Remote Sensing Data and Tools: The Cases of Sant’Arsenio (SA) and Foggia (FG), Italy. Sustainability. 2019; 11(15):4145. https://doi.org/10.3390/su11154145
Chicago/Turabian StyleAbate, Nicodemo, and Rosa Lasaponara. 2019. "Preventive Archaeology Based on Open Remote Sensing Data and Tools: The Cases of Sant’Arsenio (SA) and Foggia (FG), Italy" Sustainability 11, no. 15: 4145. https://doi.org/10.3390/su11154145
APA StyleAbate, N., & Lasaponara, R. (2019). Preventive Archaeology Based on Open Remote Sensing Data and Tools: The Cases of Sant’Arsenio (SA) and Foggia (FG), Italy. Sustainability, 11(15), 4145. https://doi.org/10.3390/su11154145