Article

Water Degradation by China’s Fossil Fuels Production: A Life Cycle Assessment Based on an Input–Output Model

1
College of Economics and Management, China Agricultural University, Beijing 100083, China
2
College of Science, China Agricultural University, Beijing 100083, China
3
International College Beijing, China Agricultural University, Beijing 100083, China
4
Chinese-Israeli International Center for Research and Training in Agriculture, China Agricultural University, Beijing 100083, China
*
Author to whom correspondence should be addressed.
Sustainability 2019, 11(15), 4130; https://doi.org/10.3390/su11154130
Submission received: 20 June 2019 / Revised: 17 July 2019 / Accepted: 22 July 2019 / Published: 31 July 2019
(This article belongs to the Section Energy Sustainability)

Abstract

:
Fossil energy production not only aggravates water depletion but also severely contaminates water resources. This study employed a mixed-unit input–output model to give a life cycle assessment of national average water degradation in production of common types of fossil fuels in China. The results show that the amount of grey water generated is much more than that of consumptive and withdrawn water in all cases. Although there is a high discharge amount of chemical oxygen demand (COD) in fossil fuel production, the pollutants of petroleum (PE) and volatile phenols (VP) require more dilution water than COD. PE is the greatest contributor to water degradation caused by primary fossil fuels, while VP pollution is prominent in production of upgraded fossil fuels. Basically, the main causes of water degradation, PE and VP discharge, occurs at coal mines, oil fields, refinery plants, and coking factories, rather than in the upstream sectors. A scenario analysis showed that water pollution can be significantly reduced if VP discharge in the coking process is controlled to be at the standard concentration. PE requires a standard withalower discharge concentration in order to further mitigate water pollution in production of fossil fuels. The coal production industry has a much lower pollutant removal rate but spends more on wastewater treatment, up to 12% of its profit. The other fossil fuel industries have high removal rates of PE and VP (97%–99%) and thus demand technological renovation to further remove those pollutants at a low concentration.

1. Introduction

Global energy demand is expected to increase by 48% from 579 billion GJ in 2012 to 860 billion GJ in 2040, posing a severe challenge to limited natural resources such as freshwater for energy production [1]. Besides emissions of air pollutants and greenhouse gases from the energy sector, the risk of water shortage and water quality degradation associated with energy production should be considered and evaluated by policy makers [2]. A sustainable and environmentally friendly society requires the integration of water resource management and energy system planning [3].
Most of the regions that possess plentiful fossil fuel reserves are facing an increasingly serious water crisis. Around 70% of coal mines and 75% of coal-fired power plants are sitedin water deficient regions in China [4,5,6]. Water resources are severely depleted and polluted in the life cycle processes of fossil energy production, e.g., oil and gas extraction, coal mining and washing, coking, and crude oil refining. Freshwater is used in tunnel wash, dust removal, mining and drilling equipment, refining and coking reactors, and fracture of rocks. Water table lowering due to geological structure damage in areas around mines decreases regional water availability. Simultaneously, water pollutants discharged into the environment from energy industries greatly threaten the regional water security [7,8]. There exists a high intensity of water pollution discharge (e.g., chemical oxygen demand, ammonia nitrogen, petroleum, and volatile phenols) in the fossil energy production [9,10].
Previous research has been conducted to assess the water use of energy production from various sources, such as coal, petroleum, thermoelectricity, hydropower, and bioenergy [5,11,12,13,14]. Water-use intensities at energy production sites are largely contingent on the technologies selected by producers [10,15,16]. Many studies claimed that water-use efficiency of energy can be improved significantly if water-saving technology is encouraged and upgraded [4,17,18]. In addition, water is also used by the energy sector indirectly as virtual water embodied in the upstream supply chain sectors. The bottom up approach based on a supply chain analysis was commonly used to assess the life cycle water use of energy in previous studies [19,20,21,22]. This approach aggregates the direct water use in each process and therefore is more suitable to study a customized or specific production process. Input–output analysis as a top-down approach has also been widely used to investigate the resource occupation in a product. Hawkins et al. (2017) introduced a mixed-unit input–output (MUIO) model to estimate the life cycle of material consumption [23]. Zhang et al. expanded this model to a multiregional MUIO model and assessed the national average water use and wastewater discharge of different energy carries in China [24].
However, from wastewater discharge it is hard to indicate the water pollution level if pollutant concentration is not also provided. Furthermore, it is unfair to compare the discharge amounts of different water pollutants, because the impact on water quality varies greatly for different water pollutants (e.g., a petroleum pollutant is much more hazardous than chemical oxygen demand in the same concentration) [25]. Thus, an indicator of grey water was proposed to quantify water pollution using a freshwater volume metric [26]. The pollutant that is more toxic or hazardous has the lower permissible concentration and therefore more dilution of water is required. The comparison of grey water (also being denoted as dilution water) allows the water pollutant that has the greatest contribution to water degradation to be identified [27,28]. Many studies have been conducted to assess and analyze the grey water footprint at a regional or global level [29,30,31,32,33,34,35].
Although a few studies have focused on the grey water in fossil energy production [7,14], only chemical oxygen demand was included to assess dilution water and this may result in an underestimation of water pollution. Other common pollutants with high toxicity in the energy sector, such as petroleum, should also be incorporated. Furthermore, an input–output analysis should be conducted to understand the contribution of the whole society to the life cycle of grey water generated from fossil energy production.
In order to understand the impact of fossil fuel production on water quantity and quality, we assessed and analyzed the life cycle of water consumption, water withdrawal, wastewater discharge, water pollutant discharge and grey water in production of fossil fuels in China. Dilution water for pollutants was compared to identify the major contributor to water degradation for each fossil fuel. Estimations such as expense of wastewater treatment and removal rate of water pollutants were also performed to understand the efforts of mitigating water pollution made by fossil energy industries. A scenario analysis was conducted to examine the effects of the standard-reaching rate of pollutant discharge on water pollution in production of fossil fuels. The findings in this study are of great significance as they provide a comprehensive view of fossil energy products’ impacts on water resources, especially on water quality.

2. Materials and Methods

2.1. Defining Indicators of Water Degradation Intensities

Water withdrawal is defined as freshwater use and indicates the aggravation of water supply stress due to energy production. Water consumption (also denoted as blue water footprint) refers to the water lost by evaporation or transferring into the product, and therefore shows the potential impact on water resources quantity. Wastewater discharge indicates the load of polluted water in the environment, but it provides insufficient information because of a lack of water pollutant concentration. Thus, dilution water, a concept used to quantify water pollution by a volumetric metric, is used in this study to reveal the impact on water resources quality. Dilution water for a pollutant is defined as the freshwater needed to dilute this pollutant to a safe concentration. Grey water footprint, which is the maximum dilution water among the studied pollutants, is employed in this study to identify the crucial water pollutant [26].

2.2. Life Cycle Assessment via a Mixed-Unit Input–Output (MUIO) Model

The input–output (IO) model has been widely used to assess the natural resources occupied by a product in its life cycle production process [23,24,36,37,38,39]. This study assessed the life cycle water withdrawal, water consumption, wastewater discharge, and dilution water for each pollutant by employing the IO model as follows:
LCW = DW I A 1 ,
where, LCW is a life cycle water depletion or pollution intensity vector; DW is a direct water depletion or pollution intensity vector; I is an identity matrix; and A is a technical coefficient matrix that is comprised of intermediate inputs.
When adding up the total life cycle virtual water use for all fossil fuel sectors, we need to deduct the virtual water flows among fossil fuel sectors from the total to avoid double counting as shown in the following equation:
LCW total = i = 1 5 ( LCW i j = 1 5 W i , j ) ,
where LCWtotal indicates the total life cycle virtual water of fossil fuel sectors; LCWi is the life cycle virtual water of ith fossil fuel sector; and Wi,j is the virtual water of fossil fuel sector i contributed by fossil fuel sector j.
The national IO table of China in 2012, the latest one, was employed in this study to obtain direct requirement coefficients. Five fossil energy sectors including coal, crude oil, natural gas, coke, and petroleum products were transformed into physical-unit sectors according to the sector-wise energy consumption data from China’s energy statistical yearbook. In the original IO table, two energy sectors (the extracting crude oil and natural gas sector, and refining of petroleum products and coking sector) are needed to be rearranged into four sectors (crude oil, natural gas, coke and petroleum products). The national IO table in 1997 reported those four sectors separately and therefore it was employed in this study for the sector rearrangement. The sectors were disaggregated according to the following equation set:
a m P m + a n P n = a m & n ( P m + P n ) a m / a n = a m / a n ,
where am(n) denotes the direct requirement coefficient of each sector by sector m or n in the studied year; a’ denotes the direct requirement coefficient in the reference year; m&n refers to the merged sector of m and n in the original IO table; and Pm(n) denotes the total production amount of sector m or n, and it has a physical rather than monetary unit so that the inflation effect is avoided.

2.3. Assessing the Dilution Water and Grey Water Footprint

Four water pollutants, including chemical oxygen demand (COD), ammonia nitrogen (AN), petroleum (PE), and volatile phenols (VP), were selected to be studied because of their significant discharge levels and heavy pollution load of water resources in China’s fossil energy sector [9]. Dilution water for each pollutant was estimated as follows:
DW dilution = L / C max C nat ,
where DWdilution is the direct dilution water (m3); L is the discharge amount of the studied water pollutant (g); Cmax is the maximum allowable concentration of the studied water pollutant set by regulation (g/m3); and Cnat is the concentration of the studied water pollutant in the natural water body (g/m3). Although the natural water is not pure and the concentrations of some chemicals would not be zero, Cnat in this study is assumed to be zero in that (1) data is deficient and (2) Cnat of the water pollutant is extremely small and not significant when compared with Cmax.
The maximum permissible concentration (Cmax) for each water pollutant in this study was obtained from China’s environmental quality standards for surface water [25]. According to this standard, the pollutants of COD, AN, PE, and VP are allowed to have the maximum concentrations of 20, 1, 0.05, and 0.005 mg/L, respectively. Waters with higher pollutant concentrations than these are considered by the Chinese government as an unsafe water body, unsuitable for human beings and fishes. The dilution water for pollutants allows us to compare the impacts of water pollutants on water quality.
Based on the life cycle of dilution water for each pollutant that is estimated by the IO model, the grey water footprint can be determined by the maximum dilution water according to Equation (5):
LCW grey = max   LCW dilution , 1 , LCW dilution , 2 , LCW dilution , 3 , LCW dilution , 4 ,
where LCWgrey is the life cycle grey water footprint; LCWdilution is the life cycle dilution water for each pollutant.

2.4. Data Sources

China’s environmental statistics annual report provided the sector-wise data of water withdrawal, water consumption, wastewater discharge, and water pollutant discharge. However, the sectors of natural gas and crude oil, as well as the sectors of petroleum products and coke, were reported together in this database due to the similarity of these industries. We disaggregated them proportionally according to the pollution discharge coefficients from China’s first pollution source census and the water-use coefficients from China’s clean production standards. The expense of wastewater treatment and the profit of each fossil energy industry were calculated based on the data obtained from China’s industrial statistics yearbook and China’s environmental statistics annual report. The sector-wise energy consumption for each fossil fuel, which was required when compiling MUIO tables, was obtained from China’s energy statistical yearbook. This yearbook also provided the national production amount of each energy product with both mass and energy unit, and this was used to estimate the national average heating value for each fossil fuel. Those heating values which are shown in Table 1 were employed to transform a mass unit into an energy unit in this study, so that we can compare the life cycle water use or pollution of different energy products on the same basis.

3. Results and Discussion

3.1. Water Depletion and Pollution in the Life Cycle of Fossil Fuel Production

In order to understand the comprehensive impacts of fossil energy production on water resources, we assessed the life cycle water use and pollution per unit of energy for five common types of fossil fuels in China, including coal, crude oil, natural gas, coke, and petroleum products. Water consumption and withdrawal as two indicators of water-use intensity were able to reveal the impacts on water resources quantity. As shown in Figure 1, coal consumes and withdraws the lowest amount of water which are 39 and 142 m3 per TJ, and thus burning coal by end users is superior to other fuels in terms of water saving. Crude oil and natural gas use larger water amounts than coal, because extracting oil and gas has a higher water-use intensity and consumes more industrial supplies than coal mining. The upgraded fuels, including coke and petroleum products, require more water than coal and oil because of energy loss during the upgrading process.
The grey water footprint is an indicator that reflects the water pollutant loaded into the environment using a water quantity unit. As shown in Figure 1, grey water is more than blue water by at least one order of magnitude and this demonstrates that water pollution by fossil fuels is more serious than water depletion. Many previous studies pointed out that energy production is seriously threatening China’s water security [5,40]. However, most of those studies only focus on the water depletion problem, i.e., blue water consumption. The results of our study indicate that the water pollution problem, i.e., grey water consumed by energy production, is a matter of greater concern when compared with the water depletion problem. Zhang et al. pointed out that those provinces of China with rich energy sources bears a large amount of energy-related wastewater discharge [24]. Our study shows that the water pollution problem caused by energy production could be severer than expected, as the grey water consumption is more than the wastewater discharge by at least one order of magnitude, as shown in Figure 1.
Both coal and natural gas production load less water pollutantsinto environment than crude oil extraction. Therefore, when petroleum products, such as diesel, are replaced by coal or natural gas as the fuel supply at power plants to produce electricity, the environment would receive benefits in terms of water pollution mitigation. Coke has the highest grey water footprint due to a large amount of water pollutant discharged from the coke oven. This implies that the coke production sector in China needs to upgrade its wastewater technology to remove more water pollutants at the end of the coking process.

3.2. Water Pollutants in the Life Cycle of Fossil Fuel Production

Dilution water for the pollutants of chemical oxygen demand (COD), ammonia nitrogen (AN), petroleum (PE), and volatile phenols (VP) is studied in order to identify the pollutant with the greatest impact on water resources quality. As shown in Figure 2a, coke and petroleum products, which are upgraded from coal and crude oil, always have heavier water pollution than raw fuels. PE has large dilution water (1018 to 6125 L/TJ) for all fossil fuels and determines the grey water footprint of coal, crude oil, natural gas, and petroleum products. The discharge of PE from the fossil energy production sector has a great impact on water resources quality, and therefore it needs strict monitoring and effective control policies. A significant amount of dilution water for VP exists when producing coke and petroleum products. VP is highly toxic to human health and its permissible concentration is as low as 0.005mg/L. This implies that the VP pollution level should be tightly inspected in the habitations nearby coking or oil refining industries. Although COD has the highest discharge amount in the fossil energy sector (5 to 16 kg/TJ), as shown in Figure 2b, it is not the determining pollutant of the grey water footprint, which has the most dilution water because of its relatively high permissible concentration (20 mg/L).

3.3. Sectoral Shares of Life Cycle Water Depletion and Pollution from Fossil Fuel Production

Water is used and polluted in the life cycle fossil fuel production both directly at production sites and indirectly as virtual water embodied in the upstream supplies or services. Figure 3 shows the shares of life cycle water depletion and pollution occupied by different sectors.
For coal and crude oil, PE pollutant contributes the most to water degradation as shown in Figure 2, and over 80% of its discharge is directly from coal mining and oil extracting as shown in Figure 3. This illustrates that PE pollutants need to be further effectively removed at coal mines and oil fields, and a strict regulation of PE discharge for coal and crude oil production is necessary to be implemented by the government. The previous study shows that PE is a key pollution in the life cycle process of China’s thermoelectric power generation [10]. Coal is the main energy source of China’s thermoelectric power sector, so PE-removing equipment is especially needed and upgraded in coal mines. Water is mostly consumed and withdrawn by the industry sector, e.g., power generation and chemicals production, in the life cycle production of coal and crude oil. Thus, water can be saved by reducing the consumption of energy and industrial supplies in the coal and crude oil production industries. For natural gas, both water pollution and depletion largely occur in the upstream sectors, so improving the resource utilization efficiency in the process of gas extraction, e.g., lowering industrial supplies consumption, can greatly mitigate its life cycle impacts on water resources.
Coking is a thermochemical converting process with heavy water pollution. Although the Chinese government has made some efforts to control the pollution from coking, such as obsolescing outdated coke ovens and prohibiting the access of high-pollution coking technologies to the market, the coking industry in China still has a high intensity of water pollution. According to Figure 3, around 48% of COD, 40% of AN, 70% of PE, and 98% of VP are directly discharged from coke ovens. The VP pollutant discharge intensity of coking is extremely high (15,000 m3/TJ), so the wastewater treatment facilities withahigher VP removing efficiency should be equipped with coke ovens.
Petroleum products, including gasoline, diesel oil, etc., are upgraded from crude oil and therefore water is mostly used and polluted by the crude oil sector, except for VP pollution. This indicates that mitigating the impact of oil refining industries on water resources is strongly dependent on the cleaner production of crude oil. VP is a pollutant from petroleum products that greatly contributes to water degradation, and its discharge is mostly from oil refineries. VP discharge in the oil refining process should be limited at a low level as it has a severe impact on humans and aquatic organisms. The maximum permissible concentration of VP is only 0.005 mg/L and this requires a high effectiveness of VP removal at oil refineries.

3.4. The Performance of Water Saving and Pollution Mitigation of Fossil Energy Industries

As shown in Table 2, the coal production industry has the lowest pollutant removal rate partially due to its little expense of wastewater treatment (only 1.06 Yuan/m3). However, a large amount of mine wastewater from coal mines results in a high cost pressure from wastewater treatment. The coal production industry costs 12% of its profit on wastewater treatment, and this ratio is four times that of the total industry (with only 3%). With such a high financial pressure from wastewater treatment, more financial support such as subsidies or tax reduction are needed by coal mines to equip or upgrade mine wastewater treatment systems. Considering a low recycle water use (56%) and pollutant removing rate (64% to 75%), it can be concluded that there is great potential for water saving and water pollution mitigation in coal production if enough funding is provided.
For the production of crude oil, natural gas, petroleum products, and coke, they have an above average performance on water pollution control, i.e., higher pollutant removal rates and more treatment expenses than that of the total industry. These industries spend as much as 7% of their profits on wastewater treatment, because most of fossil energy companies in China are state-owned ones which have more funding and motivation to control pollution. Although these industries have high removal rates for PE and VP, from 97% to 99%, PE and VP are still the pollutants that cause the most severe water pollution issue in the fossil fuel sector. Thus, technological renovation that allows PE and VP to be removed at a low concentration is required in order to further mitigate water pollution. The crude oil and natural gas extraction industry has a high recycle rate of wastewater (94%) because a large amount of water is recharged into wells. The oil refining and coking industry recycles used water at a high ratio of 94% thanks to the adoption of water-saving technology in cooling systems.

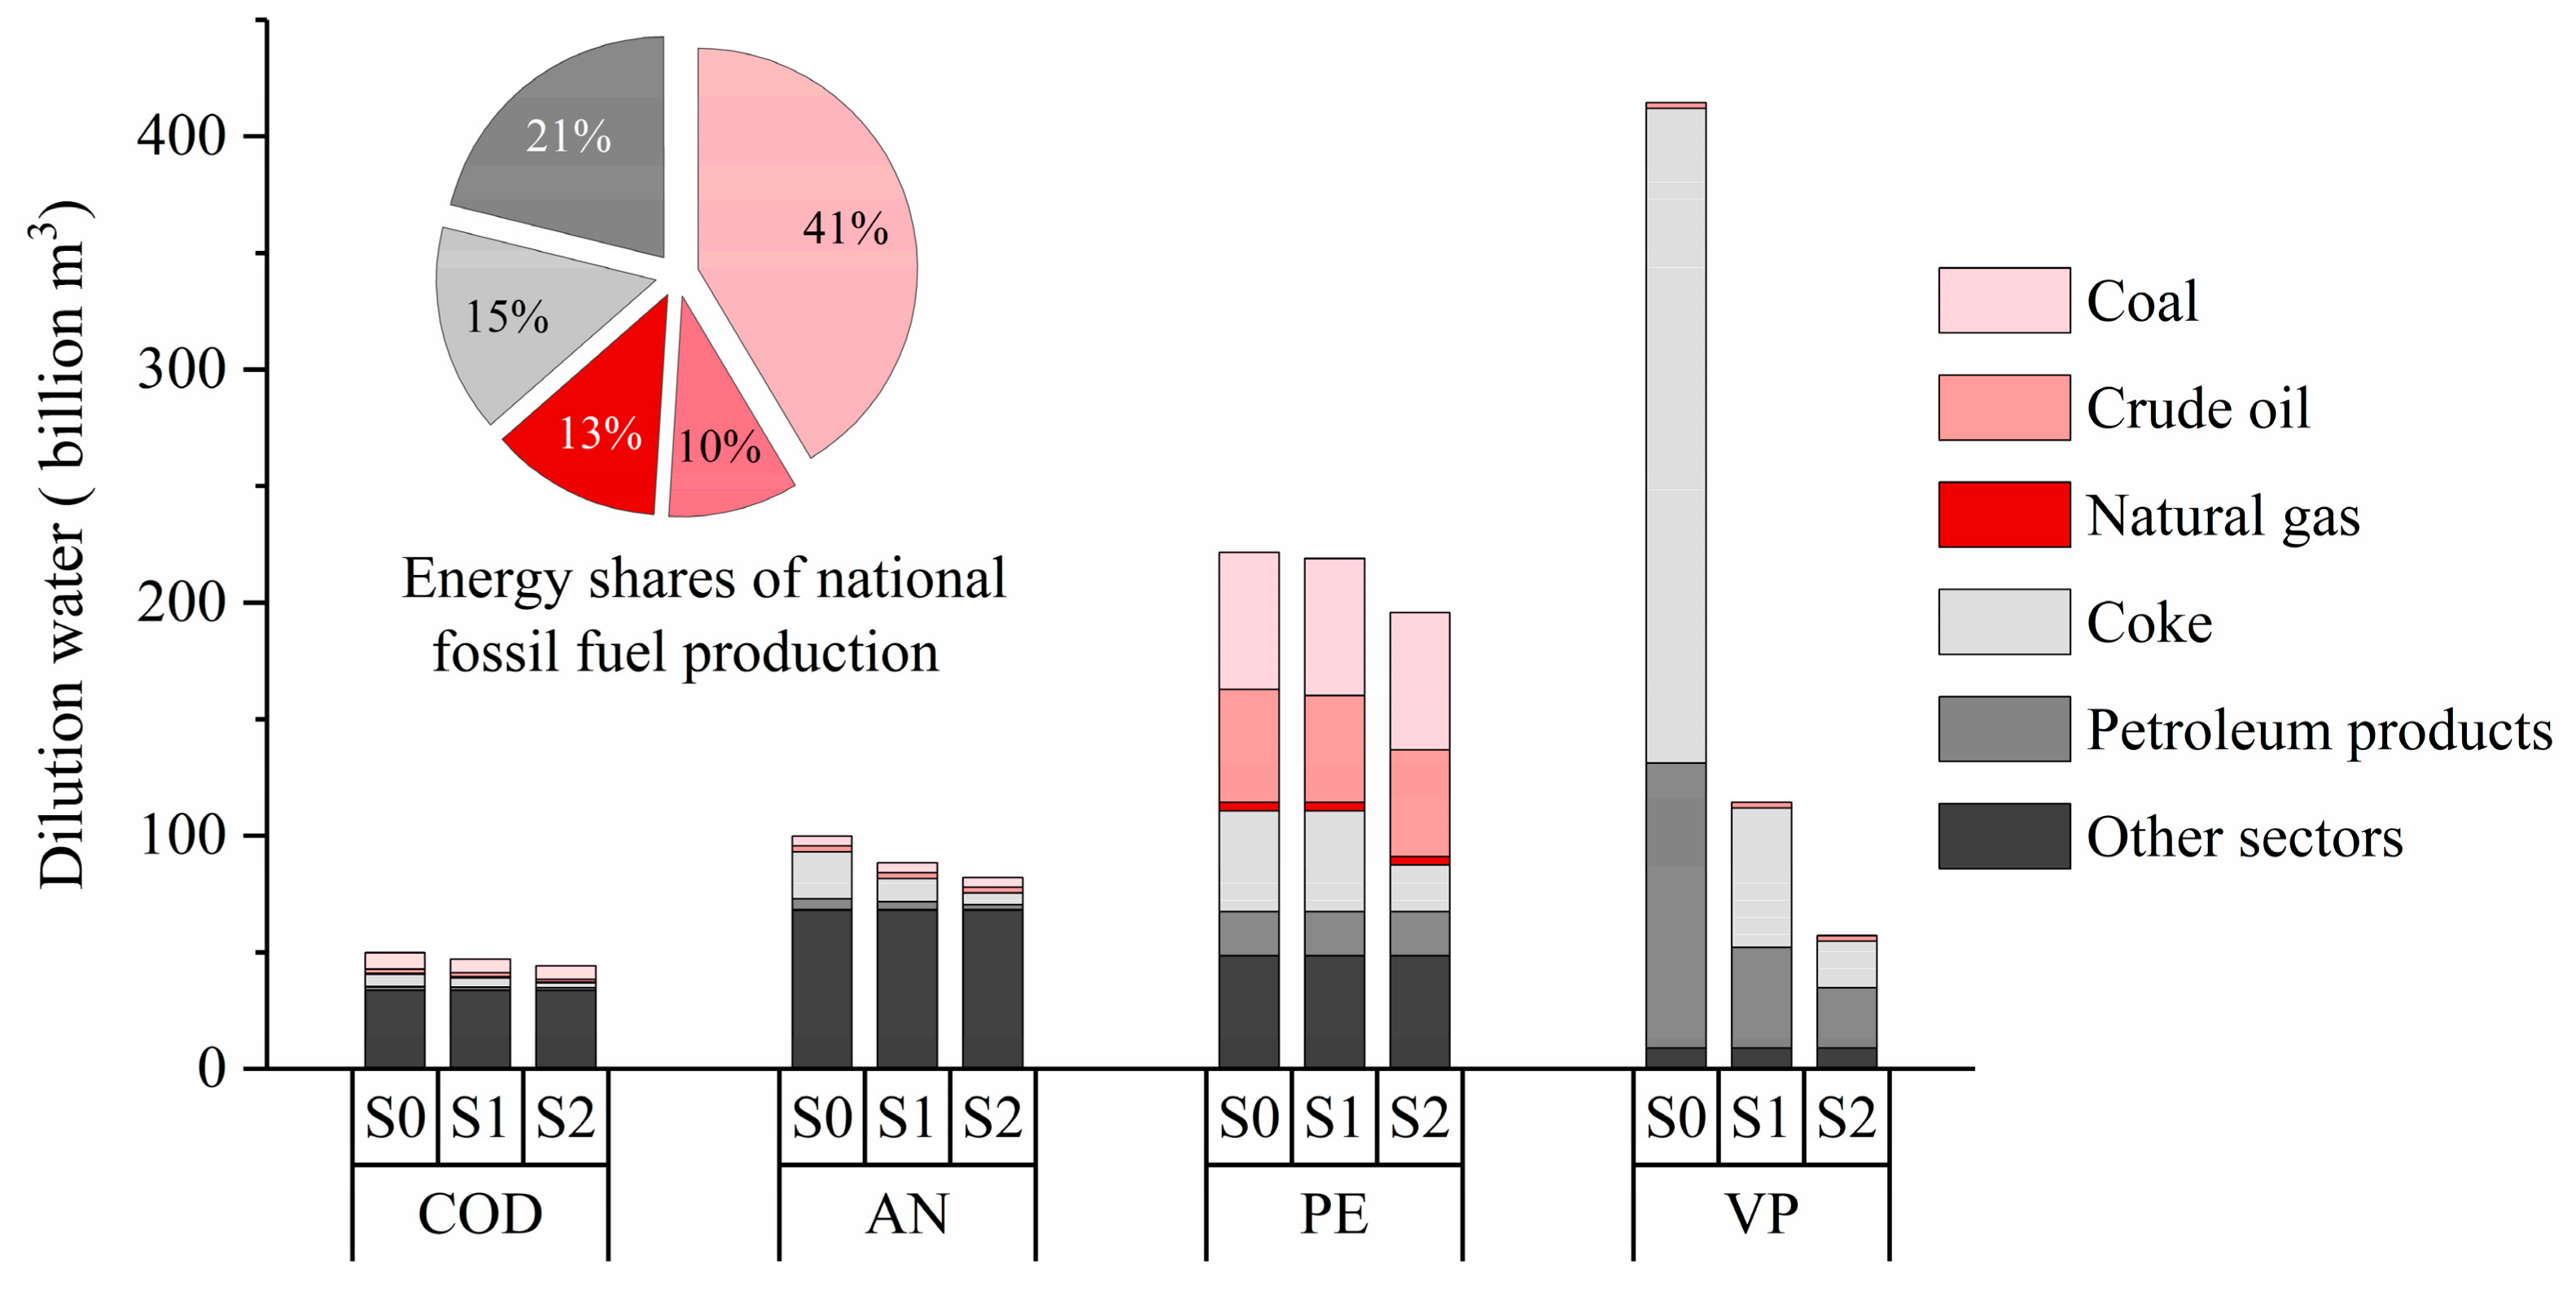
3.5. Scenario Analysis for Water Pollution from Fossil Fuel Sectors

Table 3 shows water pollutant concentrations in discharged wastewater from fossil fuel sectors. The national average (AVG) concentrations are compared with standards (STD1 for statewide industries and STD2 for industries in water-scarce regions) to identify over-standard pollutants. The AVG concentrations of fossil fuel extraction sectors (i.e., coal, crude oil, and natural gas) are generally close to the standards, while those of upgrading sectors (i.e., coke and petroleum products) are mostly higher than those in the standards. This indicates that water pollutants discharged from coking and oil refining industries, especially VP, should be tightly monitored to avoid excessive discharge.
Three scenarios (S0, S1, and S2) were designed in this study to examine water pollution mitigation when the pollutants in excess of the prescribed standards are removed. S0 is the scenario in which water pollutant concentrations of discharged wastewater remain unchanged and equal to the current AVG values. In S1 and S2, all the over-standard pollutants are treated and discharged at concentrations in the corresponding standards (STD1 and STD2). The production capacity of each fossil fuel in 2020 is based on the 13th Five-Year Plan for Energy Development of China. Although coal production capacity was set to decelerate according to this plan, coal will still provide China’s largest source of energy in 2020, as shown in Figure 4. Coke only has an annual output of 450 million tons but contributes the most to water pollution with nearly 300 billion m3 of VP dilution water. This is largely attributed to excessive VP discharge which is more than 3.7 times of STD1. The Chinese government is washing out the disqualified coke production capacity and intends to make pollution discharge in most coke ovens meet the standards in 2020. As shown in Figure 4, VP discharge can decrease dramatically if pollutant discharge from all coking industries is in conformity with STD1. In S0, VP has the largest amount of dilution water and it is mostly discharged from coking and oil refining industries. In S1 and S2, VP discharge decreases dramatically while PE becomes the determining pollutant of grey water. This implies that the fossil fuel sectors should focus on PE discharge control after VP is effectively removed to meet the standards. A lower allowable concentration for PE discharge should be set in the future as there is no significant PE pollution mitigation from S0 to S2. There are no significant differences among three scenarios for COD and AN discharge, because these two pollutants are mainly discharged from other industrial sectors rather than directly from fossil fuel sectors.
China’s government has already integrated water management into energy production planning, e.g., energy production projects are limited in the water-scare regions [3]. Besides water quantity management, water quality management policies in the energy sector should also be implemented effectively. As shown in our study, PE and VP are the first two key pollutants that need to be controlled in the fossil energy sector. The higher standard (STD2) can effectively reduce the VP pollution, so STD2 needs to be strictly observed especially in northern China, where fossil fuels are rich but the water ecosystem is fragile. PE requires a higher standard in that PE still have a large amount of dilution water even if STD2 is followed nationwide. The removal rate of PE in the fossil fuel sector is already very high as shown in Table 2, so a renovation wastewater treatment technology is urgently needed to be developed and equipped in the fossil fuel sector. PE pollutant discharge, especially from coal mines and oil fields, has already been an essential pollution issue and could be a more tough issue in the future, so it needs to be focused on by the further polices of energy related water quality management.

4. Conclusions

This study developed a mixed-unit input–output model to perform a lifecycle assessment of water degradation in production of China’s most common fossil fuels, including coal, crude oil, natural gas, coke, and petroleum products. Compared with water depletion, energy-related water pollution is severer in that grey water consumption is more than blue water consumption by at least one order of magnitude in production of fossil fuels. In the life cycle production of fossil fuels, COD has the highest discharge amount, but PE and VP require more dilution water because of their high toxicity and low allowanceconcentration. The results show that PE is mainly discharged at coal mines and oil extraction fields, while VP is mainly generated in coking and refining processes. Fortunately, there is great potential to reduce VP pollution. The scenario analysis shows that if STD2 is obeyed nationwide by all the fossil fuel producers, then the VP pollutant discharge amount can be reduced by 88%. PE would remain being a tough water pollution issue in that PE requires the largest amount of dilution water in the S2 scenario. The mitigation of PE pollution requires various endeavors, including ahigher discharge standard, upgraded wastewater treatment technology, etc.

Author Contributions

Conceptualization, L.C.; formal analysis, Y.L. and Y.S.; Methodology, Y.S., L.C. and Z.H.; software, Y.L.; supervision, L.C.; visualization, Y.S. and L.C.; data curation, J.L., Z.L., and L.Y.; original draft preparation, Y.S. and S.M.; writing review and editing, L.C.

Funding

This work was supported by the National training program of innovation and entrepreneurship for undergraduates (201910019165).

Conflicts of Interest

The authors declare no conflict of interest.

References

  1. U.S. Energy Information Administration (EIA). International Energy Outlook. 2018. Available online: https://www.eia.gov/outlooks/ieo/ (accessed on 17 July 2019).
  2. Wang, C.Y.; Li, P.G.; Liu, Y. Investigation of water-energy-emission nexus of air pollution control of the coal-fired power industry: A case study of Beijing-Tianjin-Hebei region, China. Energy Policy 2018, 115, 291–301. [Google Scholar] [CrossRef]
  3. Qin, Y.; Curmi, E.; Kopec, G.M.; Allwood, J.M.; Richards, K.S. China’s energy-water nexus—Assessment of the energy sector’s compliance with the “3 Red Lines” industrial water policy. Energy Policy 2015, 82, 131–143. [Google Scholar] [CrossRef]
  4. Pan, L.Y.; Liu, P.; Ma, L.W.; Li, Z. A supply chain based assessment of water issues in the coal industry in China. Energy Policy 2012, 48, 93–102. [Google Scholar] [CrossRef]
  5. Zhang, X.X.; Liu, J.G.; Tang, Y.; Zhao, X.; Yang, H.; Gerbens-Leenes, P.W.; van Vliet, M.T.H.; Yan, J.Y. China’s coal-fired power plants impose pressure on water resources. J. Clean. Prod. 2017, 161, 1171–1179. [Google Scholar] [CrossRef]
  6. Shang, Y.; Lu, S.; Li, X.; Hei, P.; Lei, X.; Gong, J.; Liu, J.; Zhai, J.; Wang, H. Balancing development of major coal bases with available water resources in China through 2020. Appl. Energy 2016, 194, 735–750. [Google Scholar] [CrossRef]
  7. Xu, M.; Li, C.; Lu, S. Sustainable Water Resources Utilization on Energy Industry Based on the Gray Water Footprints Assessment in Hunan Province. Energy Procedia 2017, 105, 3758–3764. [Google Scholar] [CrossRef]
  8. Zakrutkin, V.; Sklyarenko, G.; Gibkov, E.; Reshetnyak, O.; Rodina, A. Environmental Problems of Coal-Mining Territories (Water Pollution). In International Multidisciplinary Scientific GeoConference; Surveying Geology & Mining Ecology Management (SGEM): Sofia, Bulgaria, 2016; pp. 87–93. [Google Scholar]
  9. Annual Report of China’s Environmental Statistics 2016; Ministry of Environmental Protection of China: Beijing, China, 2017.
  10. Chai, L.; Liao, X.W.; Yang, L.; Yan, X.L. Assessing life cycle water use and pollution of coal-fired power generation in China using input-output analysis. Appl. Energy 2018, 231, 951–958. [Google Scholar] [CrossRef]
  11. Liu, J.G.; Zhao, D.D.; Gerbens-Leenes, P.W.; Guan, D.B. China’s rising hydropower demand challenges water sector. Sci. Rep.-UK 2015, 5, 11446. [Google Scholar] [CrossRef] [PubMed]
  12. Lin, G.; Jiang, D.; Duan, R.; Fu, J.Y.; Hao, M.M. Water Use of Fossil Energy Production and Supply in China. Water 2017, 9, 513. [Google Scholar] [CrossRef]
  13. Gerbens-Leenes, W.; Hoekstra, A.Y.; van der Meer, T.H. The water footprint of bioenergy. Proc. Natl. Acad. Sci. USA 2009, 106, 10219–10223. [Google Scholar] [CrossRef] [PubMed] [Green Version]
  14. Ding, N.; Liu, J.; Yang, J.; Lu, B. Water footprints of energy sources in China: Exploring options to improve water efficiency. J. Clean. Prod. 2018, 174, 1021–1031. [Google Scholar] [CrossRef]
  15. Liao, X.; Hall, J.W.; Eyre, N. Water use in China’s thermoelectric power sector. Glob. Environ. Chang. 2016, 41, 142–152. [Google Scholar] [CrossRef]
  16. Zhang, C.; Zhong, L.; Fu, X.; Wang, J.; Wu, Z. Revealing Water Stress by the Thermal Power Industry in China Based on a High Spatial Resolution Water Withdrawal and Consumption Inventory. Environ. Sci. Technol. 2016, 50, 1642–1652. [Google Scholar] [CrossRef] [PubMed]
  17. DeNooyera, T.A.; Peschel, J.M.; Zhang, Z.X.; Stillwell, A.S. Integrating water resources and power generation: The energy-water nexus in Illinois. Appl. Energy 2016, 162, 363–371. [Google Scholar] [CrossRef]
  18. Byers, E.A.; Hall, J.W.; Amezaga, J.M. Electricity generation and cooling water use: UK pathways to 2050. Glob. Environ. Chang. 2014, 25, 16–30. [Google Scholar] [CrossRef] [Green Version]
  19. Fthenakis, V.; Kim, H.C. Life-cycle uses of water in U.S. electricity generation. Renew. Sustain. Energy Rev. 2010, 14, 2039–2048. [Google Scholar] [CrossRef] [Green Version]
  20. Mekonnen, M.M.; Gerbens-Leenes, P.W.; Hoekstra, A.Y. The consumptive water footprint of electricity and heat: A global assessment. Environ. Sci. Water Res. Technol. 2015, 1, 285–297. [Google Scholar] [CrossRef]
  21. Siddiqi, A.; Anadon, L.D. The water-energy nexus in Middle East and North Africa. Energy Policy 2011, 39, 4529–4540. [Google Scholar] [CrossRef]
  22. Shang, Y.Z.; Hei, P.F.; Lu, S.B.; Shang, L.; Li, X.F.; Wei, Y.P.; Jia, D.D.; Jiang, D.; Ye, Y.T.; Gong, J.G.; et al. China’s energy-water nexus: Assessing water conservation synergies of the total coal consumption cap strategy until 2050. Appl. Energy 2018, 210, 643–660. [Google Scholar] [CrossRef]
  23. Hawkins, T.; Hendrickson, C.; Higgins, C.; Matthews, H.S.; Suh, S. A mixed-unit input-output model for environmental life-cycle assessment and material flow analysis. Environ. Sci. Technol. 2007, 41, 1024–1031. [Google Scholar] [CrossRef]
  24. Zhang, C.; Anadon, L.D. Life cycle water use of energy production and its environmental impacts in China. Environ. Sci. Technol. 2013, 47, 11467–14459. [Google Scholar] [CrossRef] [PubMed]
  25. Standard of Surface Water Quality in China; Ministry of Environmental Protection of China: Beijing, China, 2002.
  26. Hoekstra, A.Y.; Chapagain, A.K.; Aldaya, M.M.; Mekonnen, M.M. The Water Footprint Assessment Manual. Earthscan 2011, 31, 181–182. [Google Scholar]
  27. Zeng, Z.; Liu, J.; Savenije, H.H.G. A simple approach to assess water scarcity integrating water quantity and quality. Ecol. Indic. 2013, 34, 441–449. [Google Scholar] [CrossRef]
  28. Liu, C.; Kroeze, C.; Hoekstra, A.Y.; Gerbens-Leenes, W. Past and future trends in grey water footprints of anthropogenic nitrogen and phosphorus inputs to major world rivers. Ecol. Indic. 2012, 18, 42–49. [Google Scholar] [CrossRef]
  29. Guan, D.; Hubacek, K.; Tillotson, M.; Zhao, H.; Liu, W.; Liu, Z.; Liang, S. Lifting China’s water spell. Environ. Sci. Technol. 2014, 48, 11048–11056. [Google Scholar] [CrossRef] [PubMed]
  30. Li, H.; Yang, Z.; Liu, G.; Casazza, M.; Yin, X. Analyzing virtual water pollution transfer embodied in economic activities based on Gray Water Footprint: A case study. J. Clean. Prod. 2017, 161, 1064–1073. [Google Scholar] [CrossRef]
  31. Mekonnen, M.M.; Hoekstra, A.Y. Global grey water footprint and water pollution levels related to anthropogenic nitrogen loads to fresh water. Environ. Sci. Technol. 2015, 49, 12860–12868. [Google Scholar] [CrossRef]
  32. Cai, B.; Wang, C.; Zhang, B. Worse than imagined: Unidentified virtual water flows in China. J. Environ. Manag. 2017, 196, 681–691. [Google Scholar] [CrossRef] [Green Version]
  33. Cazcarro, I.; Duarte, R.; Sánchez-Chóliz, J. Downscaling the grey water footprints of production and consumption. J. Clean. Prod. 2016, 132, 171–183. [Google Scholar] [CrossRef] [Green Version]
  34. Wu, B.; Zeng, W.; Chen, H.; Zhao, Y. Grey water footprint combined with ecological network analysis for assessing regional water quality metabolism. J. Clean. Prod. 2016, 112, 3138–3151. [Google Scholar] [CrossRef]
  35. Liao, X.W.; Chai, L.; Xu, X.F.; Lu, Q.; Ji, J.P. Grey water footprint and interprovincial virtual grey water transfers for China’s final electricity demands. J. Clean. Prod. 2019, 227, 111–118. [Google Scholar] [CrossRef]
  36. Feng, K.S.; Hubacek, K.; Pfister, S.; Yu, Y.; Sun, L.X. Virtual Scarce Water in China. Environ. Sci. Technol. 2014, 48, 7704–7713. [Google Scholar] [CrossRef] [PubMed]
  37. Chen, S.; Chen, B. Tracking inter-regional carbon flows: A hybrid network model. Environ. Sci. Technol. 2016, 50, 4731–4741. [Google Scholar] [CrossRef] [PubMed]
  38. Wang, S.; Liu, Y.; Chen, B. Multiregional input–output and ecological network analyses for regional energy–water nexus within China. Appl. Energy 2017, 227, 353–364. [Google Scholar] [CrossRef]
  39. Liao, X.; Chai, L.; Ji, J.; Mi, Z.; Guan, D.; Zhao, X. Life-cycle water uses for energy consumption of Chinese households from 2002 to 2015. J. Environ. Manag. 2019, 231, 989–995. [Google Scholar] [CrossRef] [PubMed]
  40. Zhang, C.; Zhong, L.; Liang, S.; Sanders, K.T.; Wang, J.; Xu, M. Virtual scarce water embodied in inter-provincial electricity transmission in China. Appl. Energy 2017, 187, 438–448. [Google Scholar] [CrossRef] [Green Version]
Figure 1. Lifecycle consumptive, withdrawn, discharged, and virtual grey water embodied in fossil fuels per energy unit of terajoule (TJ).
Sustainability 11 04130 g001
Figure 2. Life cycle dilution water (a) and water pollutant discharge (b) of fossil fuels per unit of energy. Water pollutants include chemical oxygen demand (COD), ammonia nitrogen (AN), petroleum (PE), and volatile phenols (VP).
Sustainability 11 04130 g002
Figure 3. Shares of the life cycle water consumption (WC), water withdrawal (WD), chemical oxygen demand discharge (COD), ammonia nitrogen discharge (AN), petroleum discharge (PE), and volatile phenols discharge (VP) from different sectors.
Sustainability 11 04130 g003
Figure 4. Life cycle dilution water of pollutants discharged by China’s fossil fuel production in 2020 for three scenarios (S0, S1, and S2).
Sustainability 11 04130 g004
Table 1. The national average heating values of fossil fuel products in China.
CoalCrude OilNatural GasPetroleum ProductsCoke
Heating value (MJ/kg)20.4141.8453.0742.0428.56
Table 2. Comparison of water saving and pollutant removing performance of fossil fuel industries and the total industry in China. The estimation is based on the national average values in 2015.
IndicatorsCoal Mining and Washing Oil and Gas ExtractionOil Refining and Coking Industry Total
Ratio of expense on wastewater treatment to industry profit 12%7%7%3%
Expense of wastewater treatment per unit volume of wastewater (¥/m3)1.063.125.171.54
Recycle rate of water use56%80%94%90%
Recycle rate of wastewater 23%94%11%59%
Removal rate of COD65%97%88%86%
Removal rate of AN64%91%90%82%
Removal rate of PE70%99%97%94%
Removal rate of VP75%98%98%98%
Table 3. The comparison of China’s national average (AVG) and standard (STD) water pollutant concentrations (mg/L) in discharged wastewater from fossil fuel industries. According to the Ministry of Environment Protection of China, STD1 applies to the statewide industries while STD2 should be abided by the industries in water-scarce regions.
Fossil Fuel Extraction SectorsCODANPEVP
AVGSTD1STD2AVGSTD1STD2AVGSTD1STD2AVGSTD1STD2
Coal86.070.070.02.625.015.01.85.05.00.00.50.5
Crude oil156.2150.0100.011.025.015.010.610.010.00.10.50.5
Natural gas56.6150.0100.00.025.015.01.410.010.00.00.50.5
Coke107.280.040.020.310.05.02.22.51.01.40.30.1
Petroleum products64.360.050.010.88.05.02.25.03.01.40.50.3

