How Taxes Relate to Potential Welfare Gain and Appreciable Economic Growth


Abstract
1. Introduction
2. Literature Review
3. Data and Methodology
4. Results and Discussions
4.1. Descriptive Statistics
4.2. Granger Causality Statistics
5. Conclusions
Author Contributions
Funding
Conflicts of Interest
References
- Lee, Y.; Gordon, R. Tax Structure and Economic Growth. J. Public Econ. 2005, 89, 1027–1043. [Google Scholar] [CrossRef]
- Angelopoulos, K.; Economides, G.; Kammas, P. Tax−Spending Policies and Economic Growth: Theoretical Predictions and Evidence from the OECD. Eur. J. Political Econ. 2007, 23, 885–902. [Google Scholar] [CrossRef]
- Padovano, F.; Galli, E. Tax Rates and Economic Growth in the OECD Countries (1950–1990). Econ. Inq. 2001, 39, 44–57. [Google Scholar] [CrossRef]
- Piketty, T.; Saez, E.; Stantcheva, S. Optimal Taxation of Top Labor Incomes: A Tale of Three Elasticities. Natl. Bur. Econ. Res. Working Paper 17616. 2011. Available online: http://www.nber.org/papers/w17616.pdf (accessed on 18 February 2019).
- Sonedda, D. The output effects of labor income taxes in OECD countries. Public Financ. Rev. 2009, 37, 686–709. [Google Scholar] [CrossRef]
- Tanzi, V.; Zee, H. Tax policy for emerging markets: Developing countries. Natl. Tax J. 2000, 53, 299–322. [Google Scholar] [CrossRef]
- Stiglitz, J. Pareto Efficient and Optimal Taxation and the New Welfare Economics. Natl. Bur. Econ. Res. Working Paper 2189. 1987. Available online: http://www.nber.org/papers/w2189.pdf (accessed on 18 February 2019).
- Li, W.; Sarte, P.D. Growth Effects of Progressive Taxes. Federal Reserve Bank of Philadelphia, 2003. Available online: https://ideas.repec.org/p/fip/fedpwp/03-15.html (accessed on 16 February 2019).
- Wojciechowska−Toruńska, I. Tax Progression vs Economic Growth & Development Index (GDI). Ann. Univ. Mariae Curie−Skłodowska, Sect. H 2017, 51, 331–338. [Google Scholar] [CrossRef][Green Version]
- Angelopoulos, K.; Malley, J.; Philippopoulos, A. Tax structure, growth, and welfare in the UK. Oxf. Econ. Pap. 2012, 64, 237–258. [Google Scholar] [CrossRef]
- Booth, P.; Bourne, R.; Meakin, R.; Minford, L.; Minford, P.; Smith, D. Taxation, Government Spending and Economic Growth. The Institute of Economic Affairs, 2016. Available online: https://iea.org.uk/wp-content/uploads/2016/11/Tax-and-Growth-PDF.pdf (accessed on 16 February 2019).
- Angell, O.H. Challenges to Equality in the Welfare State: The Norwegian Case of Drammen. Int. Beliefs Values 2011, 3, 41–50. [Google Scholar]
- Thakur, S.; Michael, K.; Balazs, H.; Valerie, C. Sweden’s Welfare State. Can the Bumblebee Keep Flying? International Monetary Fund: Washington, DC, USA, 2003. [Google Scholar]
- Dumitrescu, E.I.; Hurlin, C. Testing for Granger non−causality in heterogeneous panels. Econ. Model. 2012, 29, 1450–1460. [Google Scholar] [CrossRef]
- Wu, T.; Fan, D.; Chang, T. The relationship between globalization and military expenditures in G7 countries: Evidence from a panel data analysis. Econ. Comput. Econ. Cybern. Stud. Res. 2016, 3, 285–392. [Google Scholar]
- Moldovan, N.C. The tax competition between theory and practice. Efforts and effects at the level of the European Union. Theor. Appl. Econ. 2009, 12, 77–83. [Google Scholar]


| Variable | CEE Countries | Developed Countries | ||||||
|---|---|---|---|---|---|---|---|---|
| Mean | Std. Dev. | Min | Max | Mean | Std. Dev. | Min | Max | |
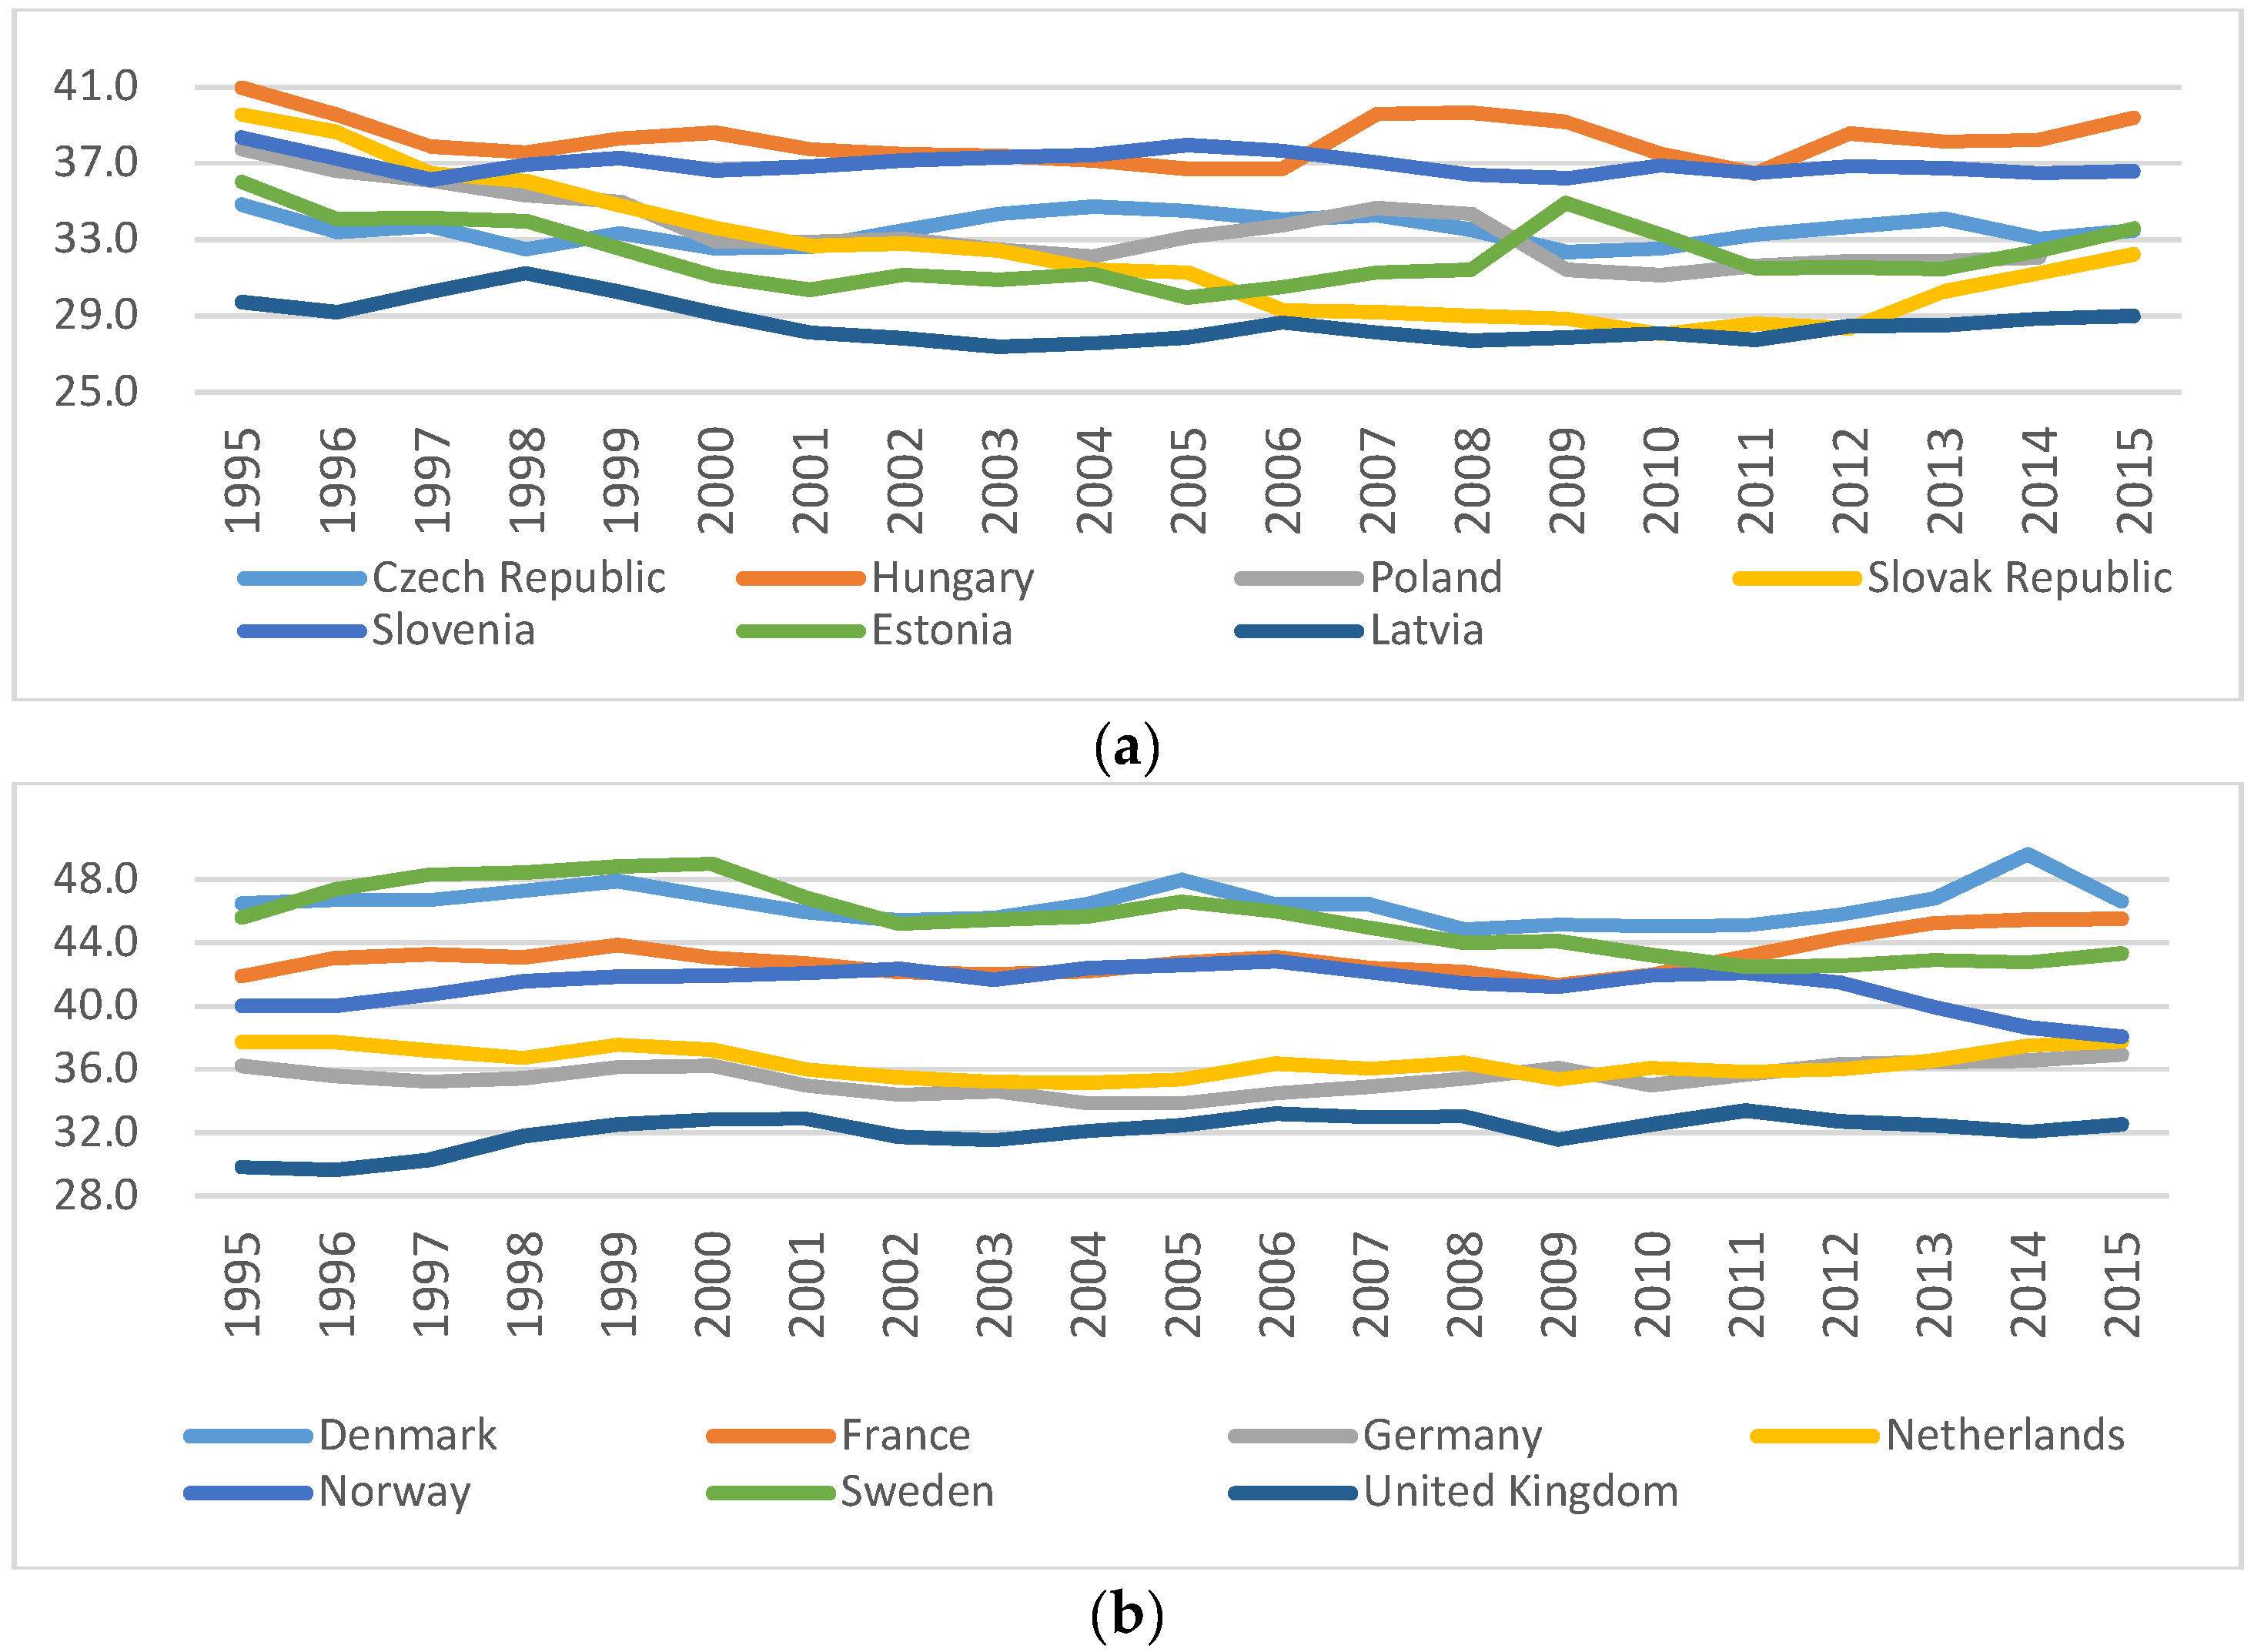
| TotTax | 33.622 | 3.426 | 27.4 | 41 | 40.031 | 5.210 | 29.7 | 49.6 |
| TaxIPrCap | 7.556 | 1.194 | 5.3 | 10.9 | 15.129 | 6.501 | 6.8 | 32.2 |
| SSC | 12.403 | 1.973 | 7.9 | 16.4 | 10.141 | 5.212 | 0.1 | 18 |
| TaxProp | 0.733 | 0.373 | 0.2 | 1.7 | 1.966 | 1.057 | 0.8 | 4.1 |
| TaxGS | 12.555 | 1.737 | 9.9 | 17.2 | 11.83 | 1.878 | 9.2 | 16.3 |
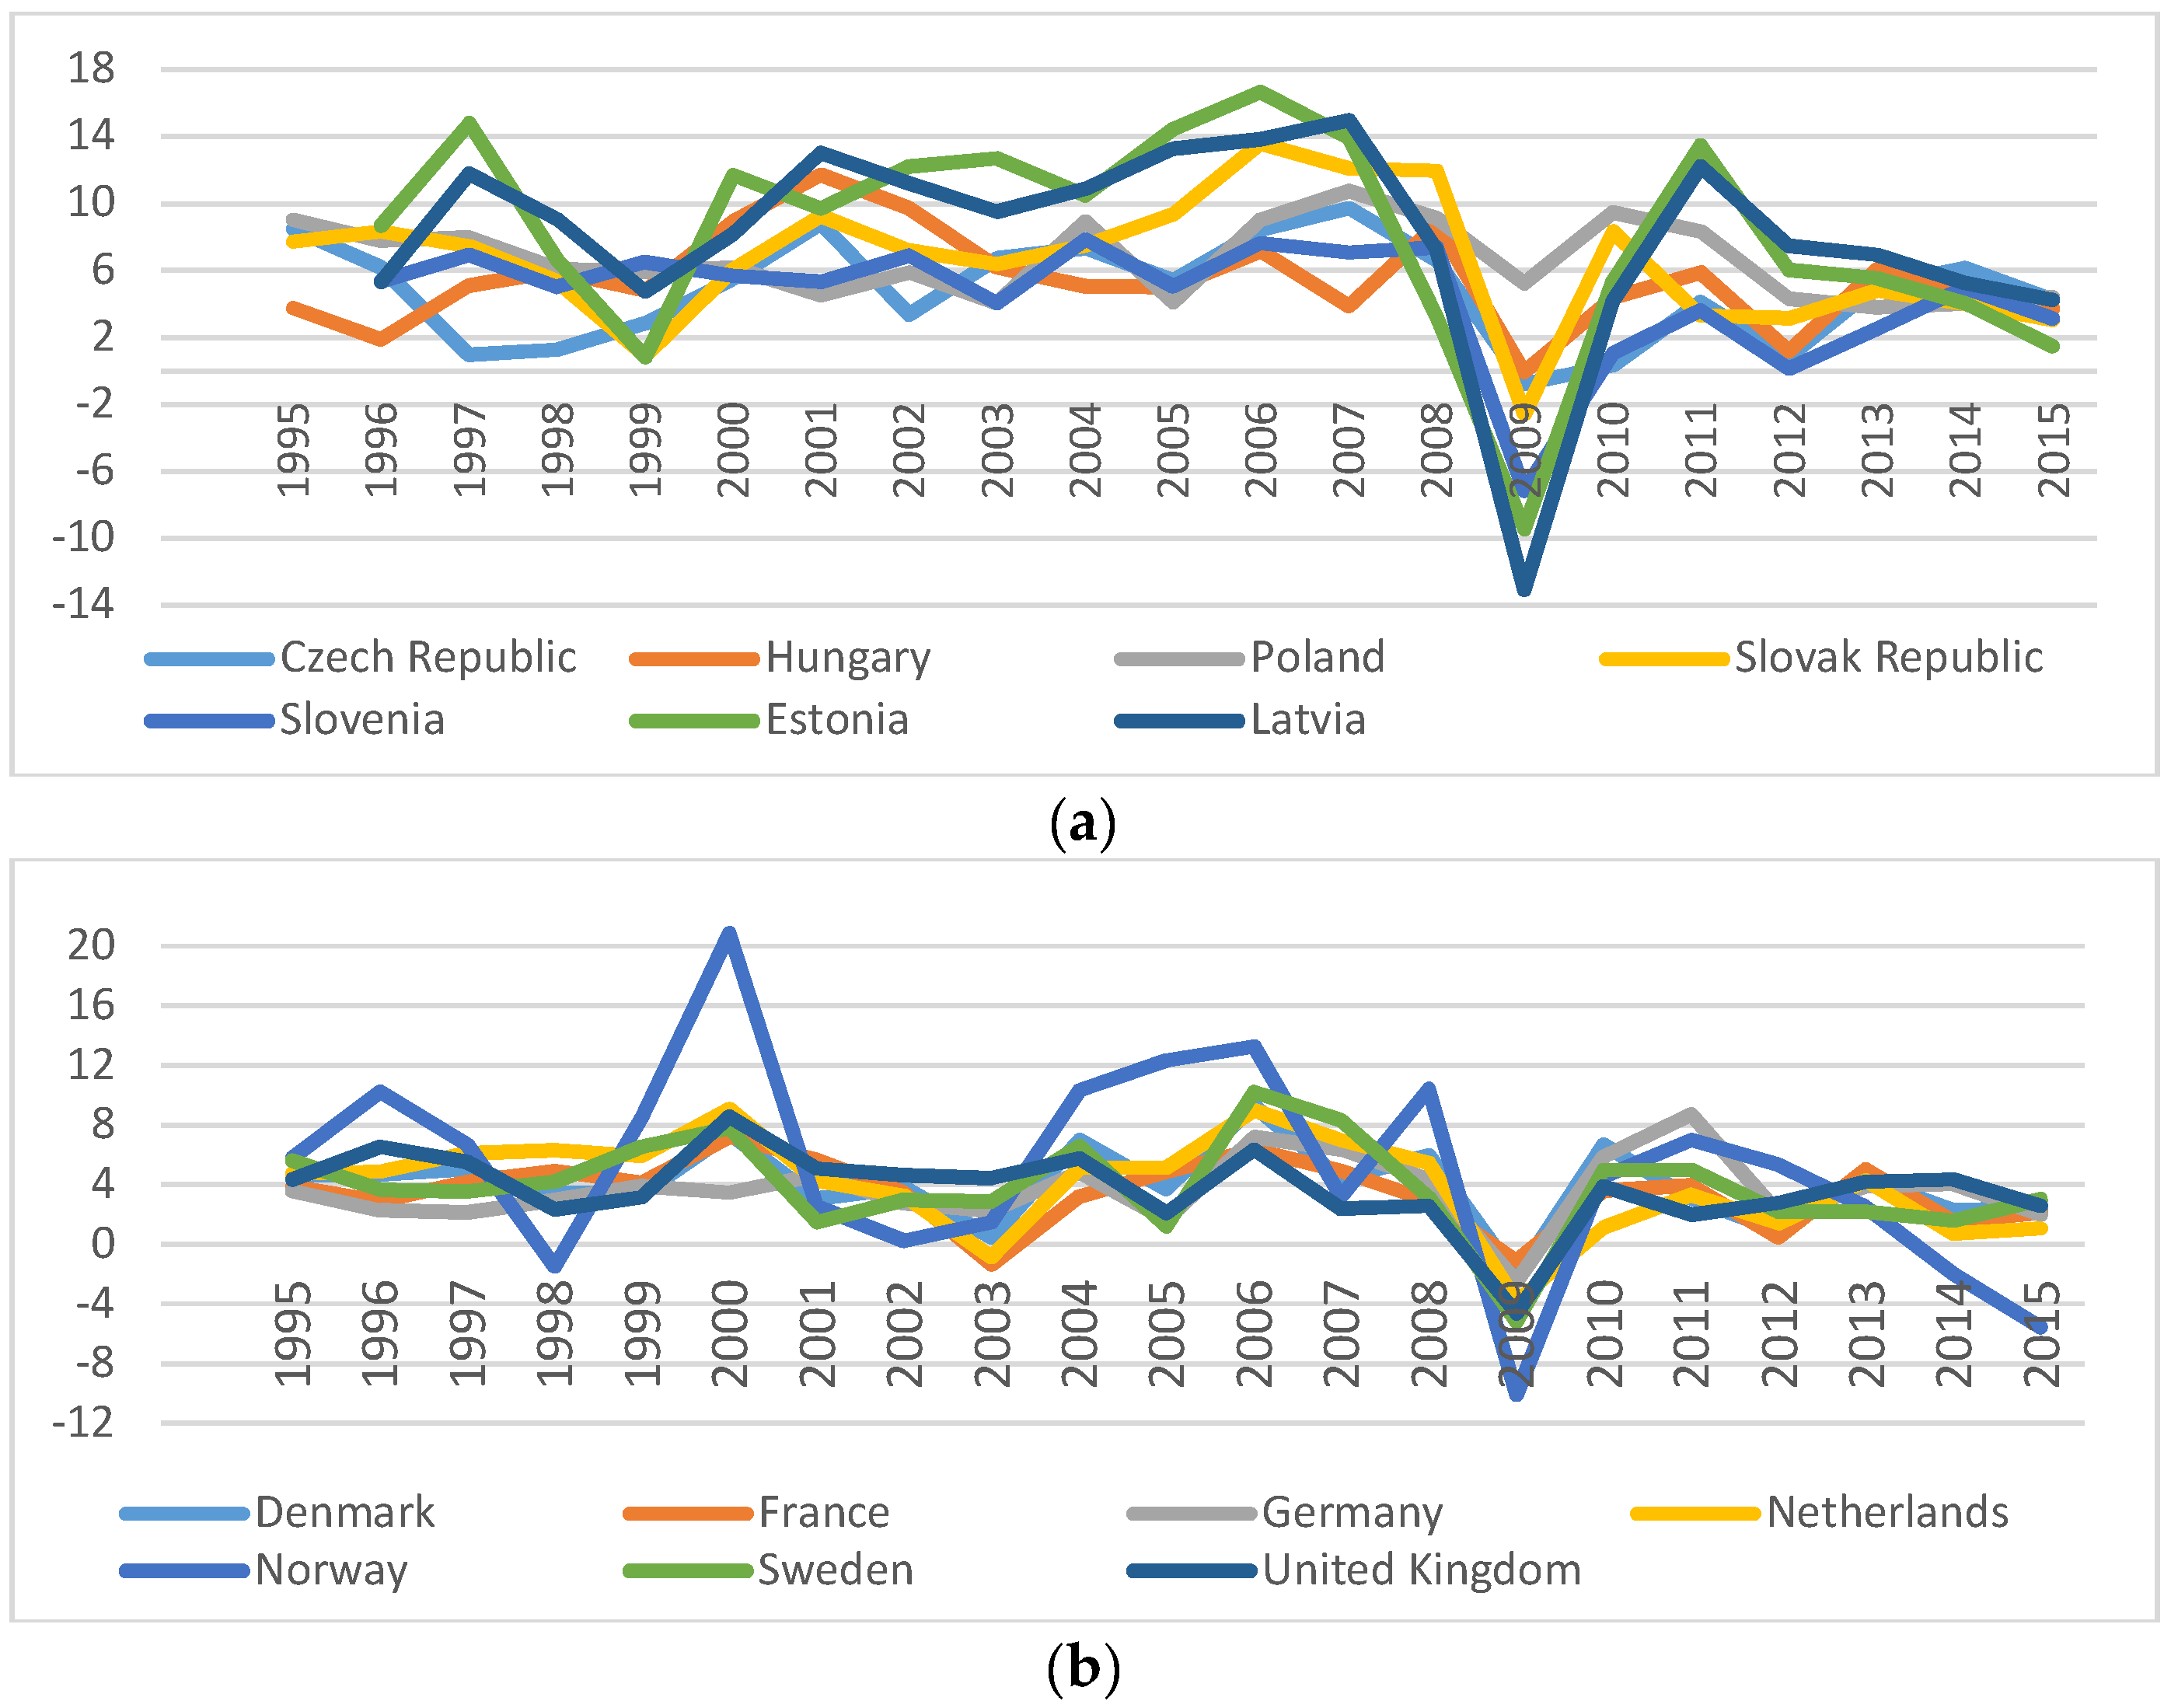
| GDP | 6.273 | 4.316 | −13.087 | 16.668 | 3.981 | 3.571 | −10.079 | 20.856 |
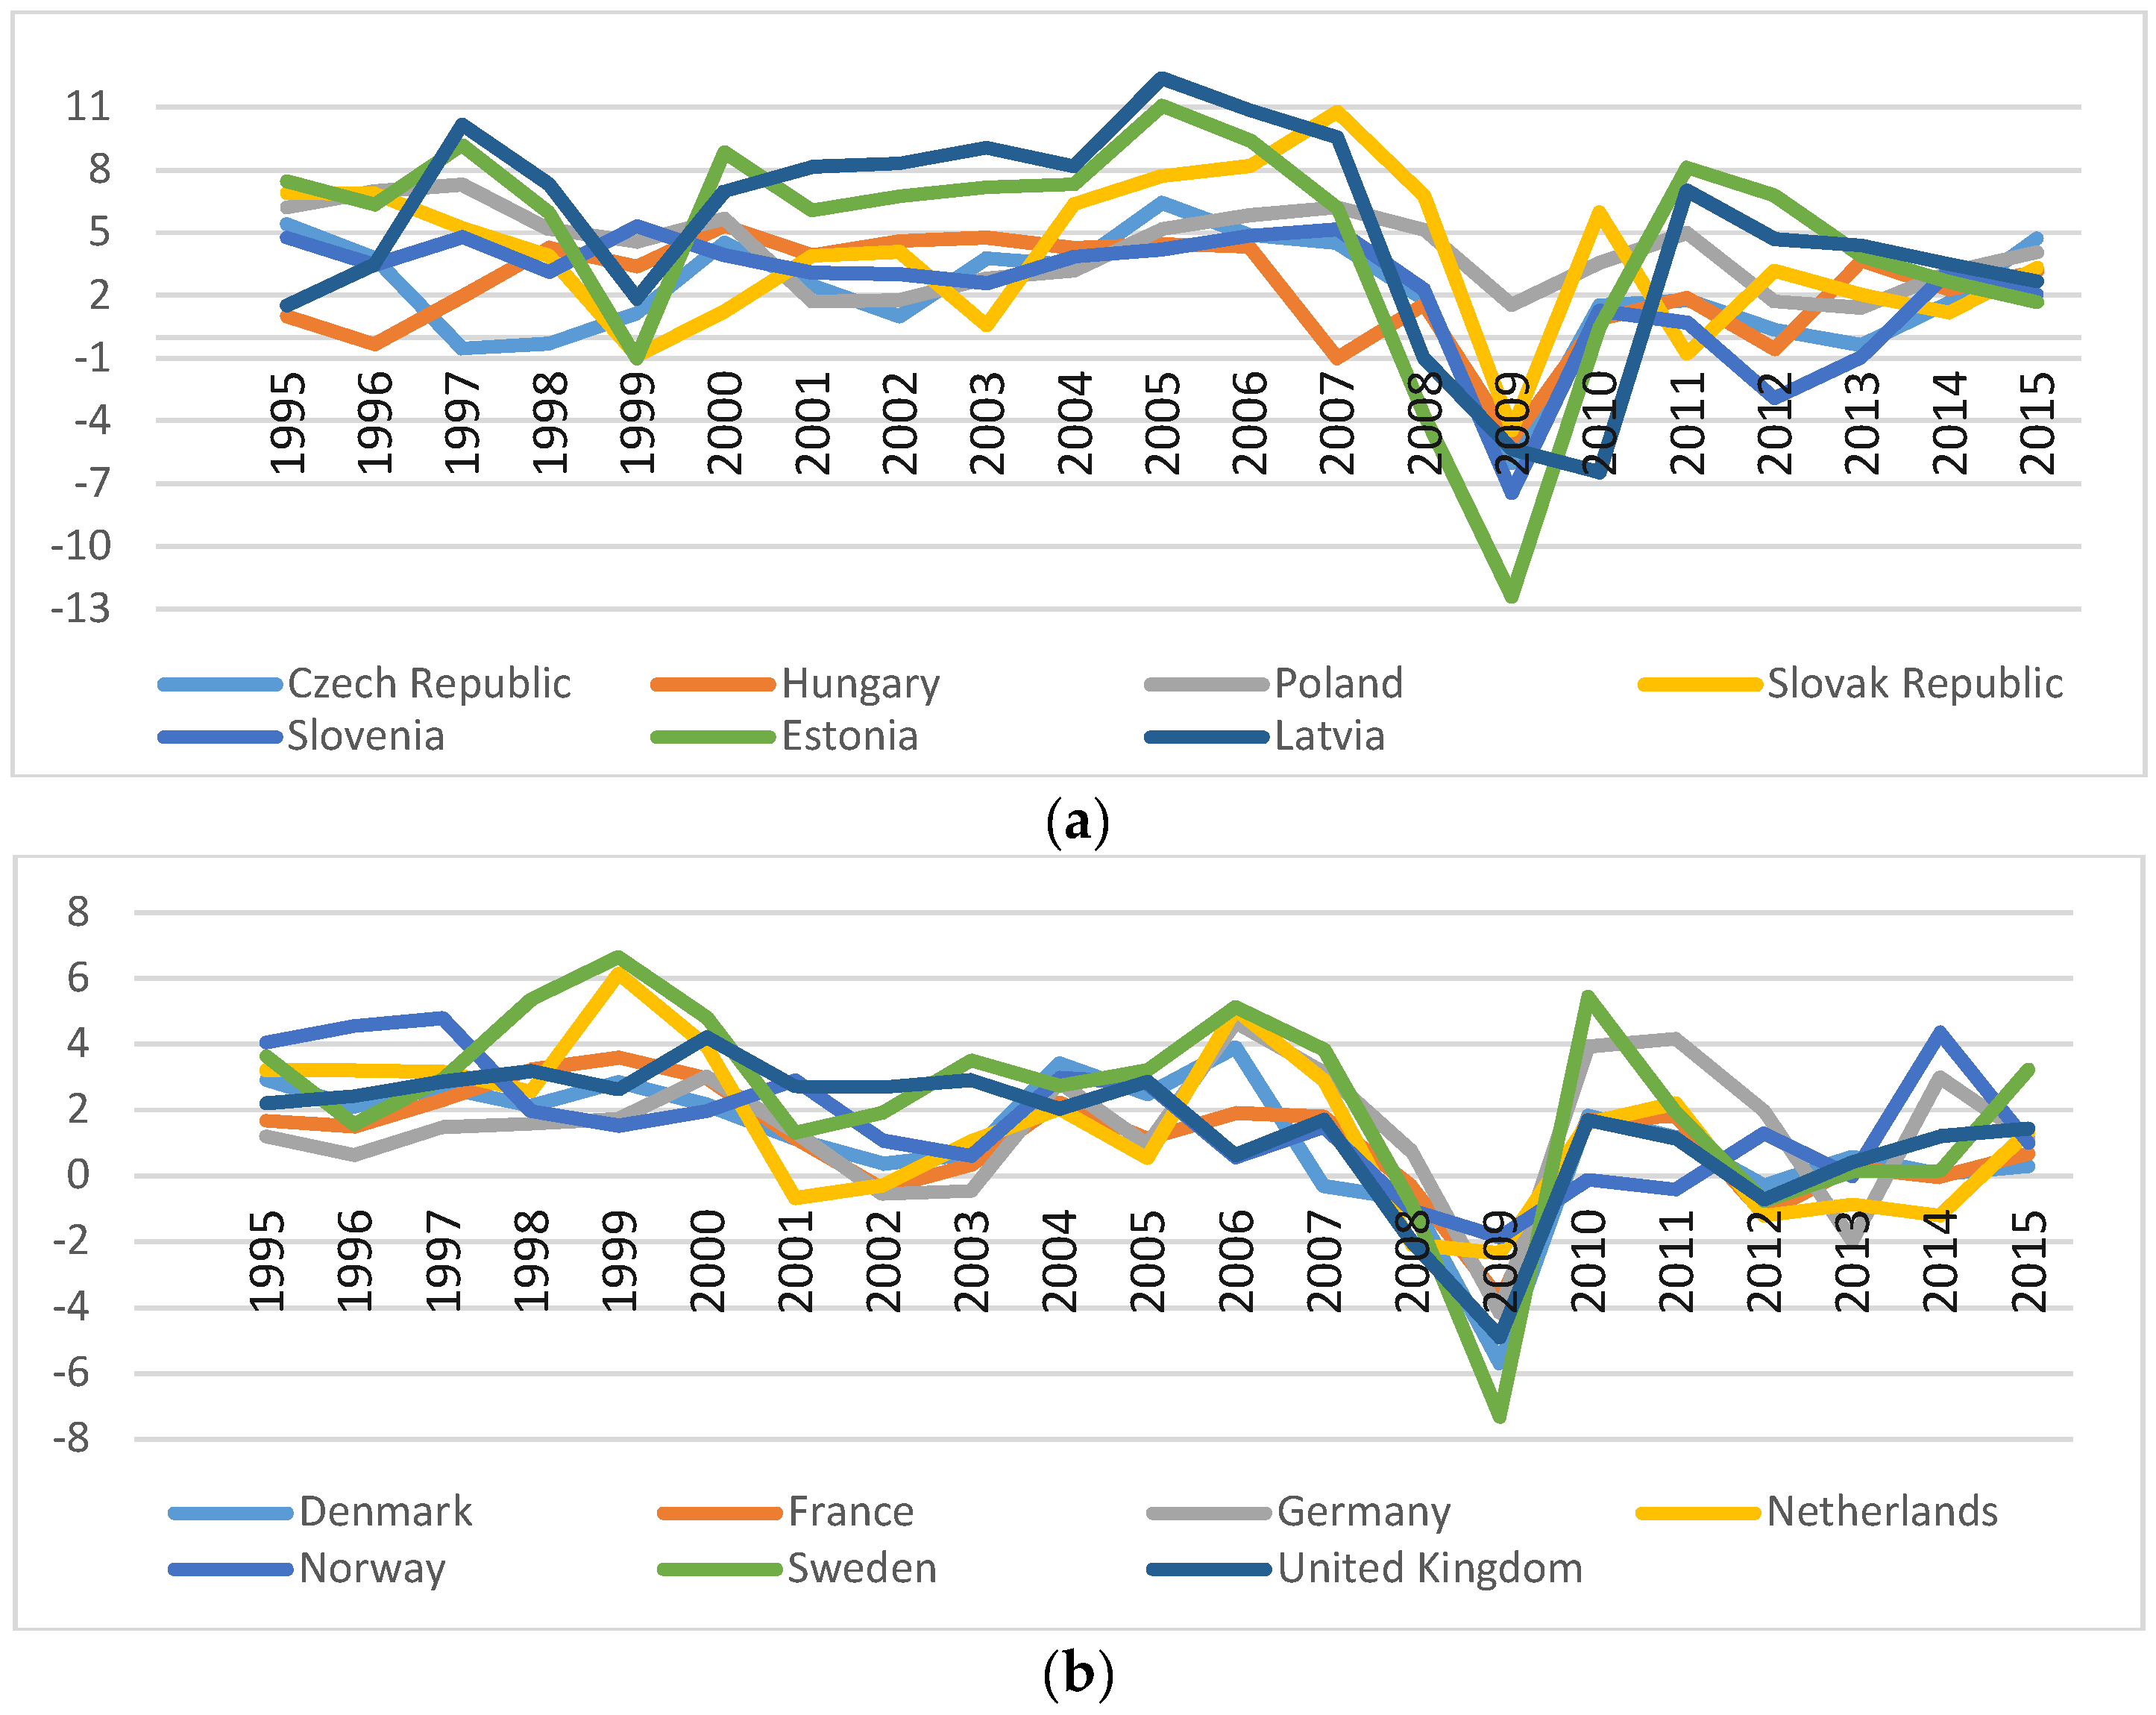
| GNI | 3.548 | 3.763 | −12.406 | 12.380 | 1.511 | 2.177 | −7.330 | 6.655 |
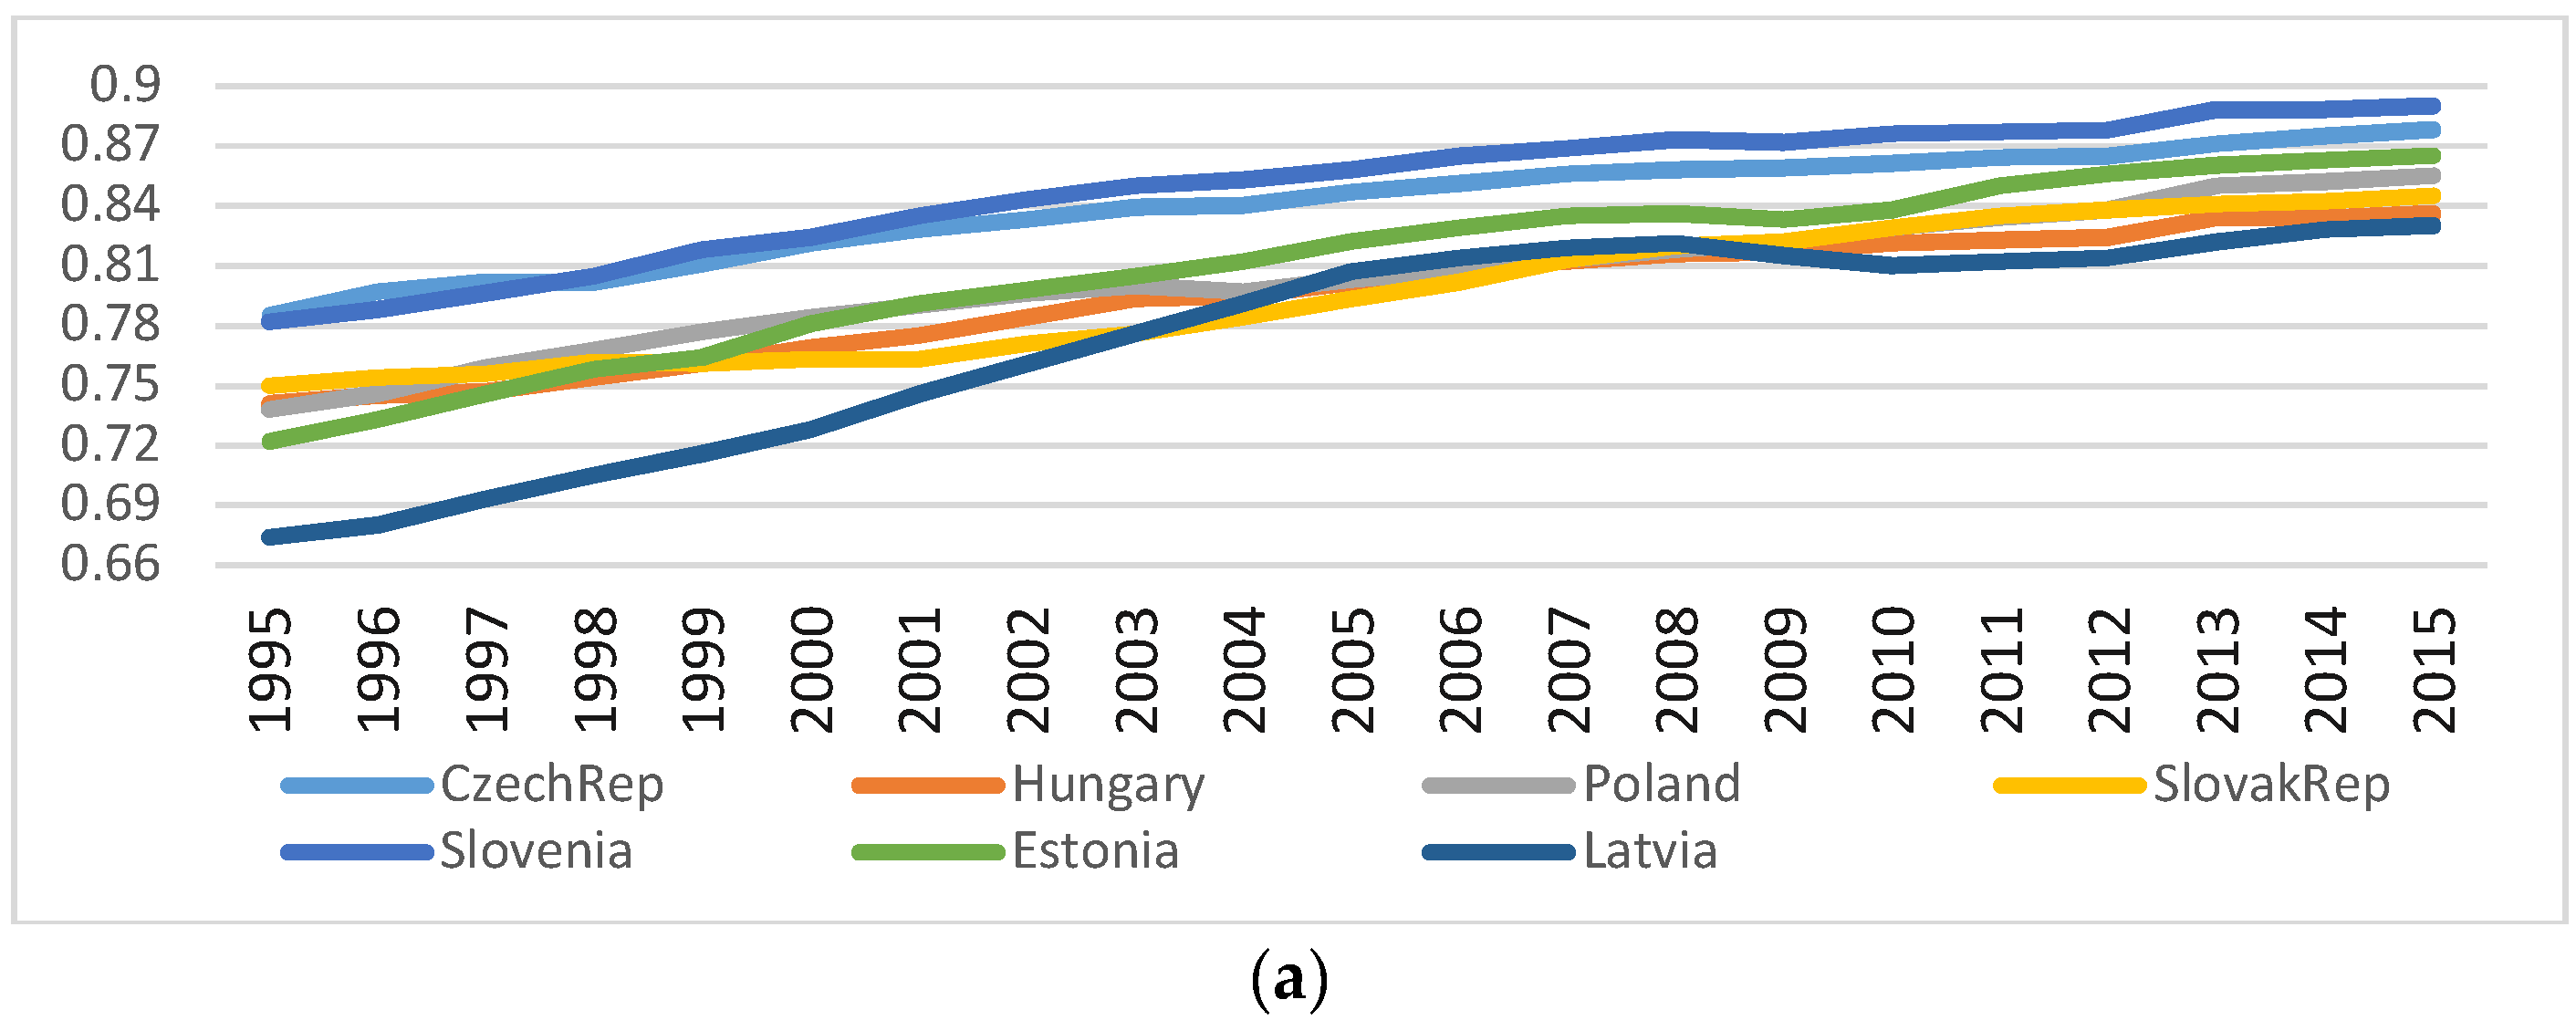
| HDI | 0.809 | 0.045 | 0.674 | 0.89 | 0.889 | 0.029 | 0.825 | 0.949 |
| Variables Considered | CEE Countries | Developed Countries | ||||
|---|---|---|---|---|---|---|
| GDP | GNI | HDI | GDP | GNI | HDI | |
| TotTax | 3.21 (0.0731) | 2.19 (0.1385) | 0.35 (0.5517) | 5.58 ** (0.0181) | 1.36 (0.2444) | 0.16 (0.6883) |
| TaxIPrCap | 0.27 (0.6049) | 1.18 (0.2766) | 0.09 (0.7682) | 3.10 (0.0781) | 0.11 (0.7423) | 0.48 (0.4901) |
| SSC | 7.87 *** (0.005) | 0.06 (0.8044) | 2.65 (0.1036) | 3.13 (0.0767) | 2.82 (0.0933) | 0.01 (0.9043) |
| TaxProp | 2.26 (0.1326) | 0.70 (0.4031) | 0.44 (0.5062) | 1.61 (0.2049) | 0.91 (0.3396) | 1.19 (0.2759) |
| TaxGS | 0.06 (0.8104) | 0.23 (0.6326) | 5.89 *** (0.0152) | 6.67 *** (0.0098) | 0.05 (0.8219) | 0.06 (0.8008) |
| Lag 1 | TotTax→GDP | TaxIPrCap→GDP | SSC→GDP | TaxProp→GDP | TaxGS→GDP | |
| CEE | Wald stat. | 0.991 | 5.134 | 1.294 | 2.178 | 1.095 |
| Z-bar | −0.213 | 5.954 *** | 0.239 | 1.554 | −0.058 | |
| Dev | Wald stat. | 1.055 | 0.968 | 0.888 | 1.278 | 1.414 |
| Z-bar | −0.117 | −0.246 | −0.365 | 0.216 | 0.418 | |
| Lag 1 | GDP→TotTax | GDP→TaxIPrCap | GDP→SSC | GDP→TaxProp | GDP→TaxGS | |
| CEE | Wald stat. | 0.596 | 2.545 | 1.158 | 3.048 | 0.912 |
| Z-bar | −0.7998 | 2.101 ** | 0.037 | 2.849 *** | −0.329 | |
| Dev | Wald stat. | 1.841 | 0.885 | 0.49 | 2.167 | 47.338 |
| Z-bar | 1.054 | −0.369 | −0.957 | 1.538 | 11.093 *** | |
| Lag 1 | TotTax→GNI | TaxIPrCap→GNI | SSC→GNI | TaxProp→GNI | TaxGS→GNI | |
| CEE | Wald stat. | 0.719 | 2.393 | 2.264 | 1.624 | 0.582 |
| Z-bar | −0.617 | 1.874 * | 1.683 * | 0.73 | −0.819 | |
| Dev | Wald stat. | 1.371 | 1.166 | 0.416 | 2.788 | 1.349 |
| Z-bar | 0.353 | 0.048 | −1.067 | 2.463 *** | 0.321 | |
| Lag 1 | GNI→TotTax | GNI→TaxIPrCap | GNI→SSC | GNI→TaxProp | GNI→TaxGS | |
| CEE | Wald stat. | 0.904 | 3.592 | 0.912 | 3.888 | 1.735 |
| Z-bar | −0.342 | 3.658 *** | −0.329 | 4.099 *** | 0.896 | |
| Dev | Wald stat. | 1.281 | 0.675 | 0.659 | 1.415 | 2.168 |
| Z-bar | 0.22 | −0.683 | −0.706 | 0.419 | 1.539 | |
| Lag 1 | TotTax→HDI | TaxIPrCap→HDI | SSC→HDI | TaxProp→HDI | TaxGS→HDI | |
| CEE | Wald stat. | 2.116 | 1.263 | 3.241 | 1.547 | 0.889 |
| Z-bar | 1.463 | 0.192 | 3.136 *** | 0.615 | −0.363 | |
| Dev | Wald stat. | 1.438 | 2.089 | 1.303 | 0.479 | 1.872 |
| Z-bar | 0.453 | 1.422 | 0.253 | −0.973 | 1.099 | |
| Lag 1 | HDI→TotTax | HDI→TaxIPrCap | HDI→SSC | HDI→TaxProp | HDI→TaxGS | |
| CEE | Wald stat. | 2.326 | 1.542 | 1.709 | 0.809 | 1.347 |
| Z-bar | 1.775 * | 0.609 | 0.856 | −0.418 | 0.318 | |
| Dev | Wald stat. | 3.652 | 1.439 | 1.643 | 2.158 | 1.321 |
| Z-bar | 3.747 *** | 0.456 | 0.758 | 1.524 | 0.279 | |
| Lag 1 | TotTax→GDP | TaxIPrCap→GDP | SSC→GDP | TaxProp→GDP | TaxGS→GDP | |
| CEE | Wald stat. | 0.991 | 5.134 | 1.294 | 2.178 | 1.095 |
| Z-bar | −0.213 | 5.954 *** | 0.239 | 1.554 | −0.058 | |
| Dev | Wald stat. | 1.055 | 0.968 | 0.888 | 1.278 | 1.414 |
| Z-bar | −0.117 | −0.246 | −0.365 | 0.216 | 0.418 | |
| Lag 1 | GDP→TotTax | GDP→TaxIPrCap | GDP→SSC | GDP→TaxProp | GDP→TaxGS | |
| CEE | Wald stat. | 0.596 | 2.545 | 1.158 | 3.048 | 0.912 |
| Z-bar | −0.7998 | 2.101 ** | 0.037 | 2.849 *** | −0.329 | |
| Dev | Wald stat. | 1.841 | 0.885 | 0.49 | 2.167 | 47.338 |
| Z-bar | 1.054 | −0.369 | −0.957 | 1.538 | 11.093 *** | |
| Lag 1 | TotTax→GNI | TaxIPrCap→GNI | SSC→GNI | TaxProp→GNI | TaxGS→GNI | |
| CEE | Wald stat. | 0.719 | 2.393 | 2.264 | 1.624 | 0.582 |
| Z-bar | −0.617 | 1.874 * | 1.683 * | 0.73 | −0.819 | |
| Dev | Wald stat. | 1.371 | 1.166 | 0.416 | 2.788 | 1.349 |
| Z-bar | 0.353 | 0.048 | −1.067 | 2.463 *** | 0.321 | |
| Lag 1 | GNI→TotTax | GNI→TaxIPrCap | GNI→SSC | GNI→TaxProp | GNI→TaxGS | |
| CEE | Wald stat. | 0.904 | 3.592 | 0.912 | 3.888 | 1.735 |
| Z-bar | −0.342 | 3.658 *** | −0.329 | 4.099 *** | 0.896 | |
| Dev | Wald stat. | 1.281 | 0.675 | 0.659 | 1.415 | 2.168 |
| Z-bar | 0.22 | −0.683 | −0.706 | 0.419 | 1.539 | |
| Lag 1 | TotTax→HDI | TaxIPrCap→HDI | SSC→HDI | TaxProp→HDI | TaxGS→HDI | |
| CEE | Wald stat. | 2.116 | 1.263 | 3.241 | 1.547 | 0.889 |
| Z-bar | 1.463 | 0.192 | 3.136 *** | 0.615 | −0.363 | |
| Dev | Wald stat. | 1.438 | 2.089 | 1.303 | 0.479 | 1.872 |
| Z-bar | 0.453 | 1.422 | 0.253 | −0.973 | 1.099 | |
| Lag 1 | HDI→TotTax | HDI→TaxIPrCap | HDI→SSC | HDI→TaxProp | HDI→TaxGS | |
| CEE | Wald stat. | 2.326 | 1.542 | 1.709 | 0.809 | 1.347 |
| Z-bar | 1.775 * | 0.609 | 0.856 | −0.418 | 0.318 | |
| Dev | Wald stat. | 3.652 | 1.439 | 1.643 | 2.158 | 1.321 |
| Z−bar | 3.747 *** | 0.456 | 0.758 | 1.524 | 0.279 | |
| Lag 6 | TotTax→GDP | TaxIPrCap→GDP | SSC→GDP | TaxProp→GDP | TaxGS→GDP | |
| CEE | Wald stat. | 1220.34 | 23200 | 377.04 | 418.406 | 732.26 |
| Z-bar | 345.28 *** | 6595.45 *** | 105.03 *** | 116.81 *** | 206.23 *** | |
| Dev | Wald stat. | 43400 | 20.939 | 7731.77 | 80.899 | 47.338 |
| Z-bar | 12,400 *** | 3.572 *** | 2200.40 *** | 20.65 *** | 11.093 *** | |
| Lag 6 | GDP→TotTax | GDP→TaxIPrCap | GDP→SSC | GDP→TaxProp | GDP→TaxGS | |
| CEE | Wald stat. | 77.37 | 2376.11 | 48.71 | 4318.09 | 252.66 |
| Z-bar | 19.65 *** | 674.56 *** | 11.485 *** | 1227.84 *** | 69.58 *** | |
| Dev | Wald stat. | 90.958 | 916.22 | 3633.32 | 4094.31 | 204.696 |
| Z-bar | 23.52 *** | 258.64 *** | 1032.75 *** | 1164.08 *** | 55.93 *** | |
| Lag 6 | TotTax→GNI | TaxIPrCap→GNI | SSC→GNI | TaxProp→GNI | TaxGS→GNI | |
| CEE | Wald stat. | 2176.87 | 2636.83 | 91.289 | 118.204 | 198.91 |
| Z-bar | 617.8 *** | 748.84 *** | 23.62 *** | 31.28 *** | 54.277 *** | |
| Dev | Wald stat. | 142.21 | 244.705 | 221.21 | 127.41 | 42.203 |
| Z-bar | 38.13 *** | 67.324 *** | 60.63 *** | 33.906 *** | 9.63 *** | |
| Lag 6 | GNI→TotTax | GNI→TaxIPrCap | GNI→SSC | GNI→TaxProp | GNI→TaxGS | |
| CEE | Wald stat. | 18100 | 1420000 | 222.95 | 743.82 | 2202.82 |
| Z−bar | 5155.99 *** | 406,000 *** | 61.13 *** | 209.52 *** | 625.19 *** | |
| Dev | Wald stat. | 284.25 | 154000 | 147.97 | 113.35 | 122.16 |
| Z-bar | 78.59 *** | 43,700 *** | 39.76 *** | 29.902 *** | 32.41 *** | |
| Lag 6 | TotTax→HDI | TaxIPrCap→HDI | SSC→HDI | TaxProp→HDI | TaxGS→HDI | |
| CEE | Wald stat. | 2.116 | 1.265 | 575.59 | 1.547 | 0.889 |
| Z-bar | 1.463 | 0.192 | 161.59 *** | 0.615 | −0.363 | |
| Dev | Wald stat. | 1.438 | 2.089 | 1.303 | 0.479 | 1.872 |
| Z-bar | 0.453 | 1.422 | 0.253 | −0.973 | 1.099 | |
| Lag 6 | HDI→TotTax | HDI→TaxIPrCap | HDI→SSC | HDI→TaxProp | HDI→TaxGS | |
| CEE | Wald stat. | 1390.83 | 658.95 | 1559.92 | 165.86 | 2505.12 |
| Z-bar | 393.86 *** | 185.34 *** | 442.03 *** | 44.86 *** | 711.32 *** | |
| Dev | Wald stat. | 1116.07 | 2655.98 | 30400 | 540.07 | 1008.57 |
| Z-bar | 315.57 *** | 754.3 *** | 8644.57 *** | 151.47 *** | 284.95 *** | |
© 2019 by the authors. Licensee MDPI, Basel, Switzerland. This article is an open access article distributed under the terms and conditions of the Creative Commons Attribution (CC BY) license (http://creativecommons.org/licenses/by/4.0/).
Share and Cite
Vatavu, S.; Lobont, O.-R.; Stefea, P.; Brindescu-Olariu, D. How Taxes Relate to Potential Welfare Gain and Appreciable Economic Growth. Sustainability 2019, 11, 4094. https://doi.org/10.3390/su11154094
Vatavu S, Lobont O-R, Stefea P, Brindescu-Olariu D. How Taxes Relate to Potential Welfare Gain and Appreciable Economic Growth. Sustainability. 2019; 11(15):4094. https://doi.org/10.3390/su11154094
Chicago/Turabian StyleVatavu, Sorana, Oana-Ramona Lobont, Petru Stefea, and Daniel Brindescu-Olariu. 2019. "How Taxes Relate to Potential Welfare Gain and Appreciable Economic Growth" Sustainability 11, no. 15: 4094. https://doi.org/10.3390/su11154094
APA StyleVatavu, S., Lobont, O.-R., Stefea, P., & Brindescu-Olariu, D. (2019). How Taxes Relate to Potential Welfare Gain and Appreciable Economic Growth. Sustainability, 11(15), 4094. https://doi.org/10.3390/su11154094