1. Introduction
With the continuous expansion of the national economy, China’s total energy consumption is increasing. The total energy consumption has increased from 600 million tons of standard coal in 1978 to 4.64 billion tons in 2018 [
1]. This represents a seven-fold increase in 40 years. Since 2010, China has surpassed the United States as the world’s top energy consumer [
2]. Although China’s gross domestic product (GDP) only accounts for one-sixth of the global GDP, its annual energy consumption accounts for 23% of the global energy consumption, and its carbon emissions are close to 30% of the global total carbon emissions [
3]. As China is still in a period of rapid economic development and per capita energy consumption is still low compared with developed countries, China’s energy consumption demand is expected to continue to grow [
4].
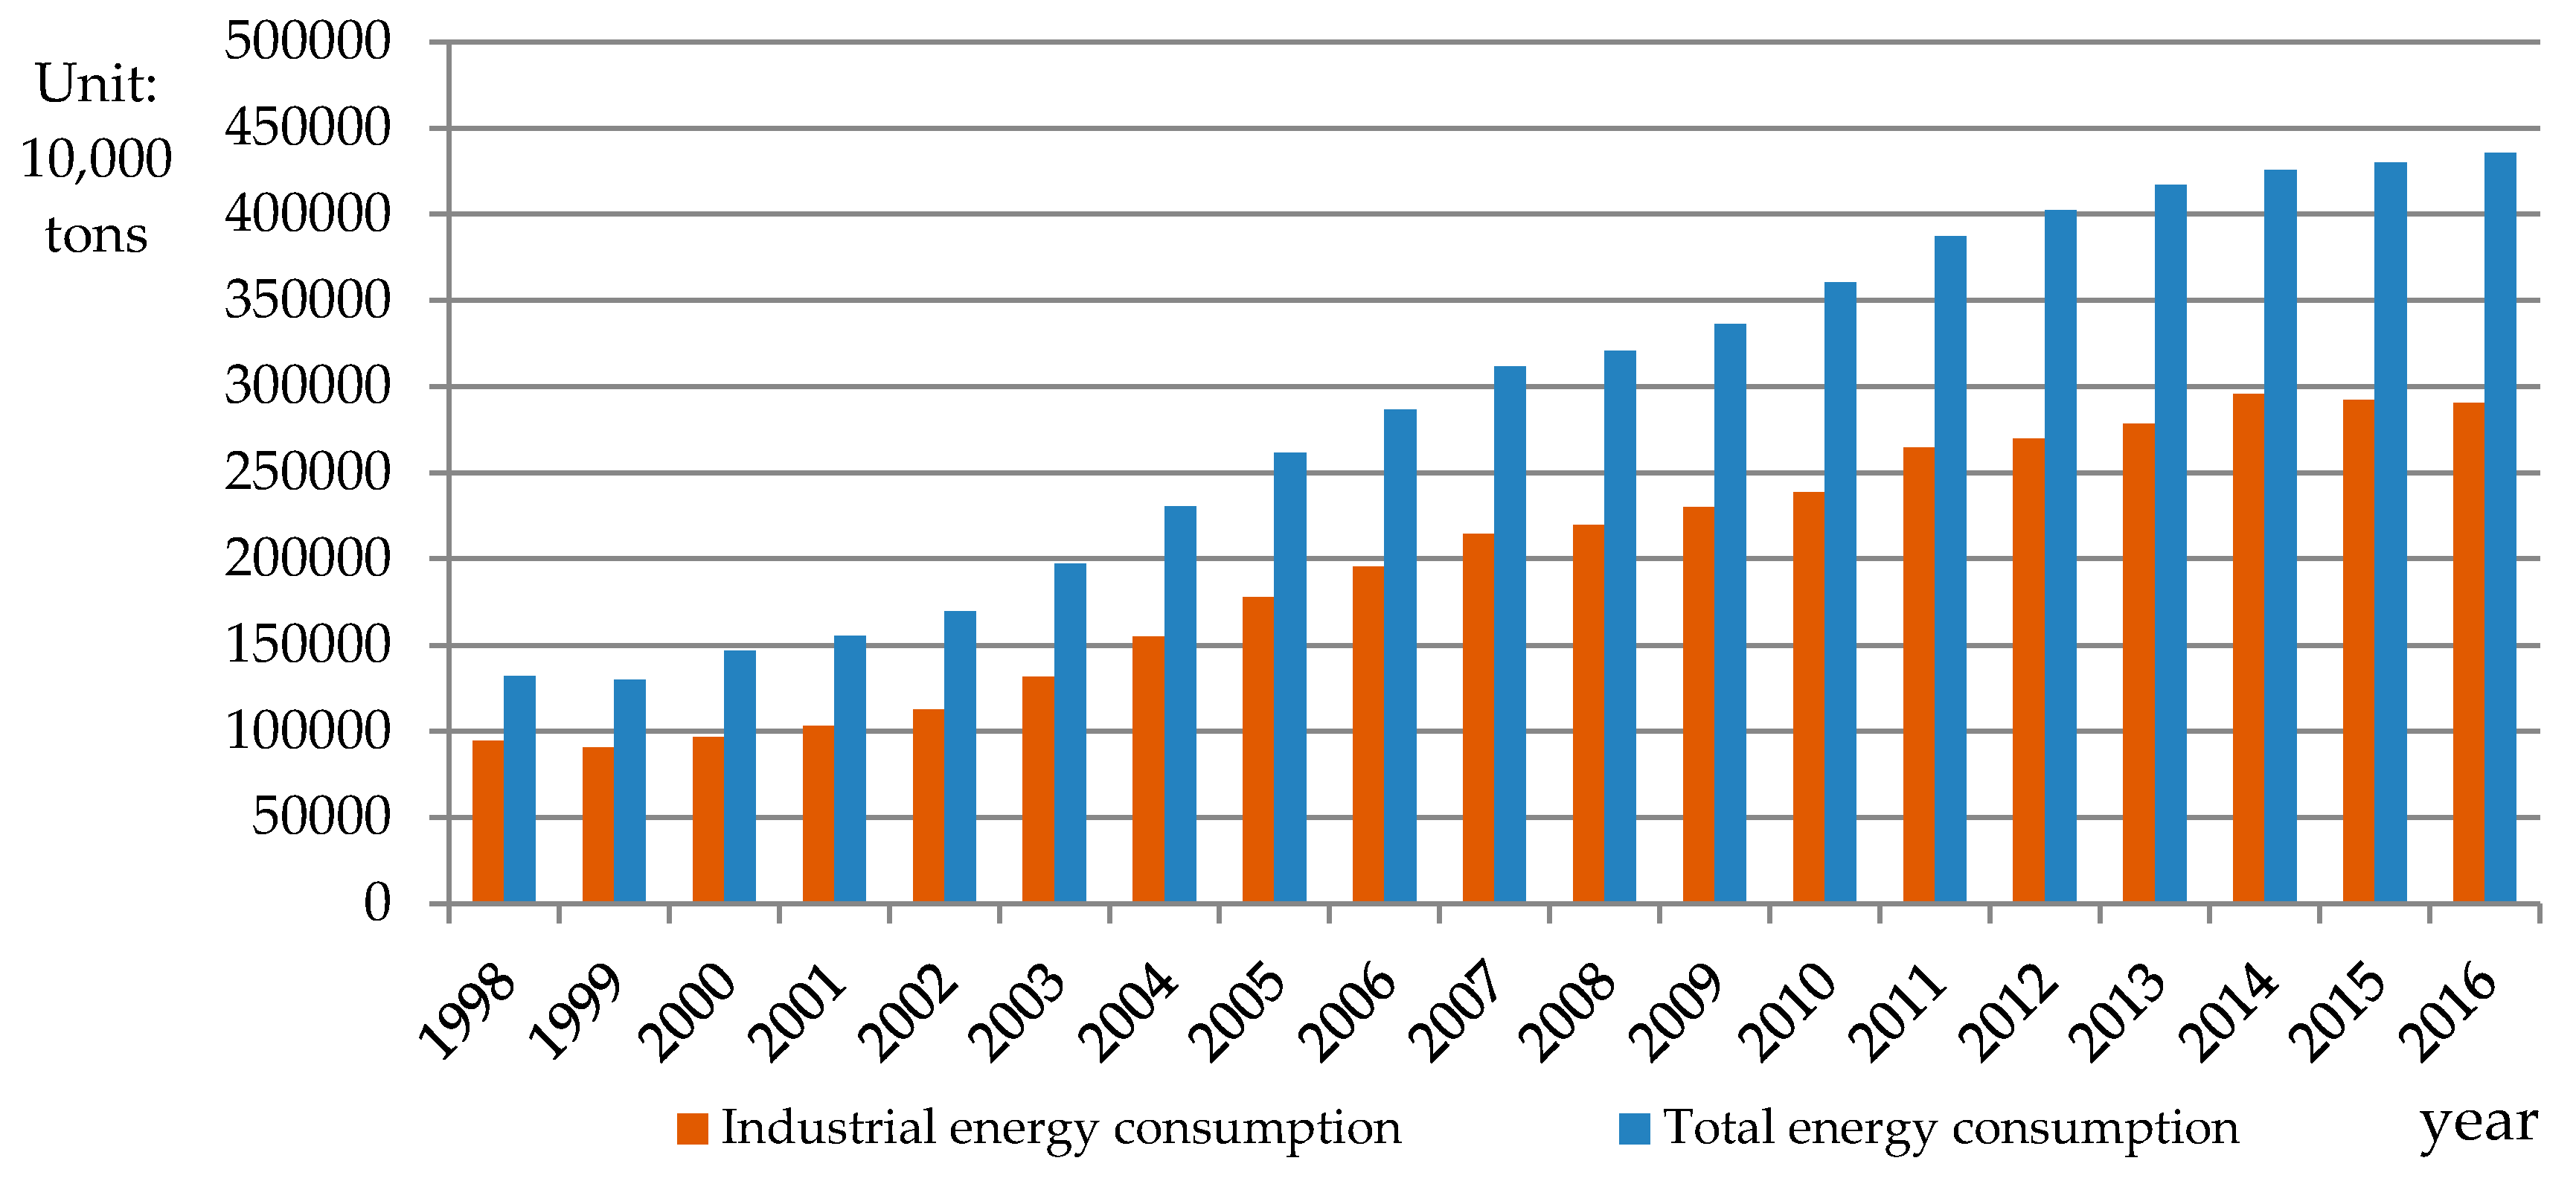
Figure 1 shows that since the beginning of the 21st century, China’s total energy consumption has continued to rise, and this growth trend will continue for a significant period of time. Likewise, it can be seen from
Figure 2 that the growth of industrial GDP was accompanied by an increase of industrial energy consumption. However, less energy is needed to increase industrial GDP according to the
Figure 2. For example, in 2014, the industrial GDP was 233,856 million yuan, and its industrial energy consumption was 2956.86 million tons. However, in 2016, the industrial GDP was 247,860 million yuan, and its industrial energy consumption was just 2902.55 million tons, which was lower than that of 2014 (data from National Bureau of Statistics of China).
The continuous expansion of energy consumption has produced serious energy concerns about the sustainability of China’s development [
5]. People are increasingly concerned about energy issues. Solutions for energy issues include upgrading the level of science and technology, improving the industrial structure, and developing new energy sources [
6]. Whether from the perspective of energy saving and consumption reduction or industrial upgrading, industry—whose energy consumption accounts for more than 65% of the total national energy consumption in China—is bound to have greater responsibilities in energy issues in the future.
Industry is the main body of technological innovation and research and development activities in the national innovation system. High-tech industry, with its characteristic “energy savings and lower emissions” [
7], has an especially crucial role in the process of enhancing China’s independent innovation capacity [
7,
8]. Generally speaking, technological progress of enterprises is driven by two kinds of factors. One is to promote technological progress through the R&D investment of enterprises; the other is based on the technological spillover in import trade. Research has found that R&D has a significant role in promoting technological progress; especially for developing countries such as China, the increase of research and development investment can significantly promote the technological progress of enterprises [
9]. As a modern technology integrating environmental thoughts, green technology can be regarded as a technology with higher standards developed on the basis of traditional technological innovation. In terms of the demand for innovative elements, it is similar to traditional technological innovation to a large extent. However, it is difficult for green technology innovation to form spontaneously, and external incentives are needed. Empirical research found that R&D capital, as an important key of China’s technological innovation, has a significant positive effect on China’s green technological innovation [
10]. Moreover, green technology innovation has obvious effects on the improvement of environmental performance, such as reducing the generation of pollutants and carbon emissions and increasing energy efficiency. For the high-tech industries, their research and development (R&D) activities are a major source of knowledge and technological innovation, acting as the driving force for reducing energy consumption and environmental pollution [
11,
12]. In 2017, Guangdong province, Jiangsu province, and Shandong province were the top three Chinese provinces in terms of the amount of R&D input, accounting for 13.3%, 12.8%, and 10% of the total national R&D input, respectively [
13]. The intensity of R&D input is lower in the central and western regions, and a significant gap exists in these areas in R&D investment compared with developed eastern regions [
14]. Insufficient R&D investment complicates the further development of enterprises by means of attracting high-level talent, introducing advanced technologies and equipment, and enhancing innovation ability [
15]. In this case, enterprises may fall into a traditional extensive production mode, relying on economic resources and energy input. As a result, enterprises cannot effectively achieve market competitiveness and will increase the energy consumption burden on society as a whole [
16,
17].
Many research papers have been published on R&D investment and energy consumption, which provided a good theoretical basis and experience for the research in this study. By perusing the existing literature, we found that research into R&D investment has mainly focused on innovation performance, economic growth, and environmental issues. Wang described how high-tech industrial R&D spending has a strong positive effect on GDP per capita [
18]. Some scholars have found that an increase in enterprise R&D investment has a significant positive impact on the technological innovation efficiency of enterprises [
19,
20,
21]. Strandholm et al. concluded that the intensity of environmental regulation promotes the improvement of industrial R&D innovation efficiency to some extent, but the relationship between the intensity of environmental regulation and R&D innovation efficiency presents an inverted U shape [
22]. The research regarding energy consumption mainly includes issues of energy consumption in various industries; the relationship between energy consumption, carbon emissions and economic growth; and studies on energy consumption and energy efficiency. Some scholars have focused on the issues of energy consumption in various industries [
23,
24]. Some researchers were interested in the relationship between energy consumption and economic growth from the perspective of carbon emissions [
25,
26]. Moreover, many researchers have studied the impact of energy efficiency on energy consumption [
27,
28,
29]. For instance, Brännlund examined how exogenous technological progress, in terms of an increase in energy efficiency, affects consumption choice by Swedish households, and thereby emissions of carbon dioxide (CO
2), sulphur dioxide (SO
2), and nitrogen oxide (NO
x) [
27]. In order to compare the studies on R&D and energy consumption distinctly, we established a table with comparative analysis of the above literatures as follows in
Table 1.
The literature review showed that the research on the relationship between R&D investment and energy consumption can be further enriched. Traditional views hold that R&D investment can promote green technology innovation and reduce energy consumption [
30]. However, a few scholars think that although improvement in the R&D level can restrain environmental pollution to a certain extent, it also stimulates energy consumption to some extent [
17]. Regarding these researches on the nexus between R&D investment and energy consumption, they did not discuss the classification of a specific industry and consider spatial heterogeneity simultaneously to explore the relationship between R&D investment and energy consumption. What is more? These studies on the association between R&D investment and energy consumption are based on the process of a certain period of time but not from each time node. We still need to study the time-varying relationship between different types of industrial R&D investment and energy consumption, especially in different regions of China. Due to China’s vast territory, there are some differences of economic size and structure in various regions. According to the latest regional division, we divided China into central, eastern, and western regions for comparison in the following study. Then, we focused on the impact of the high-tech industrial R&D investment on energy consumption. We aimed to further discuss the different impacts of energy consumption in a variety of high-tech industries and the differences in different regions. Thus, considering the different types of high-tech industries and the gaps in economic levels and development policies between different regions, we analyzed the time-varying impacts of five types of high-tech industries’ R&D investment on energy consumption in the east, central, west, and northeast of China from 1998 to 2016. According to the classification of the China High-Tech Industry Yearbook, there are five major high-tech industries: The pharmaceutical industry, aerospace industry, electronics and communication equipment industry, computer and office equipment industry, and medical equipment industry.
The structure of the remaining sections is as follows:
Section 2 presents the model and variable description,
Section 3 provides the results,
Section 4 outlines the impact analysis,
Section 5 gives the discussion and the last section includes our conclusions and implications.
2. Model and Variable Description
From the above researches, we can find that there are many methods to study R&D and energy consumption such as quantile regression [
18], structural equation model [
19], game model [
22], or panel vector autoregressive model [
26]. In this study, the state space model is used for two reasons. First, the above models can estimate parameters generally at some stage but not accurately estimate the parameters at each time node, but the state space model can estimate the parameters at each time node which presented a dynamic process. Second, the model estimates the parameters by Kalman filtering, which can handle multidimensional and non-stationary random processes. Most traditional regression estimates are based on OLS (Ordinary Least Squares) or MLE (Maximum Likelihood Estimation), which requires the sequence to be stationary. Based on the above factors, to more clearly compare, distinguish, and describe the influence of the R&D investment of various high-tech industries on energy consumption in terms of spatiotemporal changes, we used the state space model with variable parameters by the software Eviews.
2.1. State Space Model
The state space model with time-varying parameters was used as the measurement method in this study; it has been widely used by Harvey [
31] in the field of econometrics. Compared with the general model, the state space model includes unobservable time variables and can be used to analyze impacts of high-tech industries’ R&D investments on energy consumption from the perspective of temporal variation. The state space model includes two equations: The signal equation that describes the quantitative relationship between variables, and the state equation that describes the change in the coefficient of the variable with temporal variation.
Let
Yt be a
k × 1 dimensional observable vector containing
k economic variables.
Zt represents the
k ×
m matrix, and the following equation can be obtained:
where
t is time,
is the
m × 1 dimension state vector,
is the
k × 1 dimensional intercept term matrix,
is the
k ×
n dimension control variable,
β represents the
n × 1 dimension control variable coefficient, and
represents the
k × 1 stochastic disturbance term. Equation (1) is the signal equation. Since
is unobservable normally, it can be expressed by a first-order Markov process:
where,
represents the
m ×
m dimension state matrix,
is the
m × 1 intercept term,
is the
m ×
g matrices, and
is the
g × 1 dimension stochastic disturbance. Equation (2) is the state equation.
In the state space model, it is generally assumed that
is independent of
, and their distributions are as follows:
where
N means that
and
are normally distributed, and
and
are stochastic disturbance terms.
Under the above assumptions, we used a Kalman filter (KF) to calculate the likelihood function given the estimated parameters and the initial value of variance, which can be used to estimate the parameters and state sequences in the models in Equations (1) and (2). Then, the coefficient vector can be obtained. The specific calculation method of parameter value estimation by the KF is as follows.
We supposed that
is the average value of the state vector and
represents the m×m dimension covariance matrix of the error caused by the estimation. When
and
are constant, the mean value of the conditional distribution of
is:
where
t = 1, 2...,
T. Equation (4) is called the predictive equation. On the basis of the new predicted value, its modified value can also be obtained, and the updated equations are as follows:
Equations (4) to (8) jointly constitute the Kalman filter expressions.
According to the above definitions, the state space model is as follows:
where
EC represents energy consumption;
ht represents the R&D input of different high-tech industries;
ht1 to
ht5 represent the pharmaceutical industry, aerospace industry, electronics and communication equipment industry, computer and office equipment industry, and medical equipment industry, respectively;
SV corresponds to the
t × 1 coefficient vector matrix of the above high-tech industries;
X is the control variable; and
C is a constant term. The variance of the random disturbance (
μit) is
δ2;
i =1,2,3,4, representing the east, central, west, and northeast regions respectively, and
t is the time span interval.
As mentioned above,
SV is unobservable. We assumed that the state vector
SV is equal to the lagged one-period term based on Harvey’s method [
31], so that the state vector sequence has a continuous dependence and solves the problem of estimation error caused by having a small number of samples. The first-order Markov Process of
SV is:
where
SV are the parameters to be estimated and Equation (10) is the state equation.
2.2. Variable Description
In this study, the R&D input of high-tech industries is expressed by the R&D internal appropriation expenditure of each high-tech industry, which is defined as the explanatory variable (ht). The explained variable (EC) is energy consumption. Considering the different economic scale in each region, it is not accurate to simply use regional energy consumption as the explained variable. Therefore, we use the energy consumption per unit of GDP in the whole of society to represent energy consumption. To facilitate its calculation, different types of energy consumption are converted to standard coal (unit: 10,000 tons standard coal). Since the explained variable (EC) is a negative indicator, we processed it in reverse before estimation. The control variables selected for the model are as follows. The data were obtained from the China Tertiary Industry Statistical Yearbook, China Foreign Trade and Economic Cooperation Statistical Yearbook, China Statistical Yearbook, and China Population & Employment Statistical Yearbook.
2.2.1. Industrial Structure (struct)
Different industries have different resource use efficiencies and management efficiencies. High-efficiency resource use directly leads to a decrease in energy consumption [
32]. The tertiary industry is mostly low-energy industry, and its energy consumption is lower than the secondary industry. The optimization and upgrading of the industrial structure (from secondary industry to tertiary industry) will change the structure of energy demand, which is the major driver for lowering energy consumption [
33]. Lin [
34] and Hong’s [
35] research showed that optimization and upgrading of the industrial structure significantly reduce energy consumption. To consider the impact of the industrial structure on energy consumption, we chose the proportion of tertiary industry in the GDP as a variable (
struct) to reflect the industrial structure.
2.2.2. Openness (open)
Factors of openness have a dual impact. Openness helps to introduce advanced production technology and management concepts, thus promoting energy conservation and emission reduction [
36]. Studies have shown that that an increasing level of openness in less developed regions leads to a growing number of energy-intensive and polluting enterprises [
37,
38]. According to the “Pollution Haven” hypothesis [
39], China’s environmental regulations are less stringent than those of developed countries [
40]. With the gradual increase in the degree of openness, many industries that consume high amounts of energy and produce large amounts of pollution may flood into China, which would result in an increase in energy consumption [
41]. In our research, the proportion of the actual amount of foreign direct investment (FDI) in the GDP of each year was used to represent the openness level. The value of FDI was converted into RMB according to the Yuan-US dollar exchange rate for each year from 1998 to 2016.
2.2.3. Economic Level (pgrp)
The impacts of economic growth on energy consumption can be summarized into the following three aspects: First, economic growth will drive the rapid development of industry, construction and transportation, which will promote the increased energy of production. Second, economic growth has improved people’s living standards and increased people’s consumption of energy. Third, economic growth will bring technological progress, then the improvement of technological level will promote energy efficiency [
42]. To a certain extent, this can reduce the waste of energy, so that the consumption of energy can be reduced relatively. Many studies showed that there is a close relationship between economic growth and energy consumption [
43,
44]. For example, Apergis’ results revealed the presence of unidirectional causality from energy consumption to economic growth in the short-term, and bidirectional causality between energy consumption and economic growth in the long-term [
43]. To consider the impact of economic level factors on energy consumption, we measured the regional economic level by GDP per capita, which was adjusted based on the GDP per capita in 1998.
2.2.4. Population Density (popden)
Population is the traditional factor that affects energy consumption [
45]. Larger population scale will inevitably increase energy consumption. Entering the post-industrial stage, population becomes an important factor affecting energy consumption [
46]. There are many variables that can represent population, such as total population, population density, population growth rate, and so on. The population growth rate reflects the growth of the population, not exactly the size of the population. At the same time, considering the geographical area difference between regions, this study showed the influence of population factors through population density. To a large extent, the population density can affect natural resources and the ecological environment in a region [
47]. Therefore, we chose the population density factor as the control variable, which is represented by the number of permanent residents per square kilometer. This variable reflects the impact of population density in various regions on energy consumption.
2.2.5. Human Capital (humcap)
The variable human capital mainly refers to the educational level [
48]. In this study, the average years of schooling of the national population over 6 years old was used to measure human capital investment (
humcap). The educational level of residents was divided into six categories: Illiterate, primary school, junior high school, high school, junior college and undergraduate, and graduate students. The average length of education was defined as 0 years, 6 years, 9 years, 12 years, 16 years, and 19 years, respectively. The calculation formula of the average years of education of residents is as follows:
In Equation (11), primary, junior, senior, college, and postgra represent the proportion of residents with the different educational levels of primary school, junior high school, senior high school, junior college, and undergraduate and graduate students who are over 6 years old, respectively.
3. Results
We selected the data from 30 provinces (cities) in mainland China (except Xizang due to data missing) from 1998 to 2016. Due to the long-time span, there may be unit roots, and the Levin-Lin-Chu (LLC) test was used to test the unit root of each variable. The results of the unit root test are shown in
Table 2.
Table 2 shows that all variables are second-order single integral sequences at the 5% significance level, and the null hypothesis of the existence of unit root is rejected. Therefore, all the variables are second-order stationary sequences. To avoid pseudo regression in the estimation process, we adopted the panel co-integration test proposed by Westerlund [
49]. From the
Table 3, the Gt and Ga statistics test the null hypothesis of no co-integration for all cross-sectional units, with rejection implying co-integration for at least one unit, while the Pt and Pa statistics test the null hypothesis of no co-integration for all cross-sectional units, with rejection implying co-integration for the panel as a whole. The test results are significant, so we think that there is a long-term equilibrium relationship between the variables.
On the basis of the above unit root test and the panel co-integration test, we used the time-varying parameter state space model to analyze the influence of high-tech industrial R&D input on energy consumption during 1998–2016 in the east, middle, west, and northeast of China. The estimated results are as follows.
According to the estimation results of the control variables and state vectors in
Table 4, firstly, the coefficients of industrial structure (
struct) are positive and significant at the level of 5% in the east, the middle, and the west regions. The results show that the increased proportion of tertiary industry was conducive to the reduction in energy consumption in the east, middle, and west regions. In contrast, in the northeast of China, the value of industrial structure (
struct) was negative, which indicates that the increased proportion of tertiary industry did not reduce energy consumption. The northeast considerably relies on its industrial economy. The decline in the proportion of secondary industry reduced the social economic benefits, so the increased proportion of tertiary industry may lead to an increase in energy consumption.
Secondly, the coefficient of openness (open) was positive in the eastern and central regions, while it was negative in the western and northeastern regions. According to the Pollution Haven hypothesis, the economic level of the eastern and central regions is higher than that in western and northeastern regions. The eastern region is rich in labor, financial, material, and technological resources and mainly develops high-tech industries with low pollution and low energy consumption. As a result, with the improvement in the degree of openness, energy consumption will decrease in the eastern regions, while many energy-intensive enterprises flood into the western and northeastern regions, which increases the energy consumption in the west and northeast region. Similarly, economic level (pgrp) has a negative effect on energy consumption. From the results, only the coefficient in the western region was significantly negative, while the values of the coefficient were positive in the other regions. The entry of high pollution and high energy consumption industries into the western regions has not only raised the economic level, but also increased the energy consumption.
Thirdly, regarding population density (
popden) and human capital (
humcap), according to the results, population density (
popden) has had a negative impact on the reduction of energy consumption in all regions. Based on common sense, it is easy to understand that an increase in population density would impose a burden on energy consumption, whereas an increase in education level would reduce social energy consumption. However,
Table 4 shows that the coefficient of human capital (
humcap) is significantly negative in the western region, which indicates that the energy consumption decreases with the accumulation of human capital. The explanation we provide for this finding is that the overall level of education is lower in the west, and the educational structure is still dominated by the primary and secondary schools educational level. The shortage of highly educated talent and the insufficient development of the western regions present a challenge for introducing more talent and technology, which hinders energy savings and consumption reduction in the western regions.
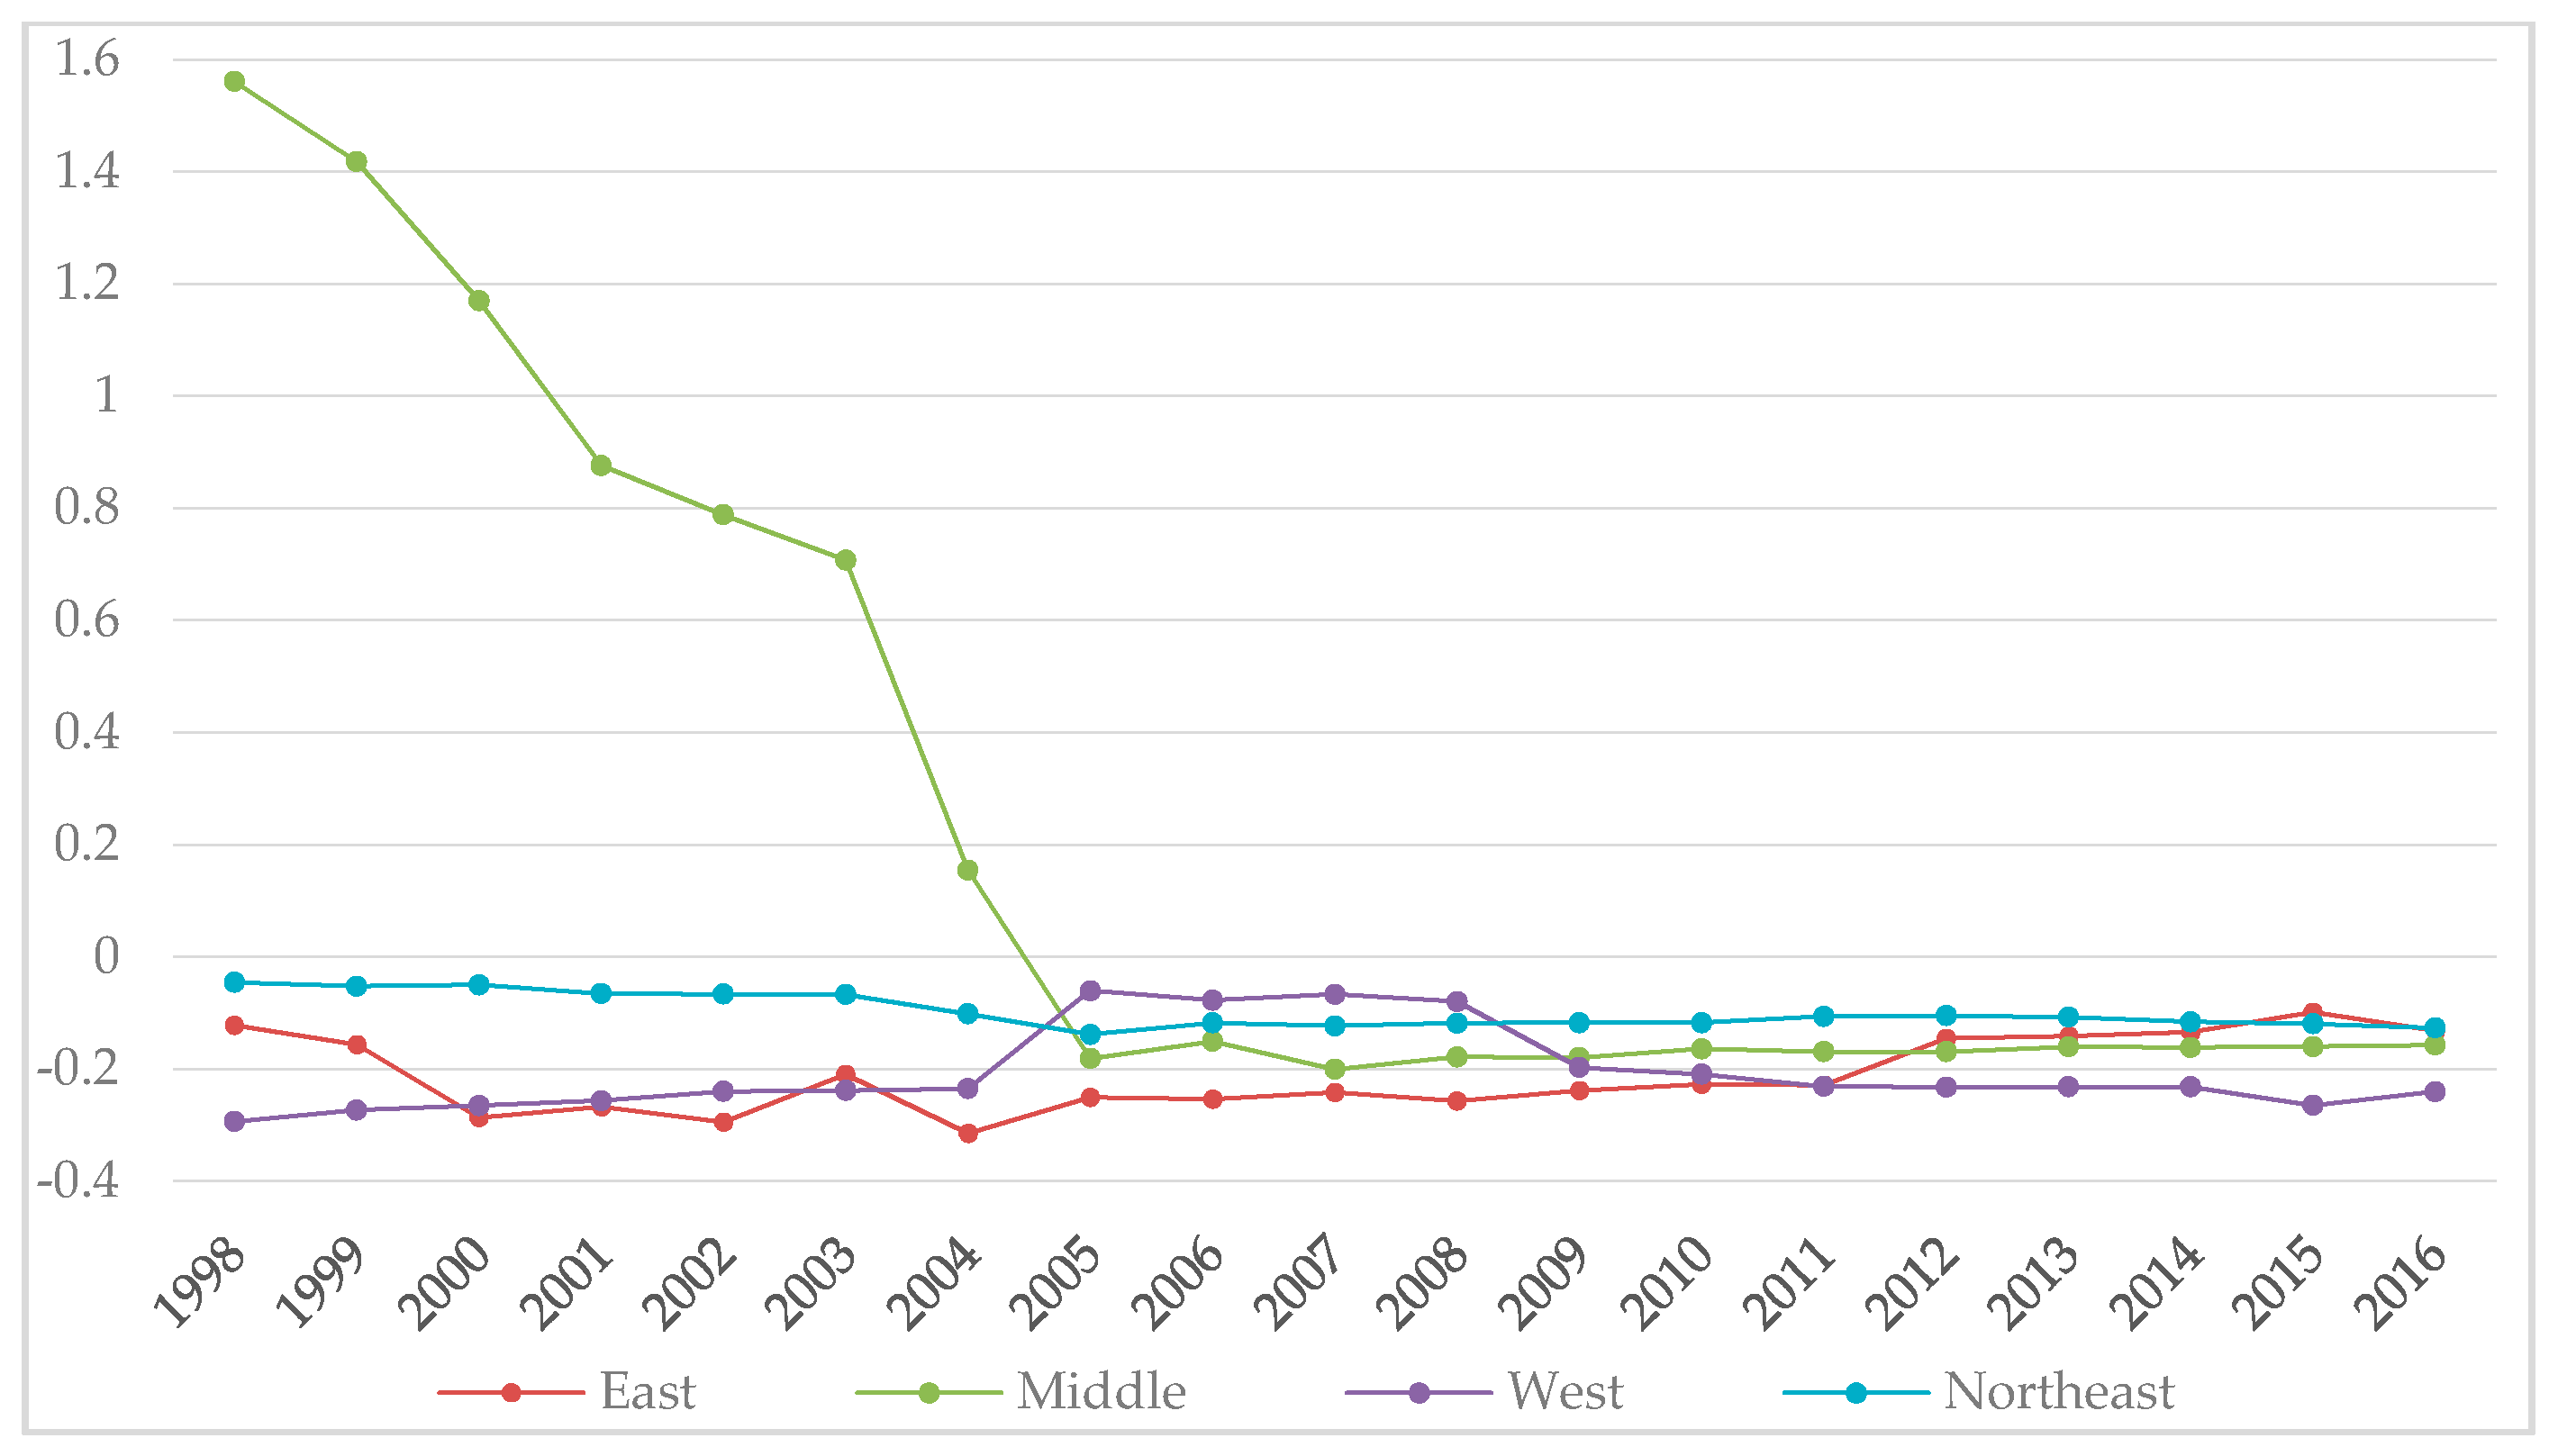
Finally, regarding state vectors, in the east, the final state SVi values of all high-tech industries were significant, in which the values of SV1, SV2, and SV4 were all negative, SV3 and SV5 were positive, and the absolute value of SV5 was the largest with a positive impact. This indicates that the impact of the medical equipment industry was stronger than that of the other high-tech industries in the east. In the middle region, except for SV4, the state values were significant. The values of SV1, SV4, and SV5 were negative, while SV2 and SV3 were positive. The absolute value of SV1 was the highest among the middle final state values, which suggests that the impact of the pharmaceutical industry was stronger than that of other high-tech industries in the middle regions, but it had a negative influence on the reduction of energy consumption. In the west, SV1, SV3, SV4, and SV5 were significant, and the values of SV3, SV4, and SV5 were negative. Like the final state in the east, the absolute value of SV1 was largest among these state vectors, with a negative effect. In the northeast, all state vectors were significant over the 5% level. The values of SV2, SV3, and SV5 were positive, and the absolute value of SV1 was still highest among all the state vectors, with a negative impact.
4. Impact Analysis
4.1. Impacts of Sectors for Each Region
4.1.1. Impacts of High-Tech Industrial R&D Input on Energy Consumption in the East
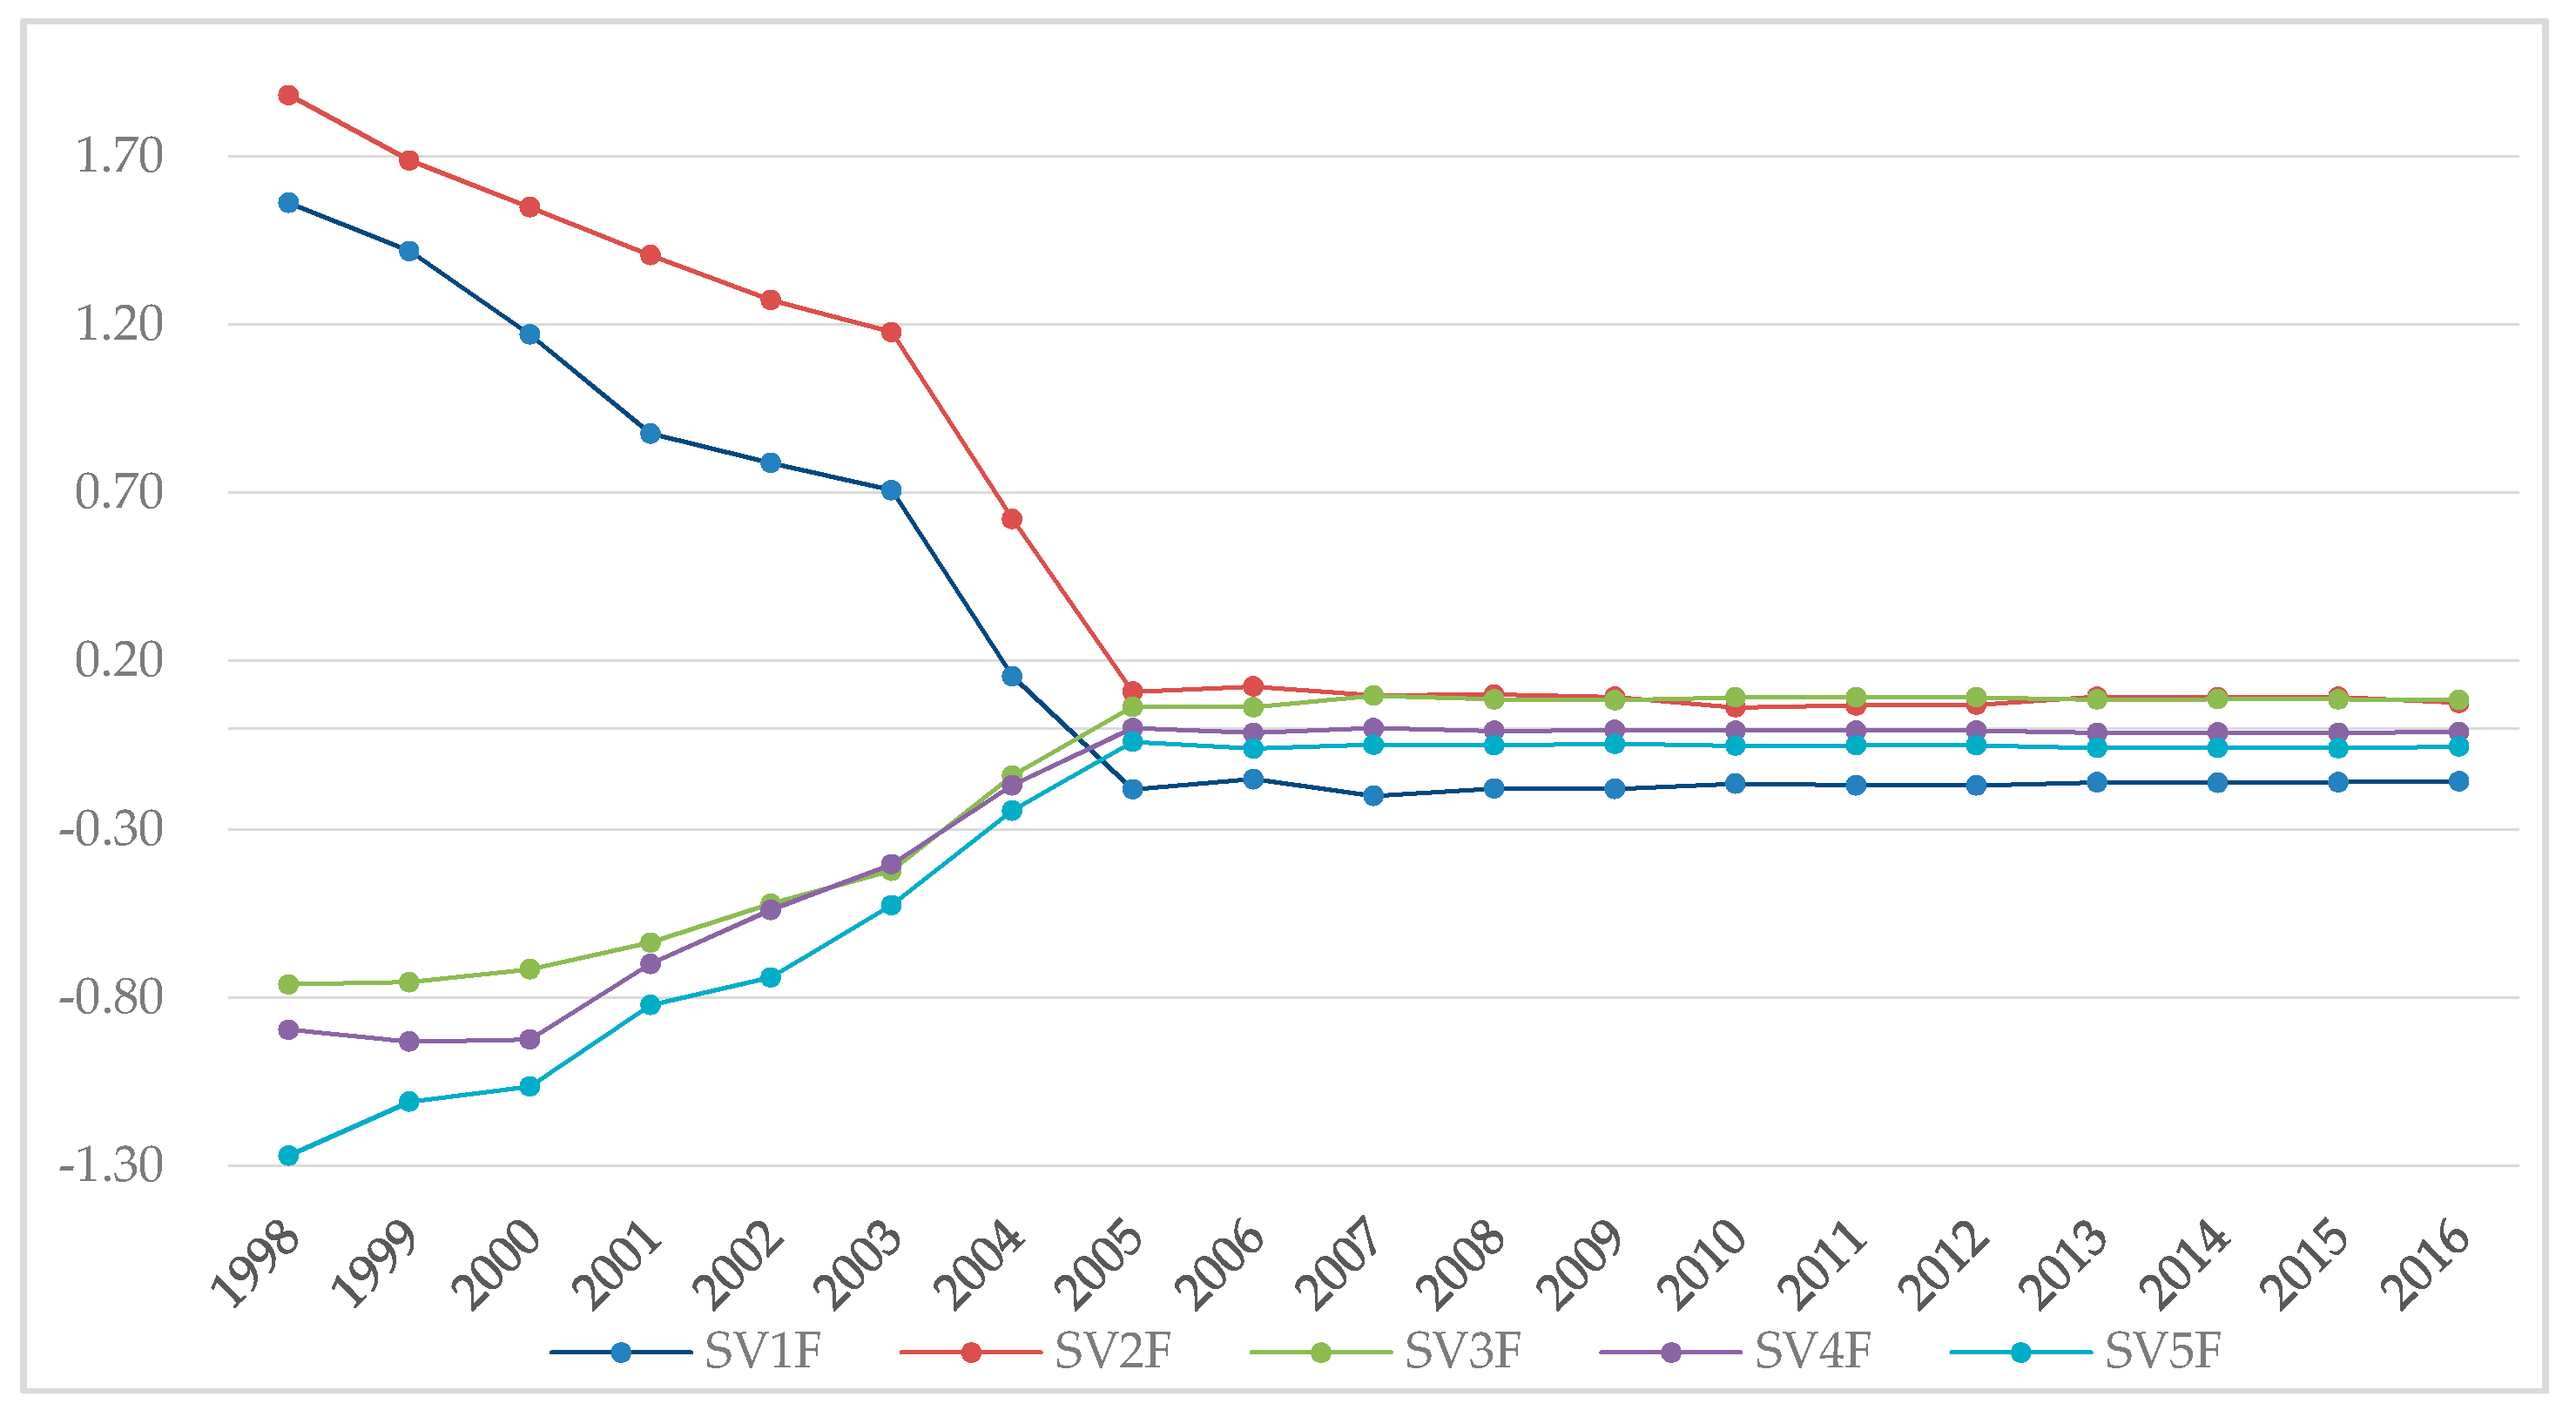
According to the temporal trend in the influence of the five types of high-tech industries (see
Figure 3), different states emerged among the industries. The impacts of R&D input of the pharmaceutical industry (
SV1) and aerospace industry (
SV2) on energy consumption showed a similar trend. For the pharmaceutical industry, the influence of R&D investment decreased significantly from 2003 to 2004. The reason may be that the SARS was prevalent from 2003 to 2004. The demand for new drugs soared and various pharmaceutical manufacturing industries increased their R&D efforts, especially large pharmaceutical industries gathered in the eastern region, leading to a significant increase in energy consumption during the two years. But the impacts of the two types of industries increased slightly in 2012 and then stabilized. The trends in the electronics and communication equipment industry (
SV3) and computer and office equipment industry (
SV4) were similar from 2003 to 2011, but they showed opposite changes in 2012. The influence of R&D input of the computer and office equipment industry on energy consumption strengthened, while the influence of R&D input of the electronics and communication equipment industry weakened sharply. This is related to the continuous expansion of the electronics and communication equipment industry. The demand of the market gradually reached the saturation state, and further expansion of the industrial scale loaded the eastern region with overcapacity, which resulted in the waste of resources. Then came a sharp drop in the impact of R&D spending. For the medical equipment industry (
SV5), from 2003 to 2016, its impact on energy consumption was stable, and the overall trend was slightly downward. At present, citizens pay more attention to health, and their demand for health services is increasing, especially in the densely populated eastern region. This will promote investment in the medical equipment industry to meet people’s demand for health services, which will lead to an increase of energy consumption.
From the comparison of the influence of R&D input on the energy consumption in various high-tech industries, the values of SV1, SV2, and SV4 were negative from 2003 to 2016, and SV1 < SV4 < SV2, which indicates that an increase in R&D input in the pharmaceutical industry, aerospace industry, and computer and office equipment industry had a negative impact on energy consumption. Conversely, the values of SV3 and SV5 were positive, with SV5 > SV3, which shows that the R&D investment of the electronic and communication equipment industry and medical equipment industry promoted the reduction of energy consumption. The influence of R&D investment on energy consumption in the medical equipment industry was significantly stronger than in the other high-tech industries.
4.1.2. Impacts of High-Tech Industrial R&D Input on Energy Consumption in the Central Regions
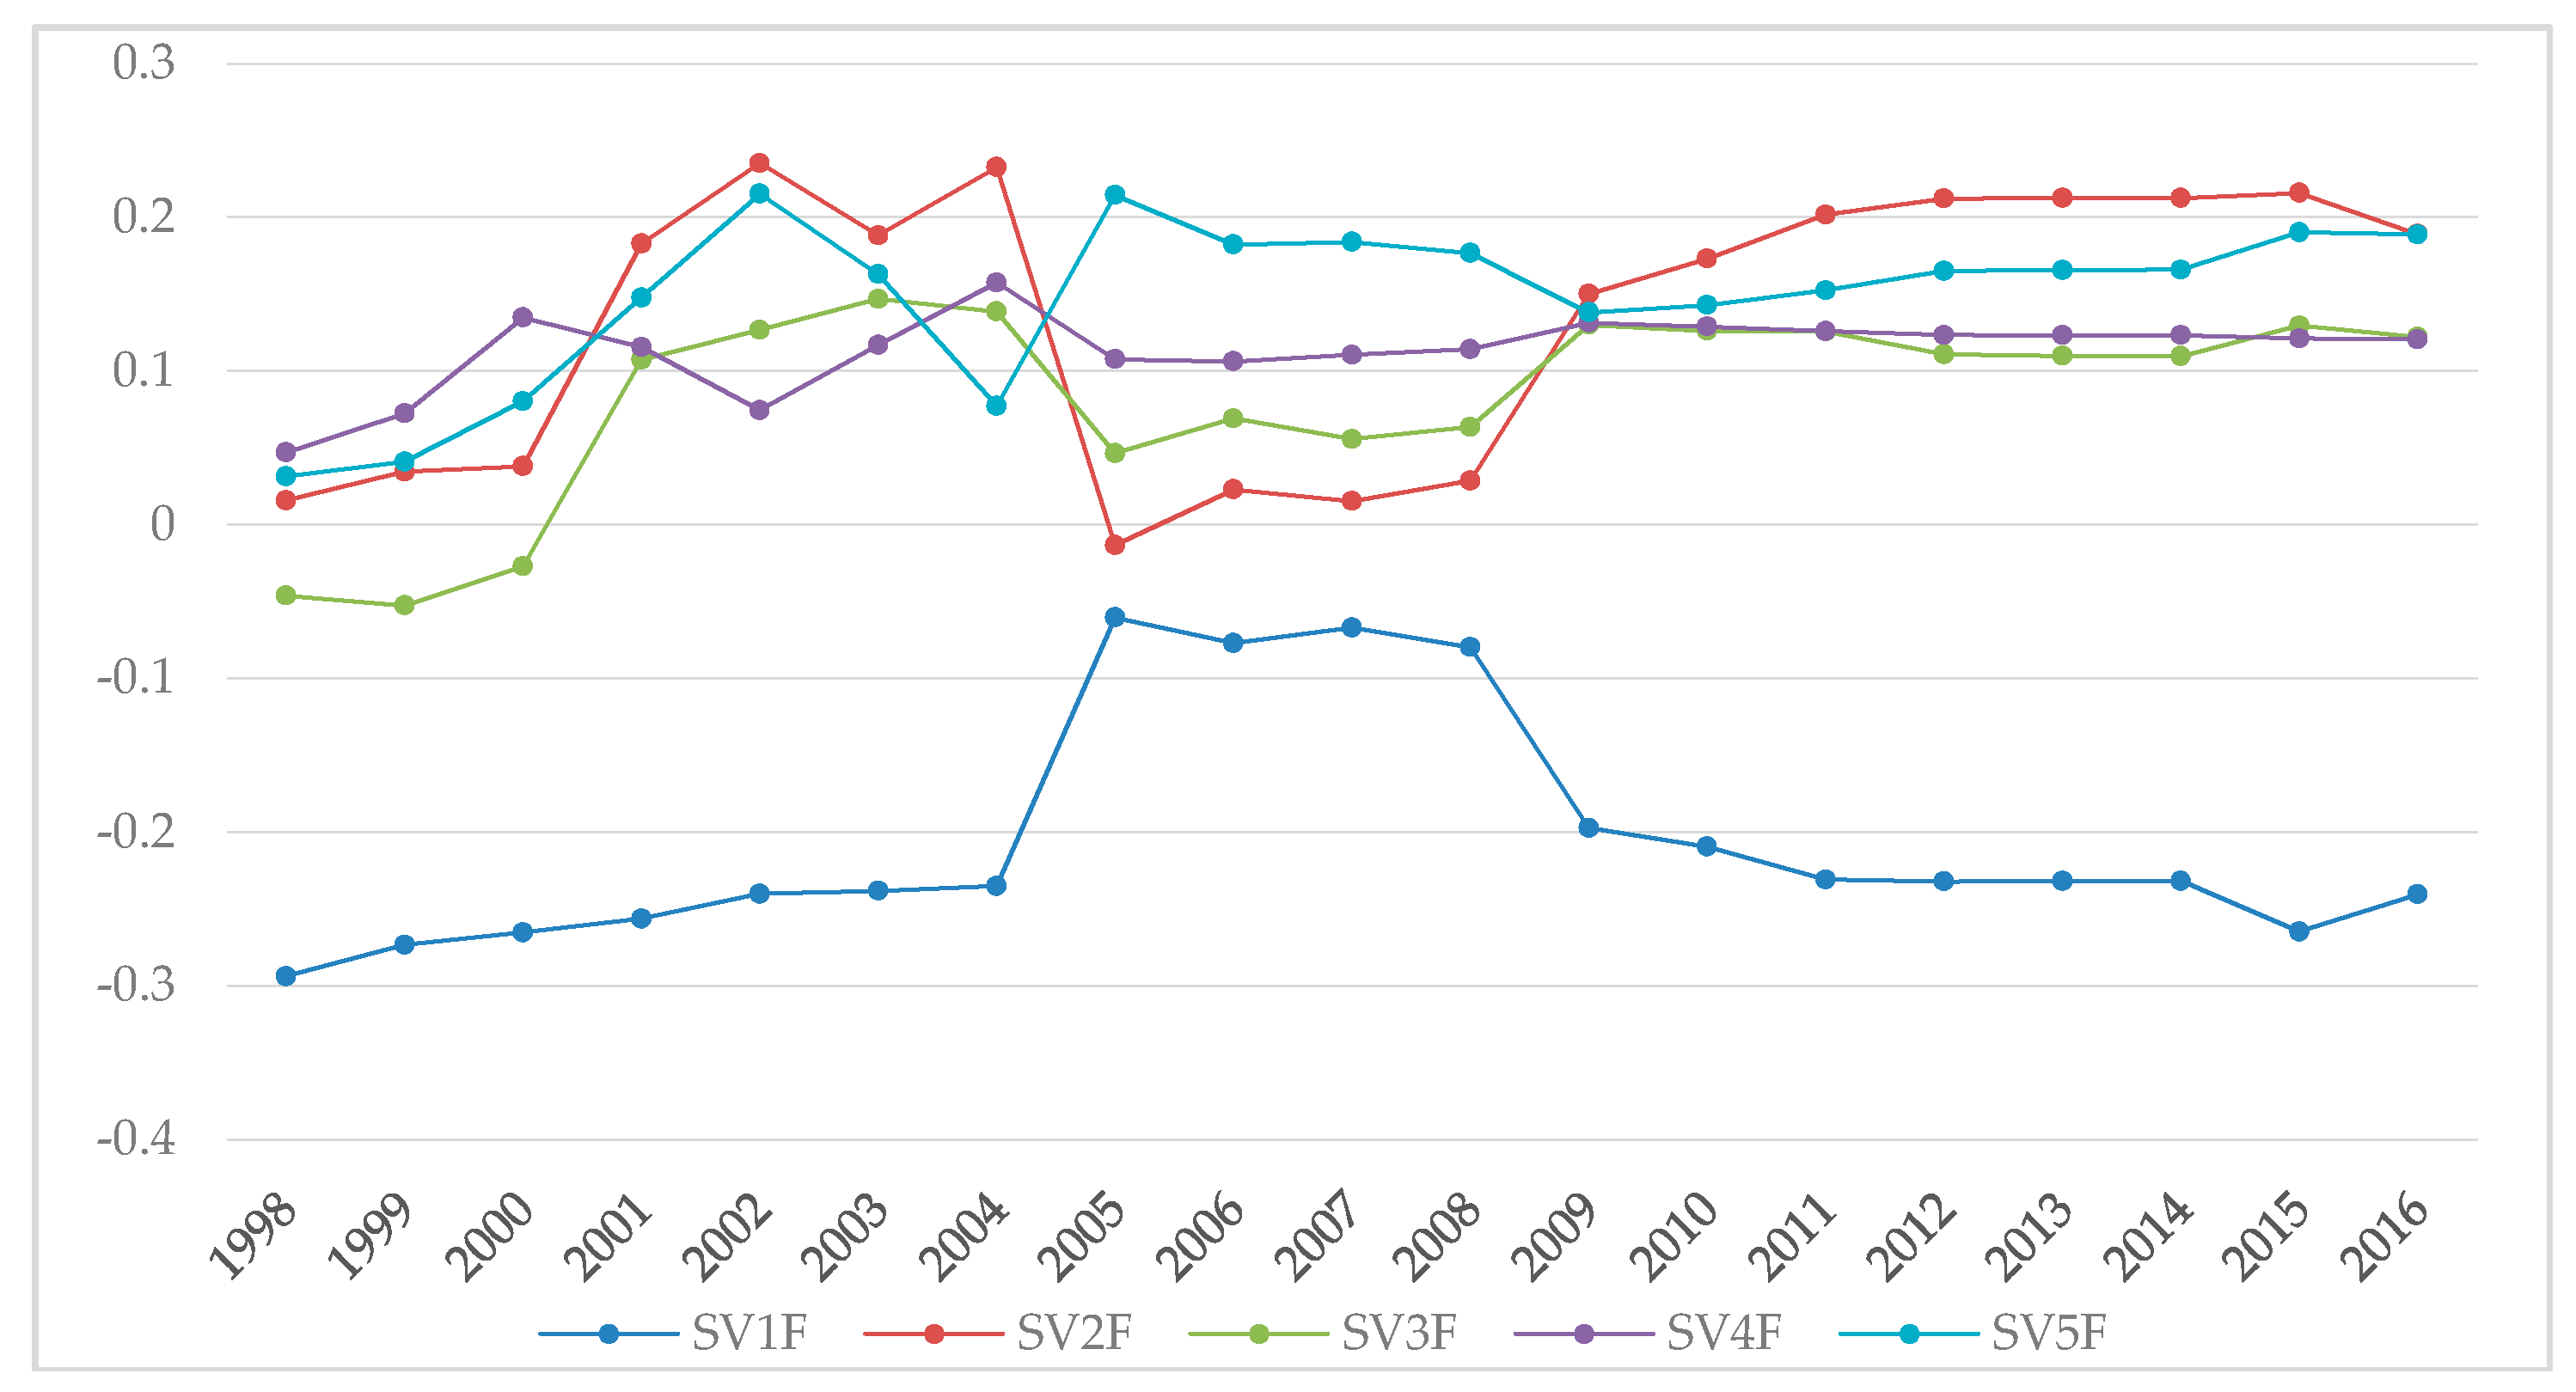
Figure 4 shows that the R&D dynamic impact curves of the five high-tech industries can be divided into two categories. The first type is the influence curve of R&D input on energy consumption in the pharmaceutical industry and aerospace industry, where the dynamic influence curve is L-shaped. The second type is the dynamic influence curve of R&D input in the electronic and communication equipment industry, computer and office equipment industry, and medical equipment industry, where the dynamic influence curve is an inverted L shape. However, the changes of the impacts in all industries have a common feature. They tend to be stable after 2005, and the trend in R&D inputs of all industries on energy consumption is as follows: After 2005,
SV4 tends to 0,
SV2 and
SV3 tend to 0.08;
SV1 tends to −0.15, and
SV5 tends to −0.05. Another noteworthy finding is that the mathematical symbols of
SV1 and
SV3 both changed before 2005; the value of the pharmaceutical industry (
SV1) changed from positive to negative, but the value of the electronics and communication equipment industry (
SV3) changed from negative to positive. Finally, both tended to stabilize. The explanation for the trend of SV1 is that the central region undertook a large number of “high-pollution, high-energy-consumption” pharmaceutical industry transfers from the eastern region after 2004. Meanwhile, the lack of talents, funds, and technologies in the central region and the low efficiency of R&D led to the negative impact of R&D investment on energy consumption in the pharmaceutical industry. As for the electronics and communication equipment industry, it basically became the “sunrise industry” of manufacturing industry in the six central provinces by 2005. Moreover, the industrial clustering is becoming increasingly obvious, which promotes energy use efficiency. That is why SV3 presents an inverted “L” curve.
Compared with the final impact of R&D input on energy consumption in different industries, we found that |SV1| > |SV3| > |SV2| > |SV5| > |SV4|. This means that the impacts in the central region were: Pharmaceutical industry > electronics and communication equipment industry > aerospace industry > medical equipment industry > computer and office equipment industry. Simultaneously, the R&D investment of the pharmaceutical industry, computer and office equipment industry, and medical equipment industry increased their energy consumption. The aerospace industry and electronic and communication equipment industry had a promoting effect for reducing energy consumption.
4.1.3. Impacts of High-Tech Industrial R&D Input on Energy Consumption in the Western Region
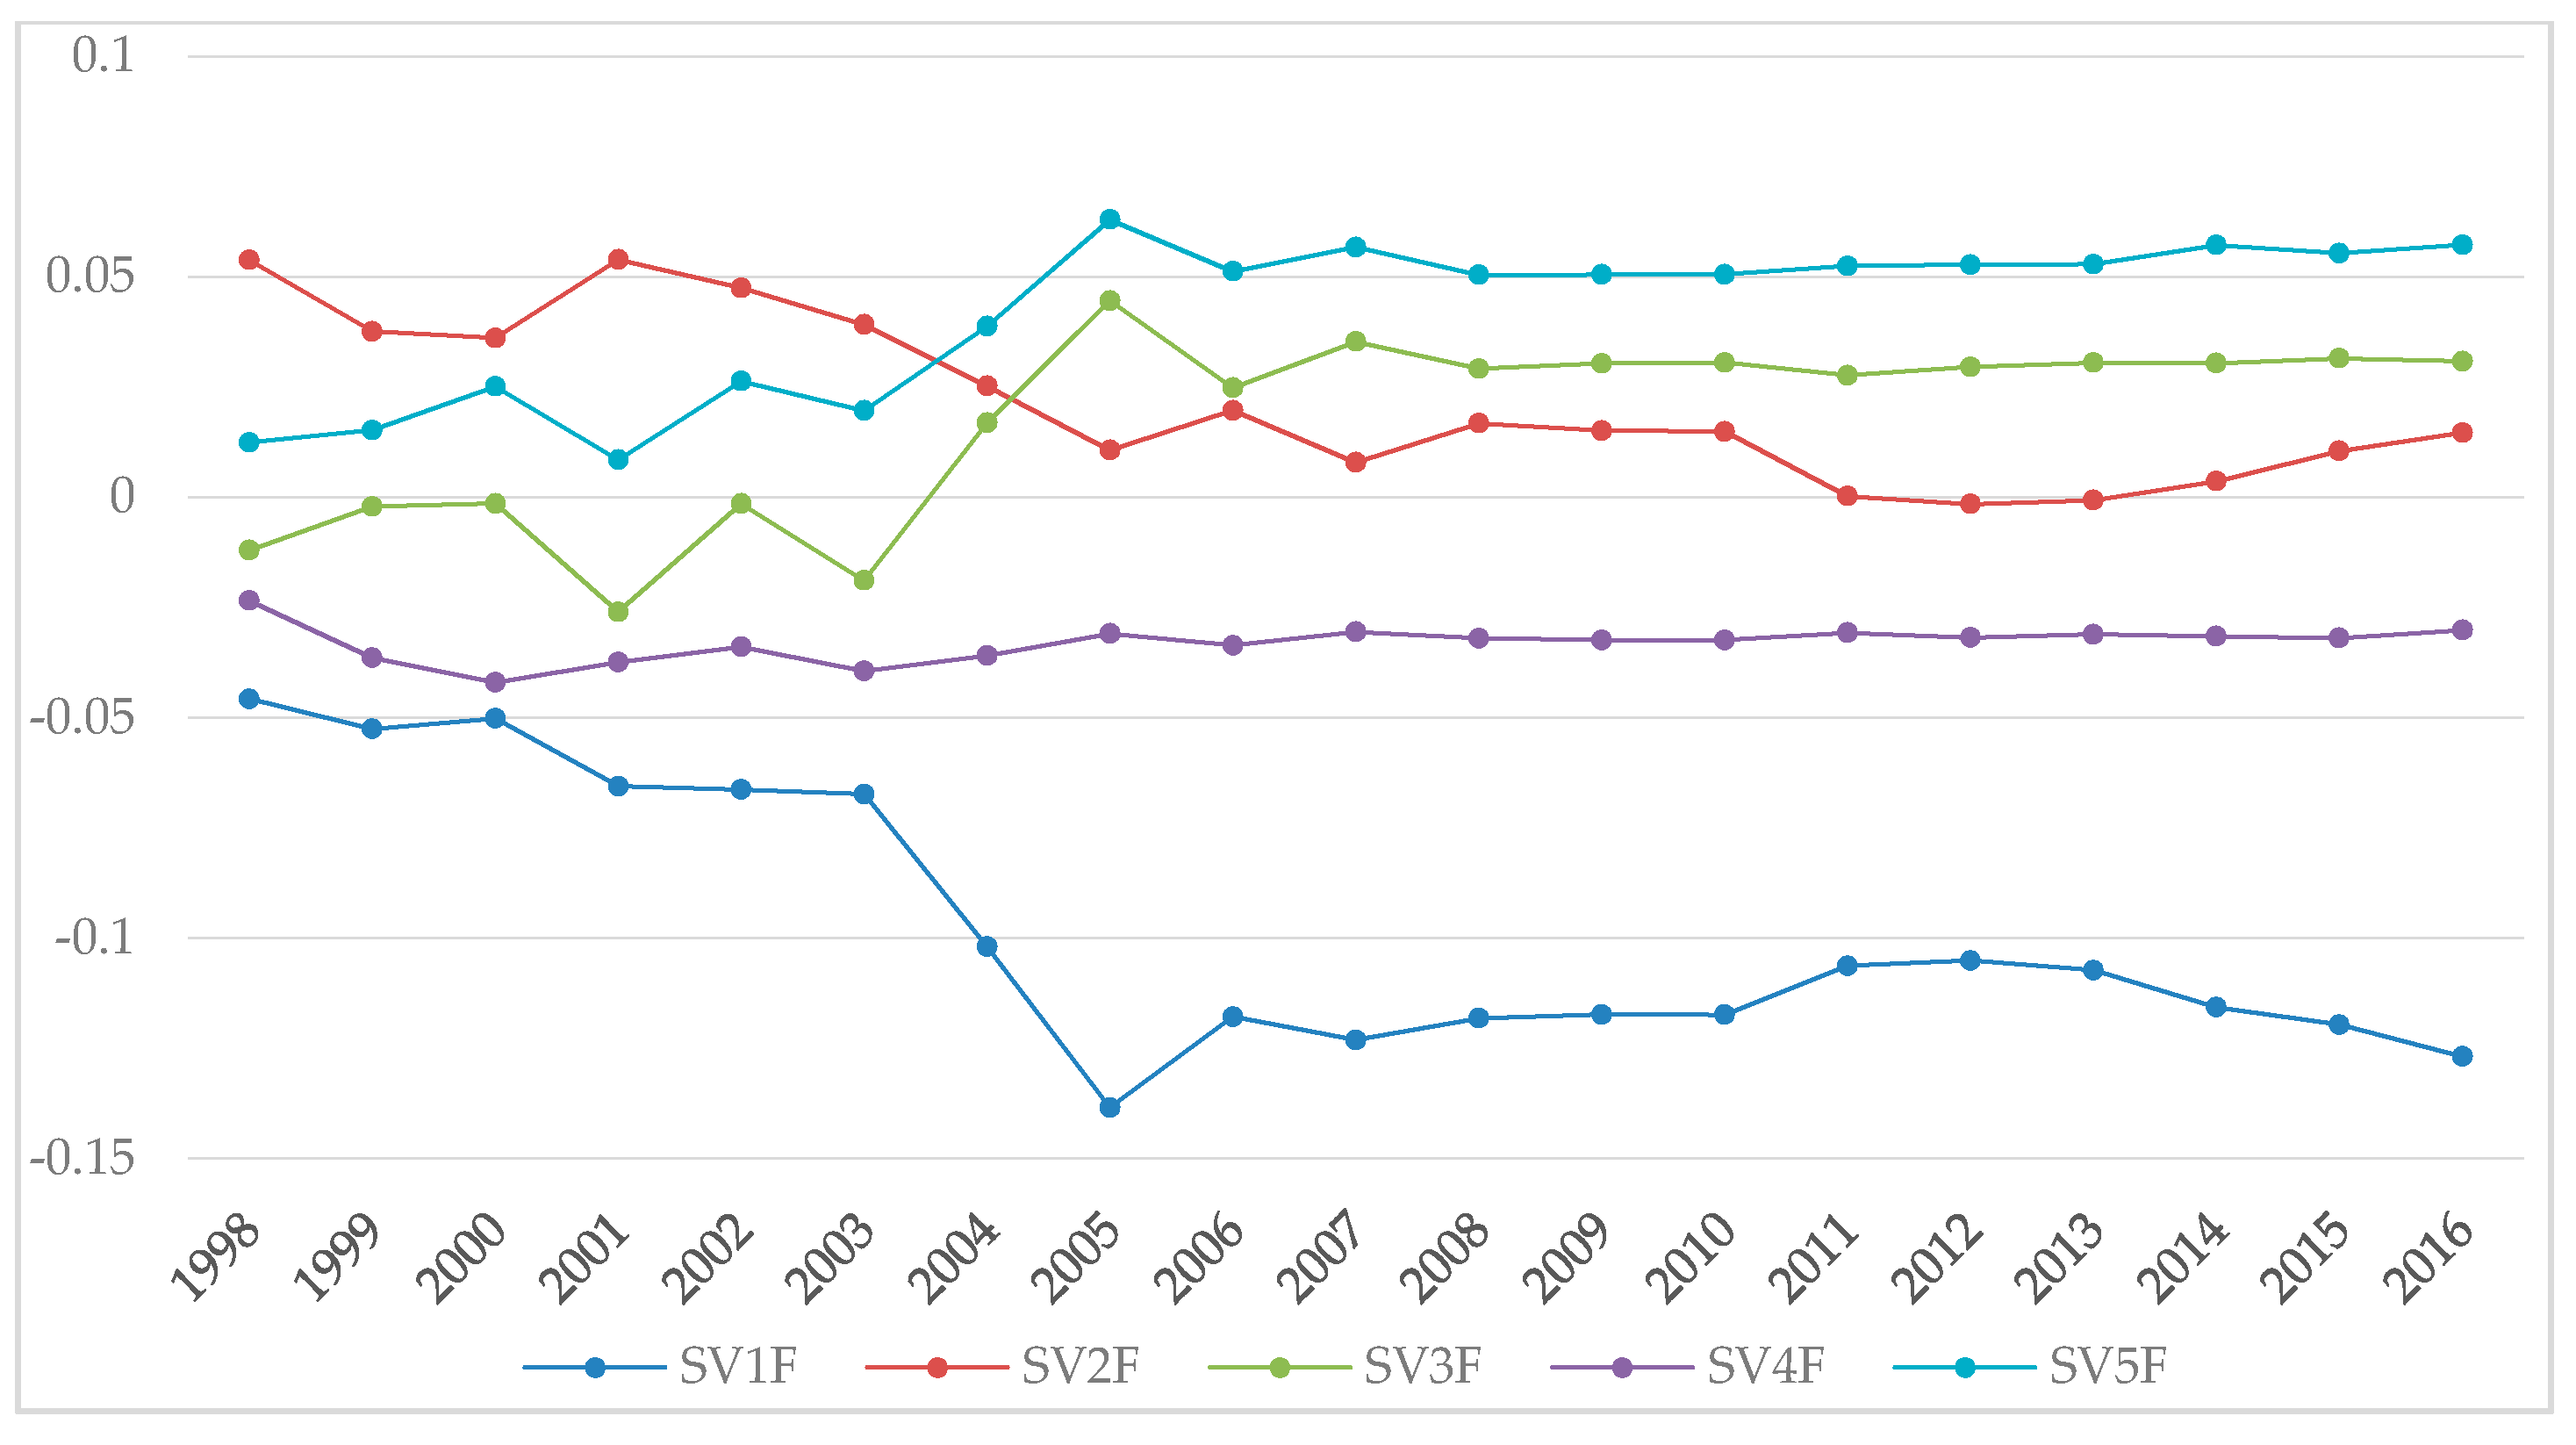
According to
Figure 5, in the western region, the impacts of various high-tech industries fluctuated to a certain extent before 2009. The fluctuation trends of the aerospace industry (
SV2) and computer and office equipment industry (
SV4) are similar, whereas the trend in the medical equipment industry (
SV5) was opposite to that of the above industries. The pharmaceutical industry (
SV1) and electronics and communication equipment industry (
SV3) had inverted U- and U-shaped curves, respectively. In the early stage, there was a serious shortage of human resources, capital, technology, and other resources in the western region. In addition, a small number of pharmaceutical industries are located in the western region. These industries lack the motivation for R&D activities. Meanwhile, the central region undertook the transfer of the pharmaceutical industry in the eastern region and attracted some labor in the western region after 2004, which further weakened the impact of the pharmaceutical industry on energy consumption in the western region. However, part of the pharmaceutical industry in the central region shifted to the western region in a gradient in 2008, and the negative impact of this industry on energy consumption was significantly enhanced. Therefore, in this short period of time, the influence trend of the pharmaceutical industry showed an inverted U shape. For electronics and communication equipment industry, it had a smaller industrial size, less capital input, and smaller market demand in the early stage. However, with the expansion of the industrial scale, capital input and market demand after 2005, the R&D investment had a more obvious impact on reducing energy consumption. Therefore, a U-shaped trend of SV3 presented in
Figure 3. After 2009, the influence of R&D investment on energy consumption in all industries tended to be stable. The final status values of each industry were:
SV1 = −0.24,
SV2 = 0.19,
SV3 = 0.12,
SV4 = 0.12, and
SV5 = 0.19. Except for the negative influence of R&D investment in the pharmaceutical industry, all the other industries had positive influence in the west, but the effect of the aerospace and equipment industry (
SV2) is not significant.
4.1.4. Impacts of High-Tech Industrial R&D Input on Energy Consumption in the Northeast
With regards to the influence of the R&D input of high-tech industries in the northeast, except for the relatively stable negative influence of the computer and office equipment industry (
SV4) (the influence coefficient was close to −0.03), the other industries continuously and significantly increased (or decreased), with the same trends as in the central region (
Figure 4) before 2005. According to
Figure 6, from 2005 to 2008, the impacts of the electronic and communication equipment industry (
SV3) and medical equipment industry (
SV5) showed small fluctuations and then tended to be stable (the coefficients of
SV3 and
SV5 were close to 0.03 and 0.06, respectively).
In examining the influence degree of various high-tech industries, we found that the pharmaceutical industry (
SV1) has the greatest influence, but it had a negative influence on the reduction of energy consumption. There are abundant medical materials and good enterprise foundations in northeast China. As the industry with the highest output value of high-tech industry in the northeastern region, the pharmaceutical industry also has problems such as insufficient R&D investment, low innovation output, and low production or conversion capacity of new products. We can see that the negative effect of the pharmaceutical industry on energy consumption is increasing. At the same time, the northeast, China’s old industrial base, has a certain innate foundation in the aspects of aerospace, electronic communication, and medical equipment. With the proposal of revitalizing the northeast strategy, investment in the manufacturing of aerospace, electronic communication, and medical equipment was further increased, aiming at a sustainable development path of “optimizing structure, improving efficiency, and reducing consumption”. From
Figure 6, it can be seen that aerospace industry (
SV2), electronic and communication equipment industry (
SV3), and medical equipment industry (
SV5) tended toward decreasing energy consumption. During the period of 2005 to 2016, the promotion of reducing energy consumption in the medical equipment industry (
SV5) was always stronger than that of the electronic and communication equipment industry (
SV3) and the aerospace industry (
SV2).
4.2. Impacts of Regions for Each Sector
4.2.1. Impacts of Pharmaceutical Industrial R&D Input on Energy Consumption
The pharmaceutical manufacturing industry is not only closely related to people’s lives and health but also has an important impact on national economic development. Compared with other industries, pharmaceutical manufacturing has the following characteristics: First, a higher market access threshold and a stricter approval process; second, it is knowledge and technology intensive; third, it has high investment and high return; fourth, it is under strict government control.
It can be seen from
Figure 7 that the R&D investment of pharmaceutical industry had a negative impact on energy consumption in eastern, western, and northeast regions, and the impact in the central region was also negative in 2005 after the initial plunge. The main reason may be that most of the “heavy pollution and high energy consumption” links in the pharmaceutical manufacturing chain in east region are shifted to the central region after 2005. From the perspective of the trend of the influence coefficient, except for the central region, it showed a sharp decline from 1998 to 2005, and the changes in other regions were relatively stable. There was a small range of fluctuations, but eventually it tended to be stable. In terms of the final state value of the pharmaceutical industry in various regions, the values are all negative (–0.132, –0.157, –0.241, –0.127). This shows that the R&D investment of pharmaceutical industry had a negative impact on energy consumption in all regions, and it is more obvious in the western region than in other regions. The explanation for this result is that the technological innovation with a relatively low level in the western region restricts the development of the pharmaceutical industry in this area. Strong technology innovation levels will bring technology spillover, which can form an agglomeration effect easily and improve the utilization efficiency of resources.
4.2.2. Impacts of Aerospace Industrial R&D Input on Energy Consumption
As an important part of high-tech industry, aerospace industry has become the leading industry to drive the growth of the national economy. Especially in Shaanxi province, aerospace industry has always been an advantageous industry. As can be seen from the
Figure 8, the impacts of R&D investment on energy consumption were the strongest in the western region, followed by the central region and the weakest in the northeast region (the final state value order is western > central > northeast). It is worth noting that aerospace industry had a negative impact on energy consumption in the developed eastern regions. We believe that the scale of aerospace industry in the eastern region is relatively smaller than other high-tech sectors (for example, the scale of aerospace industry in Beijing is the smallest in the high-tech industry). At the same time, this industry is a special industry, and it has relatively high market-access threshold and large upfront investment, so it basically maintains the original pattern of planned economy.
According to the changing trend of the curve in the
Figure 8, the impacts of aerospace industry in the eastern region and northeast region are not obvious; it was relatively stable in this period. The central aerospace industry had an absolute advantage in the early stage (the aerospace industry in the central region had the highest output value), but it plunged from 1998 to 2005. The main reason was that since the beginning of the 21st century, the aerospace industry was faced with a serious problem of talent shortage in the central region, which led to the stagnation of development. On the contrary, in the western region, the aerospace industry has a good momentum after the implementation of the western development strategy, but after 2004, it took over the transfer of some industries in the central region, leading to the weakening effect on energy. This is why the impacts of aerospace industry on energy have fluctuated in the western region.
4.2.3. Impacts of Electronic and Communication Equipment Industrial R&D Input on Energy Consumption
The electronic and communication equipment industry has the following characteristics: First, knowledge intensive, high technical content; second, high investment; third, fast product update speed; fourth, high risk and high return. It can be seen from
Figure 9 that the curve does not change significantly in the eastern region, and it has no significant impact on energy consumption (its coefficient tends to zero). However, the figure shows some fluctuations in other regions, especially the central region, which saw a sharp increase from 1998 to 2005 and then leveled off. Fluctuations occurred in both the eastern and western regions. It can be seen that there were a good foundation and absolute advantages in the early stage. This is mainly because since the 1990s, the eastern region began to receive industrial transfer from southeast Asian countries, Hong Kong, and Taiwan, which promote the cluster of embedded electronic and communication equipment industry in the eastern regions.
The natural geographical advantages, preferential investment policies, and the development of industrial agglomeration have all strengthened the agglomeration of electronic and communication equipment industry in coastal areas and maintained this trend. However, with the rapid development of the electronic and communication equipment industry, the rapid expansion of industrial scale and talent capital saturated this industry in the eastern region, and the industrial agglomeration centripetal force started to weaken. At the same time, there were low labor prices, low land costs and preferential industrial policies in the central and western regions. They became a good location choice for industrial agglomeration transferring from the eastern region. This explains why this industry has been able to catch up in the west and central regions, while those in the east have fallen.
4.2.4. Impacts of Computer and Office Equipment Industrial R&D Input on Energy Consumption
For the computer and office equipment industry, from
Figure 10 we can find that the changes in different regions were similar to those in the electronics and communication equipment industry. There was a sharp increase trend in the central region. The volatility was not strong in other regions, and the final state value tended to be stable. The impacts on energy consumption in central and northeastern regions were close to zero. In the western region, it had a strong positive impact on energy consumption, while it has a negative impact in the eastern region. This implies that the impacts of an industry’s investment on energy are often different depending on its stage of development and sectors.
The economic development level was relatively high in the eastern region, and then the computer and office equipment industry formed a certain cluster area. Due to the technological spillover effect of industrial agglomeration and industrial transfer to the central region, the computer and office equipment industry developed rapidly. Moreover, for the eastern region, in theory, enterprises can reduce the transportation cost and information cost in the industrial cluster areas, which can improve the efficiency of labor division and output of enterprises in the cluster area. At present, the excessive agglomeration of enterprises in the eastern region leads to the shortage of resources. The failure of supporting facilities to keep up with expansion and the negative agglomeration effect caused by vicious competition among enterprises restrict the development of the computer and office equipment industry in the eastern region.
4.2.5. Impacts of Medical Equipment Industrial R&D Input on Energy Consumption
Medical equipment industry has high requirements for innovation and research, and in the absence of breakthroughs in innovation and research, it is necessary to spend a huge amount of fund to introduce foreign technologies. The distribution of China’s medical equipment industry has obvious regional characteristics. These industries are mainly concentrated in the eastern coastal provinces, especially in the Yangtze river delta economic zone, while the share of the central and western regions is very small.
It can be seen from the
Figure 11 that except for the great changes in the central region from 1998 to 2005, the fluctuations of other regions are not obvious; especially after 2005, the impacts of medical equipment industry on energy consumption are relatively stable in all regions. At the same time, we found that during the whole period from 1998 to 2016, there was a positive influence in the east, west, and northeast regions, and the influence in the east region was significantly stronger than that in other regions. Especially in the eastern coastal region, it has inherent advantages in the export of medical equipment products. Moreover, the road, railway, and air transport industries in these regions are also very developed, which gives it transport advantages in sales. In addition, complete infrastructure, developed financing market, superior industrial environment, complete industrial chain, and strong financial support from local governments all contribute to the concentration of medical equipment industry in the eastern region. Therefore, the development of medical equipment industry has an absolute advantage in the eastern region, which plays a more significant role in the improvement of energy utilization efficiency.
5. Discussion
Previous researches on R&D investment and energy consumption in high-tech industries mainly focused on a specific industry, and the research area was a designated region. The common views showed that the R&D investment can improve energy use efficiency and reduce energy consumption, but some studies have concluded that R&D investment could lead to increased energy consumption. However, the impact of R&D investment on energy consumption is also a double-edged sword. On the one hand, R&D investment leads to the adoption of new technologies to save energy consumption; on the other hand, R&D investment leads to further economic growth, which in turn consumes more energy. This is known as the rebound effect. In this regard, we believe that these conclusions are all relative, and these different conclusions may be drawn in different industries or different geographical locations. Therefore, we broke down the high-tech industry into five types of sectors and divided the research area into four groups for comparison.
First, we found the negative impacts of the pharmaceutical industry on energy consumption in all regions. The current environmental regulations are being constantly strengthened, which has impacted industrial economic efficiency. This leads to an increase in energy consumption with increasing R&D investment. Therefore, the local governments should not blindly increase the R&D input of the pharmaceutical industry but rather seek to develop an industry with high efficiency, advanced technology, and high added value by adjusting the industrial structure of the pharmaceutical industry. For the low-pollution, strong-governance industries within the pharmaceutical industry (such as biopharmaceutical manufacturing in the eastern regions), expanding their scale and increasing R&D investment would be beneficial to reducing energy consumption, and for the high-pollution and high-energy consumption industries (such as chemical manufacturing in the western regions), low-added-value, high-pollution, and expensive-production projects should be abandoned, retaining only the output matched with downstream industries. Given the background of a sharing economy, an internet platform is necessary to realize the sharing of environmental protection technology and facilities, while enterprises need to break through the bottleneck of environmental protection technology, which could reduce their energy consumption and promote the sustainable development of the pharmaceutical industry.
Second, unlike the pharmaceutical industry, the R&D investments in the medical equipment industry have had a significant positive impact on energy consumption reduction in the east, west, and northeast regions. The impact is more significant in the east than in the other regions. This is mainly related to the increased demand of health services. The demand for health services is large in the densely populated eastern region, leading to an increased demand for medical equipment, which further promotes investment in the medical equipment industry. Regarding the aerospace industry, the impact of high-tech industrial R&D investment on energy consumption is relatively weak in eastern, central, and northeastern regions. Meanwhile, although R&D inputs are increasing, a gap still remains between scientific research and production due to the lack of high-tech personnel. The aerospace industry involves many complex processes that inevitably lead to increasing energy consumption. Therefore, the aerospace industry should strengthen the cultivation and introduction of talent in its field, improve the technical level of the industry, and replace high energy consumption and high pollution manufacturing processes with new technology, to drive the aerospace industry to gradually develop in the direction of advanced technology and green environmental protection.
Third, the overall impacts of R&D investment on energy consumption in the electronic and communication equipment industry (SV3) and computer and office equipment industry (SV4) were obviously weaker than that in other industries in the east, middle, and northeast regions, and the R&D investment of the computer and office equipment industry has had a negative impact on energy consumption in these regions. However, in the west, the R&D input of the two industries had a significant role in promoting reduced energy consumption. At present, there are many powerful enterprises in the electronic and communication equipment and computer and office equipment industries, and some areas even tend to be saturated. The continuous inflow of funds and talent leads to greater competition pressure and excess production capacity, which reduce the efficiency of energy use and increase energy consumption. Especially in some developed areas in the east, this problem is more serious, whereas in the west, the production is weak and lacks the support of capital, labor, and technology. An obvious polarization exists between less developed areas and developed areas. Therefore, accelerating industrial transfers between adjacent regions, promoting the inflow of capital and talent in western regions, and supporting the radiation effect of developed regions on surrounding cities are key strategies for promoting the energy efficiency and reducing the energy consumption of each region.
The study enriches the research on high-tech industry and energy consumption, which has a certain theoretical significance. At the same time, some conclusions and implications obtained in our study have a certain practical guiding significance for governmental work. However, our research also has some limitations. In the selection of control variables, we do not consider the influence of policies on the R&D investment and energy consumption. The R&D investment policies are perhaps the main factor to prevent the increase in energy consumption in a context of industrial growth. In the following study, we will use the DID (difference-in-difference) model to study the relationship between the high-tech industries’ R&D investment and energy consumption under the guidance of relevant R&D investment policies and compare the differences with the current results.
6. Conclusions and Implications
In this paper, the dynamic impact of R&D input on energy consumption in five high-tech industries in China from 1998 to 2016 was studied using the state space model with time-varying parameters. The following conclusions were drawn:
In the east regions, the values of SV1, SV2, and SV4 were negative from 2003 to 2016, and SV1 < SV4 < SV2, which indicates that an increase in R&D input in the pharmaceutical industry, aerospace industry, and computer and office equipment industry had a negative impact on energy consumption. Conversely, the values of SV3 and SV5 were positive, with SV5 > SV3, which shows that the R&D investment of the electronic and communication equipment industry and medical equipment industry promoted the reduction of energy consumption. The influence of R&D investment on energy consumption in the medical equipment industry was significantly stronger than in the other high-tech industries.
In the middle regions, we found that |SV1| > |SV3| > |SV2| > |SV5| > |SV4|. This means that the impacts in the central region were: Pharmaceutical industry > electronics and communication equipment industry > aerospace industry > medical equipment industry > computer and office equipment industry. Simultaneously, the R&D investment of the pharmaceutical industry, computer and office equipment industry, and medical equipment industry will increase their energy consumption. The aerospace industry and electronic and communication equipment industry have a promoting effect for reducing energy consumption.
In the western regions, the impacts of various high-tech industries fluctuated to a certain extent before 2009. The fluctuation trends of the aerospace industry (SV2) and computer and office equipment industry (SV4) were similar, whereas the trend in the medical equipment industry (SV5) was the opposite of that of the above industries. The pharmaceutical industry (SV1) and electronics and communication equipment industry (SV3) had inverted U- and U-shaped curves, respectively. After 2009, the influence of R&D investment on energy consumption in all industries tended to be stable. The final status values of each industry were: SV1 = −0.24, SV2 = 0.19, SV3 = 0.12, SV4 = 0.12, and SV5 = 0.19. Except for the negative influence of R&D investment in the pharmaceutical industry, all the other industries had positive influence in the western region, but the effect of the aerospace and equipment industry (SV2) is not significant.
In the northeast regions, we found that the pharmaceutical industry (SV1) has the greatest influence, but it had a negative influence on the reduction of energy consumption. Similarly, the aerospace industry (SV2), electronic and communication equipment industry (SV3), and medical equipment industry (SV5) tended toward decreasing energy consumption. During the period of 2005 to 2016, the promotion of reducing energy consumption in the medical equipment industry (SV5) was always stronger than that of the electronic and communication equipment industry (SV3) and the aerospace industry (SV2).
Based on above conclusions, we can give some implications for high-tech industry. To reduce energy consumption through R&D investment, high-tech industries should improve their own R&D efficiency. Therefore, in order to improve the efficiency of enterprises’ R&D and reduce energy consumption, we propose some suggestions as follows:
(1) Enterprises should continue to put the technological innovation as a strategic support for the development of high-technology industry. The R&D investment of high-tech industry is the main factor that influences innovation efficiency, so the government should use fiscal policy, revenue policy, and other tools to tilt the innovation resources to these industries with backward innovation efficiency in the central and western regions. The scale effect has begun to emerge in the central and western regions, but it has not been fully developed. Therefore, it is necessary to further strengthen the environmental construction of high-tech industrial clusters in the central and western regions. The combination between innovation and market can be promoted and the regional gap of high-tech industry innovation can be narrowed through some measures such as specialized high-tech industry agglomeration and knowledge-intensive service linkage. In addition, the links between government, industry, universities, and research institutes need to be strengthened to eliminate weaknesses that affect innovation efficiency. The government should give moderate preference to the central and western regions in supporting universities, research institutes, and scientific and technological innovation infrastructure, which could strengthen their technology diffusion effect and promote technological catch-up between the eastern region and less developed regions.
(2) The development of high-tech industry needs good infrastructure, but the infrastructure construction is backward in central and western of China. For example, most of the current high-speed railways and expressways are concentrated in the eastern region, so paying more attention to the regional balance of infrastructure is conducive to improve the innovation performance of China’s overall high-tech industry. This appeals to strong support for infrastructure construction and upgrading the high-tech innovation capacity in the central and western regions so as to achieve coordinated development of all regions. For promoting coordinated development among regions, it is also required that the high-tech industries in the eastern region should give full play to their niche advantages, strengthen international technical cooperation, and enhance their international competitiveness. The industries in the central and western regions, driven by the industries in the eastern region, should make full use of their own unique resource endowments to be optimized and upgraded, then the high-tech industries will be formed with their own characteristics. The efficiency of R&D will be further improved by learning, imitating, and absorbing the technology and management experience of the high-tech industry in the eastern region.
(3) The R&D efficiency of high-tech industry mainly depends on innovative talents and advanced technology. Under this circumstance, enterprises in the central and western regions should provide a better development environment to attract and retain talents. The above-mentioned support in infrastructure construction and education is conducive to attracting and retaining talents. It also requires government to protect the interests of innovators effectively by improving and implementing laws related to intellectual property rights protection. In addition, we advocate independent innovation and introduction of foreign advanced technology for digestion, absorption, and re-innovation. We also suggest that the scale of R&D investment should be appropriately controlled, and the optimal allocation of innovation resources should be paid attention to, which can improve the R&D efficiency of high-tech industries.


