Article

The Formation Mechanism and Influence Factors of Highway Waterfall Ice: A Preliminary Study

1
School of Highway, Chang’an University, Xi’an 710064, China
2
Shaanxi Provincial Communication Construction Group, Xi’an 710075, China
*
Author to whom correspondence should be addressed.
Sustainability 2019, 11(15), 4059; https://doi.org/10.3390/su11154059
Submission received: 11 June 2019 / Revised: 18 July 2019 / Accepted: 25 July 2019 / Published: 27 July 2019

Abstract

:
Highway waterfall ice hazards usually happen in cold regions. However, minimal research has addressed this so far due to its multidisciplinary nature. In this study, ground water monitoring tests were conducted for 2.5 years to study the relationship between ground water level changes and waterfall ice hazards. To explore the internal factors that lead to highway waterfall ice, gradation tests, penetration tests, and freezing tests were conducted which revealed that coarse-grained particles can enhance the permeability of aquifers. Further, volume expansion of free water freezing in a closed system is the main reason for pore pressure increasing aquifers in research areas. Furthermore, to understand the formation mechanism of highway waterfall ice further, a mathematical model of saturated coarse-grained soil at the state of phase transition equilibrium was obtained. This indicates that the essence of the aquifers’ freezing (coarse-grained soil) in the waterfall ice area is the freezing of closed water. Finally, based on the abovementioned findings, the formation process of waterfall ice is defined as three stages: The drainage obstruction stage, the soil deformation stage, and the groundwater gushing stage, respectively. This definition can provide significant guidance on further research that focuses on prevention of highway waterfall hazards.

1. Introduction

Underground aquifers are always disturbed during highway construction in cold regions. This disturbance is obvious during cutting excavation. More precisely, weak interfaces appear during excavating, and ground water squeezes out from these weak interfaces due to the pressure raise induced by the soil freeze. Then, it spreads over the road, and the freeze happens under negative air temperature. These ice blocks are called highway waterfall ice in the field of highway engineering. Highway waterfall ice, together with frost heave damage and snow blockage, are difficult issues when considering highways in cold regions [1,2,3]. High-grade highways in the northern part of China have always been damaged by waterfall ice [4,5]. The hazards have mainly presented traffic isolation and casualties induced by traffic accidents. To ensure the traffic flows, millions of RMB have been spent by the Chinese government for de-icing the highways [6,7]. Furthermore, the expansion of waterfall ice can last a considerable amount of time so that road maintenance workers have to work day and night.
Although there are research and engineering practices based on the study of waterfall ice, the research process is still slow [8,9]. The reason is that the study of highway waterfall ice is complex and multidisciplinary [10]. Considering the factors that affect the development of waterfall ice, only a few researchers have combined the indoor and outdoor experiments with theoretical analysis [11]. When referring to the formation mechanism of waterfall ice, the contraction of the underground cross section, and the increase of hydraulic pressure, which is caused by the compaction of subgrade soil, have been always considered as the main factors by scholars. There are also studies that considered frost depth increases that result from excavating during construction leading to highway waterfall ice hazards [12,13,14]. All of these viewpoints are reasonable, and the main reason for the difference is that the research purposes of these studies are different, and, in addition, the location of the research is different. However, there are insufficient systematic studies on the micro-formation mechanism of waterfall ice [15].
As the study of waterfall ice can also be defined as researching the mechanical properties and the interaction mechanism between groundwater and soil, the research methods of subgrade frost heaving can also be adopted to study waterfall ice [16,17,18]. According to Fourier’s law, Darcy’s law, and energy conservation law, many scholars have deduced the calculation model of the coupling effect of the temperature field, humidity field, and stress field in pavement structure systems [19,20,21,22,23]. Although these models explain the frost heaving mechanism of soil to some extent, they are not suitable for a theoretical analysis of waterfall ice. To explore the law of frost heaves, indoor and outdoor experiments have been conducted in recent years [24]. The general law of subgrade freezing damage has been discovered by many scholars based on in-situ investigations, thawing and freezing tests, and the law of capillary water rising [17,25]. Furthermore, some scholars have obtained many enlightening results by analyzing the microstructure differences of soils under freeze-thaw conditions by scanning electron microscopy (SEM) [26]. Nevertheless, these studies always focus on the freeze process under the function of capillary action. Therefore, with regard to waterfall ice which is caused by the flowing out of ground water, these test results are not applicable. In addition, with the development of numerical simulation technology, more and more scholars use numerical simulations to simulate the change of the soil temperature field, pore water migration and frost heave deformation [27,28]. Some significant macroscopic factors that lead to highway frost damage can be shown, but the generation mechanism and key parameters are far away from actual determination during simulations due to the complexity and variability of the internal structure of the soil. Moreover, based on the uncertainty analysis theory, some scholars also produced some interesting works [29].
This work chose Tongchuan-Huangling Expressway in China as a research site, and groundwater monitoring was undertaken at the place where waterfall ice hazards are prone to happen. Then, the relationship between ground water level changes and the scale of waterfall ice were analyzed. Following this, penetration tests and freezing tests were conducted in laboratories using in-situ soil, and a mathematical model of waterfall ice was established. Finally, the development process of the highway waterfall was discussed.

2. In-Situ and Indoor Experimental Investigation

Negative temperature, ground water, and the permeability of soil are basic factors that affect the scale of highway waterfall ice. The climate type of the research site belongs to the Monsoon Climate of Medium Latitudes. The negative temperature of the research site (Tongchuan-Huangling Expressway) can last several months during winter, and rainfall is seasonal. According to the site investigation, the soil composition of this area includes three layers (i.e., humus soil, crushed stone, and bed rock) from top to bottom. In addition, the topography along the expressway is mainly hills, and groundwater is abundant with its shallow buried depth. Therefore, highway waterfall ice hazards always happen. The soil composition and waterfall ice hazards are shown in Figure 1.

2.1. Ground Water Monitoring Results

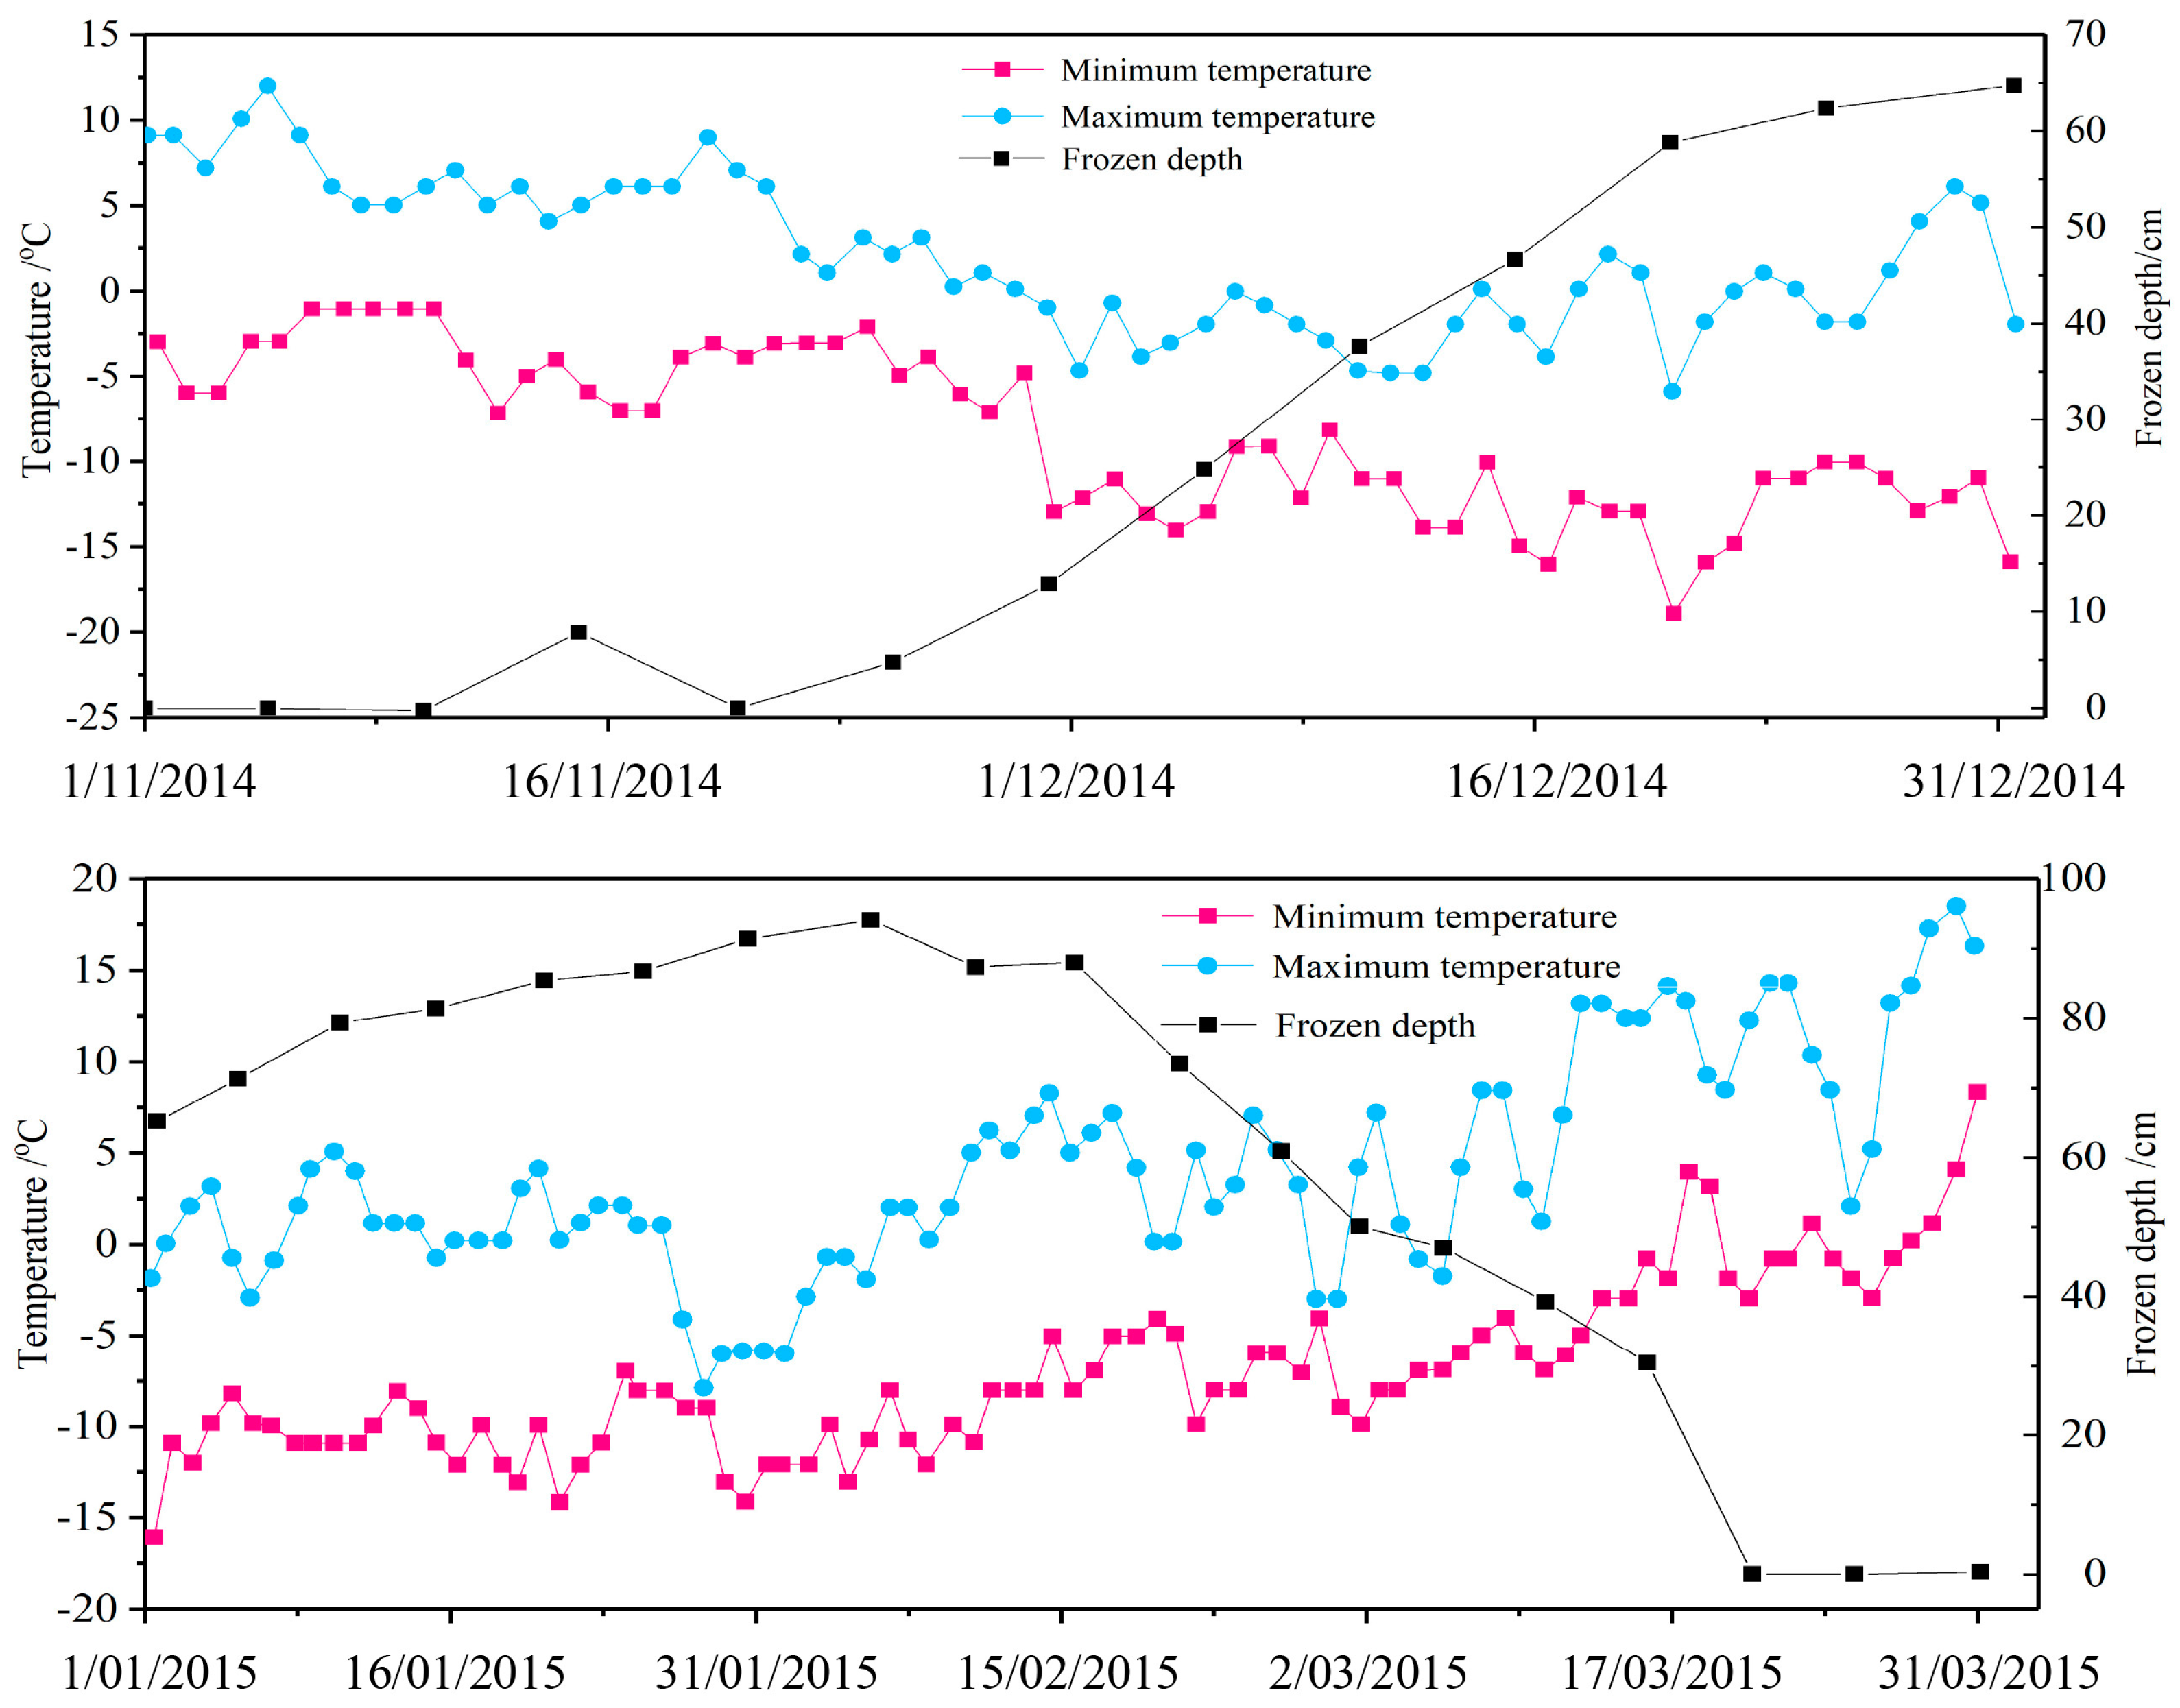
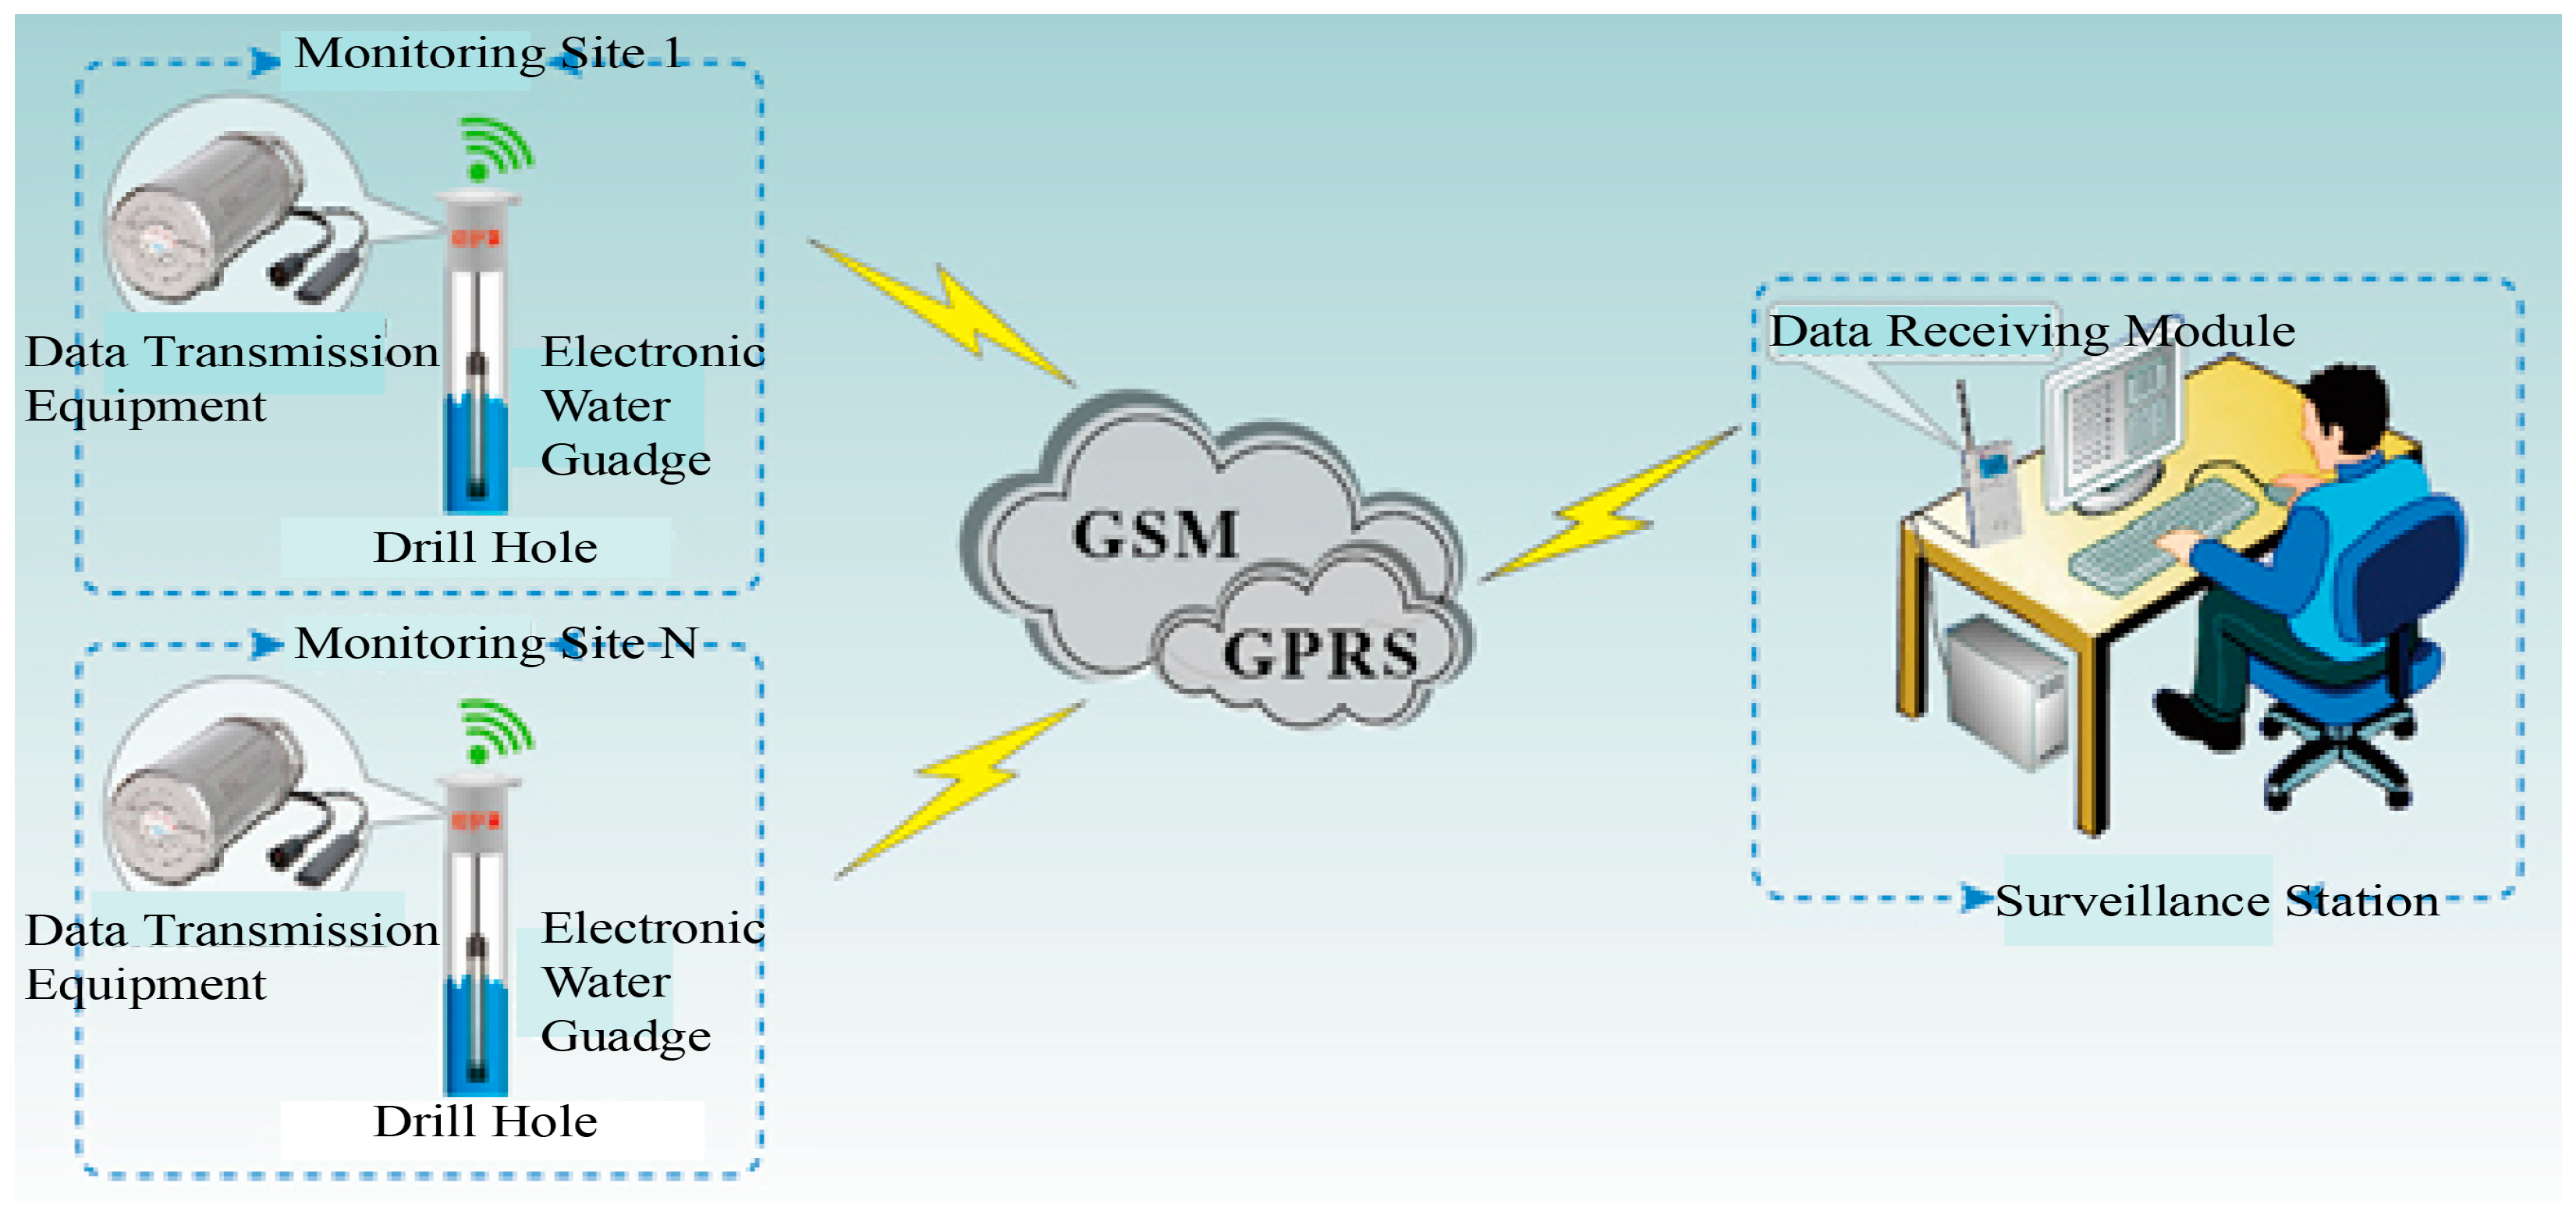
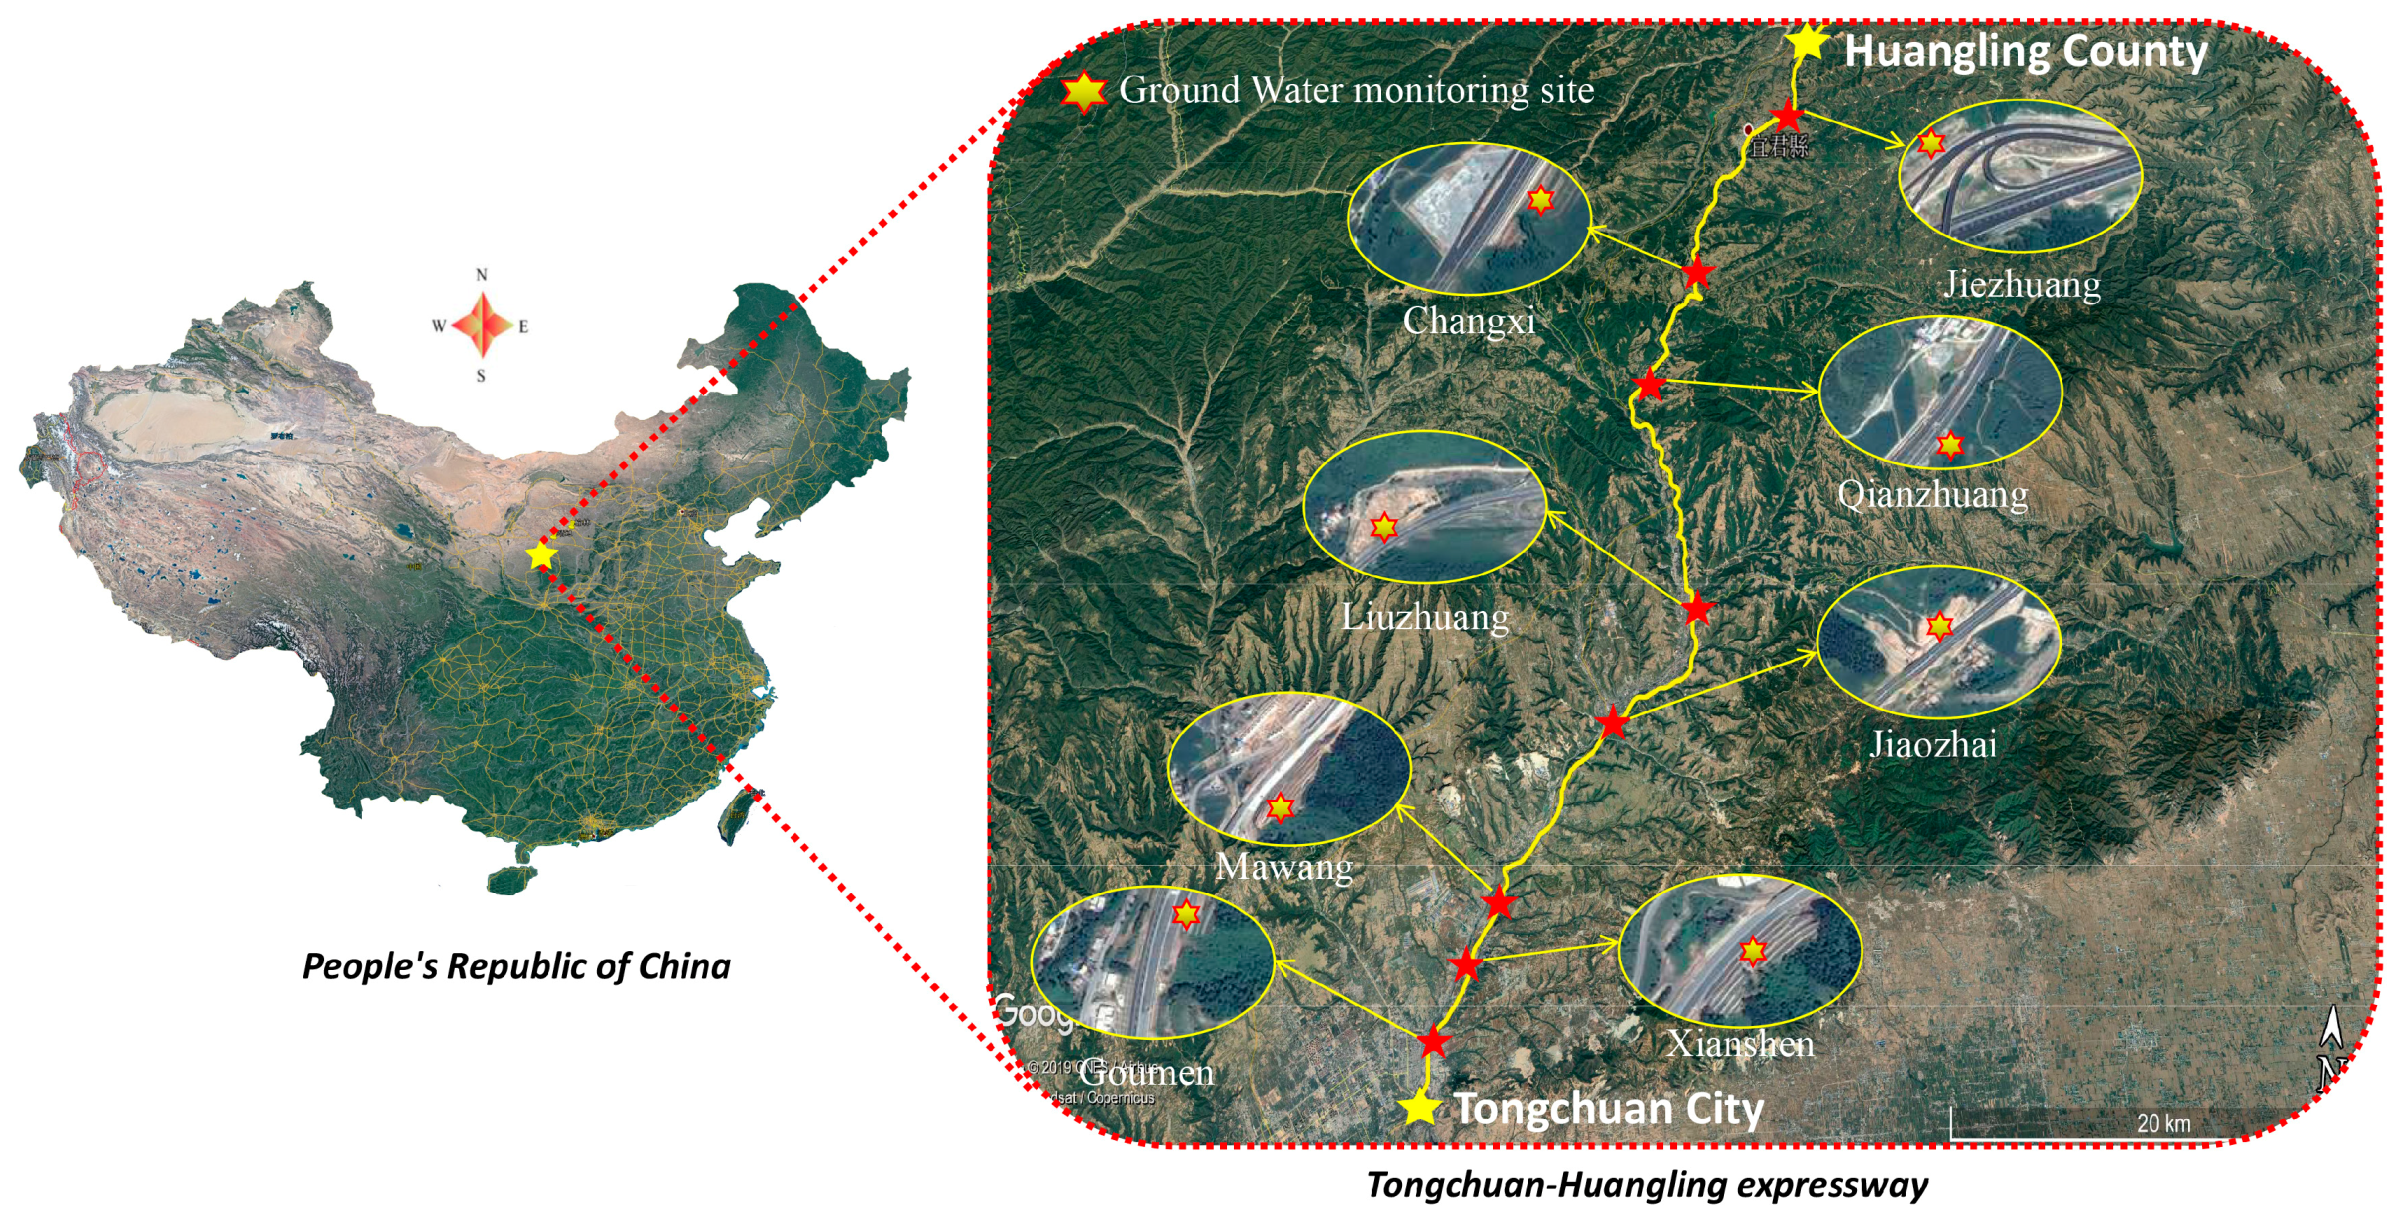
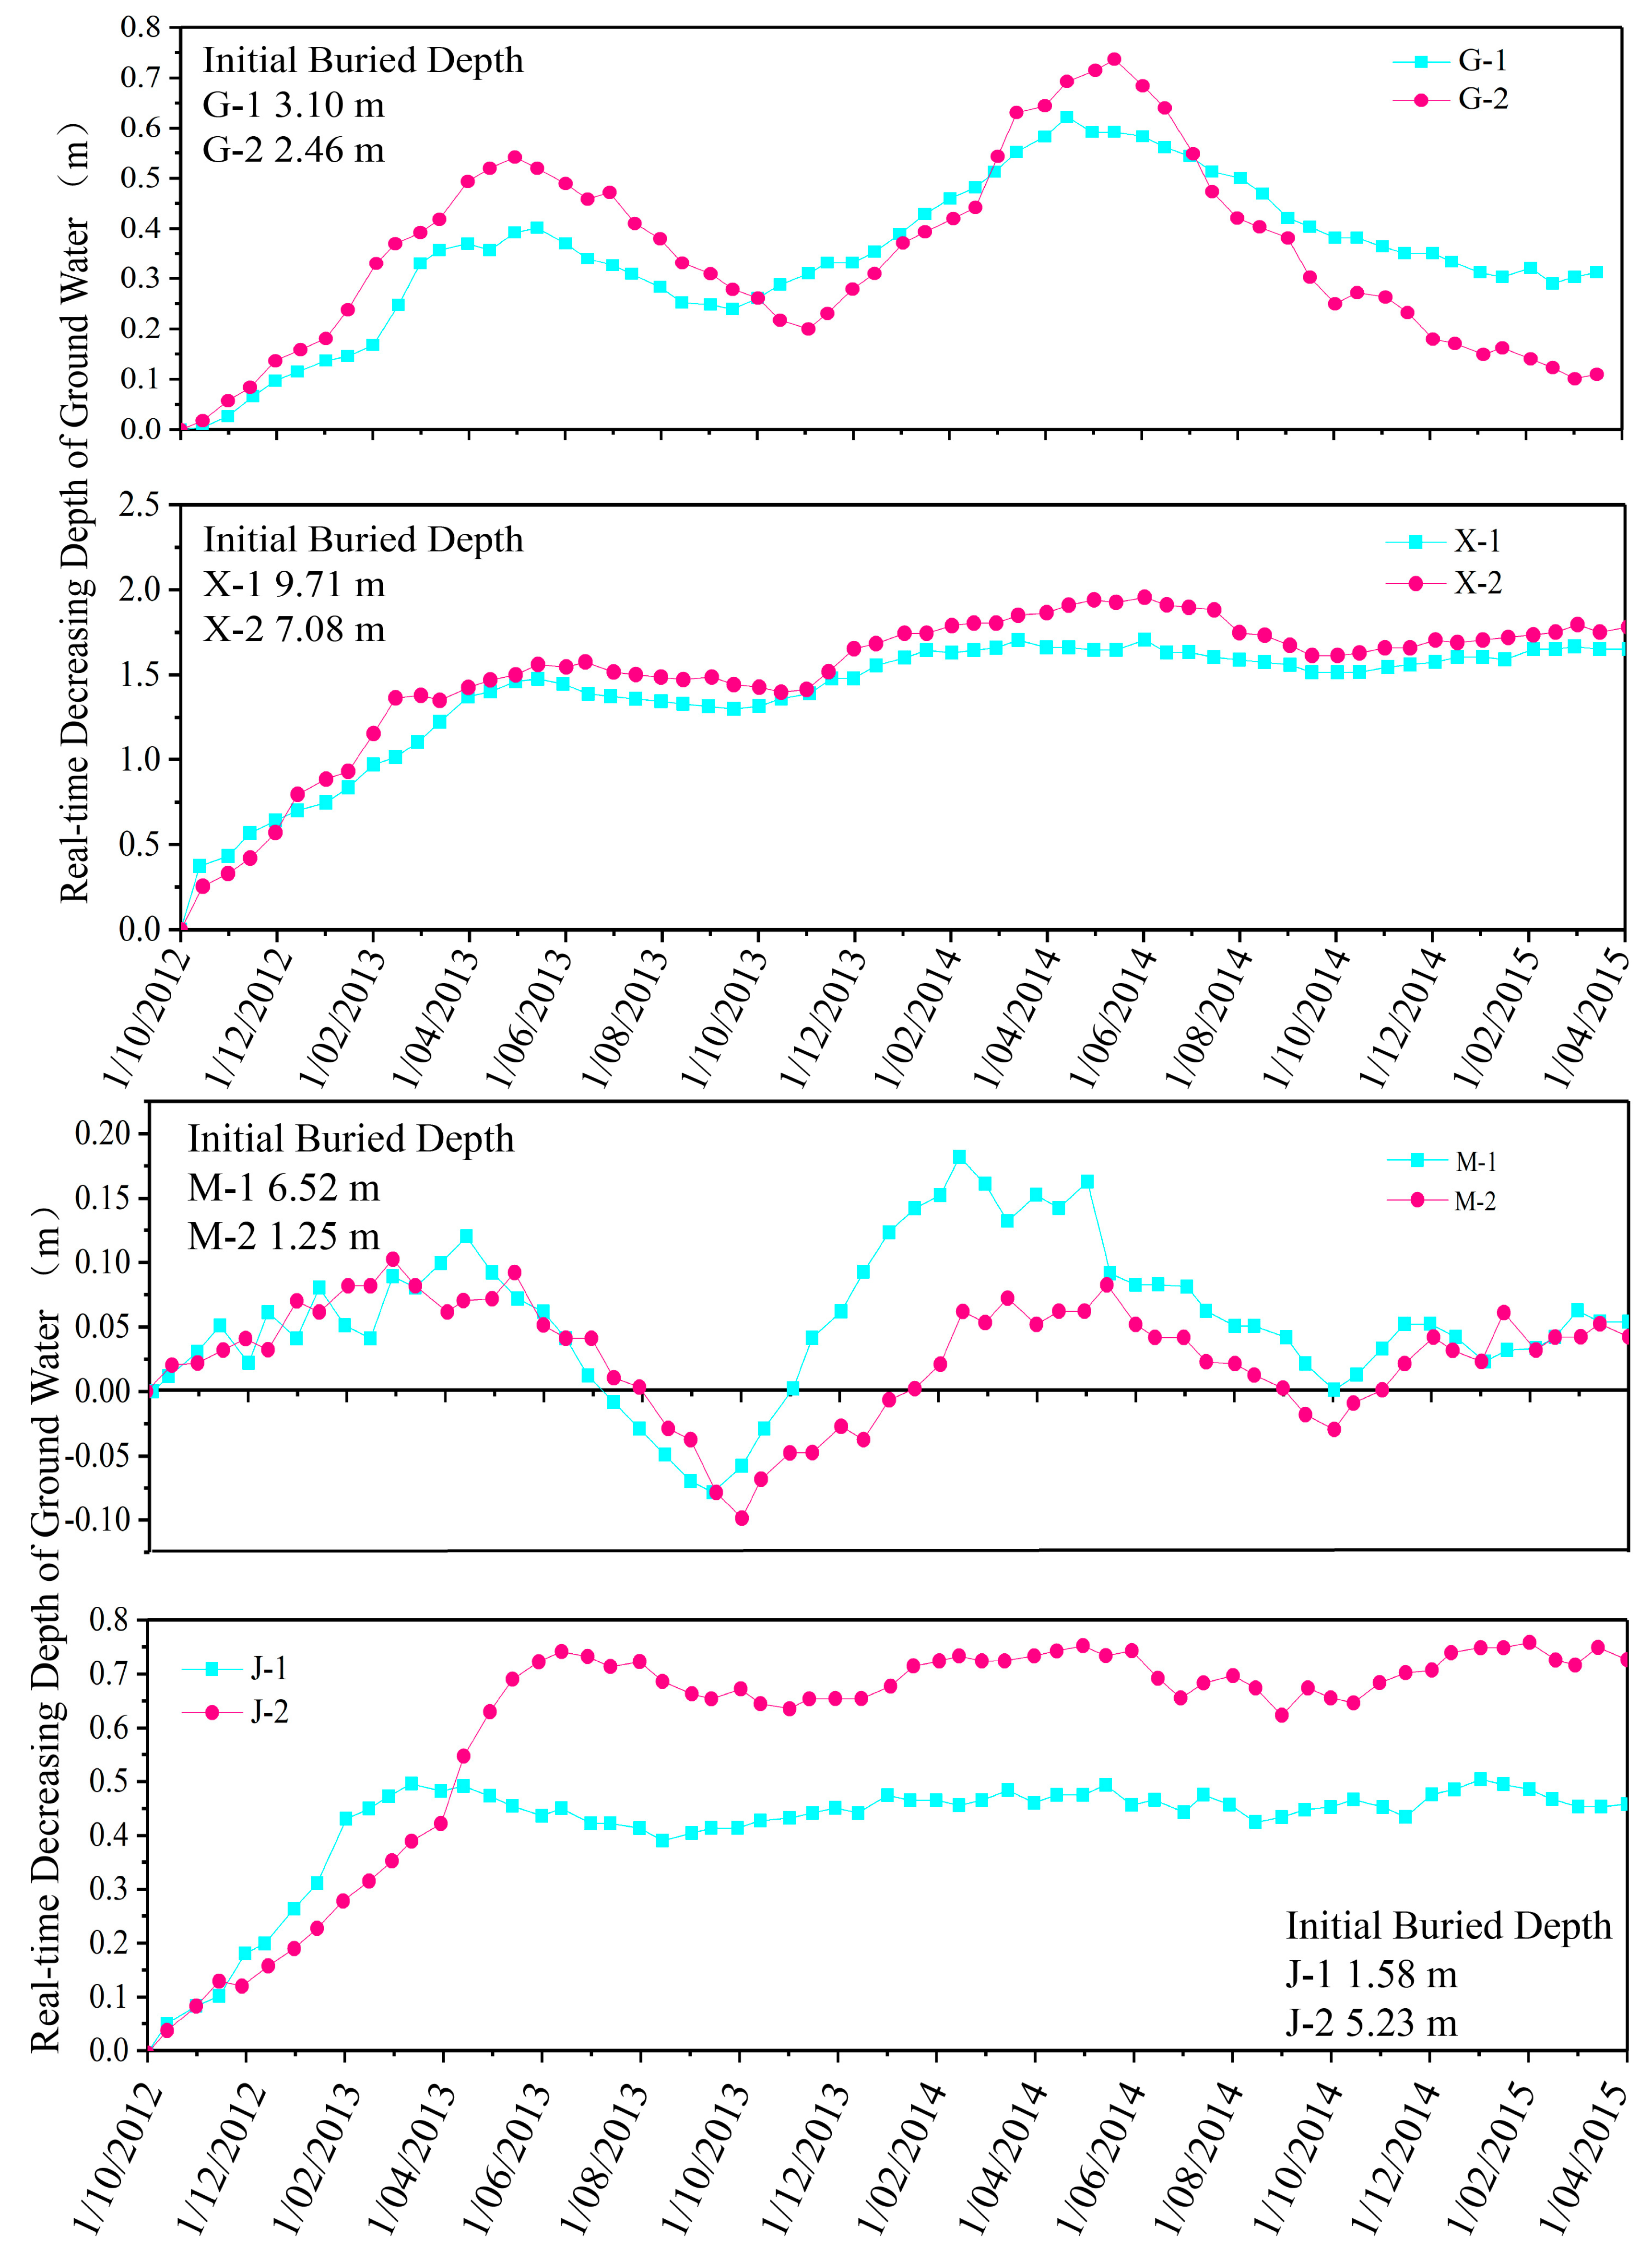
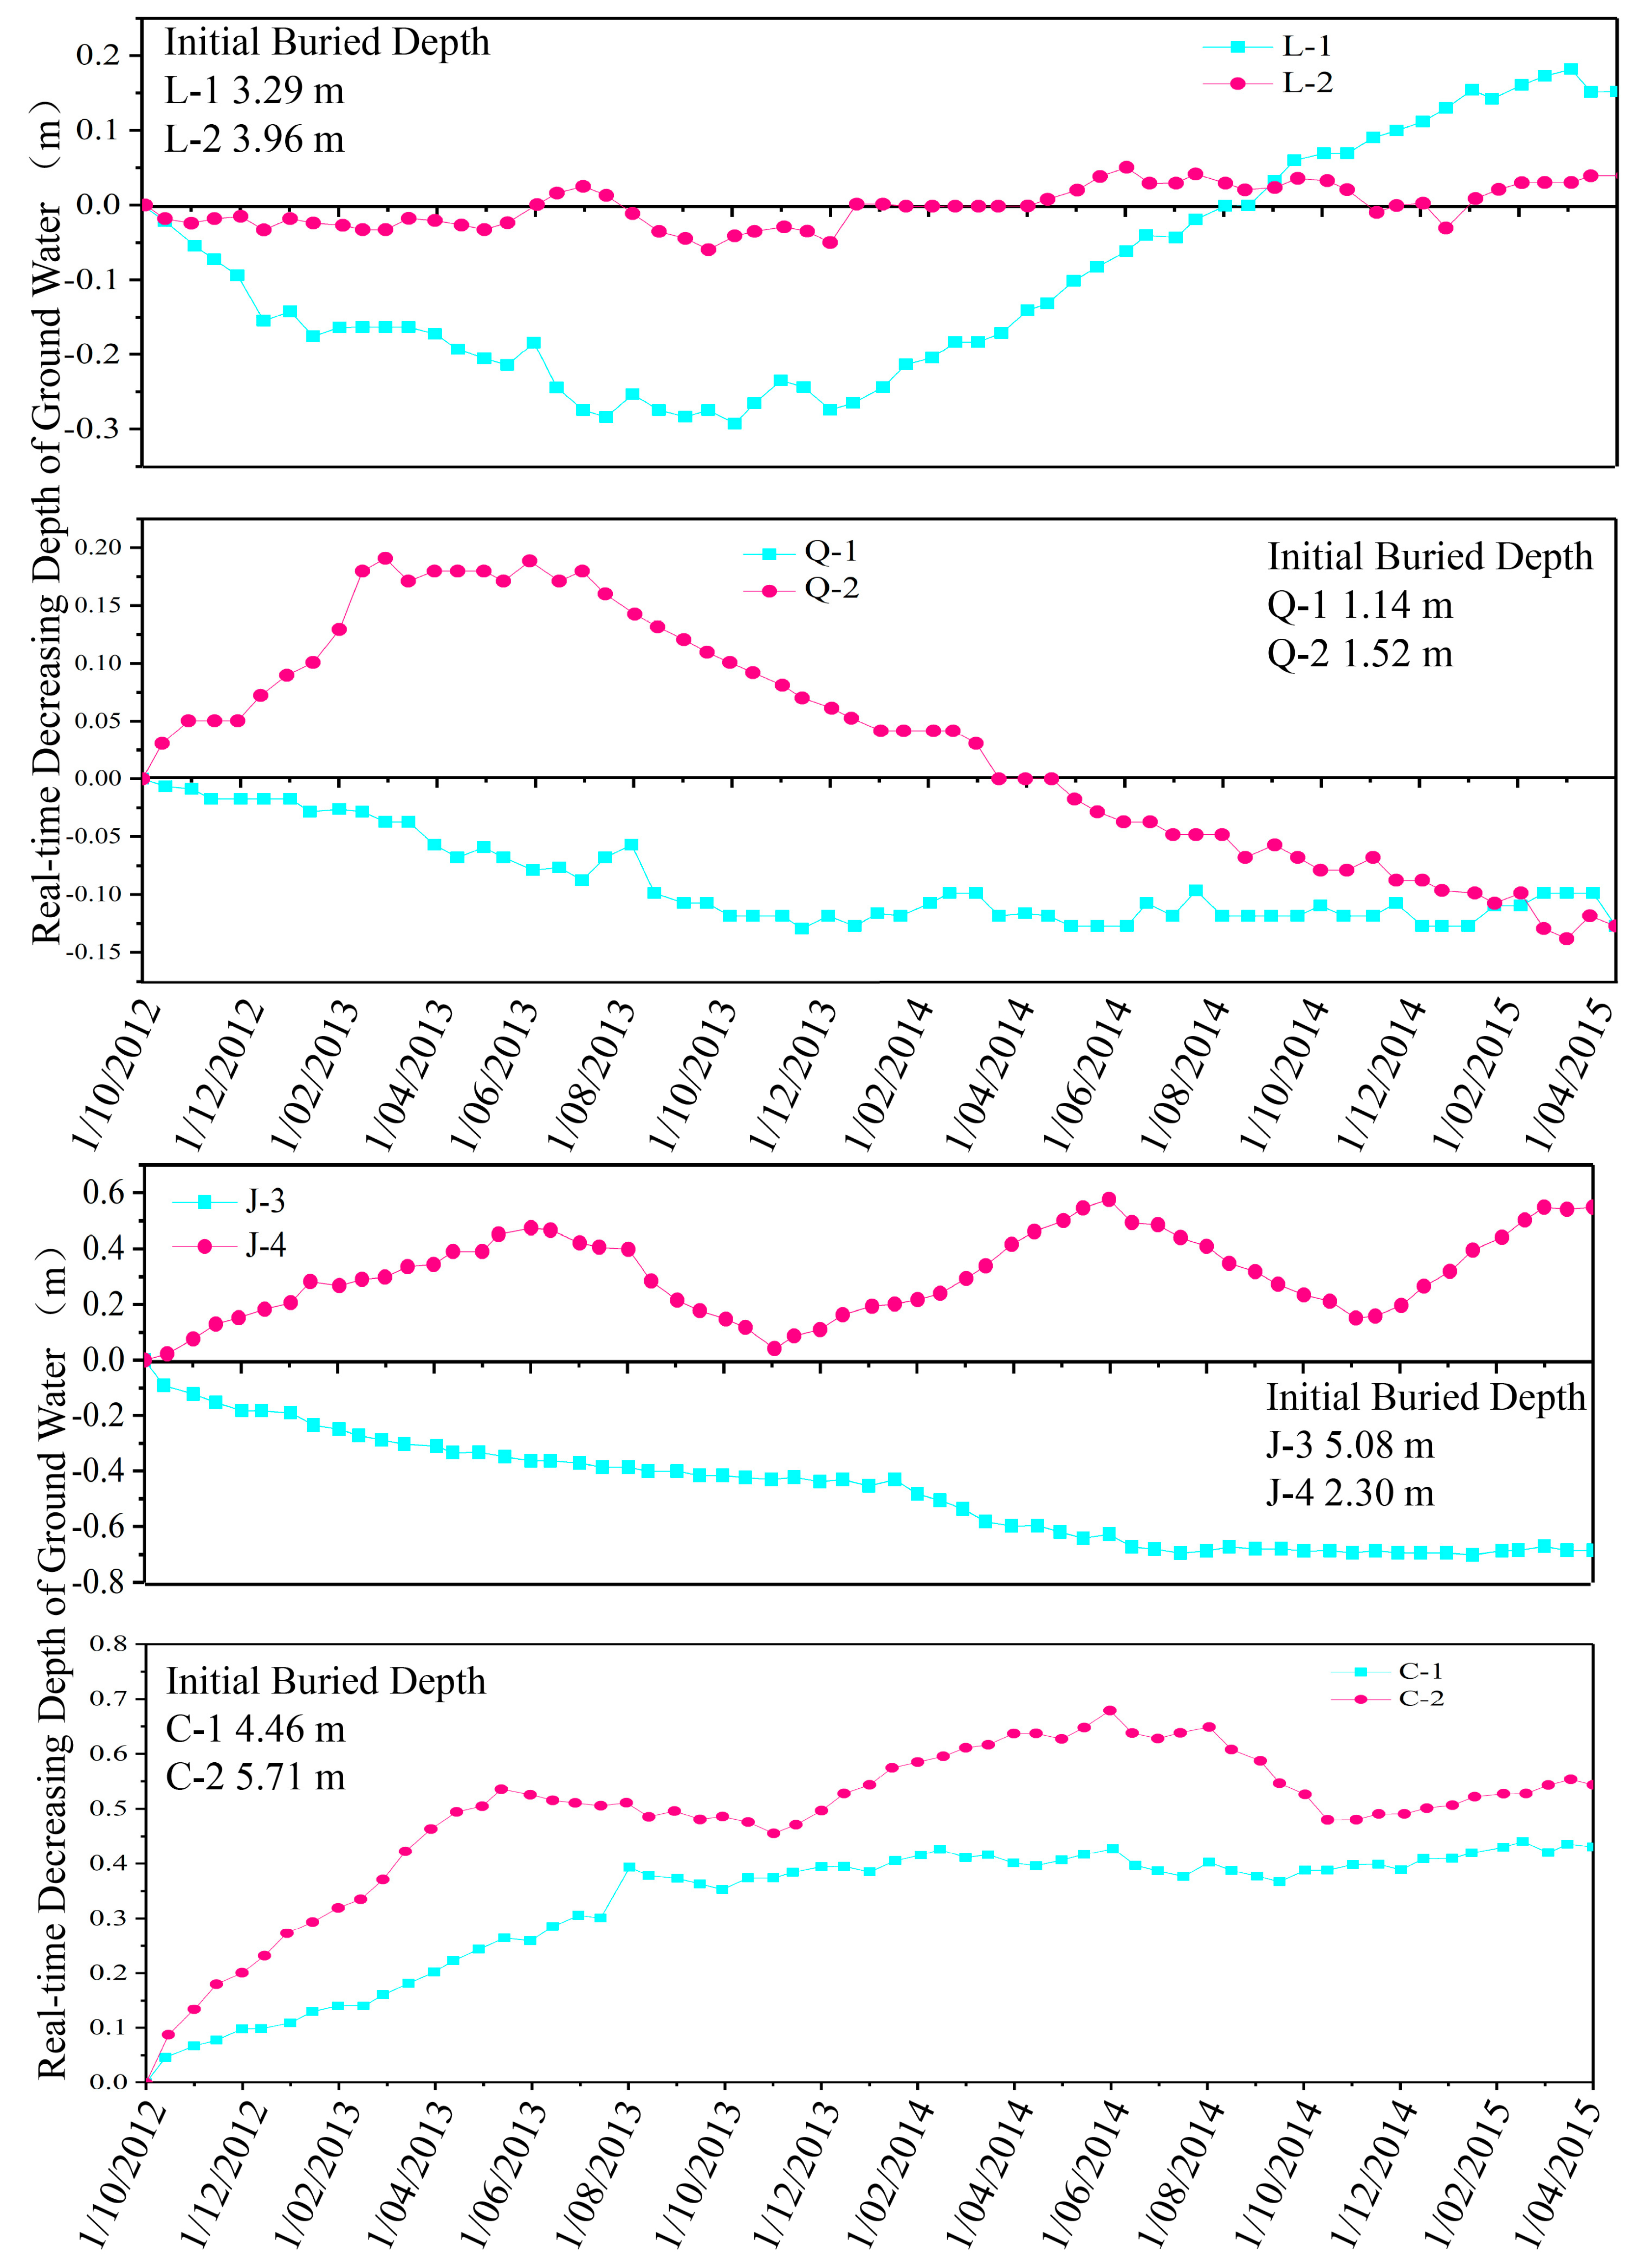
The formation of highway waterfall ice is closely related to the change of the ground water level. In this study, eight monitoring sites at Tongchuan-Huangling Expressway were selected to conduct groundwater monitoring tests. The temperature and frozen depth change of Tongchuan-Huangling expressway is shown in Figure A1. To obtain ground water change statistics, two drill holes were assigned at each monitoring site. The information regarding drill holes is shown in Table 1. The ground water monitoring began when cutting started to excavate, and lasted 2.5 years. The Ground Water Level Monitoring System ZKGD2000-MB was adopted to conduct groundwater monitoring, and the details of the system are shown in Figure 2. The locations of monitoring sites are shown in Figure 3. The monitoring results are shown in Figure 4.
The groundwater monitoring results show that the trend of groundwater level changes of G-1, G-2, M-1, M-2, and J-4 are the same, and the decline and rise of groundwater shows a repeated trend. The reason for this phenomenon is that the ground water level of these test sites is sensitive to rainfall. Therefore, it decreased rapidly due to little rainfall in winter, then, it increased again after heavy rainfall in summer. This type of groundwater level change contributes considerably to the formation of highway waterfall ice in early winter, because the ground water level and its pressure are still high in this period, the scale of waterfall ice is expected to develop rapidly. In contrast, the scale of waterfall ice is expected to remain steady due to little rainfall in deep winter. The ground water level of X-1, X-2, Q-2, J-1, J-2, C-1, and C-2 decreased rapidly after the excavation of cuttings, and then it remained steady. The reason for this phenomenon is that the ground water level of these test sites is sensitive to excavation, and cannot be recharged effectively after ground water levels decrease. Therefore, the scale of highway waterfall ice is always small in these areas. The ground water level of Q-1, J-3 kept increasing during excavation, and kept steady afterwards. The reason is that the groundwater balance was broken after excavation, and perched ground water in the upper part of the mountain continued to flow to the hill foot. Highway waterfall ice in these areas is always difficult to eliminate owing to the continuous supplement of perched ground water. The ground water level of L-1 also increased during excavation, but it decreased after a year because the perched water supplement was insufficient. The ground water level of L-2 did not change during monitoring, hence, waterfall ice hazards did not happen in this area.
From monitoring the results and analysis, it can be seen that the ground water change that results from cutting excavation is the main reason for highway waterfall ice hazards, and the area that can easily get a seasonal rainfall supplement and perched ground water supplement suffers severe waterfall ice hazards. The purpose of monitoring is to explore the relationship between the ground water level change and highway waterfall ice hazards. In this way, an overall understanding of the formation mechanism of highway waterfall ice can be obtained. Furthermore, the monitoring results can give a significant reference on the route design of the expressway in the Tongchuan-Huangling area. More specifically, the route design can avoid the area where the highway waterfall ice hazards are prone to happen according to the ground water level change statistics. Moreover, it is also a new method to evaluate the occurrence possibility of highway water fall ice hazards by using ground water monitoring technology in groundwater-rich areas.

2.2. Laboratory Tests of In-Situ Soil

2.2.1. Gradation Tests and Penetration Tests

According to the above analysis, this study found that the occurrence of waterfall ice was closely related to ground water level change. However, the scale of waterfall ice is directly determined by the permeability of aquifers. Therefore, the gradation test and penetration test were conducted using the soil of aquifers, which were taken from eight monitor sites at Tongchuan-Huangling Expressway. The test equipment for the penetration tests is shown in Figure 5. The penetration test specimens were taken from eight monitoring sites by using the core drilling method [32]. Most of the specimens had difficulty keeping the cylindrical shape because of the high moisture content and the strong weathered property. Furthermore, the soil was disturbed and filled the container before the penetration tests because the diameter of the container (30 cm) was greater than the soil specimens (10 cm). According to the Test Methods of Soils for Highway Engineering (JTG E40-2007) [33], the constant head permeability test was adopted in this research. Before the penetration tests, the soil was put into the container in layers (3 cm/layer), and compacted slightly to control the porosity ratio. After filling one layer, the water-inflow switch opened to saturate the soil layer, and closed when the water level reached the soil layer’s surface. Then, filling the layers stopped when the height of the soil was above the piezometric hole 3–4 cm. After that, the air free water under the temperature of 20 °C was poured into the container from the top to submerge the soil, and until it reached the position of the spilled water hole. After that, the soil was saturated for 24 h before the tests. Then, the penetration tests were conducted under the temperature of 20 °C. In this way, the hydraulic conductivity can be written as k 20 . The tests results are shown in Table 2, among which the grain grade was divided into three groups (fine grained group, medium grained group, and coarse grained group) for convenient analysis.
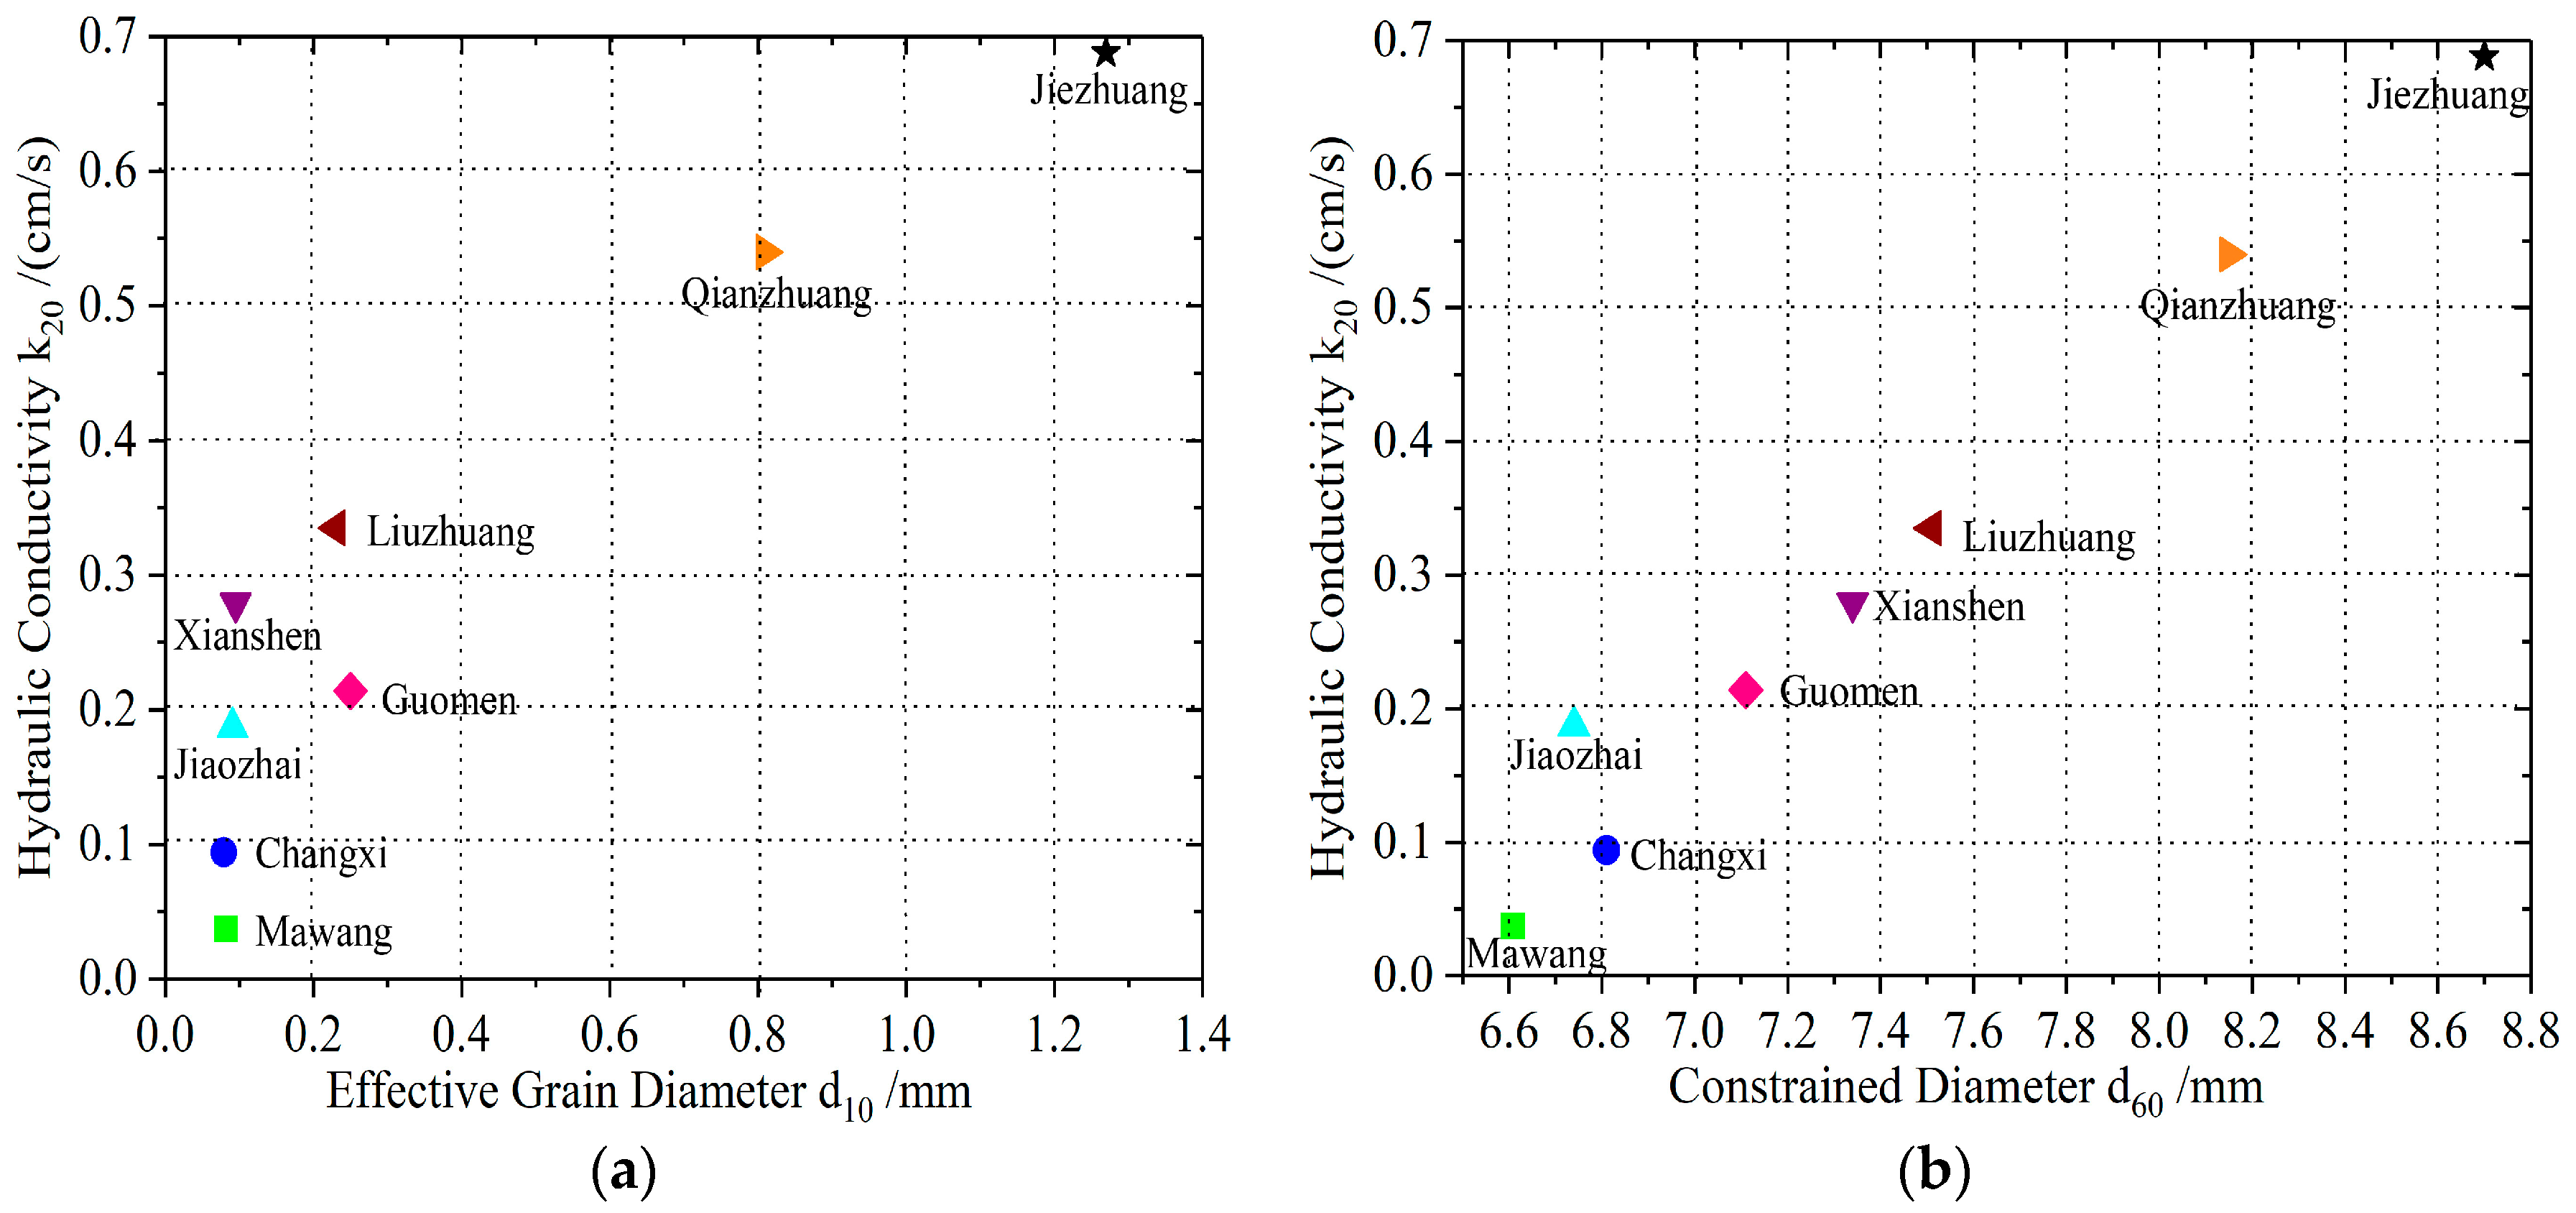
The results show that the medium-sized group’s weight percentage of eight sampling sites was fixed between 17% and 30%, and the variation range was relatively small from Table 2. Therefore, the effective grain diameter d 10 is determined by the fine grained group, and the constrained diameter d 60 is determined by the coarse grained group in these areas. Therefore, the effective grain diameter d 10 and the constrained diameter d 60 can be used as the measurement for the mass of fine grained soil and coarse grained soil, and then these two specific diameters can be used to study the relationship between them and hydraulic conductivity k 20 . The results are shown in Figure 6. It can be seen that a proportional relationship exists between the specific diameters and hydraulic conductivity. According to the particle-size distribution of the aquifer’s soil as shown in Table 2, d 10 increases with the decrease of the fine grained group content, and d 60 increases with the increase of the coarse grained group content. Combining this with the proportional relationship between specific diameters and hydraulic conductivity, it can be seen that the permeability of the aquifer can enhance with the decline of fine-grained particles and the increase of the coarse-grained particles, and the possibility of the occurrence of highway waterfall ice may increase.

2.2.2. Freezing Tests

The above tests indicate that the coarse grain group can enhance the permeability of soil, which leads to highway waterfall ice hazards. In this section, freezing tests were carried out on saturated coarse-grained soil and fine-grained soil separately to explore the formation mechanism of waterfall ice further. The coarse-grained soil was taken from the area where waterfall ice hazards are the most serious, and the typical fine silt of the research site was used as fine grained soil for the tests. The physical characteristics of coarse-grained soil are as follows: Initial density ρ = 1.965   g / cm 3 , maximum dry density ρ d = 2.05   g / cm 3 , and optimum water content ω = 6.8 % . The physical characteristics of fine grained soil are as follows according to laboratory tests: Initial density ρ = 1.489   g / cm 3 , maximum dry density ρ d = 1.734   g / cm 3 , and optimum water content ω = 18.9 % . The grain size composition of coarse grained soil and fine grained soil are shown as Table 3 and Table 4.
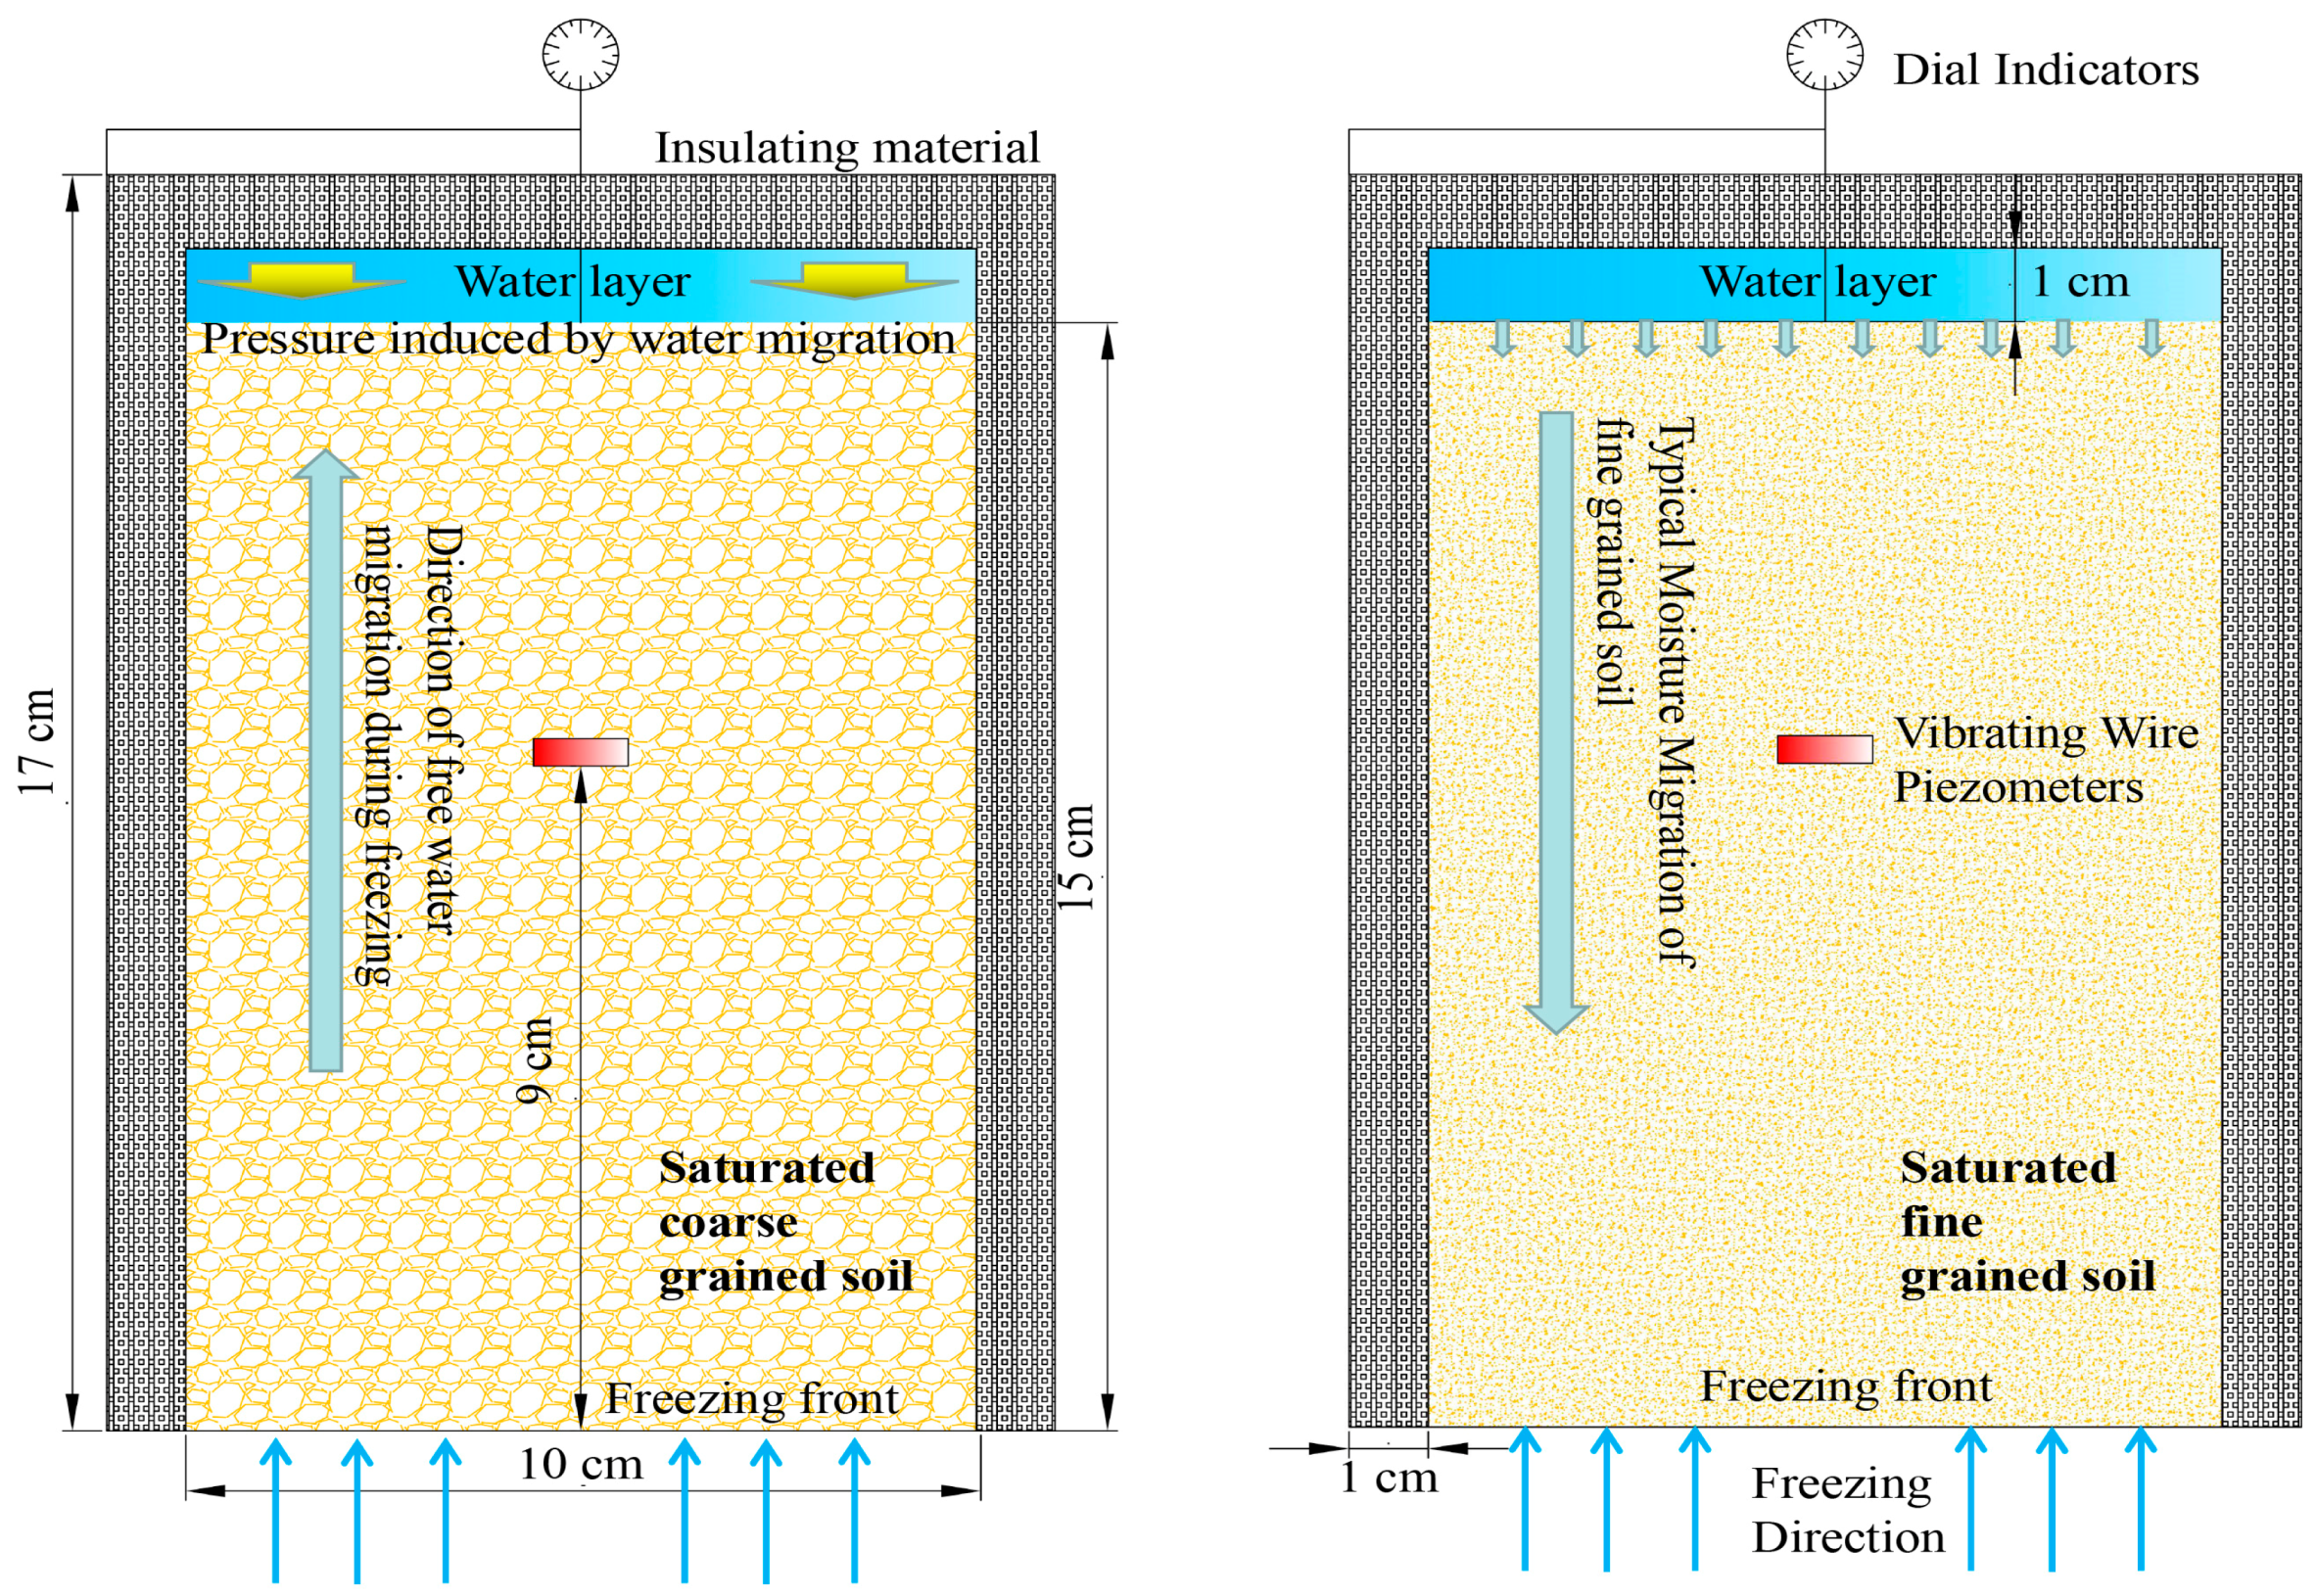
The samples were saturated and consolidated under the pressure of 0.5 MPa before the tests, and after that, the water content of fine grained soil and coarse grained soil were detected, which were 39% and 20%, respectively. Then, the cylindrical specimens with the diameter of 10 cm and the height of 15 cm were made, and the soil was compacted in layers (3 cm/layer). The vibrating wire piezometers were installed into the samples (Figure 7) to test pore pressure. The samples were covered by transparent insulating material without the bottom, and a water layer was at the top to simulate ground water. The details of the experimental design is shown in Figure 7.
The experiment procedure includes two stages as follows:
  • The samples were put into an incubator at the temperature of 1 °C, and lasts for 24 h.
  • The temperature of incubator was set to −10 °C, and began to freeze. The freezing direction was from the bottom to the top. The waterproof thin film with good thermal conductivity was covered at the bottom of the samples to prevent the water seeping from the bottom during freezing. The incubator was opened and the frost-heaving ratio, pore pressure, and water inflow volume were measured (by testing the volume change of water layer) quickly every 2 h. The frost-heaving ratio was measured by dial indicators. The initial volume of the water layer was measured by using vernier caliper to measure the height, and calculated the volume afterwards. The volume change of the water layer was also measured by vernier caliper. As the soil samples were completely saturated during the tests, the downward water migration due to gravity was neglected.
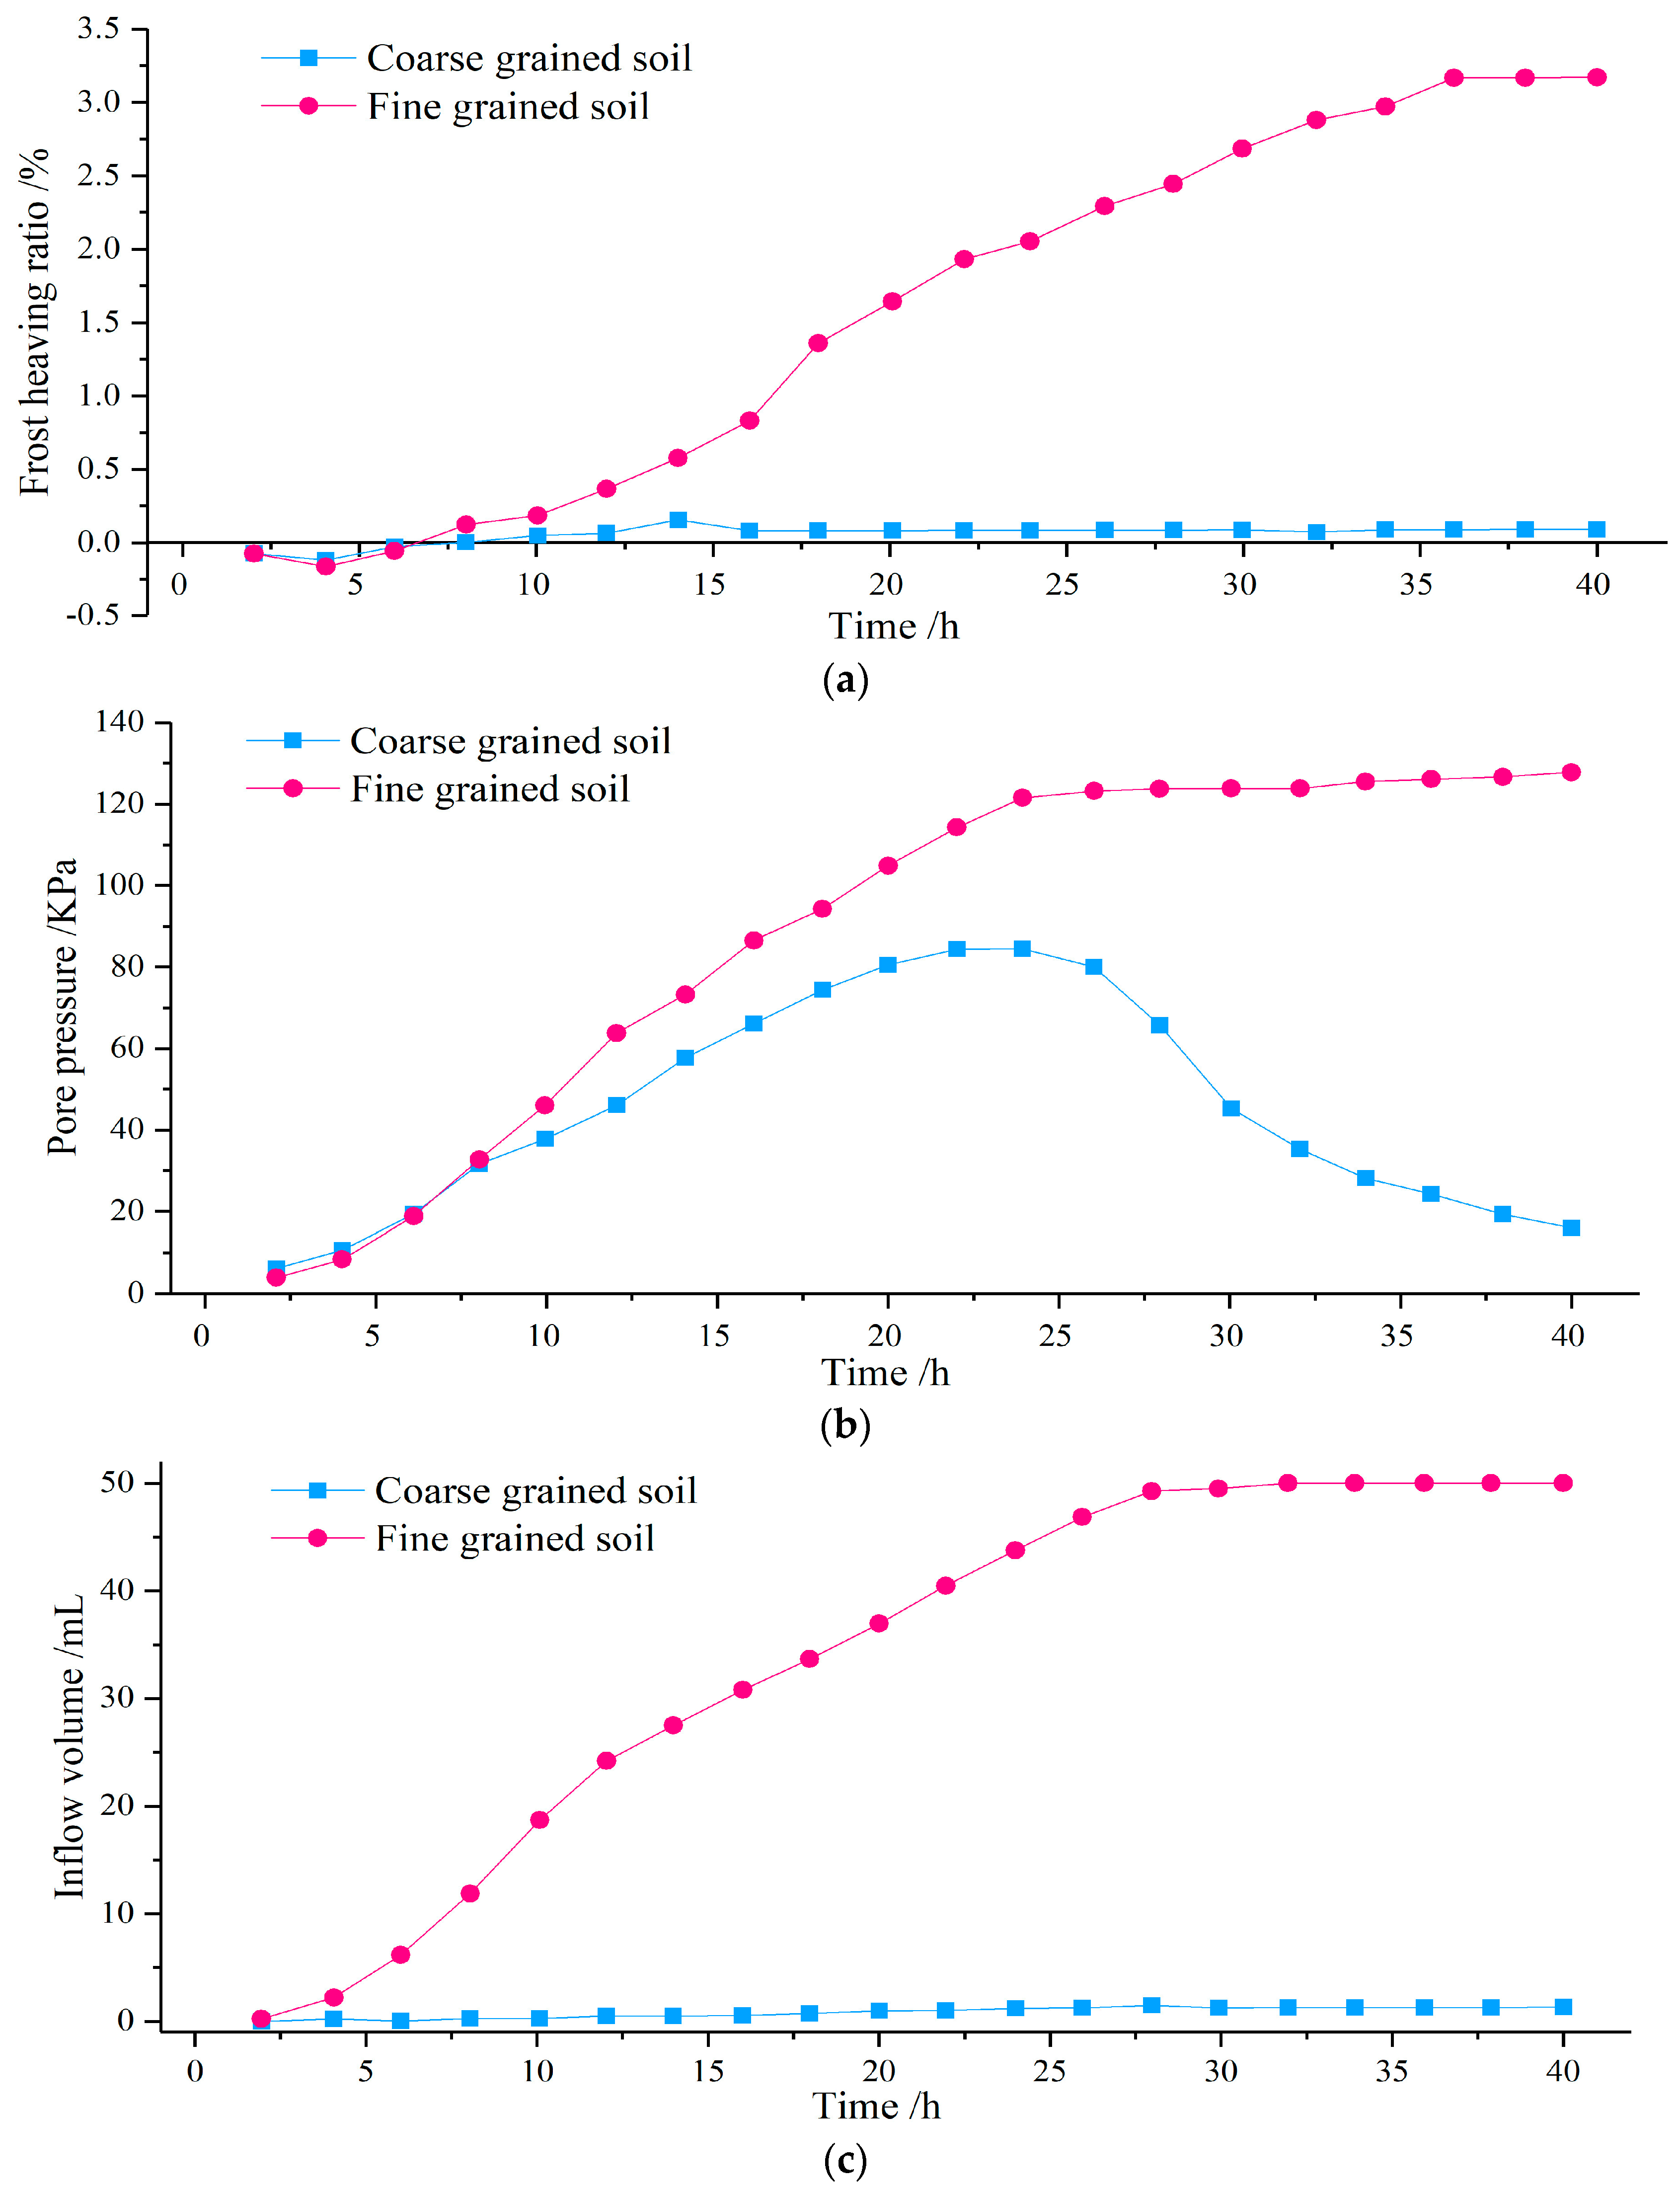
The test results are shown in Figure 8. From test results, it can be seen that the pore pressure of saturated coarse-grained soil increased during freezing conditions, and decreased sharply after reaching the maximum value (84 KPa in this test). The frost heaving ratio and the inflow volume of it were almost zero during the freezing tests. The reason for the phenomena is that the process of free water freeze happened in saturated coarse-grained soil during the freezing test.
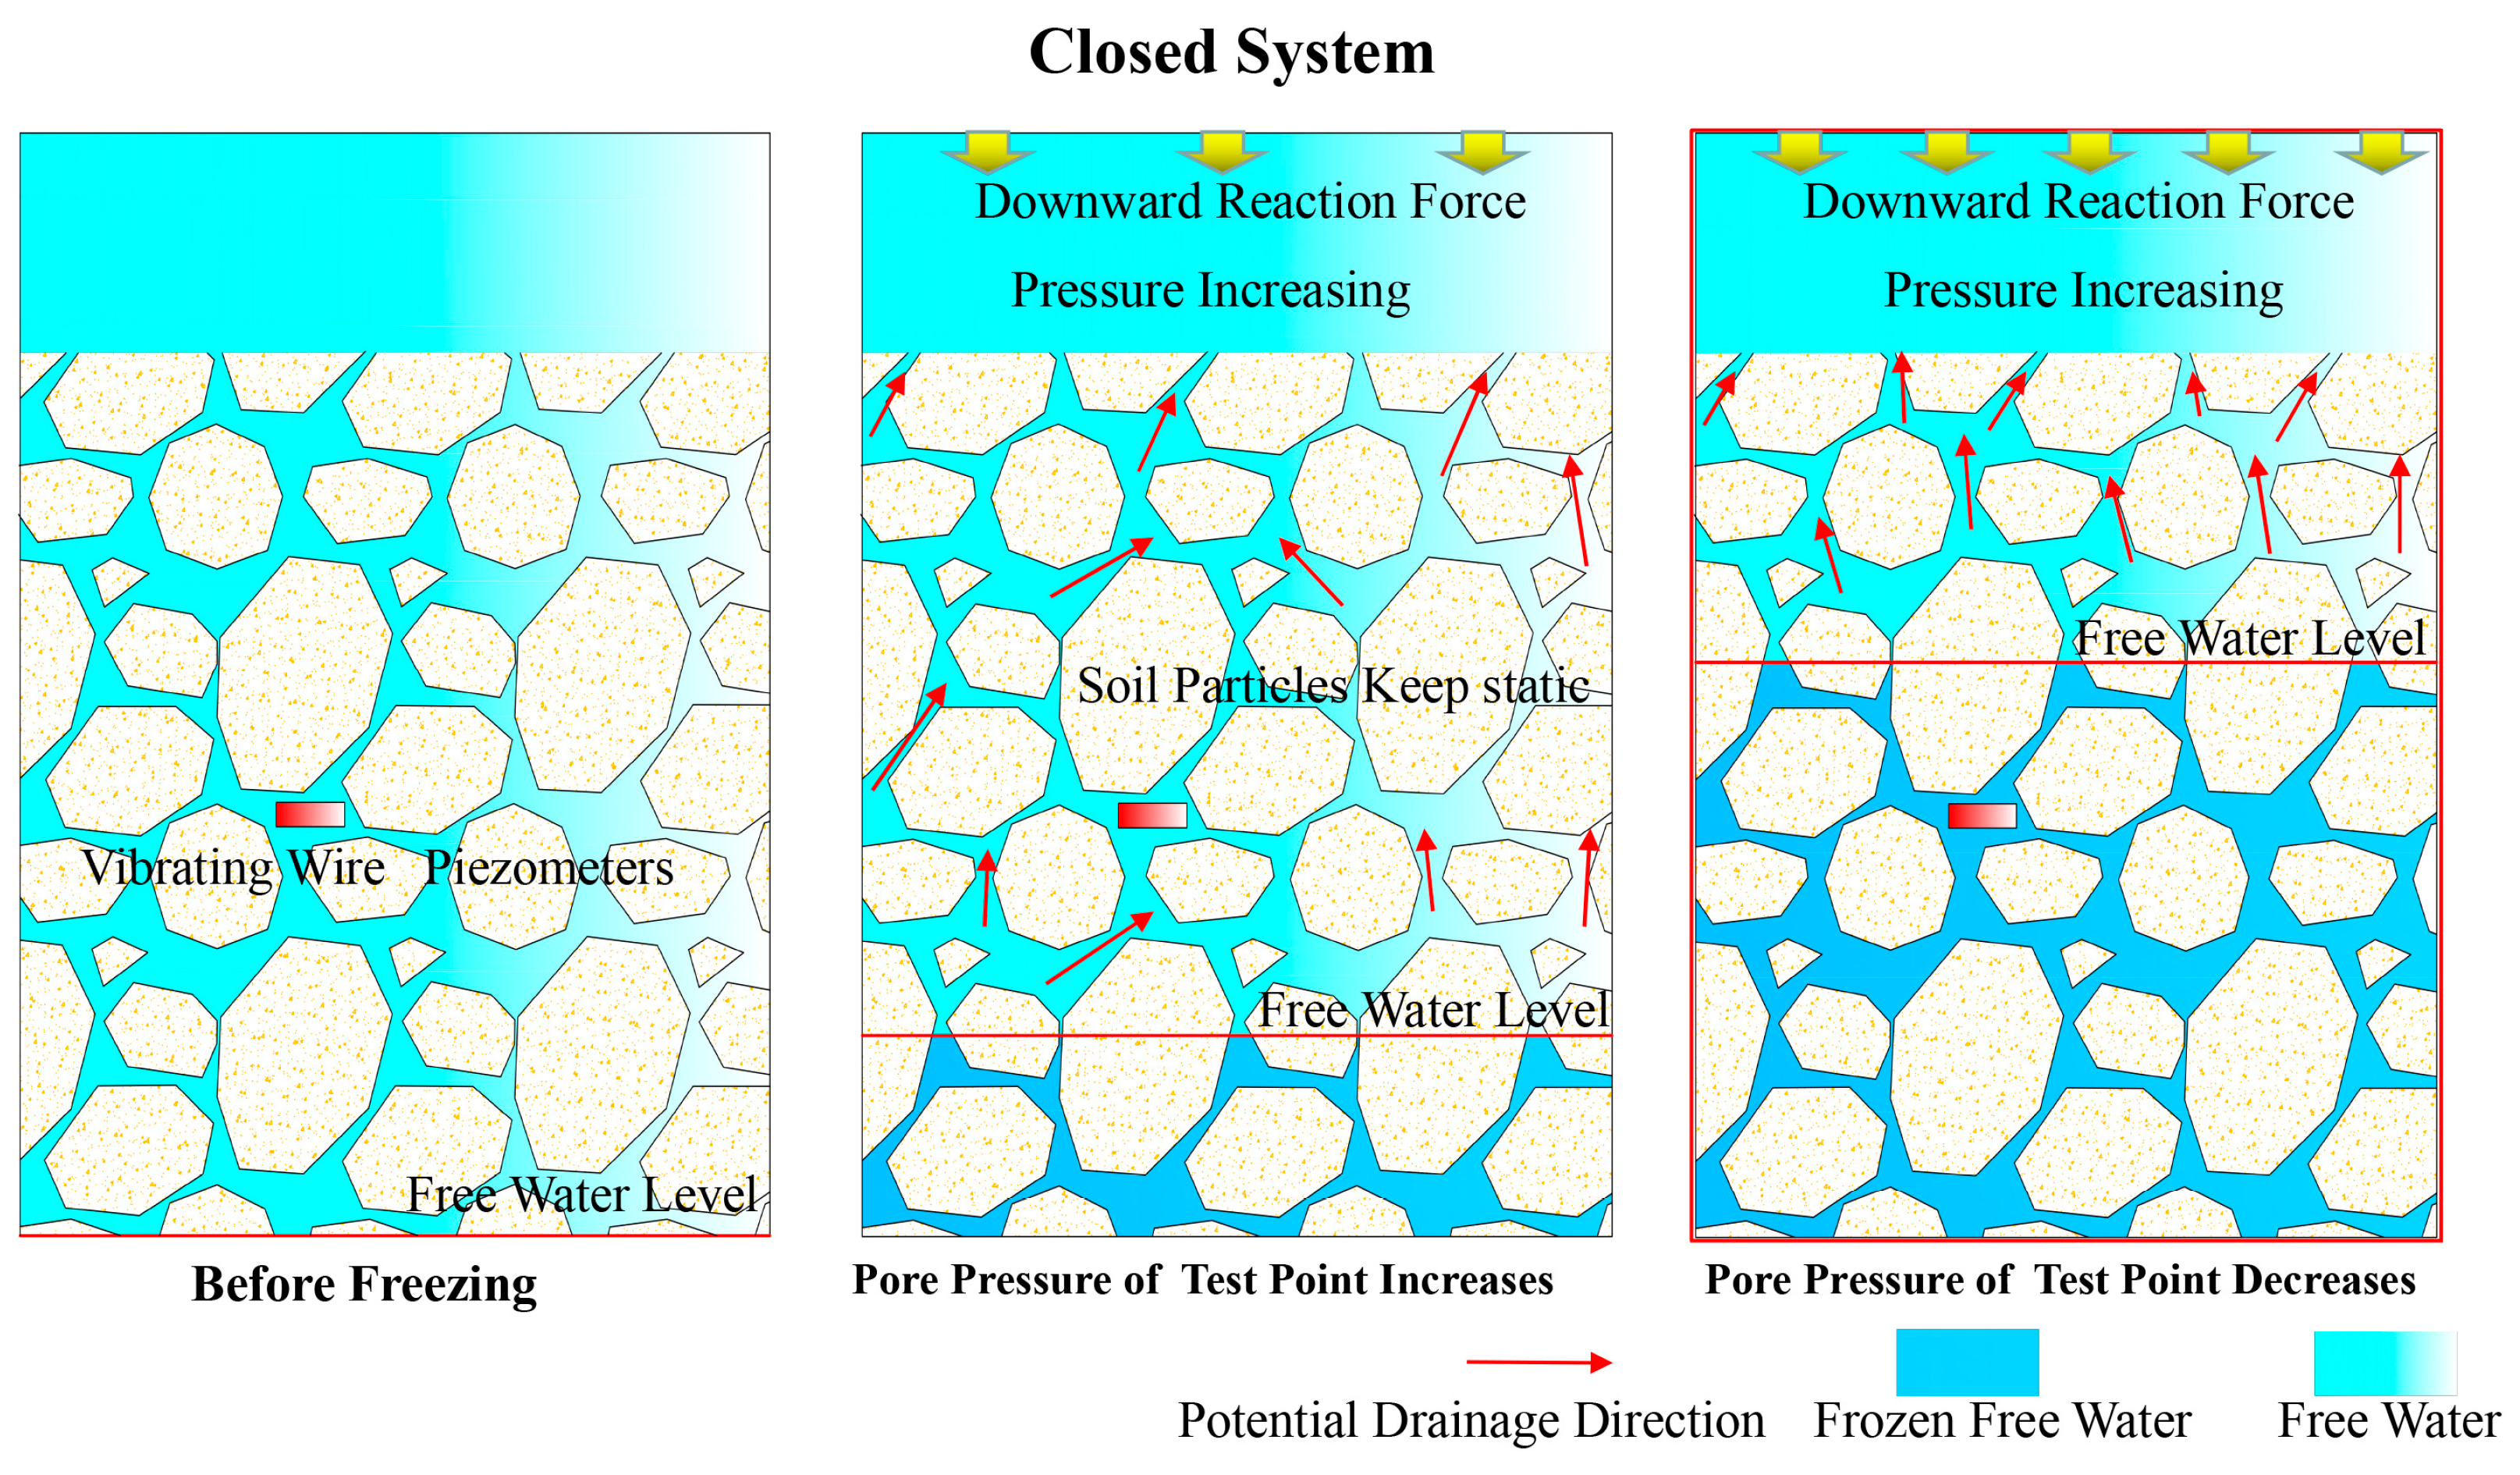
As the volume of free water increases after freezing, the expansive force induced by the volume change can appear in a closed system, and the pore pressure of the part that do not freeze is expected to increase. When considering water migration, during the freezing process from the bottom to the top, the volume change of frozen free-water in coarse grained soil leads to increasing the free water level above the freezing surface. Therefore, the downward reaction force emerges at the top of the experimental container, then, the pore pressure of the test point increases. With the increase of the frozen depth, the position of the vibrating wire piezometer gradually freezes. Therefore, the downward reaction force cannot transfer to the position of the vibrating wire piezometer completely. Then, the pore pressure decreases. The microscopic freezing process of saturated coarse grained soil is shown in Figure 9. Moreover, this frozen mode of free water in coarse-grained soil made the inflow volume almost zero.
As mentioned above, the process of free water freeze happened in saturated coarse-grained soil during the freezing test. Therefore, the freezing process of the water in the coarse-grained soil is independent of soil particles, and this process leads to the upward drainage of the part that do not freeze. Although the whole tests were conducted in a closed system, and the drainage did not happen, the water pressure did not apply to the soil particles. In contrast, the pressure applied to the top part of the insulating material due to the potential drainage trend as shown in Figure 9. Therefore, if the soil is kept static, the frost heave is not expected to happen. The frost heaving ratio, the pore pressure, and the inflow volume of saturated fine-grained soil increased when it was freezing, and then kept steady after reaching maximum values (3.2%, 127.8 Kpa, and 50 mL, respectively). The reason for the phenomena is that the pore water in fine-grained soil belongs to weak-bound water, and moisture migration from the top to the freezing front happened when it was freezing. This migration led to the water content increasing near the freezing front. Therefore, the frost heaving happened. Furthermore, the moisture migration also induced the water inflow and increased pore pressure. After the position of the vibrating wire piezometer froze, the pore pressure induced by the weak-bound water was not be influenced by the moisture migration, therefore, it kept steady. The restriction effect of the experimental container may result in the appearance of steady stages of frost heaving and inflow volume.
Moreover, for saturated coarse grained soil, it can be seen from the test results that the decreasing speed of the pore pressure was becoming slow when the freezing process conducted 30 h, and kept stable at the end of the test. This means that at the end of the test, the position of the vibrating wire piezometer was completely frozen, and no reaction force was transferred to the position of the vibrating wire piezometer. Therefore, when the pore water around the vibrating wire piezometers was frozen, the pore pressure of saturated coarse grained soil was approximately 13 KPa (40 h) as shown in Figure 8. For saturated fine grained soil, the pore pressure kept stable when the freezing process was conducted at 23 h. Further, after the position of the vibrating wire piezometer froze, the pore pressure induced by the weak-bound water was not influenced by the moisture migration, therefore, it kept steady. Hence, when the pore water around the vibrating wire piezometers was frozen, the pore pressure of saturated fine grained soil was approximately 124 KPa. However, it can be seen that the sharp decrease of the pore pressure of saturated coarse grained soil and the pore pressure stable stage of saturated fine grained soil happened at the same time from the pore pressure curves. This phenomenon means that the freezing speed of saturated coarse grained soil and fine grained soil is almost the same. More specifically, the freezing of the position of the vibrating wire piezometer happened at 23 h for these two test specimens.
From the above tests, it can be seen that the coarse-grained soil has strong water permeability, and it is the major aquifer’s soil in the area of waterfall ice hazards. Furthermore, if the drainage is blocked, the pore pressure of coarse-grained soil increases rapidly. Considering actual engineering, a frozen cutting surface can block the drainage of ground water, and then, the water pressure increases and squeezes out from the weak surface, and waterfall ice forms. Therefore, the aquifer with saturated coarse-grained soil is the internal condition that leads to highway waterfall ice.

3. Mathematical Model in Investigating Waterfall Ice

The percolation theory has the advantage of analyzing the frozen procedure of soil only focusing on temperature and pressure [34]. This theory is usually adopted for research on saturated fine-grained soil. Therefore, some theorems are reliable when establishing a mathematical model of saturated fine-grained soil. In this study, the frozen model of saturated fine-grained soil was established first. Following this, the freezing model of saturated coarse-grained soil was established based on the fine-grained soil model.

3.1. Freezing Model of Saturated Fine-Grained Soil

The moisture migration happens in fine-grained soil during freezing conditions. The microcosmic process of moisture migration is described only considering two-dimensional cases in Figure 10.
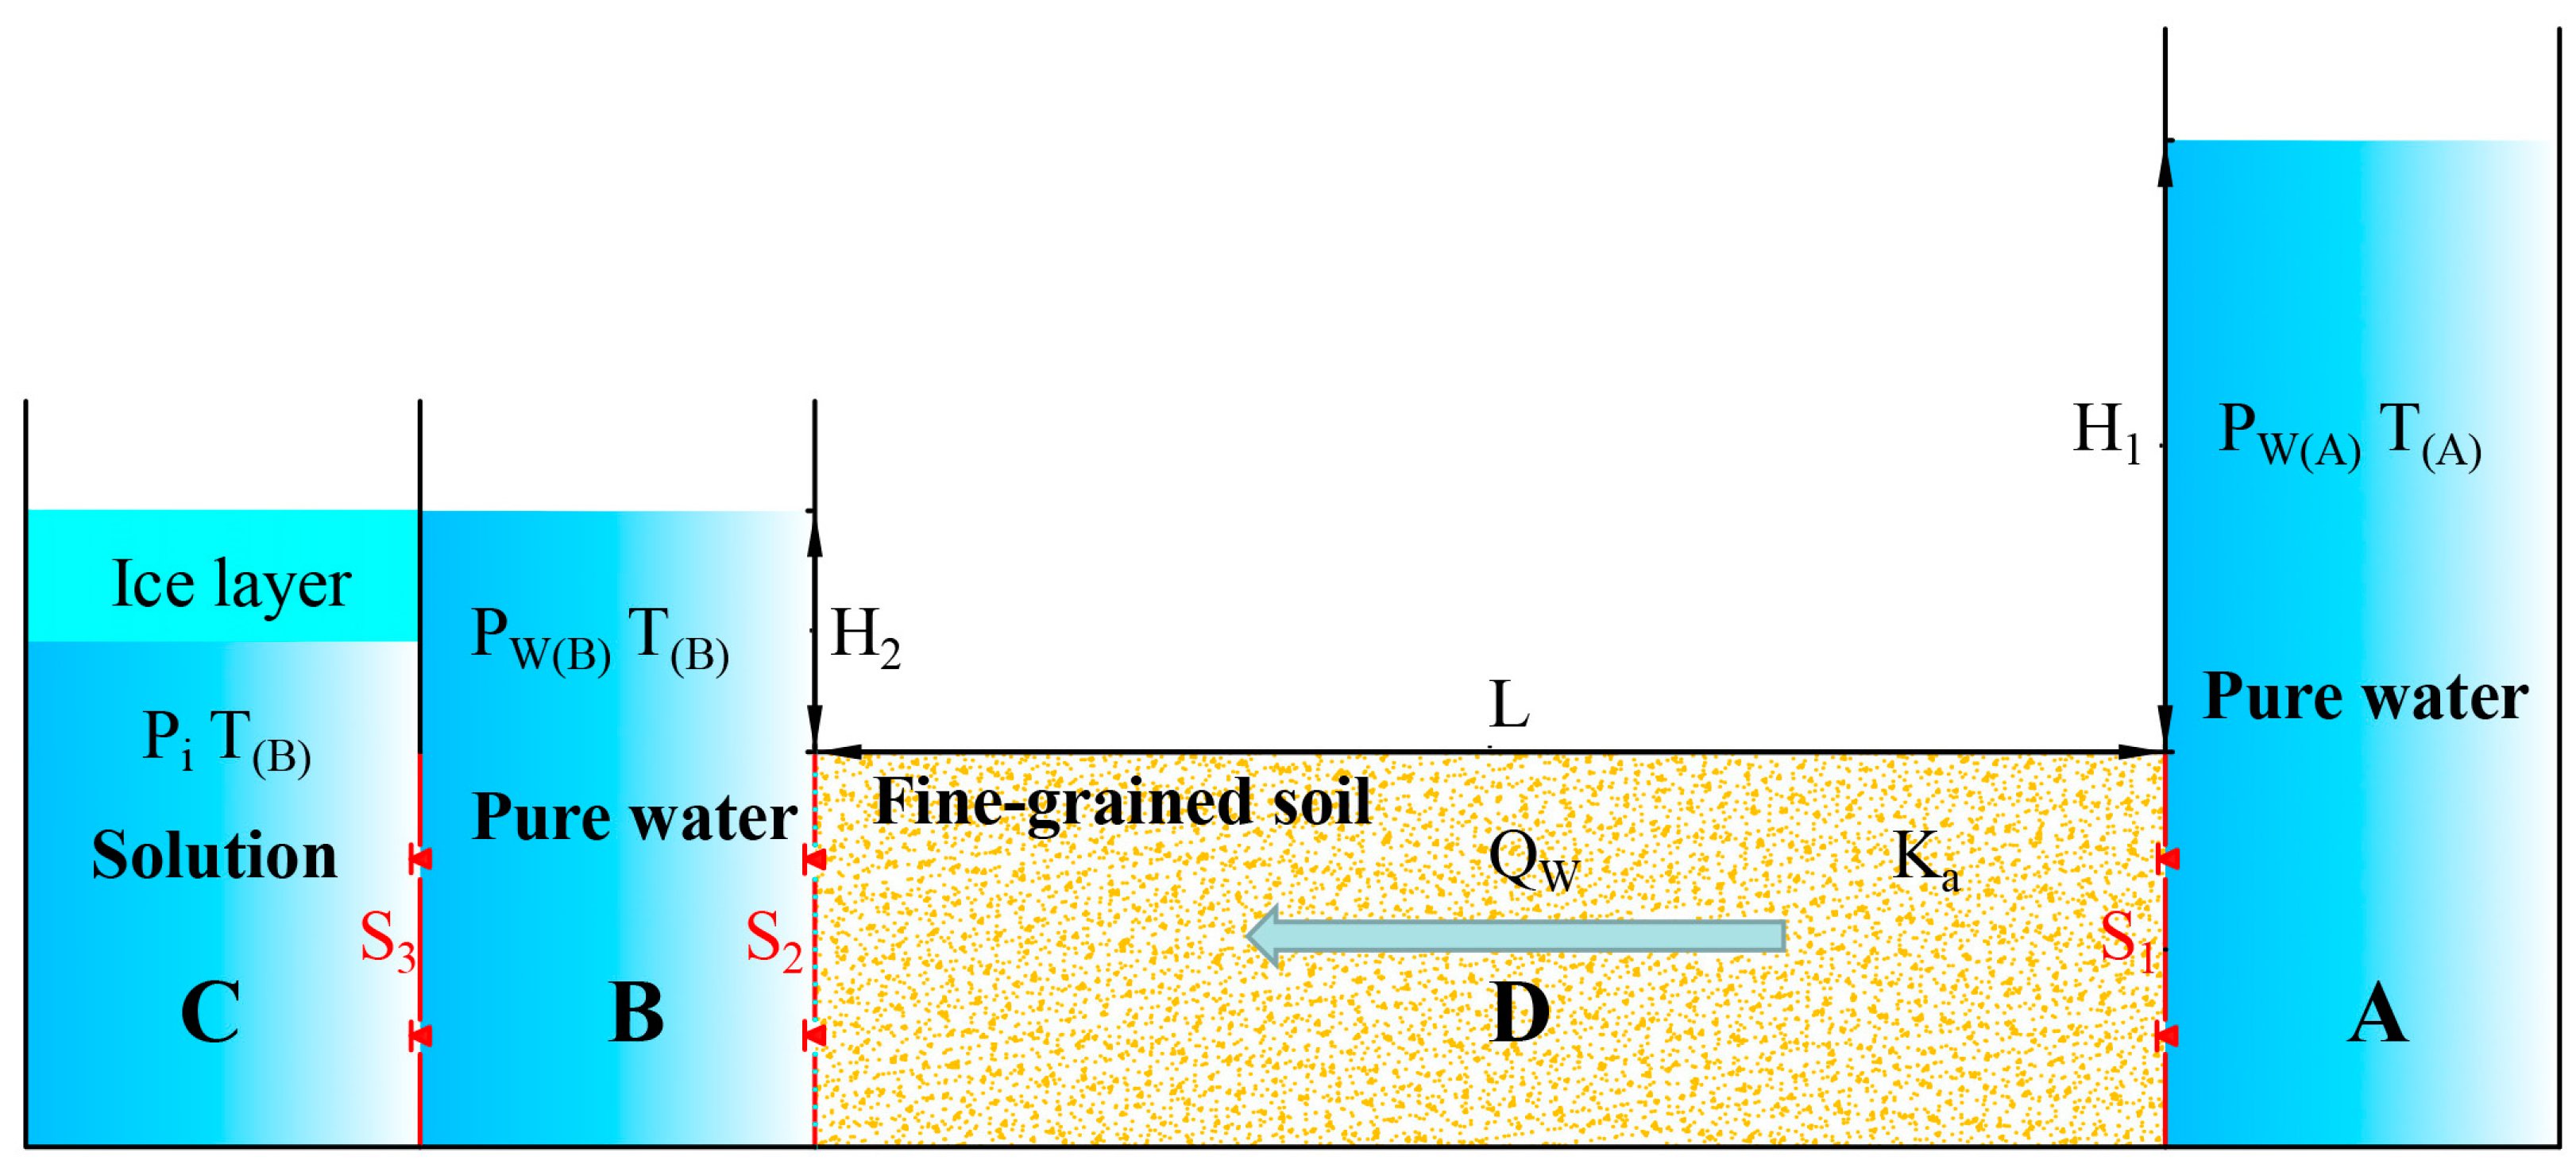
As shown in Figure 10, the water transfers from point A to Point B during freezing conditions. The pressure and temperature of point A are described as P W ( A ) and T ( A ) , respectively. The pressure and temperature of point B are described as P W ( B ) and T ( B ) , respectively. Generally, the hydraulic conductivity K a depends on the composition of soil particles and the temperature in soil. To simplify the calculation, the hydraulic conductivity between point A and point B is assumed to be the same. Point C at the freezing front, and the pressure is expressed as P i , which is related to the overburden load. To illustrate the effect of osmotic pressure on water migration, a simplified theoretical freezing model of fine-grained soil was established as shown in Figure 11. The theoretical model consists of 4 parts: Part A, part B, part C, and part D. The parts are separated by three semipermeable membranes, which are named S1, S2, and S3, respectively. Part A and Part B contains pure water, and the temperatures of them are T ( A ) and T ( B ) , respectively. The pressure of Part A and Part B are P W ( A ) and P W ( B ) , respectively. Part C contains the solution, and the concentration of it increases with the volume of the ice layer increasing. Part D is fine-grained soil. To apply the thermodynamic equilibrium theory, the pressure of the solution in Part C is assumed to keep balance with pure water in Part B. In this way, the osmotic pressure Ψ ( B )   can be defined as Equation (1).
Ψ ( B ) = P i P w ( B )
The moisture migration of soil is induced by the pressure difference between Part A and Part B. The volume of flow ( Q w ) can be described as Equation (2) based on Darcy’s Law:
Q w = K a A H 2 H 1 L = K a A I = K a A ρ g H 2 ρ g H 1 ρ g L = K a A P W ( B ) P W ( A ) ρ g L
where ρ represents density, I represents the hydraulic gradient, and A represents inflow area.
Therefore, the rate of flow ( q w ) can be obtained as Equation (3):
q w = K a P W ( B ) P W ( A ) ρ g L
According to Equations (1) and (3), the osmotic pressure can be described as Equation (4):
Ψ ( B ) = P i P W ( A ) + q w ρ g l K a
As the simplified theoretical model belongs to a closed system, when the ice layer and the solution of Part-C are at the state of the phase transition equilibrium, the chemical potential of ice ( μ i ) is equal to the chemical potential of the solution ( μ s ) according to the first law of thermodynamics. To keep this balance, the change of μ i is always equal to the change of μ s as shown in Equation (5):
d μ s ( P , ψ , T ) = d μ i ( P , T )
where P represents the pressure, ψ represents osmotic pressure, and T represents temperature.
According to the second law of thermodynamics, the expressions of d μ w and d μ i are shown in Equations (6) and (7):
d μ i = V i d P S i d T
d μ s   =   V s d P V s d ψ S s d T
where V represents the specific volume and S represents the specific entropy (ratio of heat absorbed or released by the system to corresponding temperature). V i represents the specific volume of ice, V s represents the specific volume of solution, S i represents the specific entropy of ice, and S s represents the specific entropy of solution.
The integrating Equation (5) from the initial state (P = P0, ψ 0 = 0 , and T = T0) to the end state (Pi, ψ ( B ) , and T(B)), the expression is shown in Equation (8):
P 0 , ψ 0 , T 0 P i , Ψ ( B ) , T ( B )   V i d P S i d T   d p d ψ d T = P 0 , ψ 0 , T 0 P i , Ψ ( B ) , T ( B )   V s d P V s d ψ S s d T   d p d ψ d T
where P0 represents atmospheric pressure, T 0 = 276 k ;
The calculation result of Equation (8) is obtained as shown in Equation (9):
( V S V i ) ( P i P 0 ) ( S S S i ) ( T ( B ) T 0 ) =   V S ( Ψ ( B ) Ψ 0 )
As mentioned above, ψ 0 = 0 , and the specific entropy change can be described as the ratio of the internal energy change ( Q ) to the temperature of the phase transition as shown in Equation (10):
S S S i = Q / T 0
Therefore, by combining Equations (9) and (10), the expression of osmotic pressure Ψ ( B ) can be obtained as shown in Equation (11):
Ψ ( B ) = ( V s V i ) V s ( P i P 0 ) Q V s T 0 ( T ( B ) T 0 )
when the phase transition keeps equilibrium, which means that the ice layers do not change, the rate of flow q w = 0 , and Equation (12) can be obtained by Equation (3):
P W ( A ) = P W ( B )
Then, by combing Equations (1), (11) and (12), the osmotic pressure at the state of phase transition equilibrium ( ψ ¯ ( B ) ) can be obtained as shown in Equation (13):
ψ ¯ ( B ) = ( V S V i ) V i ( P W ( A ) P 0 ) Q V i T 0 ( ( T ( B ) T 0 )
According to above analysis, the mathematical frozen model of saturated fine-grained soil is obtained as shown in Equations (4), (11) and (13).

3.2. Freezing Model of Saturated Coarse-Grained Soil

There is no weak-bound water exists in saturated coarse-grained soil, therefore, the moisture migration cannot happen during freezing conditions, which means that there is no osmotic pressure ( ψ ¯ ( B ) = 0 ) at the state of the phase transition equilibrium of saturated coarse-grained soil. At the same time, although the percolation theory cannot be fully be applied to the saturated coarse grained soil, the freezing process of saturated coarse grained soil and saturated fine grained soil both obey the first law of thermodynamics and the second law of thermodynamics. Therefore, considering saturated coarse grained soil or fine grained soil, the chemical potential of ice ( μ i ) is always equal to the chemical potential of the solution ( μ s ) when the ice layer and the water are at the state of the phase transition equilibrium in a closed system (This equation has nothing to do with the percolation theory). Therefore, Equations (5)–(7) can also be applied to saturated coarse grained soil. However, to give physical meaning to equations (there is no mathematical expression to describe the phase transition equilibrium of saturated coarse-grained soil), the frozen model of saturated fine-grained soil was established first as shown in Equation (13). Although the model includes osmotic pressure ψ ¯ ( B ) , it is a independent variable during mathematical integral. Therefore, the mathematical model of Equation (13) can extend to saturated coarse-grained soil when ψ ¯ ( B ) = 0 as shown in Equation (14).
P W ( A ) P 0 T ( B ) T 0 = Q [ T 0 ( V S V i ) ]
It can be seen that the formula does not include the parameters of the soil ( K a ,   L ), and the osmotic pressure ψ ¯ ( B ) = 0 . Therefore, the freezing model of saturated coarse-grained soil in a closed system cannot be influenced by the properties of the soil. Furthermore, it can be seen that Equation (14) is highly similar to the Clapeyron equation as shown in Equation (15). The Clapeyron equation can be applied to any pure substances at the state of the phase transition equilibrium.
d P d T = Q T Δ V
In this way, the freezing model of saturated coarse-grained soil in a closed system is highly similar to pure water in a closed system. When considering the formation process of highway waterfall ice, from above analysis, it can be ensured that the essence of the aquifers’ freezing in the waterfall ice area is the freezing of closed water. Then, the volume expansion due to freezing conditions increases the pressure of closed water, which squeezes out from the weak interfaces and forms the waterfall ice. This conclusion can give a primary reference for the discussion of the formation mechanism of highway waterfall ice. That is, pure water freezing helps to analyze the formation progress of highway waterfall ice.

4. Discussion of the Formation Mechanism of Highway Waterfall Ice

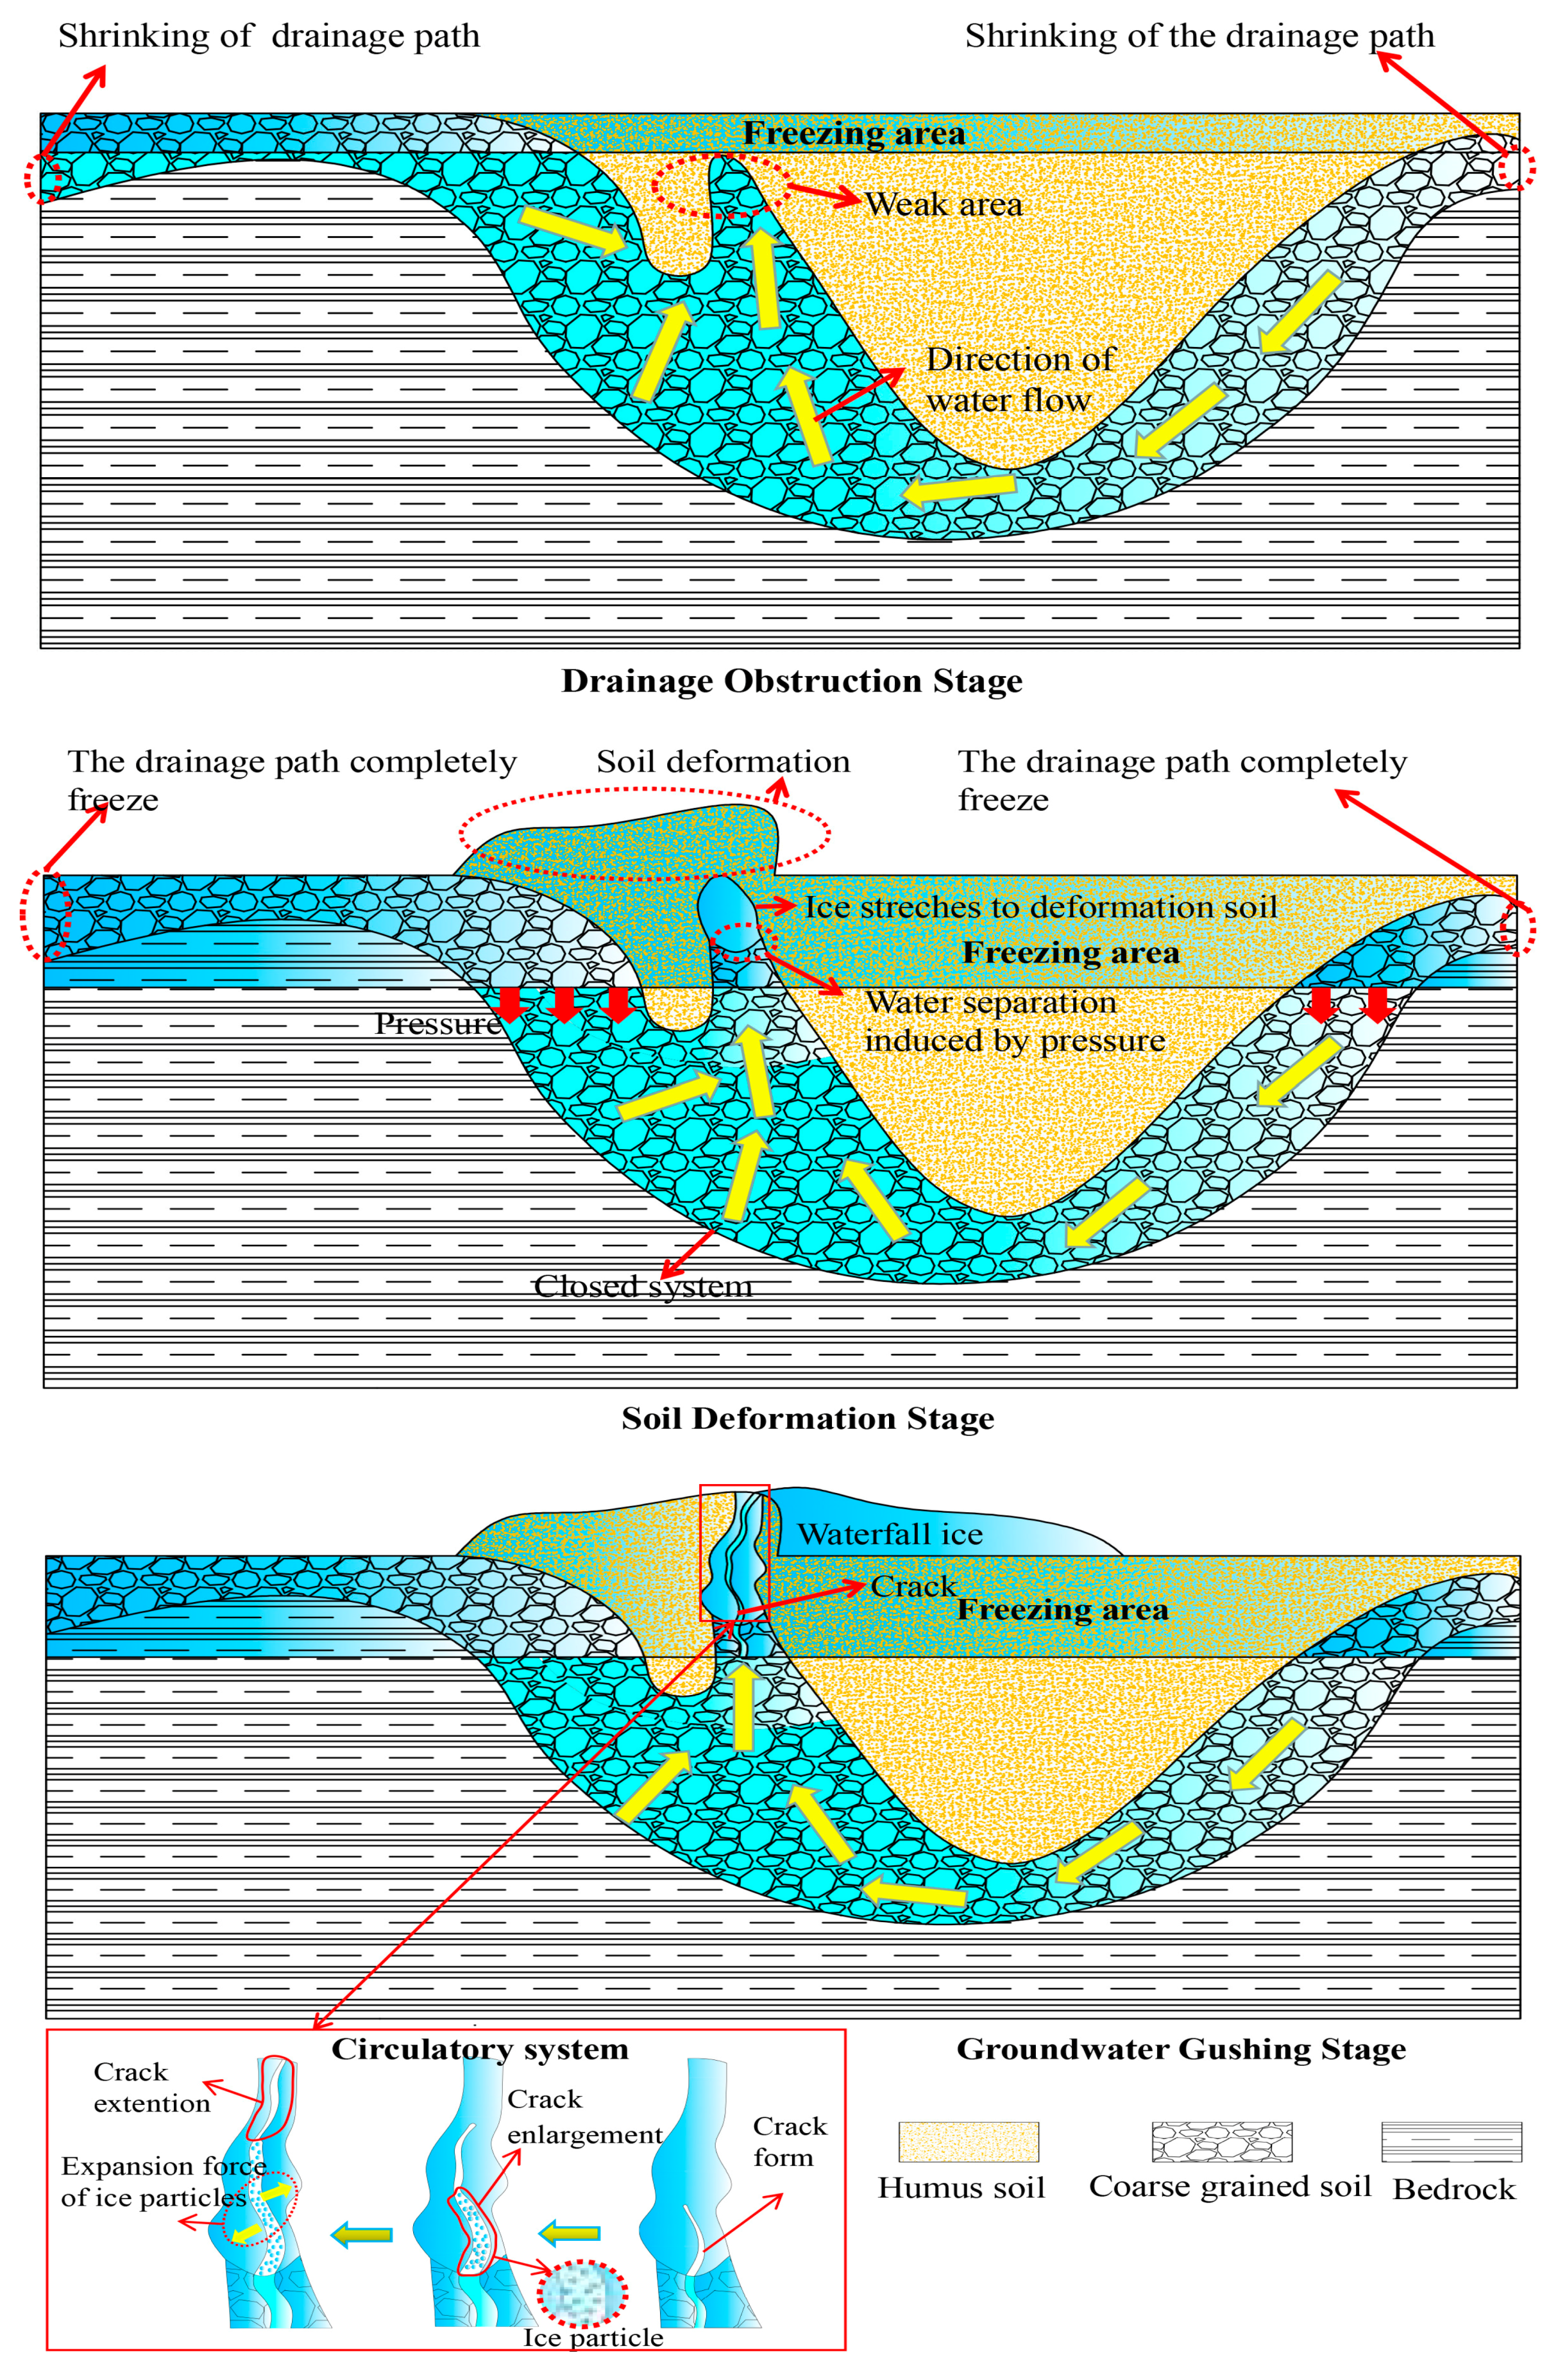
According to in-situ and indoor experimental investigations and the establishment of a mathematical model, this study found that the saturated coarse-grained soil in a closed system is the main factor that results in waterfall ice hazards. Consequently, to describe the formation mechanism of highway waterfall ice clearly, the soil layer model was established, which includes three layers, i.e., humus soil layer, saturated coarse-grained soil layer, and bedrock layer from top to bottom. Based on this model, when excavation occurs during highway construction, the frozen depth of the soil increases although aquifers are not exposed. This leads to the frozen depth of the aquifer (saturated coarse-grained soil) deeper than before. Therefore, the pressure of the groundwater increases, which has already been proved by the freezing tests mentioned in Section 3. According to the pressure increasing procedure during freezing conditions, the formation process of waterfall ice is defined as three stages (i.e., the drainage obstruction stage, the soil deformation stage, and the groundwater gushing stage) as shown in Figure 12.
At the drainage obstruction stage, the drainage path is partly obstructed with the increasing frozen depth. Hence, the pressure of the aquifer increases. The compaction process of the aquifer, which results from construction of machines, is also a main factor that leads to pressure increases when considering actual engineering. The groundwater flows to the weak area under this pressure.
At the soil deformation stage, with the increasing frozen depth, the drainage path of the aquifer is completely blocked, and a closed system is formed. The pressure of the aquifer increases rapidly, and the groundwater at weak area breaks through the humus soil layer and freezing under negative temperature, which results in top soil deformation. When the volume of ice reaches its maximum volume, the deformation of top soil also reaches its limit. Then, the ice stretches to the deformation soil as shown in Figure 12. At the same time, water separates from the coarse-grained soil and moves to the weak area constantly because of the increasing pressure.
At the groundwater gushing stage, the ice breaks through the deformation soil. Then, the huge expansive force generated by groundwater in a closed system fractures the ice block. After that, the groundwater flows into the cracks, and becomes ice particles under negative temperature. The cracks get larger due to the ice particle forming and the constant water inflow. With the increasing groundwater flow volume and the crack development process in ice blocks, the cracks cross the ice block completely, and groundwater flows out and becomes ice rapidly under negative temperature. After that, a closed system is formed again, and the groundwater gushing stage happens again. Therefore, a circulatory system is formed, and the volume of waterfall ice increases rapidly during this circulation.

5. Conclusions

In this paper, areas that suffer serious highway waterfall ice hazards (Tongchuan-Huangling expressway) were chosen to conduct ground water monitoring for 2.5 years. The relationship between the ground water level change and waterfall ice hazards is revealed. After that, the gradation test and penetration test of the aquifer soil, and the freezing test of typical saturated fine-grained soil and coarse-grained soil were conducted. Following this, the mathematical model of investigating waterfall ice was established. Finally, the formation mechanism of highway waterfall ice was discussed. The following primary conclusions can be drawn:
(1)
Ground water level change that results from excavation is the main reason for highway waterfall ice hazards. Furthermore, the area that can easily get seasonal rainfall supplements, and the mountainous regions where ground water is replenished by perched water after cutting excavation suffers serious highway waterfall hazards. The monitoring results also provide significant references for the route design of expressways in related area.
(2)
A proportional relationship between the content of coarse-grained particles and the hydraulic conductivity was obtained based on the gradation test and the penetration test using in-situ aquifer soil of eight research sites. The results indicate that the content of coarse-grained particles can significantly enhance the permeability of the aquifer, which is the internal factor that leads to highway waterfall ice.
(3)
According to the freezing tests of saturated fine-grained soil and coarse-grained soil, this study found that, contrary to saturated fine-grained soil which showed obvious water migration during freezing, the pore pressure of coarse-grained soil increased rapidly first, and decreased after reaching the maximum value (84 KPa in this test). The frost heaving ratio and the inflow volume were almost zero during the test. The test results indicate that the volume expansion of free water freezing in a closed system is the main reason for pore pressure increasing the saturated coarse-grained soil.
(4)
The freezing model of fine-grained soil was established based on the percolation theory. After that, the freezing model of saturated coarse-grained soil at the state of the phase transition equilibrium was obtained using the freezing model of fine-grained soil. This indicates that the essence of the aquifers’ freezing (coarse-grained soil) in the waterfall ice area is the freezing of closed water.
(5)
The formation mechanism of waterfall ice was discussed based on the above-mentioned results. The formation process of waterfall ice is defined as three stages (i.e., the drainage obstruction stage, the soil deformation stage, and the groundwater gushing stage). This definition can give significant guidance for further research that focuses on the prevention of highway waterfall hazards.

Author Contributions

Conceptualization, Z.Z., J.L., S.Z., and H.Z.; data curation, J.L., S.Z., S.Q., and H.Z.; funding acquisition, Z.Z.; investigation, J.L.; methodology, J.L., S.Z.; writing-original draft, J.L.

Funding

This work is financially supported by the National Key R&D Program of China (no. 2016YFC0802203-8).

Conflicts of Interest

The authors declare no conflicts of interest.

Appendix A

Figure A1. Temperature and frozen depth change of Tongchuan-Huangling expressway during winter 2014–2015.
Sustainability 11 04059 g0a1

References

  1. Weiss, J.; Montagnat, M.; Cinquin-Lapierre, B.; Labory, P.; Moreau, L.; Damilano, F.; Lavigne, D. Waterfall ice: Mechanical stability of vertical structures. J. Glaciol. 2011, 57, 407–415. [Google Scholar] [CrossRef]
  2. Gauthier, F. Statistical analysis of climate conditions conducive to falling ice blocks along road corridors in northern Gaspe. Can. Geotech. J. 2012, 49, 1408–1426. [Google Scholar] [CrossRef]
  3. Lai, Y.; Zhang, S.; Yu, W. A new structure to control frost boiling and frost heave of embankments in cold regions. Cold Reg. Sci. Technol. 2012, 79, 53–66. [Google Scholar] [CrossRef]
  4. Zhou, Z.; Zhan, H.; Hu, J.; Ren, C. Characteristics of Unloading Creep of Tuffaceous Sandstone in East Tianshan Tunnel under Freeze-Thaw Cycles. Adv. Mater. Sci. Eng. 2019, 1–17. [Google Scholar] [CrossRef]
  5. Lin, Z.; Niu, F.; Li, X.; Li, A.; Liu, M.; Luo, J.; Shao, Z. Characteristics and controlling factors of frost heave in high-speed railway subgrade, Northwest China. Cold Reg. Sci. Technol. 2018, 153, 33–34. [Google Scholar] [CrossRef]
  6. Lai, J.; Wang, X.; Qiu, J.; Zhang, G.; Chen, J.; Xie, Y.; Luo, Y. A state-of-the-art review of sustainable energy based freeze proof technology for cold-region tunnels in China. Renew. Sustain. Energy Rev. 2018, 82, 3554–3569. [Google Scholar] [CrossRef]
  7. Zhou, Z.; Zhu, S.; Kong, X.; Lei, J.; Liu, T. Optimization Analysis of Settlement Parameters for Postgrouting Piles in Loess Area of Shaanxi, China. Adv. Civ. Eng. 2019, 12, 1–16. [Google Scholar] [CrossRef]
  8. Gauthier, F.; Hetu, B.; Allard, M. Forecasting method of ice blocks fall using logistic model and melting degree-days calculation: A case study in northern Gaspésie, Québec, Canada. Nat. Hazards 2015, 79, 855–880. [Google Scholar] [CrossRef]
  9. Silvia, F.; Andrea, B.; Ian, J.F.; Frank, M. Calcite fabrics, growth mechanisms, and environments of formation in speleothems from the Italian Alps and southwestern Ireland. J. Sediment. Res. 2000, 70, 1183–1196. [Google Scholar] [CrossRef]
  10. Raimo, S.; Pekka, H.; Ari, V. Effect of mild winter events on soil water content beneath snowpack. Cold Reg. Sci. Technol. 2008, 51, 56–67. [Google Scholar] [CrossRef]
  11. Zhang, S.; Sheng, D.; Zhao, G.; Niu, F.; He, Z. Analysis of frost heave mechanisms in a high-speed railway embankment. Can. Geotech. J. 2016, 53, 520–529. [Google Scholar] [CrossRef]
  12. Guthrie, W.; Shoop, S.; Ulring, J. Frost Damage in Pavement: Causes and Cures. J. Cold Reg. Eng. 2016, 30, 1–15. [Google Scholar] [CrossRef]
  13. Montagnat, M.; Weiss, J.; Cinquin-Lapierre, B.; Labory, P.; Moreau, L.; Damilano, F.; Lavigne, D. Waterfall ice: Formation, structure and evolution. J. Glaciol. 2010, 56, 225–234. [Google Scholar] [CrossRef]
  14. Yang, Z.; Zhang, L.; Ling, X.; Li, G.; Tu, Z.; Shi, W. Experimental study on the dynamic behavior of expansive soil in slopes under freeze-thaw cycles. Cold. Reg. Sci. Technol. 2019, 163, 27–33. [Google Scholar] [CrossRef]
  15. Batenipour, H.; Alfaro, M.; Kurz, D.; Graham, J. Deformations and ground temperatures at a road embankment in northern Canada. Can. Geotech. J. 2014, 51, 260–271. [Google Scholar] [CrossRef]
  16. Mahedi, M.; Cetin, B.; Cetin, K. Freeze-thaw performance of phase change material (PCM) incorporated pavement subgrade soil. Constr. Build. Mater. 2019, 202, 449–464. [Google Scholar] [CrossRef]
  17. Lai, Y.; Xu, X.; Dong, Y.; Li, S. Present situation and prospect of mechanical research on frozen soils in China. Cold Reg. Sci. Technol. 2013, 87, 6–18. [Google Scholar] [CrossRef]
  18. Mill, T.; Ellmann, A.; Aavik, A.; Horemuz, M.; Sillamaee, S. Determining ranges and spatial distribution of road frost heave by terrestrial laser scanning. Balt. J. Road Bridge Eng. 2014, 9, 225–234. [Google Scholar] [CrossRef] [Green Version]
  19. Qin, Z.; Lai, Y.; Tian, Y.; Yu, F. Frost-heaving mechanical model for concrete face slabs of earthen dams in cold regions. Cold Reg. Sci. Technol. 2019, 161, 91–98. [Google Scholar] [CrossRef]
  20. Lai, Y.; Pei, W.; Zhang, M.; Zhou, J. Study on theory model of hydro-thermal–mechanical interaction process in saturated freezing silty soil. Int. J. Heat Mass Transf. 2014, 78, 805–819. [Google Scholar] [CrossRef]
  21. Tretyakova, O.; Yushkov, B. Inverted-Cone Piles for Transport Constructions in Seasonally Freezing Soils. Soil Mech. Found. Eng. 2017, 54, 173–176. [Google Scholar] [CrossRef]
  22. Lee, J.; Kim, Y.; Chae, D.; Cho, W. Loading rate effects on strength and stiffness of frozen sands. KSCE J. Civ. Eng. 2016, 20, 208–215. [Google Scholar] [CrossRef]
  23. Zhou, Z.; Ren, C.; Xu, G.; Zhan, H.; Liu, T. Dynamic Failure Mode and Dynamic Response of High Slope Using Shaking Table Test. Shock. Vib. 2019, 8, 1–19. [Google Scholar] [CrossRef]
  24. Larson, L.; Kiemnec, G.; Johnson, E. Influence of Freeze-Thaw Cycle on Silt Loam Soil in Sagebrush Steppe of Northeastern Oregon. Rangel. Ecol. Manag. 2019, 72, 69–72. [Google Scholar] [CrossRef]
  25. Gullu, H.; Khudir, A. Effect of freeze-thaw cycles on unconfined compressive strength of fine-grained soil treated with jute fiber, steel fiber and lime. Cold Reg. Sci. Technol. 2014, 106, 55–65. [Google Scholar] [CrossRef]
  26. Ye, W.; Li, C. The consequences of changes in the structure of loess as a result of cyclic freezing and thawing. Bull. Eng. Geol. Environ. 2019, 78, 2125–2138. [Google Scholar] [CrossRef]
  27. Yin, X.; Liu, E.; Song, B.; Zhang, D. Numerical analysis of coupled liquid water, vapor, stress and heat transport in unsaturated freezing soil. Cold. Reg. Sci. Technol. 2018, 155, 20–28. [Google Scholar] [CrossRef]
  28. Ji, Y.; Zhou, G.; Zhou, Y.; Vandeginste, V. Frost heave in freezing soils: A quasi-static model for ice lens growth. Cold Reg. Sci. Technol. 2019, 158, 10–17. [Google Scholar] [CrossRef]
  29. Rizzo, F.; Caracoglia, L. Examining wind tunnel errors in Scanlan derivatives and flutter speed of a closed-box. Wind Struct. 2018, 26, 231–251. [Google Scholar]
  30. Zhou, Z.; Yang, T.; Fan, H. A Full-Scale Field Study on Bearing Characteristics of Cast-in-Place Piles with Different Hole-Forming Methods in Loess Area. Adv. Civ. Eng. 2019, 4, 1–16. [Google Scholar] [CrossRef]
  31. Zhou, Z.; Lei, J.; Shi, S.; Liu, T. Seismic Response of Aeolian Sand High Embankment Slopes in Shaking Table Tests. Appl. Sci. 2019, 9, 1677. [Google Scholar] [CrossRef]
  32. Liu, X.; Cai, G.; Liu, L.; Liu, S.; Anand, J. Thermo-hydro-mechanical properties of bentonite-sand-graphite-polypropylene fiber mixtures as buffer materials for a high-level radioactive waste repository. Int. J. Heat Mass Transf. 2019, 141, 981–994. [Google Scholar] [CrossRef]
  33. Profession Standard of the People’s Republic of China. Test Methods of Soils for Highway Engineering (JTG E40-2007); Ministry of Communications of the PRC: Beijing, China, 2007.
  34. Zhou, Z.; Dong, Y.; Jiang, P.; Han, D.; Liu, T. Calculation of Pile Side Friction by Multiparameter Statistical Analysis. Adv. Civ. Eng. 2019, 6, 1–16. [Google Scholar] [CrossRef]
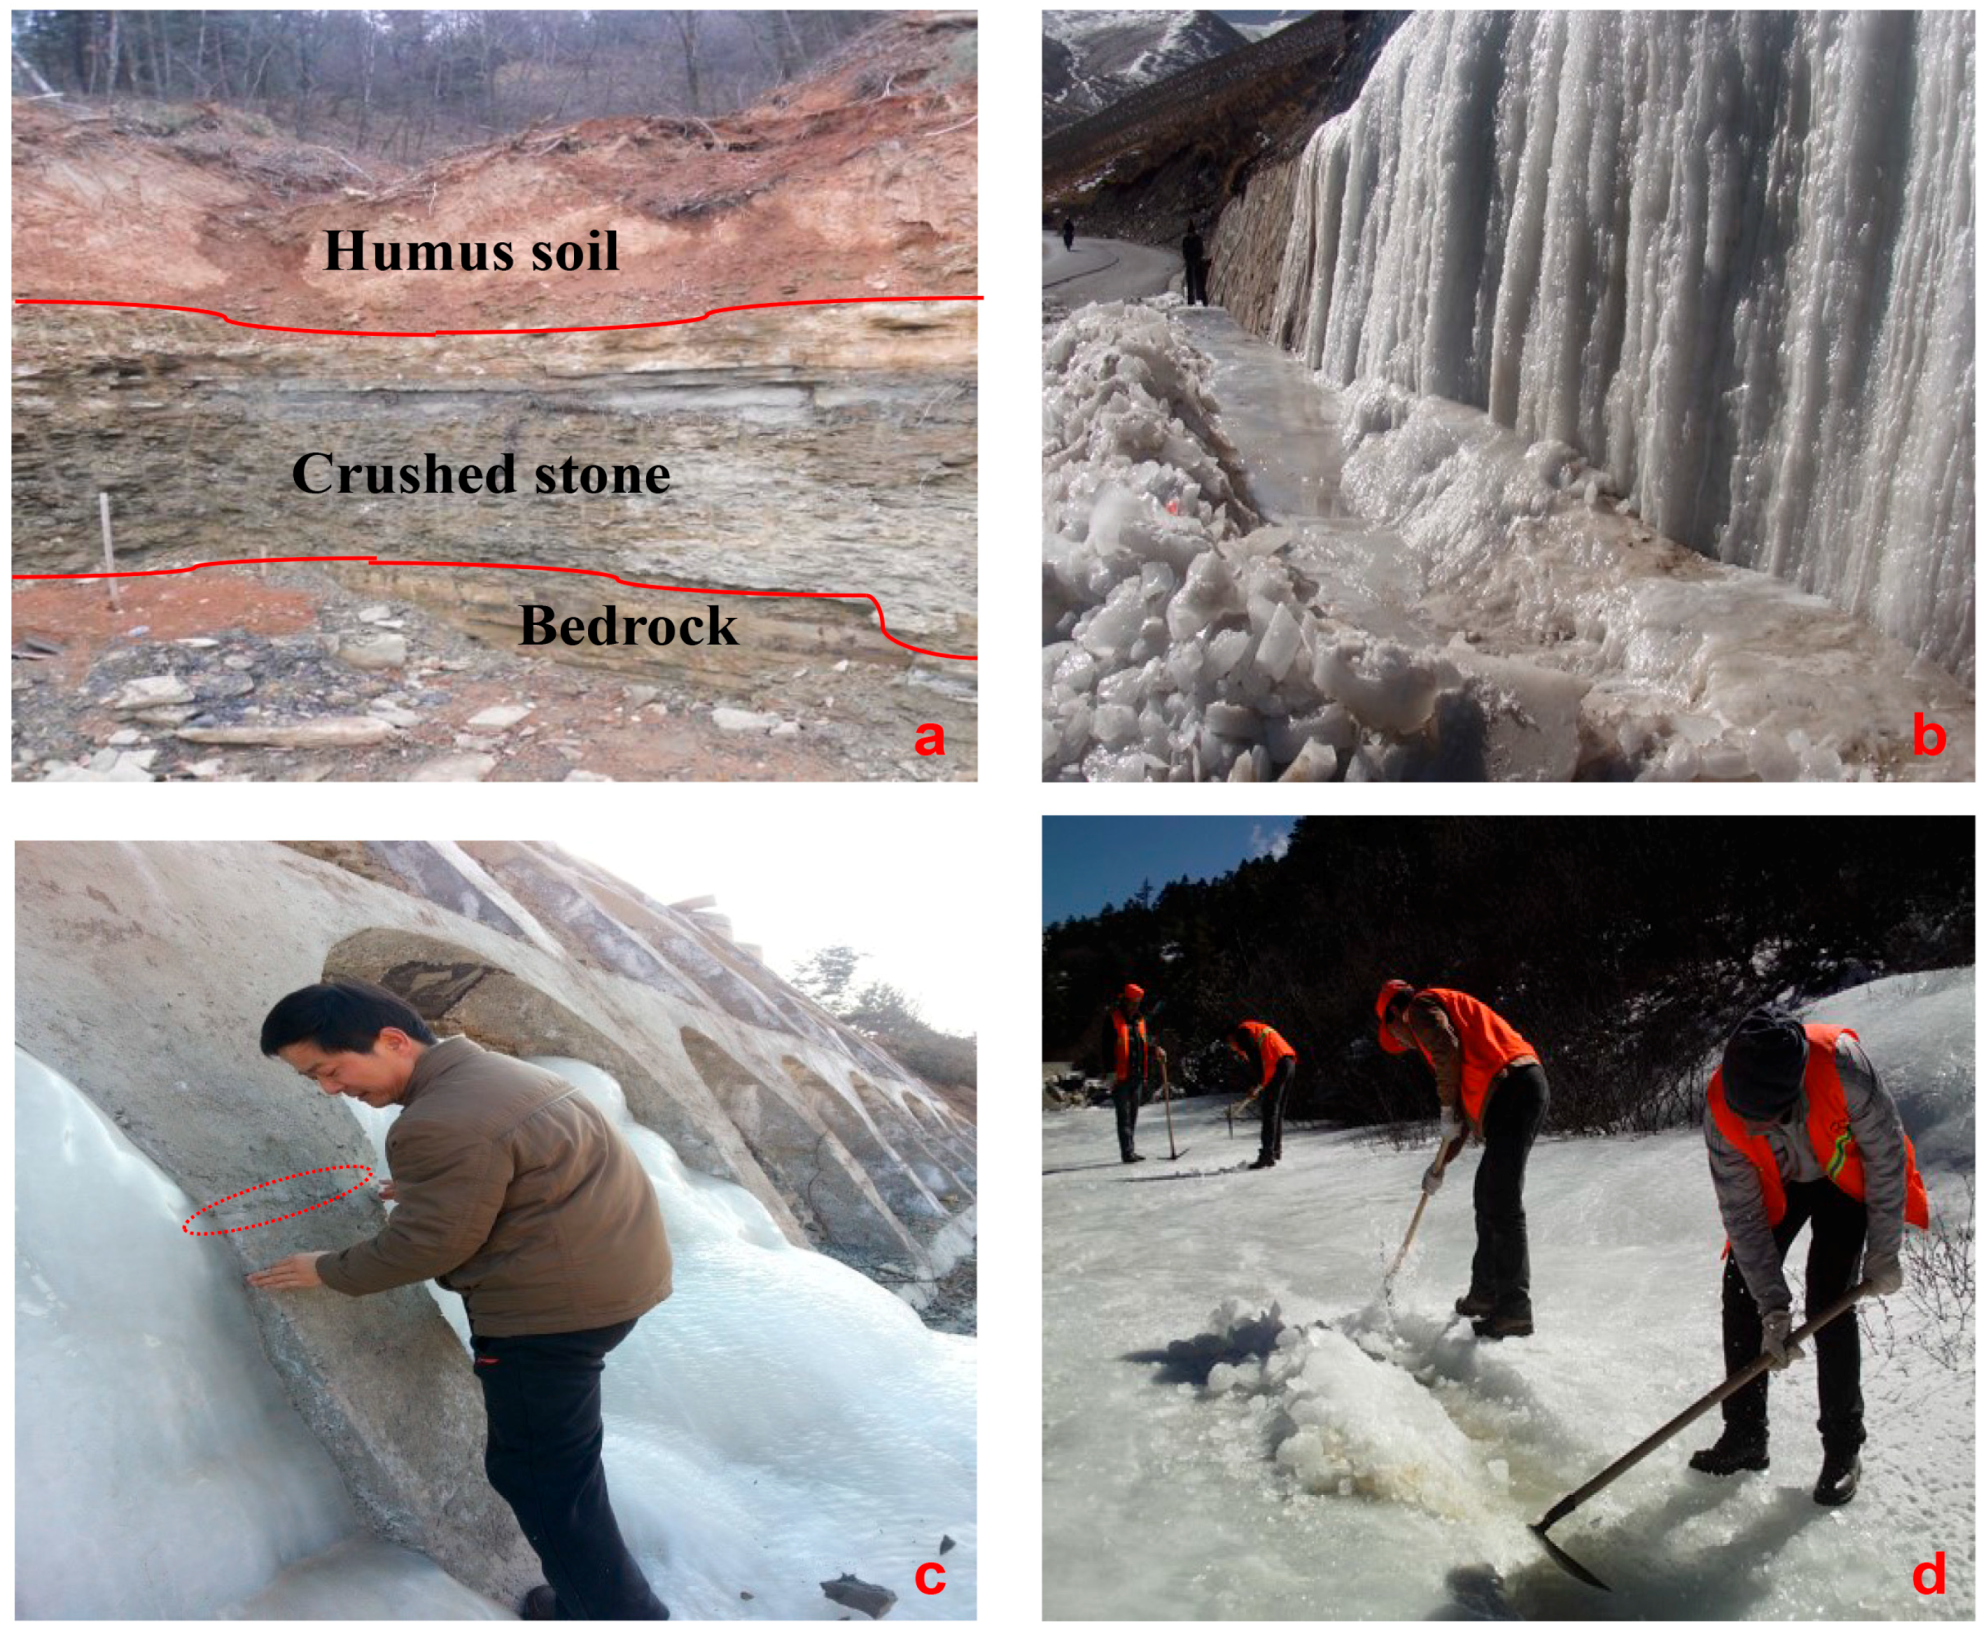
Figure 1. The soil composition and waterfall ice hazards of the research site (a) Soil composition (b) Large-scale highway waterfall ice (c) Facing wall dehiscence induced by waterfall ice (d) Highway waterfall ice extended to the road surface.
Sustainability 11 04059 g001
Figure 2. Ground Water Level Monitoring System [30].
Sustainability 11 04059 g002
Figure 3. Location of monitoring sites [31].
Sustainability 11 04059 g003
Figure 4. The groundwater monitoring results of drilled holes.
Sustainability 11 04059 g004aSustainability 11 04059 g004b
Figure 5. The equipment for penetration tests (Chang’an University).
Sustainability 11 04059 g005
Figure 6. The relationship between specific diameters and hydraulic conductivity: (a) effective grain diameter (b) constrained diameter.
Sustainability 11 04059 g006
Figure 7. Freezing test set up design.
Sustainability 11 04059 g007
Figure 8. Freezing tests results (a) frost heaving ration (b) pore pressure (c) inflow volume.
Sustainability 11 04059 g008
Figure 9. Microscopic freezing process of saturated coarse grained soil.
Sustainability 11 04059 g009
Figure 10. The microcosmic process of moisture migration in fine-grained soil.
Sustainability 11 04059 g010
Figure 11. A simplified theoretical model of frozen saturated fine-grained soil.
Sustainability 11 04059 g011
Figure 12. The formation process of waterfall ice.
Sustainability 11 04059 g012
Table 1. Information of drilled holes.
Monitoring SiteCode NameLongitudeLatitudeElevation (m)Ground Water Burial Depth (m)Lithological Description of Aquifer
GoumenG-135°20′44.7′′ N108°58′07.7′′ E13213.10Strong Weathered sandstone
G-213192.46Silty clay
XianshenX-135°21′56.9′′ N108°59′22.7′′ E12559.71Sandy cobble layer
X-212487.08Strong weathered conglomerate
MawangM-135°22′35.0′′ N109°00′03.5′′ E12386.52Strong weathered conglomerate
M-212311.25Strong weathered sandstone
JiaozhaiJ-135°24′36.8′′ N109°01′05.3′′ E11971.58Strong weathered sandstone
J-212045.23Strong weathered sandstone
LiuzhuangL-135°27′08.3′′ N109°02′54.7′′ E11253.29Strong weathered sandstone
L-211063.96Strong weathered mudstone
QianzhuangQ-135°29′39.4′′ N109°04′18.9′′ E10941.14Strong weathered mudstone
Q-210871.52Sandy cobble layer
JiezhuangJ-335°32′18.9′′ N109°07′40.6′′ E8895.08Strong weathered sandstone
J-48812.30Strong weathered sandstone
ChangxiC-135°33′54.2′′ N109°10′03.0′′ E9934.46Strong weathered sandstone
C-29855.71Strong weathered mudstone
Table 2. The test results of the gradation test and penetration test.
Sampling SitesMawangChangxiJiaozhaiGoumenXianshenLiuzhuangQianzhuangJiezhuang
Fine grained group/mm<0.114%15%12%5%9%5%4%2%
0.1–0.515%8%5%9%2%5%3%3%
Medium grained group/mm0.5–211%8%11%9%14%11%16%9%
2–511%9%13%13%4%12%4%8%
Coarse grained group/mm5–1027%54%50%56%66%48%52%65%
10–2022%6%9%8%5%19%21%13%
d 10 /mm0.0830.0790.0910.250.1050.230.811.27
d 30 /mm0.572.132.694.345.194.865.546.14
d 60 /mm6.616.816.747.117.347.518.158.70
Uniformity coefficient C u 79.6486.2074.0728.4469.9032.6510.066.85
Curvature coefficient C c 0.598.4311.8010.6034.9513.674.653.41
k 20 / ( cm / s ) 0.0370.0940.1870.2140.2790.3350.540.688
Table 3. The grain size composition of coarse-grained soil.
Grain size (mm)10–205–101–50.1–10.05–0.1<0.05
Weight percent (%)5.830.545.316.41.30.7
Table 4. The grain size composition of fine-grained soil.
Grain size (mm)0.05–0.10.01–0.050.005–0.01<0.005
Weight percent (%)14.845.732.27.3