All articles published by MDPI are made immediately available worldwide under an open access license. No special
permission is required to reuse all or part of the article published by MDPI, including figures and tables. For
articles published under an open access Creative Common CC BY license, any part of the article may be reused without
permission provided that the original article is clearly cited. For more information, please refer to
https://www.mdpi.com/openaccess.
Feature papers represent the most advanced research with significant potential for high impact in the field. A Feature
Paper should be a substantial original Article that involves several techniques or approaches, provides an outlook for
future research directions and describes possible research applications.
Feature papers are submitted upon individual invitation or recommendation by the scientific editors and must receive
positive feedback from the reviewers.
Editor’s Choice articles are based on recommendations by the scientific editors of MDPI journals from around the world.
Editors select a small number of articles recently published in the journal that they believe will be particularly
interesting to readers, or important in the respective research area. The aim is to provide a snapshot of some of the
most exciting work published in the various research areas of the journal.
The requirement for energy sustainability drives the development of integrated energy distribution systems (IEDSs). In this paper, considering the coordination of district multi-energy systems (DMESs), a hierarchical management strategy is proposed to enhance IEDS resilience. The proposed strategy is divided into three modes: the normal operation mode, the preventive operation mode and the resilient operation mode. In the normal operation mode, the objective of DEMSs is to minimize the operation costs. In the preventive operation mode, the objective of DEMSs is to maximize the stored energy for mitigating outage. The resilient operation mode consists of two stages. DMESs schedule their available resources and broadcast excess generation capacities or unserved loads to neighboring DMESs through the cyber communication network in the first stage. In the second stage, DMESs interchange electricity and natural gas with each other through the physical common bus for global optimization. A consensus algorithm was applied to determine the allocated proportions of exported or imported electricity and natural gas for each DMES in a distributed way. An IEDS including five DMESs was used as a test system. The results of the case studies demonstrate the effectiveness of the proposed hierarchical management strategy and algorithm.
With the development of integrated energy distribution system (IEDSs) [1,2], the interaction among electricity distribution systems, natural gas distribution systems and district heating systems is increasingly intensified by the continuing penetration of gas-fired combined heat and power (CHP) units [3]. Moreover, based on the energy hub (EH) concept [4], district multi-energy systems (DMESs) consisting of micro-grids (MGs) and district gas-heating networks can coordinately schedule the interrelated electricity, natural gas and heat. However, frequent natural disasters have been causing severe threats to the security of IEDSs. For example, in 2012, after Hurricane Sandy hit the eastern shore of the United States, approximately 7.5 million customers were reportedly without power [5] and the cost of outages estimated ranged from $27 billion to $52 billion [6]. In this regard, it is necessary to develop methods to enhance IEDS resilience. Furthermore, IEDS resilience and sustainability are closely related [7].
However, compared with IEDS resilience, many studies have been made in the literature on power system resilience [8,9,10,11,12,13,14,15]. Power system resilience can be defined as the ability to anticipate, withstand, absorb and recover rapidly from disruptions caused by extreme natural catastrophes such as earthquakes, hurricanes and flooding [16].
To enhance power system resilience, the strategies in previous research could be roughly categorized into the following aspects: placing flexible back-up resources [8,9], improving response ability [10,11], altering network topology [12,13,14] and hardening distribution lines [15]. The study in [8] proposes a two-stage dispatch framework consisting of the pre-positioning and real-time allocation of mobile emergency generators to restore critical loads in electricity distribution systems. In addition, the study in [9] proposes a stochastic mixed-integer second-order conic program for the optimal investments and transportation routes of mobile energy storages to avoid load shedding by disasters. For another, stationary devices can also improve resilience after extreme events. In [10], a method is presented for the optimal switch placement in distribution systems, taking into account resilience ability against major faults caused by natural disasters. In [11], a Markov model is proposed to construct a sequentially proactive operation strategy with generation re-dispatch to reduce potential power loss. Besides, an integrated framework is proposed in [12] to schedule topology switching and adjustable load shedding for resilience response. To utilize existing resources more efficiently, the study in [13] develops a self-healing strategy by sectionalizing a distribution system into self-adequate MGs with distributed generators (DGs). The study in [14] proposes an operational approach for forming multiple MGs energized by DG via controlling the automatic switch devices so as to provide power for interrupted loads. To withstand disruption from natural disasters, a tri-level robust optimization is proposed to harden distribution lines in [15]. Furthermore, MGs can cover small geographical areas and maintain critical loads in the inland mode, so they can mitigate load reductions during transmission system outages. For example, after the Great East Japan Earthquake in March 2011, the Sendai MG continuously supplied power to some critical loads within small area until grid restoration [17]. The study in [18] presents the mesh grid approach for calculating proposed resilience indices, which demonstrate that island MDs can improve the resiliency of power grids. Additionally, the networked MGs can further improve power grid resilience by supporting and interchanging electricity with each other [19]. In particular, a hierarchical outage management framework is proposed in [20] for the networked MGs to coordinate available resources.
Actually, with the enhancement of coupling among electricity, natural gas and heat, it is not suitable that interactive support and exchange only consider electricity in several DMESs. Hence, it is significant and urgent to research IEDS resilience. IEDS resilience, which is an extension of the author’s review in [21], represents the ability of IEDS to withstand low probability high impact events in efficient means while ensuring the least outages of electricity, natural gas and heat, and further enabling quick restoration to the normal operation mode. However, the literature contains little research on IEDS resilience [22,23]. The study in [22] proposes a two-stage robust model for the integrated planning of electricity and natural gas system to improve power grid resilience via the replacement of some power lines by a natural gas transportation system. Moreover, an integrated electricity–heat–gas network model is presented for a holistic evaluation of energy system resilience in [23].
From the above, IEDS resilience has not been sufficiently studied yet. In particular, the restoration approach, which includes multiple energies interchange and supporting each other in DMESs to avoid interrupting power and gas supply during electricity distribution system and natural gas distribution system disruption by disaster, has not yet been investigated. Therefore, motivated by the aforementioned facts, this paper proposes a novel hierarchical management strategy for the coordinated operation and management of DMESs to enhance IEDS resilience. This paper divides the operation of DMESs into three modes: the normal operation mode, the preventive operation mode and the resilient operation mode. In the normal operation mode, the objective of DMESs is to minimize the operation costs. After receiving a disaster alert, DMESs enter the preventive operation mode in which the objective of DEMSs is to maximize the stored energy, so that adequate energy in batteries, gasholders and thermal storages of DEMSs can support electrical loads, gas loads and heat loads after IEDS outages. When natural disaster disrupts IEDS, the power and gas purchased from IEDS will be limited or even interrupted severely. In the resilient operation mode, the hierarchical management strategy is a two-stage optimization model, which is formulated as a mixed-integer linear programming (MILP), for scheduling electricity and natural gas between the networked DMESs to enhance IEDS resilience. A consensus algorithm [24] is applied to determine the allocated proportions of exported or imported electricity and natural gas for each DMES in a distributed way and the MILP can be solved by commercial solvers. The prominent features of the proposed strategy are demonstrated by case studies.
The major contributions of this paper are summarized as follows:
(1)
This paper co-optimizes the electricity, natural gas and thermal energy for three operation modes in DMES, which promotes the comprehensive and efficient utilization of different energy in normal and destroyed situations.
(2)
The hierarchical management strategy in DMES is proposed, which has enhancement for IEDS resilience to withstand the extreme events, such as natural disaster.
(3)
The consensus algorithm is applied to obtain the most suitable energy exchange with the least visible information on DMESs, which can not only calculate the allocated proportions accurately in a distributed way but also protect the privacy of DMESs effectively.
The rest of this paper is organized as follows. The concept of the networked DMESs is introduced and the general framework of the hierarchical management strategy is discussed in Section 2. Section 3 proposes mathematical formulations of the optimal normal, preventive and resilient operation and develops a consensus algorithm to solve this problem in a distributed way. In Section 4, numerical results are provided to validate the proposed strategy. Finally, Section 5 concludes the paper.
2. Hierarchical Management Strategy
2.1. Networked District Multi-Energy Systems
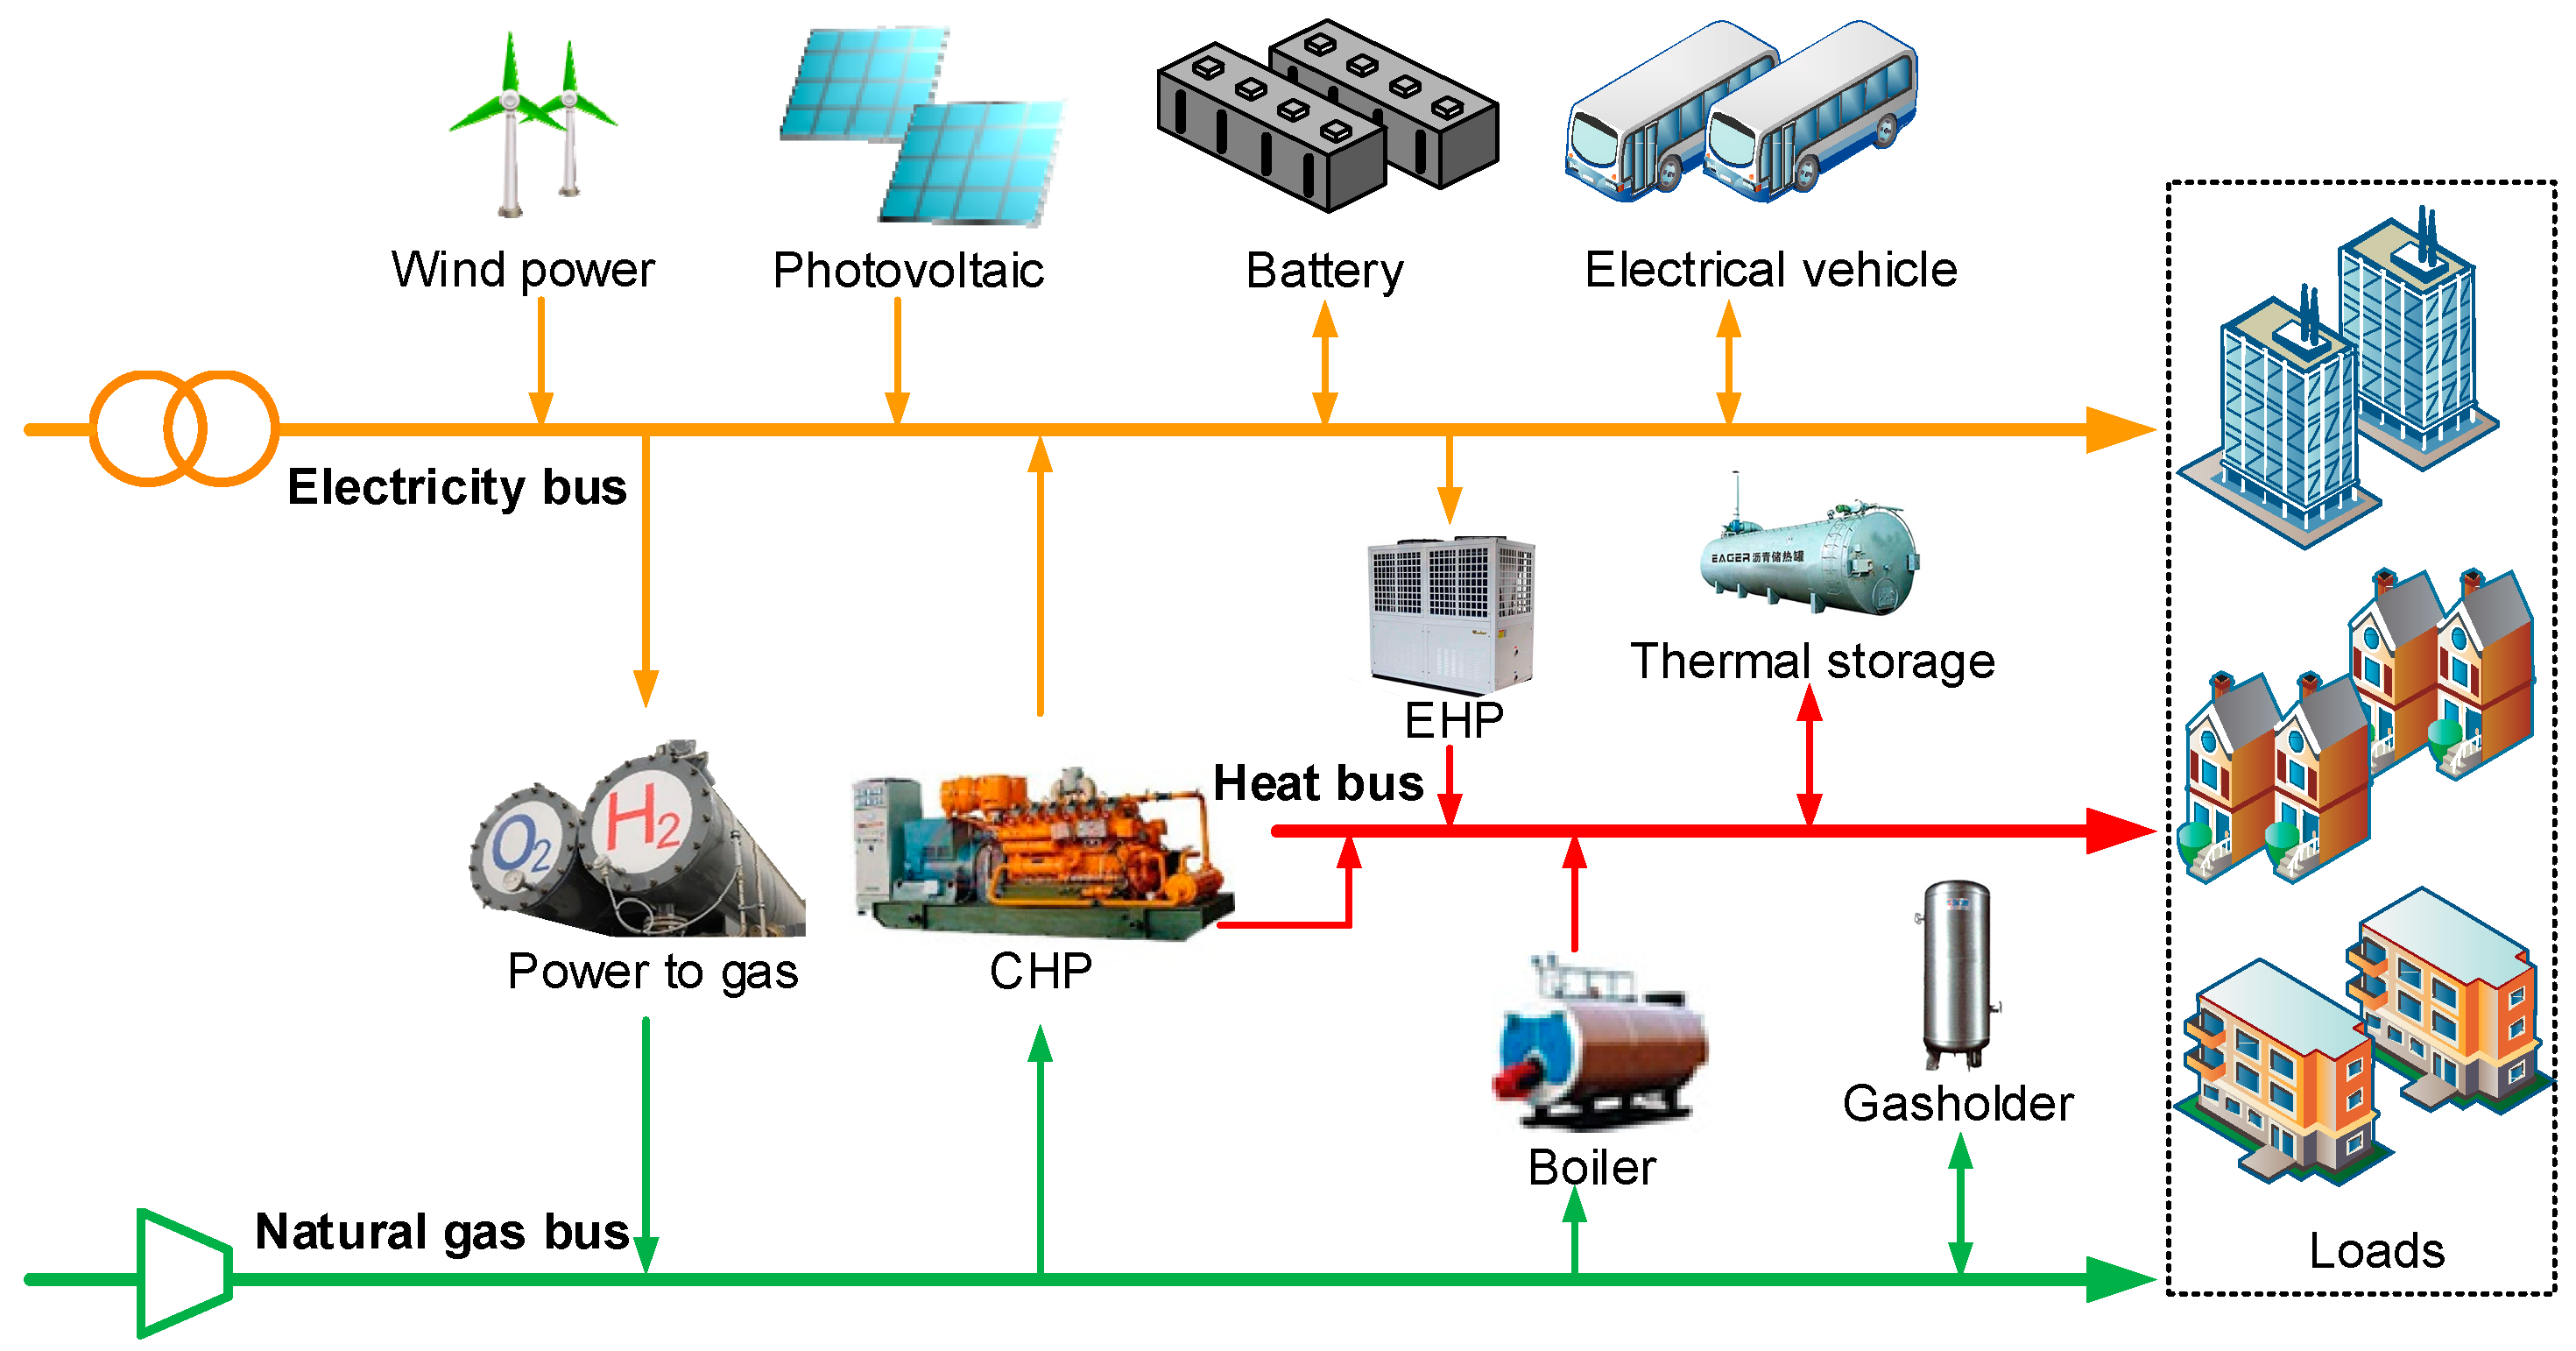
The DMESs, consisting of MGs and district gas-heating networks, are small-scale integrated energy systems covering small geographical areas with DGs, energy storages (ESs), energy coupling devices and various energy loads, which are shown in Figure 1.
As shown in Figure 1, ESs include battery, gasholder and thermal storage and energy coupling devices include CHP units, power to gas, electrical heat pumps (EHPs) [25] and boilers. In addition to the mentioned advantages, when the power and gas in the main grid are not available or the IEDS is faulty, customers in a DMES could benefit from the power and gas supplied from stored resources. Hence, DMESs could be employed to enhance IEDS resilience by reducing the possibility of load shedding.
However, each DMES can only support unserved loads by scheduling their own resources. Since each DMES is controlled independently, it is not an optimal strategy for multiple DMESs. Therefore, the networked DMESs, which is further development and application of the concept of DMES, need to be studied, which can coordinate energy management among connective multiple DMESs. Figure 2 illustrates such the networked DMESs model.
As shown in Figure 2, the networked DMESs consist of multiple DMESs connected through the physical common electricity bus and gas bus. Moreover, for information exchange, the DMESs are also connected through the cyber communication network. The networked DMESs can support each other with the remainder power and gas through the common buses to supply more loads after a natural disaster.
In IEDS scheduling management, each DMES is managed by an integrated energy serving company, which is the lower-layer controller (LLC). However, since there is no central controller in the upper-layer networked DMES, each DMES can only exchange information between neighboring DMESs. In the model, two conditions need to be met. First, each LLC has ownership of a DMES. This means that each DMES is autonomously managed by its own LLC, so the hierarchical management strategy should fulfil the autonomy of DMESs as much as possible. Second, the privacy in each DMES needs to be protected, so the energy and transaction information on DMESs are visible minimally.
2.2. General Framework of the Hierarchical Management Strategy
As noted earlier, the operation of DMESs can be divided into three modes, as depicted in Figure 3. In the normal operation mode, the LLC manages DGs, ESs and energy coupling devices, purchases energy from IEDSs and sells energy to consumers without energy exchange with other DMESs. Hence, the network lines and common bus are idle. After a disaster alert is announced, the proactive scheduling objective of DMESs is to maximize the stored energy, so the LLCs purchase energy to fill ESs as soon as possible in the preventive operation mode. When an IEDS is damaged by disaster, the DMESs cannot purchase adequate electricity and natural gas from IEDSs, so they have to enter the resilient operation mode.
In the resilient operation mode, the hierarchical management strategy proposed in this paper is comprised of two stages. In the first stage, the LLC develops a scheduling plan for the next timeslot, which includes DGs and ESs output and load consumptions in its own DMES. Then, the LLC broadcasts surplus generation capacities or unserved loads to neighboring DMESs through the cyber communication network. In the second stage, the scheduling plans are updated by exchange energy. According to the announced amount of excess and deficit electricity and natural gas, the allocated proportions of exported or imported electricity and natural gas, which can be used to determine the amount of exchange energy between DMESs, are calculated for each DMES by the proposed consensus algorithm. With the updated scheduling plan implemented, the excess DMESs provide the surplus energy to the deficit DMESs through the common bus so as to reduce load shedding when purchased energy is limited. To put it more clearly, the networked DMESs share the available generation resources and storage capacities to supply more loads as a resilient response, which is a self-healing process to enhance IEDS resilience.
It is worth highlighting that the scheduling plan is updated in two steps. In detail, after disaster disruption, the purchased electricity and natural gas from IEDSs are limited. Actually, besides the stored energy in battery and thermal storage, the supply source of electrical loads, gas loads and heat loads is the stored natural gas in gasholders. Therefore, in this paper, according to load shedding cost in a short time, the electrical loads should be supplied as much as possible, followed by the gas loads, and if necessary, the heat loads can be curtailed first. In the first step, the gas consumption and output of CHP units and the output of the battery and gasholder are updated, so that the electrical load curtailment is mitigated preferentially. In the second step, the output of the gasholder is updated again for the mitigation of gas load curtailment. All steps of the proposed hierarchical management strategy are briefly depicted in Figure 4.
Moreover, this paper has two assumptions. First, it is assumed that the common buses and the cyber network are strongly connected and no island exists in the networked DMESs after extreme disaster. Second, in order to cope with potential natural disasters, all the LLCs in the networked DMESs have signed the control protocols beforehand, which is based on the strategy proposed in this paper. What is more, the scheduling horizon is one hour. The purchased energy will be available after IEDS eliminates the faults caused by the disaster. In the case of an uncertain IEDS repair time, the networked DMESs should provide the existing loads to customers reliably. After a scheduling horizon, the proposed strategy will be implemented in the next hour, and the procedure will continue until IEDS restoration. The model formulation of this procedure is discussed in detail in the following section.
3. Methodology
3.1. Operation Model Formulation
The operation of DMESs has three modes, including the normal, preventive and resilient operation mode, and different operation modes have different objectives.
Objective function:
In the normal operation mode, the main objectives are to minimize the operation costs under the supply–demand balance of each energy in DMESs. The goal of the LLCs is to minimize the total cost of DMESs, as shown in (1). The total cost consists of the following terms: (i) electricity purchasing cost, (ii) natural gas purchasing cost, (iii) electrical load shedding cost, (iv) gas load shedding cost, (v) heat load shedding cost, (vi) charging and discharging cost of batteries, (vii) charging and discharging cost of gasholders, (viii) charging and discharging cost of thermal storages, (ix) penalty cost of wind power curtailment, and (x) penalty cost of solar power curtailment.
In the preventive operation mode, the objectives are not only to minimize the operation costs, but also to maximize the energy stored, so that DMESs can supply the load as much as possible after the energy purchased from IEDSs is limited. To facilitate modeling, the idle capacity of energy storages is calculated as the penalty cost: (xi) penalty cost of idle batteries, (xii) penalty cost of idle gasholders, and (xii) penalty cost of idle thermal storages.
In the resilient operation mode, after disaster disruption, the IEDS is destroyed and the energy purchased is limited. Hence, the main objectives are to minimize the load shedding. Each DMES supplies its own loads preferentially and broadcasts excess and deficit energy to adjacent DMESs. And then, the amount of energy exchanged is determined by the consensus algorithm, which will be introduced in the Section 3.2.
Furthermore, the constraints of the operation include energy balance, the operation status of equipment, the energy purchased, renewable energy output and load shedding.
Energy balance constraints:
Constraints (4)–(6) are power, natural gas and heat balance constraints, respectively. For each DMES and at each hour, (4) the sum of the total generated power by electrical power purchased, wind generators, photovoltaic plants, CHP units, charging/discharging power of batteries and curtailed electrical load must be equal to the sum of the total electrical load by conventional electrical load and power consumption of EHPs; (5) the sum of the total generated gas by gas purchased, charging/discharging gas of gasholders and curtailed gas load must be equal to the sum of the total gas load by conventional gas load and the gas consumption of CHP units and boilers; (6) the sum of the total generated heat by CHP units, boilers, EHPs, charging/discharging heat of thermal storages and curtailed heat load must be equal to the sum of the total heat load by conventional gas load.
The constraints of the operation status of the equipment include not only coupling equipment between different energy systems, such as CHP unit constraints, EHP constraints and boiler constraints, but also energy storage equipment, such as battery constraints, gasholder constraints and thermal storage constraints.
CHP unit constraints:
Constraints (7) and (8) show the energy conversion among the electricity generation, heat generation and natural gas consumption of CHP units. Constraints (9) limit the power output of CHP units. Constraints (10) limit the ramp-up and ramp-down of CHP units.
EHP constraints:
Constraints (11) show the energy conversion between the heat generation and electrical power consumption of EHP. Constraints (12) limit the heat output of EHP. Constraints (13) limit the ramp-up and ramp-down of EHP.
Boiler constraints:
Constraints (14) show the energy conversion between the heat generation and natural gas consumption of the boiler. Constraints (12) limit the heat output of the boiler. Constraints (13) limit the ramp-up and ramp-down of the boiler.
Battery constraints:
Constraints (17) show the relationship of electricity stored and charging/discharging power. Constraints (18) show the allowable limit of battery capacity. Allowable charging/discharging power limits are imposed through constraints (19) and (20).
Gasholder constraints:
Constraints (21) show the relationship of natural gas stored and charging/discharging gas. Constraints (22) show the allowable limit of gasholder capacity. Constraints (23) and (24) limit charging/discharging gas.
Thermal storage constraints:
Constraints (25) show the relationship of heat stored and charging/discharging heat. Constraints (26) show the allowable limit of thermal storage capacity. Constraints (27) and (28) limit charging/discharging heat. What is more, it is worth emphasizing that the binary variables , and are guaranteed to avoid the simultaneous charging and discharging of energy storage equipment.
Since heat is not suitable for long-distance transmission, the energy purchased off DMESs is mainly electrical power and natural gas. Hence, heat is supplied by CHP units, EHPs and boilers in DMESs.
Energy purchased constraints:
Constraints (29) and (30) limit electrical power and natural gas purchased from IEDS.
On the other hand, renewable energy should be consumed as much as possible for low carbon and environmental protection.
Renewable energy output constraints:
Constraints (31) and (32) describe the power outputs of wind generators. Constraints (33) and (34) describe the power outputs of photovoltaic plants.
Finally, DMESs ensure that the load shedding should be less than the total load.
Load shedding constraints:
Constraints (35)–(37) limit the electricity, gas and heat load shedding amount, respectively.
The proposed scheduling model of DMES is a mixed-integer linear programming (MILP), which can be solved with the solvers, such as cplex, gurobi.
The proposed scheduling model is solved in each DMES simultaneously. Next, each DMES calculates the excess and deficit electrical power and natural gas. The excess electrical power includes unused CHP unit and battery capacities. Besides, the deficit electrical power refers to unsupplied electrical demands. The calculation formulation is presented as follows:
where symbol ^ denotes that the corresponding variables are optimal values from the proposed scheduling model. The further generating capacity is the sum of the unused capacities of each CHP unit in DMES n, which is constrained by capacity, the ramp-up of CHP units and discharging gas, and gas stored in gasholders. The further discharging capacity is the sum of the unused capacities of each battery in DMES n, which is constrained by discharging power, and electricity stored in batteries. is the total electrical load shedding in DMES n. The excess natural gas includes unused gasholder capacities, and the deficit natural gas refers to unsupplied gas demands. They are calculated as follows:
The further discharging capacity is the sum of the unused capacities of each gasholder in DMES n, which is constrained by discharging gas, and gas stored in gasholders. is the total natural gas load shedding in DMES n.
After the excess and deficit electrical power and natural gas is calculated, each DMES broadcasts this information to neighboring DMESs at the end of stage I.
3.2. The Consensus Algorithm in Networked DMESs
In stage II, the amount of energy exchange supported by each other will be determined between the DMESs. This paper defines an excess DMES as a DMES that has excess energy after supplying its own load, and a deficit DMES as a DMES that has load shedding and needs energy support from other DMESs. If a centralized approach is used for calculating energy exchange, it will suffer high communication infrastructure costs and low reliability. Alternatively, a consensus algorithm can be applied in which the allocated proportions of energy exchange are computed locally at each DMES by information exchange only with neighboring DMESs. The essence of the consensus algorithm is to update the variable of local DMESs according to the variable of adjacent DMESs, iteratively. The iteration variable of DMESs can be linearly updated as follows:
where k is the iteration times. ξ is the step size, which satisfies . is the maximum node out-degree of the communication network [26,27]. is set of neighbors of DMES n. is the kth iteration variable, which represents , , , and . Based on research in [27], the convergence of the consensus algorithm is related to the eigenvalues of the Laplacian matrix representing the communication network. After enough runs of iteration, variables will converge to the average value :
where denotes the initial value of variable. Actually, the consensus algorithm is to calculate the average value under the condition that only the local and adjacent variables are known. It protects the privacy of DMESs, since only excess and deficit energy are visible. Furthermore, a distributed calculation method is applied for developing scheduling plan of each DMESs in parallel and only local communication between neighboring DMESs is involved, so it has low communication complexity and cost.
Next, the allocated proportions can be calculated as follows:
where and are allocated proportions of electricity and natural gas, respectively. , , , and are convergent values calculated by (43). According to the allocated proportions, the exported or imported electricity and natural gas for each DMES can be calculated.
If excess energy is more than deficit energy in networked DMESs at hour t (, ), allocated proportions are applied to calculated the exported energy of excess DMESs as follows:
where and are the exported electricity and natural gas of excess DMESs, respectively. The electricity and natural gas are enough to alleviate load shedding in networked DMESs after disaster and improve the resilience of IEDS.
On the other hand, if the excess energy is less than the deficit energy in networked DMESs at hour t (, ), allocated proportions are applied to the calculated imported energy of deficit DMESs as follows:
where and are the imported electricity and natural gas of deficit DMESs, respectively. When excess energy is not enough, the energy support for deficit DMESs is based on their amount of load shedding.
In general, it is fair to all DMESs, since the allocated exported or imported energy for each DMES is set according to its excess capacity or amount of load shedding. After DMESs determine the amount of energy exchange by the consensus algorithm, the scheduling plan developed in stage I will be updated in two steps as shown in Figure 4. And then, the updated scheduling plan will be implemented at the end of stage II.
4. Numerical Results
4.1. Test System
The proposed hierarchical management strategy is examined on a test system with five DMESs as shown in Figure 2. The information on CHP units, EHPs, boilers, batteries, gasholders, heat storages and price is summarized in Table 1, Table 2, Table 3, Table 4, Table 5, Table 6 and Table 7.
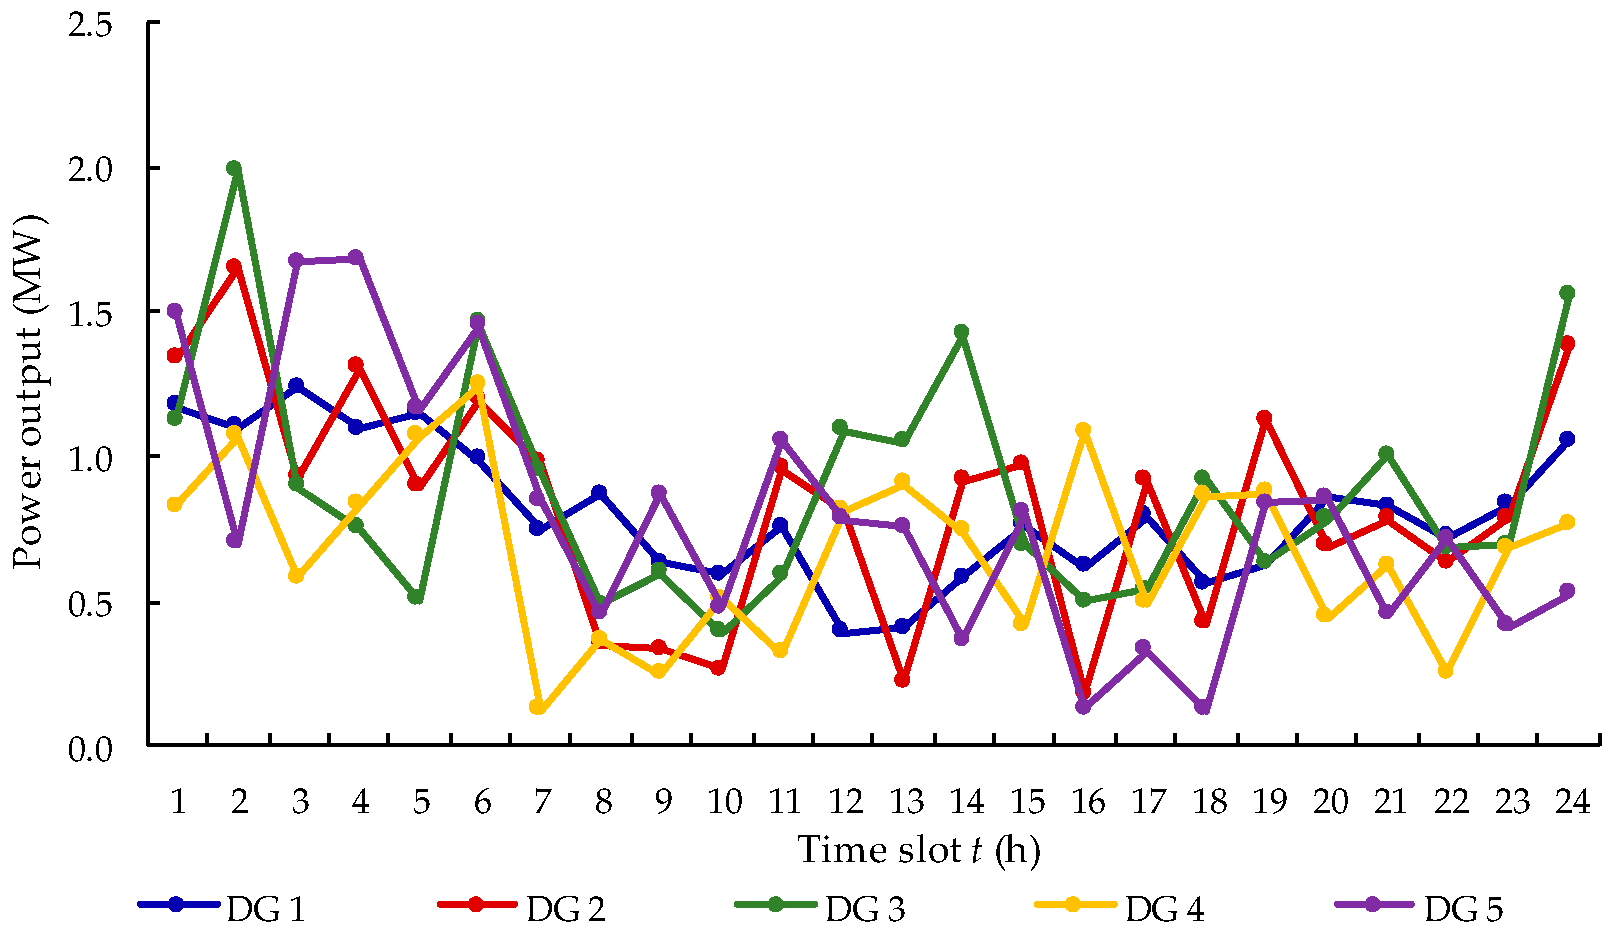
The forecasted output of DGs in each DMES, which is the sum of wind output and photovoltaic output, is shown in Figure 5.
And then, the electrical load, gas load and heat load of DMESs are shown in Figure 6a–c, respectively.
It is assumed that DMESs receive a disaster alert at the 7th hour, and disaster attacks the IEDS at the 17th hour. This means that the normal operation lasts 6 h, the preventive operation lasts 10 h and the resilient operation lasts 8 h. In other words, T1, T2 and T3 are set to 6, 10 and 8 h. The remaining penalty cost parameters are summarized in Table 8.
4.2. Results and Analysis
First, all DMESs have sufficient energy purchased from IEDSs in the normal and preventive operation mode, the electrical power and natural gas purchased curves are shown in Figure 7.
As shown in Figure 7, the energy purchased increases and maintains a high level in the preventive operation mode, because it not only supplies the current load, but also charges the energy storages. In addition, in order to discuss the proposed hierarchical management strategy more clearly, the energy storages should be filled during the preventive operation mode, so that there is sufficient energy stored to schedule between networked DMESs. The decline of energy purchased curves at the end of the preventive operation mode indicates that energy storages were full.
The resilient operation mode covers 8 h, from the 17th hour to the 24th hour. The excess electricity and natural gas of DMESs are summarized in Table 9. The deficit electricity and natural gas (load shedding) of DMESs are summarized in Table 10.
Comparing Table 9 and Table 10, we can see that excess energy and deficit energy are almost complementary. Approximately, each DMES can supply its own loads at time slot 1~2, and DMES 1, DMES 4 and DMES 5 have more excess energy to support DMES 2 and DMES 3 at time slot 3~6. However, with the consumption of energy, the DMESs have to interrupt their loads.
As shown in Figure 2, the DMESs can exchange information through the cyber communication network according to the route 1 ↔ 2 ↔ 3 ↔ 4 ↔ 5 ↔ 1. Since there is no energy exchange at time slot 1~2 and 8, it mainly shows the iterative process of the consensus algorithm at time slot 3~7 in Figure 8, especially the excess energy at time slot 3~6 and deficit energy at time slot 7, which are representative.
As shown in Figure 8, after five runs of iteration, the variables nearly converge to the convergent value, which demonstrates that the consensus algorithm has efficient convergence. In summary, the convergent values and allocated proportions calculated by (45) and (46) are summarized in Table 11.
According to the allocated proportions, exported or imported electricity and natural gas for each DMES at time slot 3~6 are shown in Figure 9.
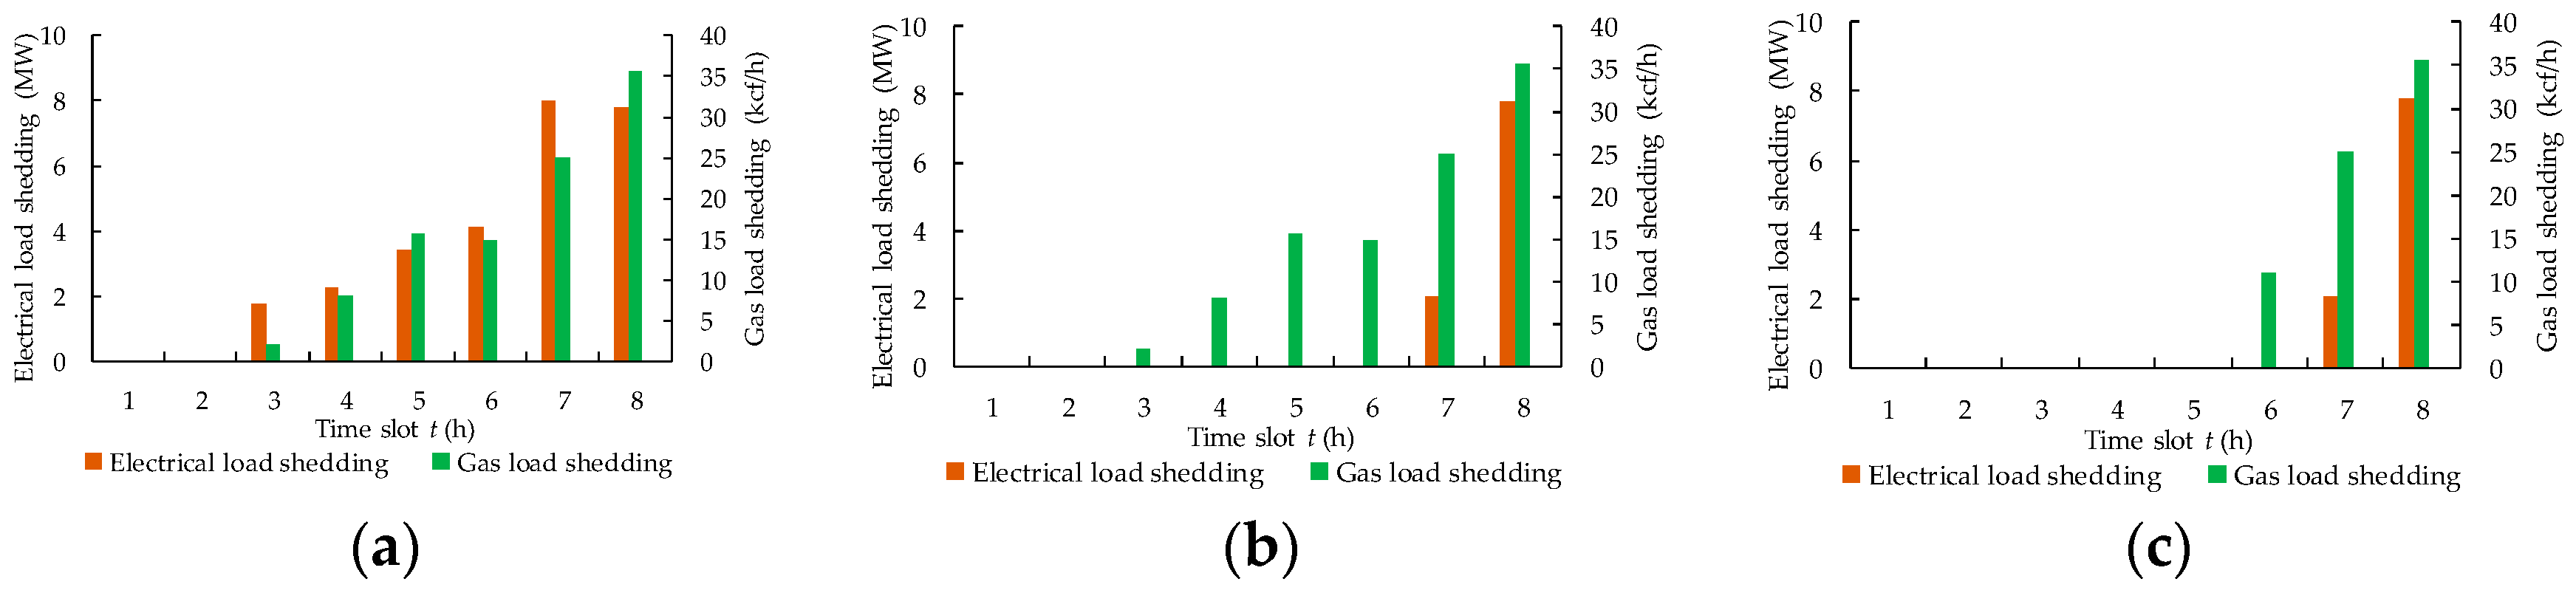
Figure 9 shows that the amount of exchange energy between DMESs is calculated for each DMES by the consensus algorithm. And then, the scheduling plan is updated. As noted earlier, the updated process is divided into two steps: the electrical load curtailment is mitigated in the first step and the gas load curtailment is mitigated in the second step. To clarify, the first step is called electricity update and the second step is called gas update in this paper. The load shedding of networked DMESs in the initial scheduling plan and the two updated scheduling plans are shown in Figure 10.
As shown in Figure 10, compared with the initial scheduling plan, the updated scheduling plan has less load shedding. In other words, after implementing the hierarchical management strategy, the networked DMESs can serve more consumers, avoiding severe loading shedding. If the IEDS has been repaired in time slot 1~5, the networked DMESs will not interrupt the load supply at all, which shows that IEDSs have the ability to absorb and withstand extreme events, so the hierarchical management strategy can enhance the resilience of IEDS.
5. Conclusions
IEDSs are efficient, clean and sustainable energy systems. However, increasingly frequent natural disasters pose a severe threat to the security of IEDSs. Hence, this paper studied the resilience of IEDSs against extreme events. A hierarchical management strategy was proposed, which includes the normal, preventive and resilient operation mode of DMESs. In the normal operation mode, the objective is to minimize costs. In the preventive operation mode, the objective is to maximize the stored energy. It is noted that the resilient operation mode is divided into two stages. In the first stage, each DMES develops its own scheduling plan with the objective of minimizing load shedding. And then, the excess and deficit energy is broadcasted to neighboring DMESs by the LLCs. In the second stage, a consensus algorithm is applied to calculate energy exchange between the networked DMESs. Next, the scheduling plan is updated in two steps and implemented. Finally, the numerical results demonstrate the effectiveness of the proposed hierarchical management strategy and algorithm. The main conclusions are summarized as follows:
(1)
This paper co-optimizes the electricity, natural gas and thermal energy for three operation modes at the distribution and utilization level, which promotes efficient and sustainable energy consumption.
(2)
The hierarchical management strategy can dispatch energy exchange fairly and reduce load shedding efficiently after extreme events, which demonstrates its enhancement for IEDS resilience.
(3)
The privacy of each DMES is respected since only information on excess and deficit energy is visible to neighboring DMESs through the consensus algorithm, which has efficient convergence.
Future research directions include the topology formation of IEDS, flexible resources for sectionalized restoration and the self-healing mode of IEDS.
Author Contributions
Methodology, S.Q.; Writing—original draft, S.Q.; Project administration, X.W.; Supervision, X.W. and X.L.; Writing—review and editing, T.Q.; investigation, Q.Z.
Funding
This research was funded by The National Key Research and Development Program of China (2018YFB0904800).
Conflicts of Interest
The authors declare no conflict of interest.
Nomenclature
Indices and Sets
t
Index of hours running from 1 to T.
n
Index of district multi-energy systems running from 1 to .
Index of batteries running from 1 to .
Index of gasholders running from 1 to .
Index of thermal storages running from 1 to .
Index of wind generators running from 1 to .
Index of photovoltaic plants running from 1 to .
Index of CHP units running from 1 to .
Index of electrical heat pumps running from 1 to .
Index of boilers running from 1 to .
Parameters
T1/T2/T3
Duration of scheduling horizon of the normal/preventive/resilient operation mode.
Number of district multi-energy systems.
//
Number of batteries/gasholders/thermal storages in DMES n.
/
Number of wind generators/photovoltaic plants in DMES n.
//
Number of CHP units/electrical heat pumps/boilers in DMES n.
/
Electricity/natural gas price at hour t.
//
Penalty cost of electrical/natural gas/heat load shedding of DMES n.
/
Charging/discharging cost of battery in DMES n.
/
Charging/discharging cost of gasholder in DMES n.
/
Charging/discharging cost of thermal storages in DMES n.
/
Penalty cost of wind generator /photovoltaic plant power curtailment.
//
Penalty cost of idle batteries/gasholders/thermal storages.
//
Electrical/natural gas/heat load in DMES n at hour t.
Ratio coefficient of power output of CHP units in DMES n.
/
Electrical/heat efficiency of CHP units in DMES n.
/
Ramp-up/down rates of CHP units in DMES n.
/
Ramp-up/down rates of EHP in DMES n.
/
Ramp-up/down rates of boiler in DMES n.
//
Maximum output of CHP units /EHP /boiler in DMES n.
/
Heat efficiency of EHP /boiler in DMES n.
/
Charging/discharging efficiency of battery in DMES n.
/
Charging/discharging efficiency of gasholder in DMES n.
/
Charging/discharging efficiency of thermal storage in DMES n.
/
Maximum charging/discharging of battery in DMES n.
/
Maximum charging/discharging of gasholder in DMES n.
/
Maximum charging/discharging of thermal storage in DMES n.
//
Capacity of battery /gasholder /thermal storage in DMES n.
/
Maximum electrical power/natural gas purchased from IEDS in DMES n.
/
Forecasted output of wind generator /photovoltaic plant in DMES n at hour t.
Variables
/
Electrical power/natural gas purchased from IEDS in DMES n at hour t.
//
Electrical/natural gas/heat load shedding in DMES n at hour t.
/
Charging/discharging power of battery in DMES n at hour t.
/
Charging/discharging natural gas of gasholder in DMES n at hour t.
/
Charging/discharging heat of gasholder in DMES n at hour t.
/
Power curtailment of wind generator /photovoltaic plant in DMES n at hour t.
/
Scheduled output of wind generator /photovoltaic plant in DMES n at hour t.
Gas consumption of CHP unit in DMES n at hour t.
/
Power/heat output of CHP unit in DMES n at hour t.
Power consumption of electrical heat pump in DMES n at hour t.
Heat output of electrical heat pump in DMES n at hour t.
Gas consumption of boiler in DMES n at hour t.
Heat output of boiler in DMES n at hour t.
//
Electricity/natural gas/heat stored in battery /gasholder /thermal storage in DMES n at hour t.
//
Binary variables for states of charge of battery /gasholder /thermal storage in DMES n at hour t.
References
Ye, J.; Yuan, R. Integrated Natural Gas, Heat, and Power Dispatch Considering Wind Power and Power-to-Gas. Sustainability2018, 9, 602. [Google Scholar] [CrossRef]
Ghiani, E.; Serpi, A.; Pilloni, V.; Sias, G.; Simone, M.; Marcialis, G.; Armano, G.; Pegoraro, P.A. A Multidisciplinary Approach for the Development of Smart Distribution Networks. Energies2018, 11, 2530. [Google Scholar] [CrossRef]
Keirstead, J.; Jennings, M.; Sivakumar, A. A Review of Urban Energy System Models: Approaches, Challenges and Opportunities. Renew. Sustain. Energy Rev.2012, 16, 3847–3866. [Google Scholar] [CrossRef]
Geidl, M.; Koeppel, G.; FavrePerrod, P.; Klockl, B.; Andersson, G.; Frohlich, K. Energy Hubs for the Future. IEEE Power Energy Mag.2007, 5, 24–30. [Google Scholar] [CrossRef]
Che, L.; Khodayar, M.; Shahidehpour, M. Only Connect: Microgrids for Distribution System Restoration. IEEE Power Energy Mag.2014, 12, 70–81. [Google Scholar]
Arif, A.; Wang, Z. Networked Microgrids for Service Restoration in Resilient Distribution Systems. IET Gener. Transmiss. Distrib.2017, 11, 3612–3619. [Google Scholar] [CrossRef]
Voghera, A.; Giudice, B. Evaluating and Planning Green Infrastructure: A Strategic Perspective for Sustainability and Resilience. Sustainability2019, 11, 2726. [Google Scholar] [CrossRef]
Lei, S.; Wang, J.; Chen, C.; Hou, Y. Mobile Emergency Generator Pre-Positioning and Real-Time Allocation for Resilient Response to Natural Disasters. IEEE Trans. Smart Grid2018, 9, 2030–2041. [Google Scholar] [CrossRef]
Kim, J.; Dvokin, Y. Enhancing Distribution System Resilience with Mobile Energy Storage and Microgrids. IEEE Trans. Smart Grid. to be published. [CrossRef]
Wang, C.; Hou, Y.; Qiu, F.; Lei, S.; Liu, K. Resilience Enhancement with Sequentially Proactive Operation Strategies. IEEE Trans. Power Syst.2017, 32, 2847–2857. [Google Scholar] [CrossRef]
Huang, G.; Wang, J.; Chen, C.; Qi, J.; Guo, C. Integration of Preventive and Emergency Responses for Power Grid Resilience Enhancement. IEEE Trans. Power Syst.2017, 32, 4451–4463. [Google Scholar] [CrossRef]
Zare-Bahramabadi, M.; Abbaspour, A.; Fotuhi-Hiruzabad, M.; Moeini-Aghtaie, M. Resilience-Based Framework for Switch Placement Problem in Power Distribution Systems. IET Gener. Transmiss. Distrib.2018, 12, 1223–1230. [Google Scholar] [CrossRef]
Wang, Z.; Wang, J. Self-Healing Resilient Distribution Systems Based on Sectionalization into Microgrids. IEEE Trans. Power Syst.2015, 30, 3139–3149. [Google Scholar] [CrossRef]
Chen, C.; Wang, J.; Qiu, F.; Zhao, D. Resilient Distribution System by Microgrids Formation After Natural Disasters. IEEE Trans. Smart Grid2016, 7, 958–966. [Google Scholar] [CrossRef]
Ma, S.; Chen, B.; Wang, Z. Resilience Enhancement Strategy for Distribution Systems Under Extreme Weather Events. IEEE Trans. Smart Grid2018, 9, 1442–1451. [Google Scholar] [CrossRef]
Gholami, A.; Aminifar, F.; Shahidepour, M. Front Lines Against the Darkness Enhancing the Resilience of the Electricity Grid through Microgrid Facilities. IEEE Electrif. Mag.2016, 4, 18–24. [Google Scholar] [CrossRef]
Marnay, C.; Aki, H.; Hirose, K.; Kwasinski, A.; Ogura, S.; Shinji, T. Japan’s Pivot to Resilience: How Two Microgrids Fared after the 2011 Earthquake. IEEE Power Energy Mag.2015, 13, 44–57. [Google Scholar] [CrossRef]
Liu, X.; Shahidepour, M.; Li, Z.; Liu, X.; Cao, Y.; Bie, Z. Microgrids for Enhancing the Power Grid Resilience in Extreme Conditions. IEEE Trans. Smart Grid2017, 8, 589–597. [Google Scholar]
Wang, Z.; Chen, B.; Wang, J.; Chen, C. Networked Microgrids for Self-Healing Power Systems. IEEE Trans. Smart Grid2016, 7, 310–319. [Google Scholar] [CrossRef]
Farzin, H.; Fotuhi-Firuzabad, M.; Moeini-Aghtaie, M. Enhancing Power System Resilience through Hierarchical Outage Management in Multi-Microgrids. IEEE Trans. Smart Grid2016, 7, 2869–2879. [Google Scholar] [CrossRef]
Shao, C.; Shahidepour, M.; Wang, X.; Wang, X.; Wang, B. Integrated Planning of Electricity and Natural Gas Transportation Systems for Enhancing the Power Grid Resilience. IEEE Trans. Power Syst.2017, 32, 4418–4429. [Google Scholar] [CrossRef]
Clegg, S.; Mancarella, P. Integrated Electricity-Heat-Gas Network Modelling for the Evaluation of System Resilience to Extreme Weather. In Proceedings of the 2017 IEEE Manchester PowerTech, Manchester, UK, 18–22 June 2017. [Google Scholar]
Dominguez-Garcia, A.D.; Hadjicostis, C.N.; Vaidya, N.H. Resilient Networked Control of Distributed Energy Resources. IEEE J. Sel. Areas Commun.2012, 30, 1137–1148. [Google Scholar] [CrossRef]
Nastasi, B.; Basso, G.; Garcia, D.; Cumo, F.; Santoli, L. Power-to-gas Leverage Effect on Power-to-heat Application for Unban Renewable Thermal Energy Systems. Int. J. Hydrogen Energy2018, 43, 23076–23090. [Google Scholar] [CrossRef]
Olfati-Saver, R.; Murray, R. Consensus Problems in Networks of Agents with Switching Topology and Time-Delays. IEEE Trans. Autom. Control2004, 49, 1520–1533. [Google Scholar] [CrossRef]
Olfati-Saver, R.; Alex Fax, J.; Murray, R. Consensus and Cooperation in Networked Multi-Agent Systems. Proc. IEEE2007, 95, 215–233. [Google Scholar] [CrossRef]
Figure 1.
Schematic diagram of a district multi-energy system (DMES).
Figure 1.
Schematic diagram of a district multi-energy system (DMES).
Figure 2.
Schematic diagram of the networked DMESs.
Figure 2.
Schematic diagram of the networked DMESs.
Figure 3.
The operation of energy storages in three modes.
Figure 3.
The operation of energy storages in three modes.
Figure 4.
Implementation process of the hierarchical management strategy.
Figure 4.
Implementation process of the hierarchical management strategy.
Figure 5.
The forecasted output of DGs.
Figure 5.
The forecasted output of DGs.
Figure 6.
The electrical load, gas load and heat load of DMESs. (a) Electrical load; (b) Gas load; (c) Heat load.
Figure 6.
The electrical load, gas load and heat load of DMESs. (a) Electrical load; (b) Gas load; (c) Heat load.
Figure 7.
Electrical power and natural gas purchased curves; (a) Electrical power purchased; (b) Natural gas purchased.
Figure 7.
Electrical power and natural gas purchased curves; (a) Electrical power purchased; (b) Natural gas purchased.
Figure 8.
The iterative process of the consensus algorithm at time slot 3~7. (a) Excess electricity at time slot 3; (b) Excess natural gas at time slot 3; (c) Excess electricity at time slot 4; (d) Excess natural gas at time slot 4; (e) Excess electricity at time slot 5; (f) Excess natural gas at time slot 5; (g) Excess electricity at time slot 6; (h) Deficit electricity at time slot 7; (i) Deficit natural gas at time slot 7.
Figure 9.
The electricity and natural gas exchange at time slot 3~6. (a) Electricity exchanged at time slot 3; (b) Natural gas exchanged at time slot 3; (c) Electricity exchanged at time slot 4; (d) Natural gas exchanged at time slot 4; (e) Electricity exchanged at time slot 5; (f) Natural gas exchanged at time slot 5; (g) Electricity exchanged at time slot 6; (h) Natural gas exchanged at time slot 6.
Figure 10.
The load shedding of networked DMESs. (a) Initial scheduling plan; (b) Electricity update; (c) Gas update.
Figure 10.
The load shedding of networked DMESs. (a) Initial scheduling plan; (b) Electricity update; (c) Gas update.
Table 1.
Information on combined heat and power (CHP) units.
Table 1.
Information on combined heat and power (CHP) units.
n
1, 2, 3, 5
0.8
0.75
0.75
4
2
−2
4
0.8
0.75
0.75
5
2
−2
Table 2.
Information on electrical heat pumps (EHPs).
Table 2.
Information on electrical heat pumps (EHPs).
n
1, 2, 3, 4, 5
0.75
2
0.8
−0.8
Table 3.
Information on boilers.
Table 3.
Information on boilers.
n
1, 2, 3, 4, 5
0.8
2
1
−1
Table 4.
Information on batteries.
Table 4.
Information on batteries.
n
1
10
0.9
0.9
1.5
1.5
1
1
2
6
0.9
0.9
1
1
1
1
3
4
0.9
0.9
0.8
1
1
1
4
12
0.9
0.9
1.5
2
1
1
5
8
0.9
0.9
1.5
1.5
1
1
Table 5.
Information on gasholders.
Table 5.
Information on gasholders.
n
1
120
0.95
0.95
15
25
1
1
2
60
0.95
0.95
10
20
1
1
3
40
0.95
0.95
10
20
1
1
4
160
0.95
0.95
30
30
1
1
5
100
0.95
0.95
15
20
1
1
Table 6.
Information on heat storages.
Table 6.
Information on heat storages.
n
1
120
0.95
0.95
15
25
1
1
2
60
0.95
0.95
10
20
1
1
3
40
0.95
0.95
10
20
1
1
4
160
0.95
0.95
30
30
1
1
5
100
0.95
0.95
15
20
1
1
Table 7.
Information on price.
Table 7.
Information on price.
t
t
t
t
1
67.09
16.93
7
71.34
22.15
13
70.88
20.25
19
72.56
24.60
2
66.89
16.60
8
71.04
22.60
14
71.10
20.25
20
71.19
24.43
3
67.64
15.75
9
71.41
23.77
15
71.52
20.48
21
70.42
20.53
4
68.64
16.85
10
71.61
23.73
16
72.27
24.50
22
70.16
17.98
5
69.54
20.54
11
71.23
23.93
17
72.82
24.65
23
69.36
17.88
6
70.16
21.30
12
71.17
23.75
18
73.15
25.00
24
66.92
17.18
Table 8.
Information on penalty cost parameters.
Table 8.
Information on penalty cost parameters.
5000
2000
1000
80
80
100
50
50
Table 9.
The excess electricity and natural gas.
Table 9.
The excess electricity and natural gas.
Time Slot t (h)
1
2
3
4
5
6
7
8
+ (MW)
DMES 1
1.34
1.72
2.01
2.51
2.56
2.76
0
0
DMES 2
0.97
0.68
1.43
0
0
0
0
0
DMES 3
0.48
0.84
0
0
0
0
0
0
DMES 4
1.16
2.05
1.80
1.91
3.14
1.98
0.77
0
DMES 5
1.17
0.97
1.52
1.64
1.16
0.08
0
0
(kcf/h)
DMES 1
13.52
11.86
8.89
8.48
6.82
2.23
0
0
DMES 2
6.84
3.67
5.68
0
0
0
0
0
DMES 3
3.89
4.52
0
0
0
0
0
0
DMES 4
16.61
16.61
13.16
9.14
8.48
1.60
0
0
DMES 5
7.40
5.23
6.06
5.53
3.15
0.06
0
0
Table 10.
The deficit electricity and natural gas.
Table 10.
The deficit electricity and natural gas.
Time Slot t (h)
1
2
3
4
5
6
7
8
(MW)
DMES 1
0
0
0
0
0
0
1.70
1.18
DMES 2
0
0
0
0.20
1.18
1.82
2.00
1.40
DMES 3
0
0
1.75
2.05
2.23
2.27
2.05
1.09
DMES 4
0
0
0
0
0
0
0
2.18
DMES 5
0
0
0
0
0
0
2.26
1.94
(kcf/h)
DMES 1
0
0
0
0
0
0
2.15
5.84
DMES 2
0
0
0
0
7.84
7.39
7.80
6.90
DMES 3
0
0
2.13
8.01
7.86
7.46
7.81
7.32
DMES 4
0
0
0
0
0
0
0
8.04
DMES 5
0
0
0
0
0
0
7.16
7.53
Table 11.
The convergent values and allocated proportions.
Table 11.
The convergent values and allocated proportions.
Qi, S.; Wang, X.; Li, X.; Qian, T.; Zhang, Q.
Enhancing Integrated Energy Distribution System Resilience through a Hierarchical Management Strategy in District Multi-Energy Systems. Sustainability2019, 11, 4048.
https://doi.org/10.3390/su11154048
AMA Style
Qi S, Wang X, Li X, Qian T, Zhang Q.
Enhancing Integrated Energy Distribution System Resilience through a Hierarchical Management Strategy in District Multi-Energy Systems. Sustainability. 2019; 11(15):4048.
https://doi.org/10.3390/su11154048
Chicago/Turabian Style
Qi, Shixiong, Xiuli Wang, Xue Li, Tao Qian, and Qiwen Zhang.
2019. "Enhancing Integrated Energy Distribution System Resilience through a Hierarchical Management Strategy in District Multi-Energy Systems" Sustainability 11, no. 15: 4048.
https://doi.org/10.3390/su11154048
APA Style
Qi, S., Wang, X., Li, X., Qian, T., & Zhang, Q.
(2019). Enhancing Integrated Energy Distribution System Resilience through a Hierarchical Management Strategy in District Multi-Energy Systems. Sustainability, 11(15), 4048.
https://doi.org/10.3390/su11154048
Note that from the first issue of 2016, this journal uses article numbers instead of page numbers. See further details here.
Article Metrics
No
No
Article Access Statistics
For more information on the journal statistics, click here.
Multiple requests from the same IP address are counted as one view.
Qi, S.; Wang, X.; Li, X.; Qian, T.; Zhang, Q.
Enhancing Integrated Energy Distribution System Resilience through a Hierarchical Management Strategy in District Multi-Energy Systems. Sustainability2019, 11, 4048.
https://doi.org/10.3390/su11154048
AMA Style
Qi S, Wang X, Li X, Qian T, Zhang Q.
Enhancing Integrated Energy Distribution System Resilience through a Hierarchical Management Strategy in District Multi-Energy Systems. Sustainability. 2019; 11(15):4048.
https://doi.org/10.3390/su11154048
Chicago/Turabian Style
Qi, Shixiong, Xiuli Wang, Xue Li, Tao Qian, and Qiwen Zhang.
2019. "Enhancing Integrated Energy Distribution System Resilience through a Hierarchical Management Strategy in District Multi-Energy Systems" Sustainability 11, no. 15: 4048.
https://doi.org/10.3390/su11154048
APA Style
Qi, S., Wang, X., Li, X., Qian, T., & Zhang, Q.
(2019). Enhancing Integrated Energy Distribution System Resilience through a Hierarchical Management Strategy in District Multi-Energy Systems. Sustainability, 11(15), 4048.
https://doi.org/10.3390/su11154048
Note that from the first issue of 2016, this journal uses article numbers instead of page numbers. See further details here.


