Global Research on Carbon Emissions: A Scientometric Review

 ,
,
Abstract
1. Introduction
Research Gap, Objective and Research Novelty
2. Literature Overview
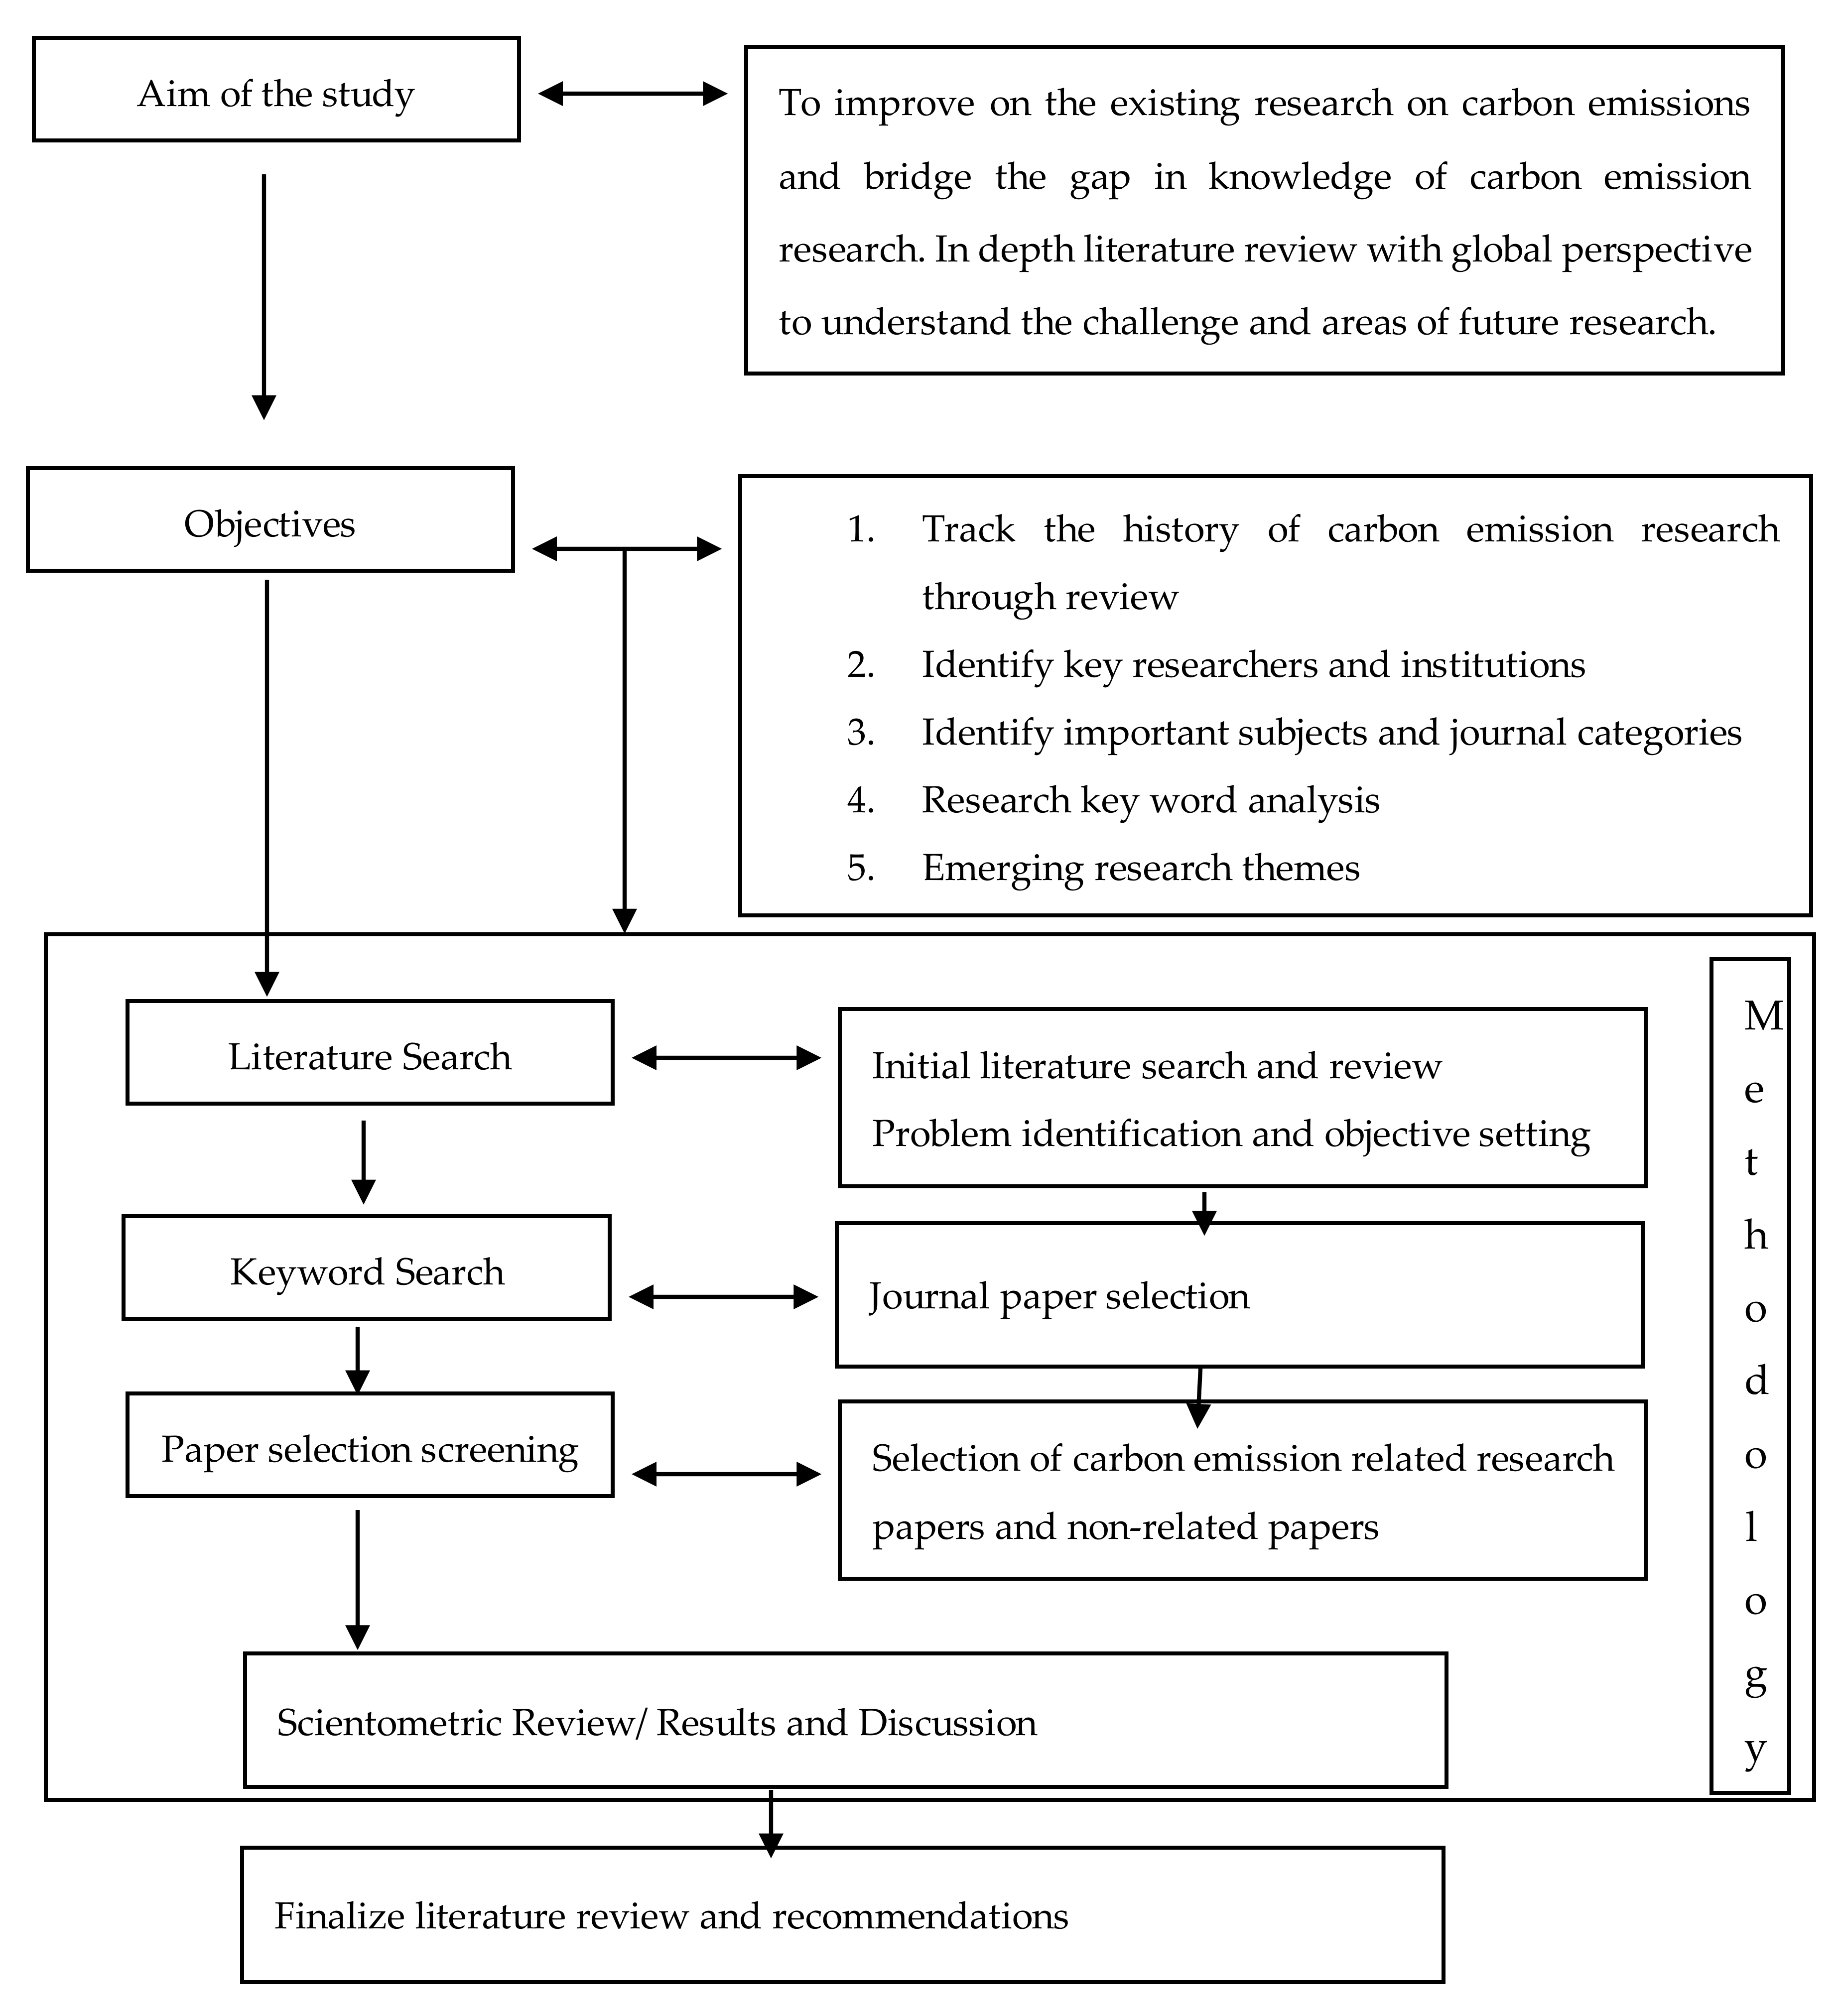
3. Methodology
3.1. Selection of Science Mapping Tool
3.2. Data Collection
3.3. Data Analysis Strategy
3.4. Scientometric Analysis
4. Results and Discussion
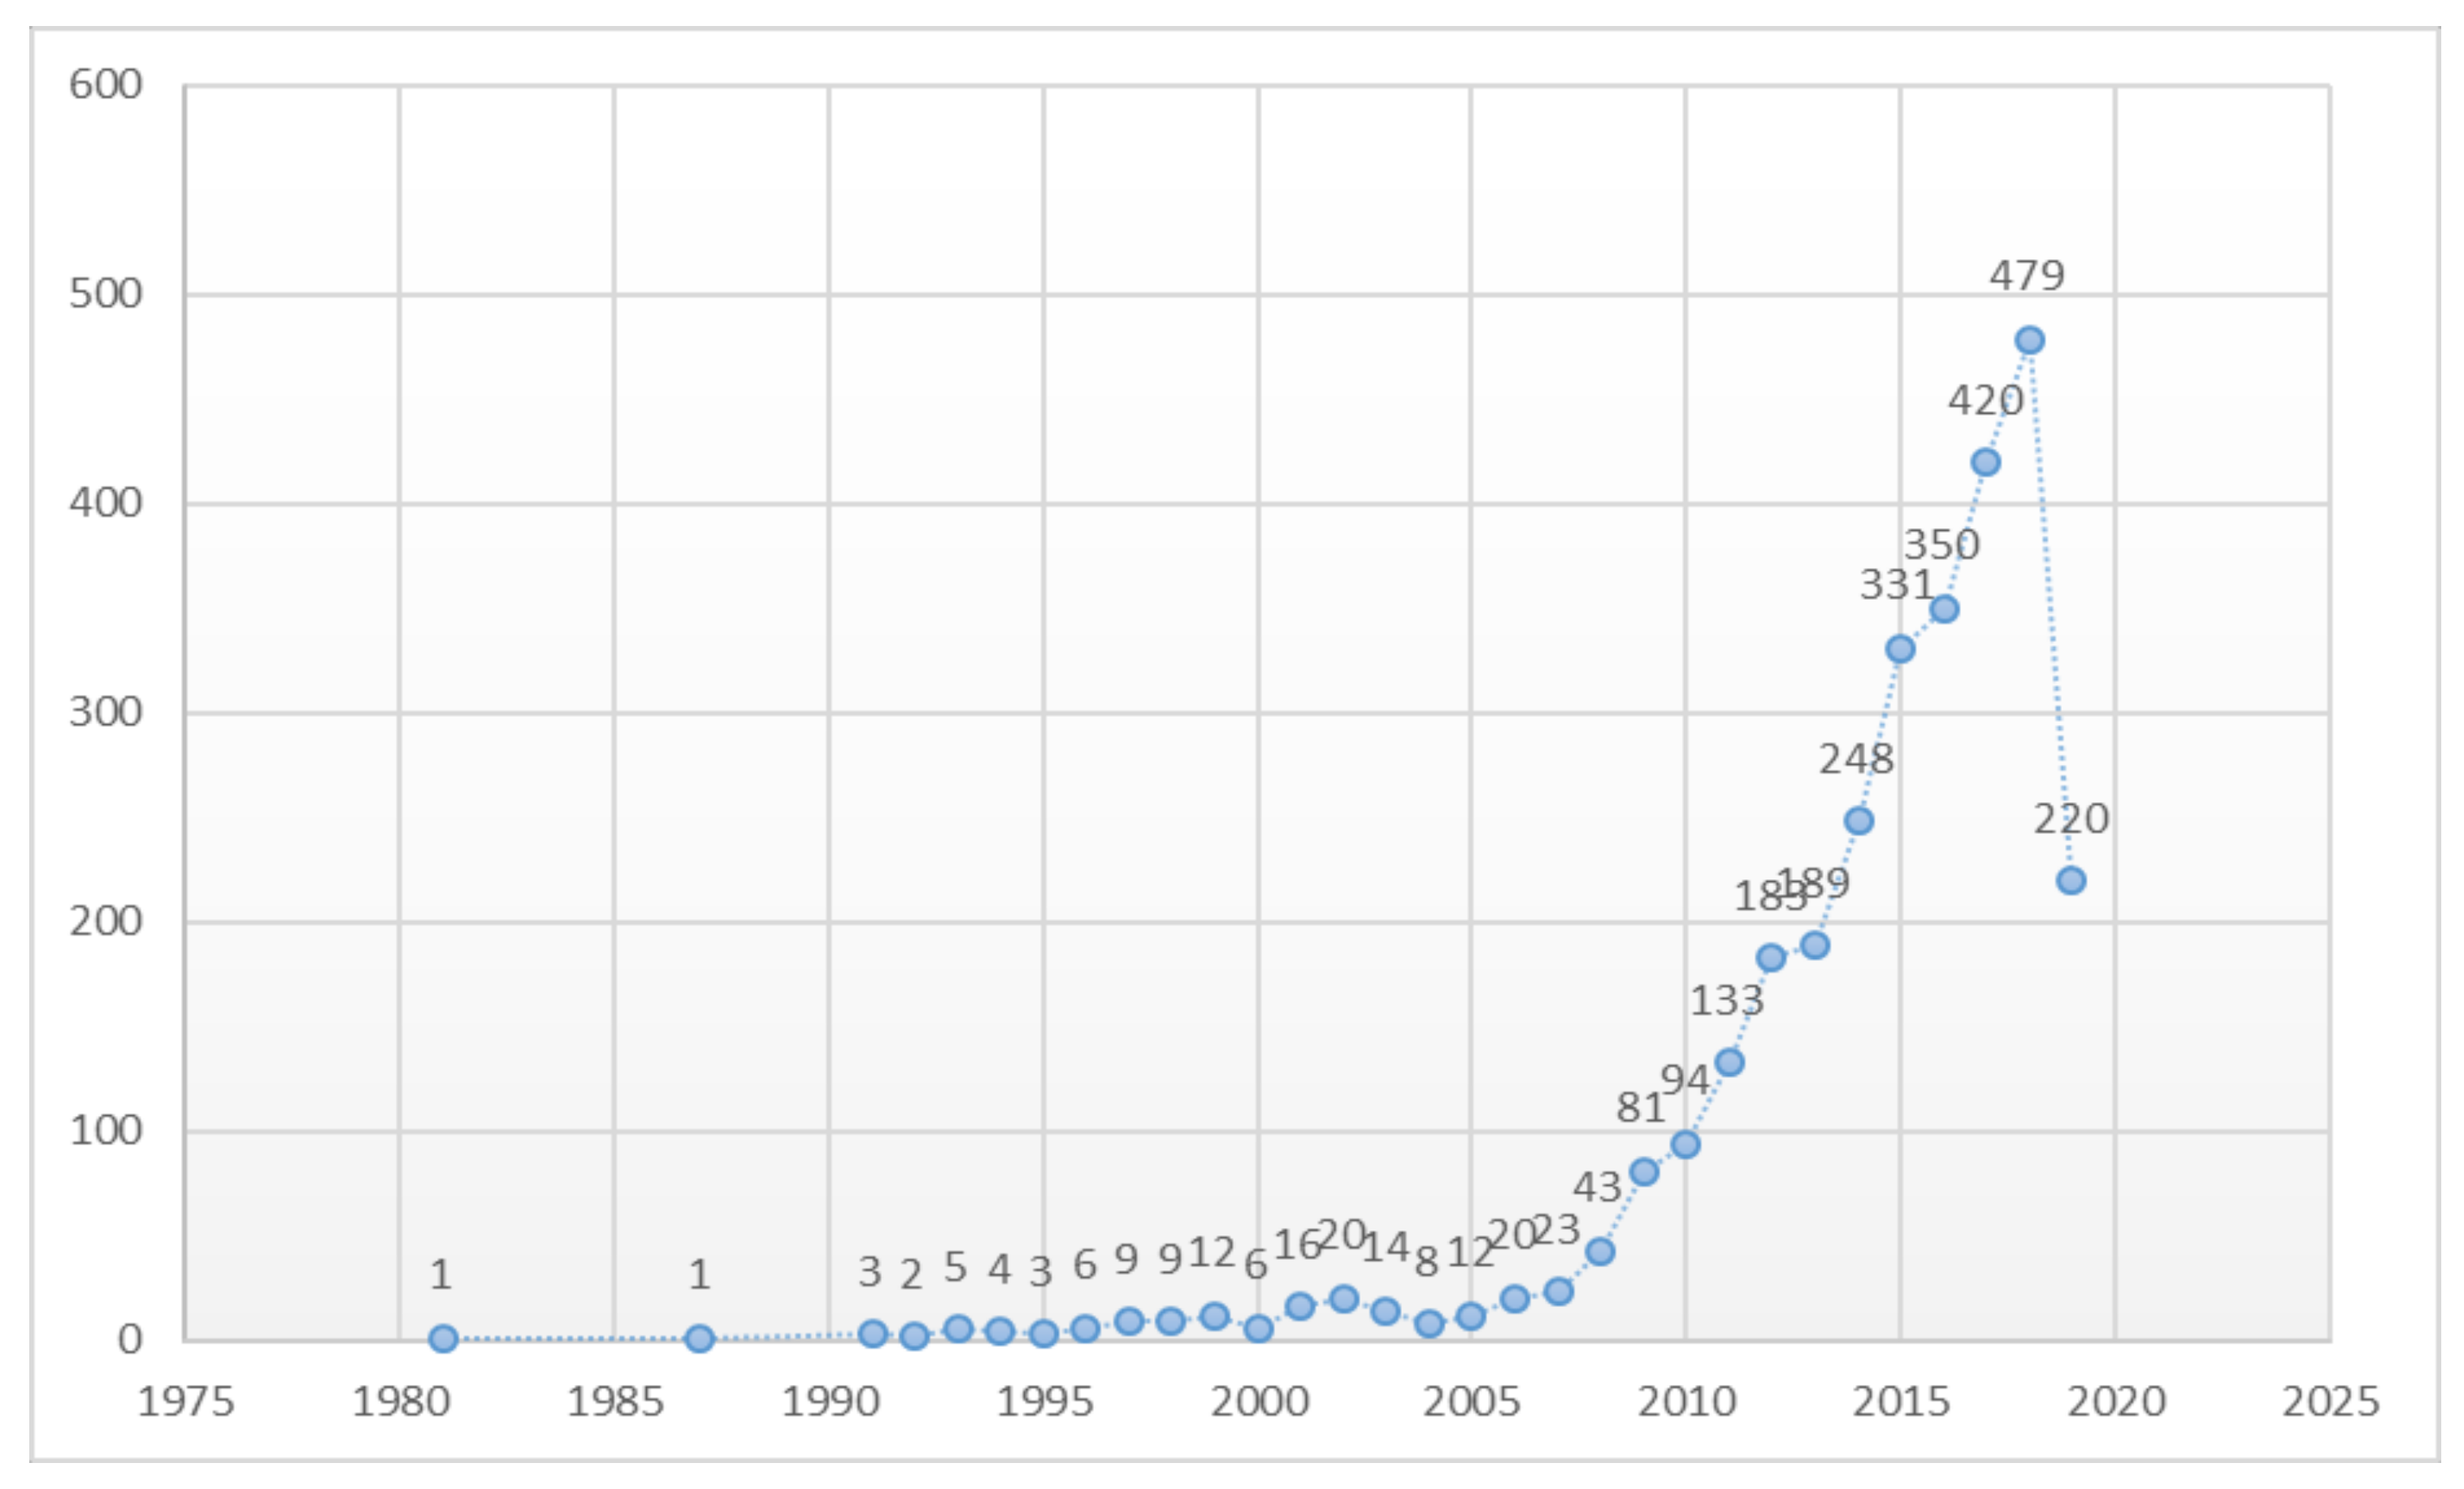
4.1. Global Trends of Carbon Emission Research
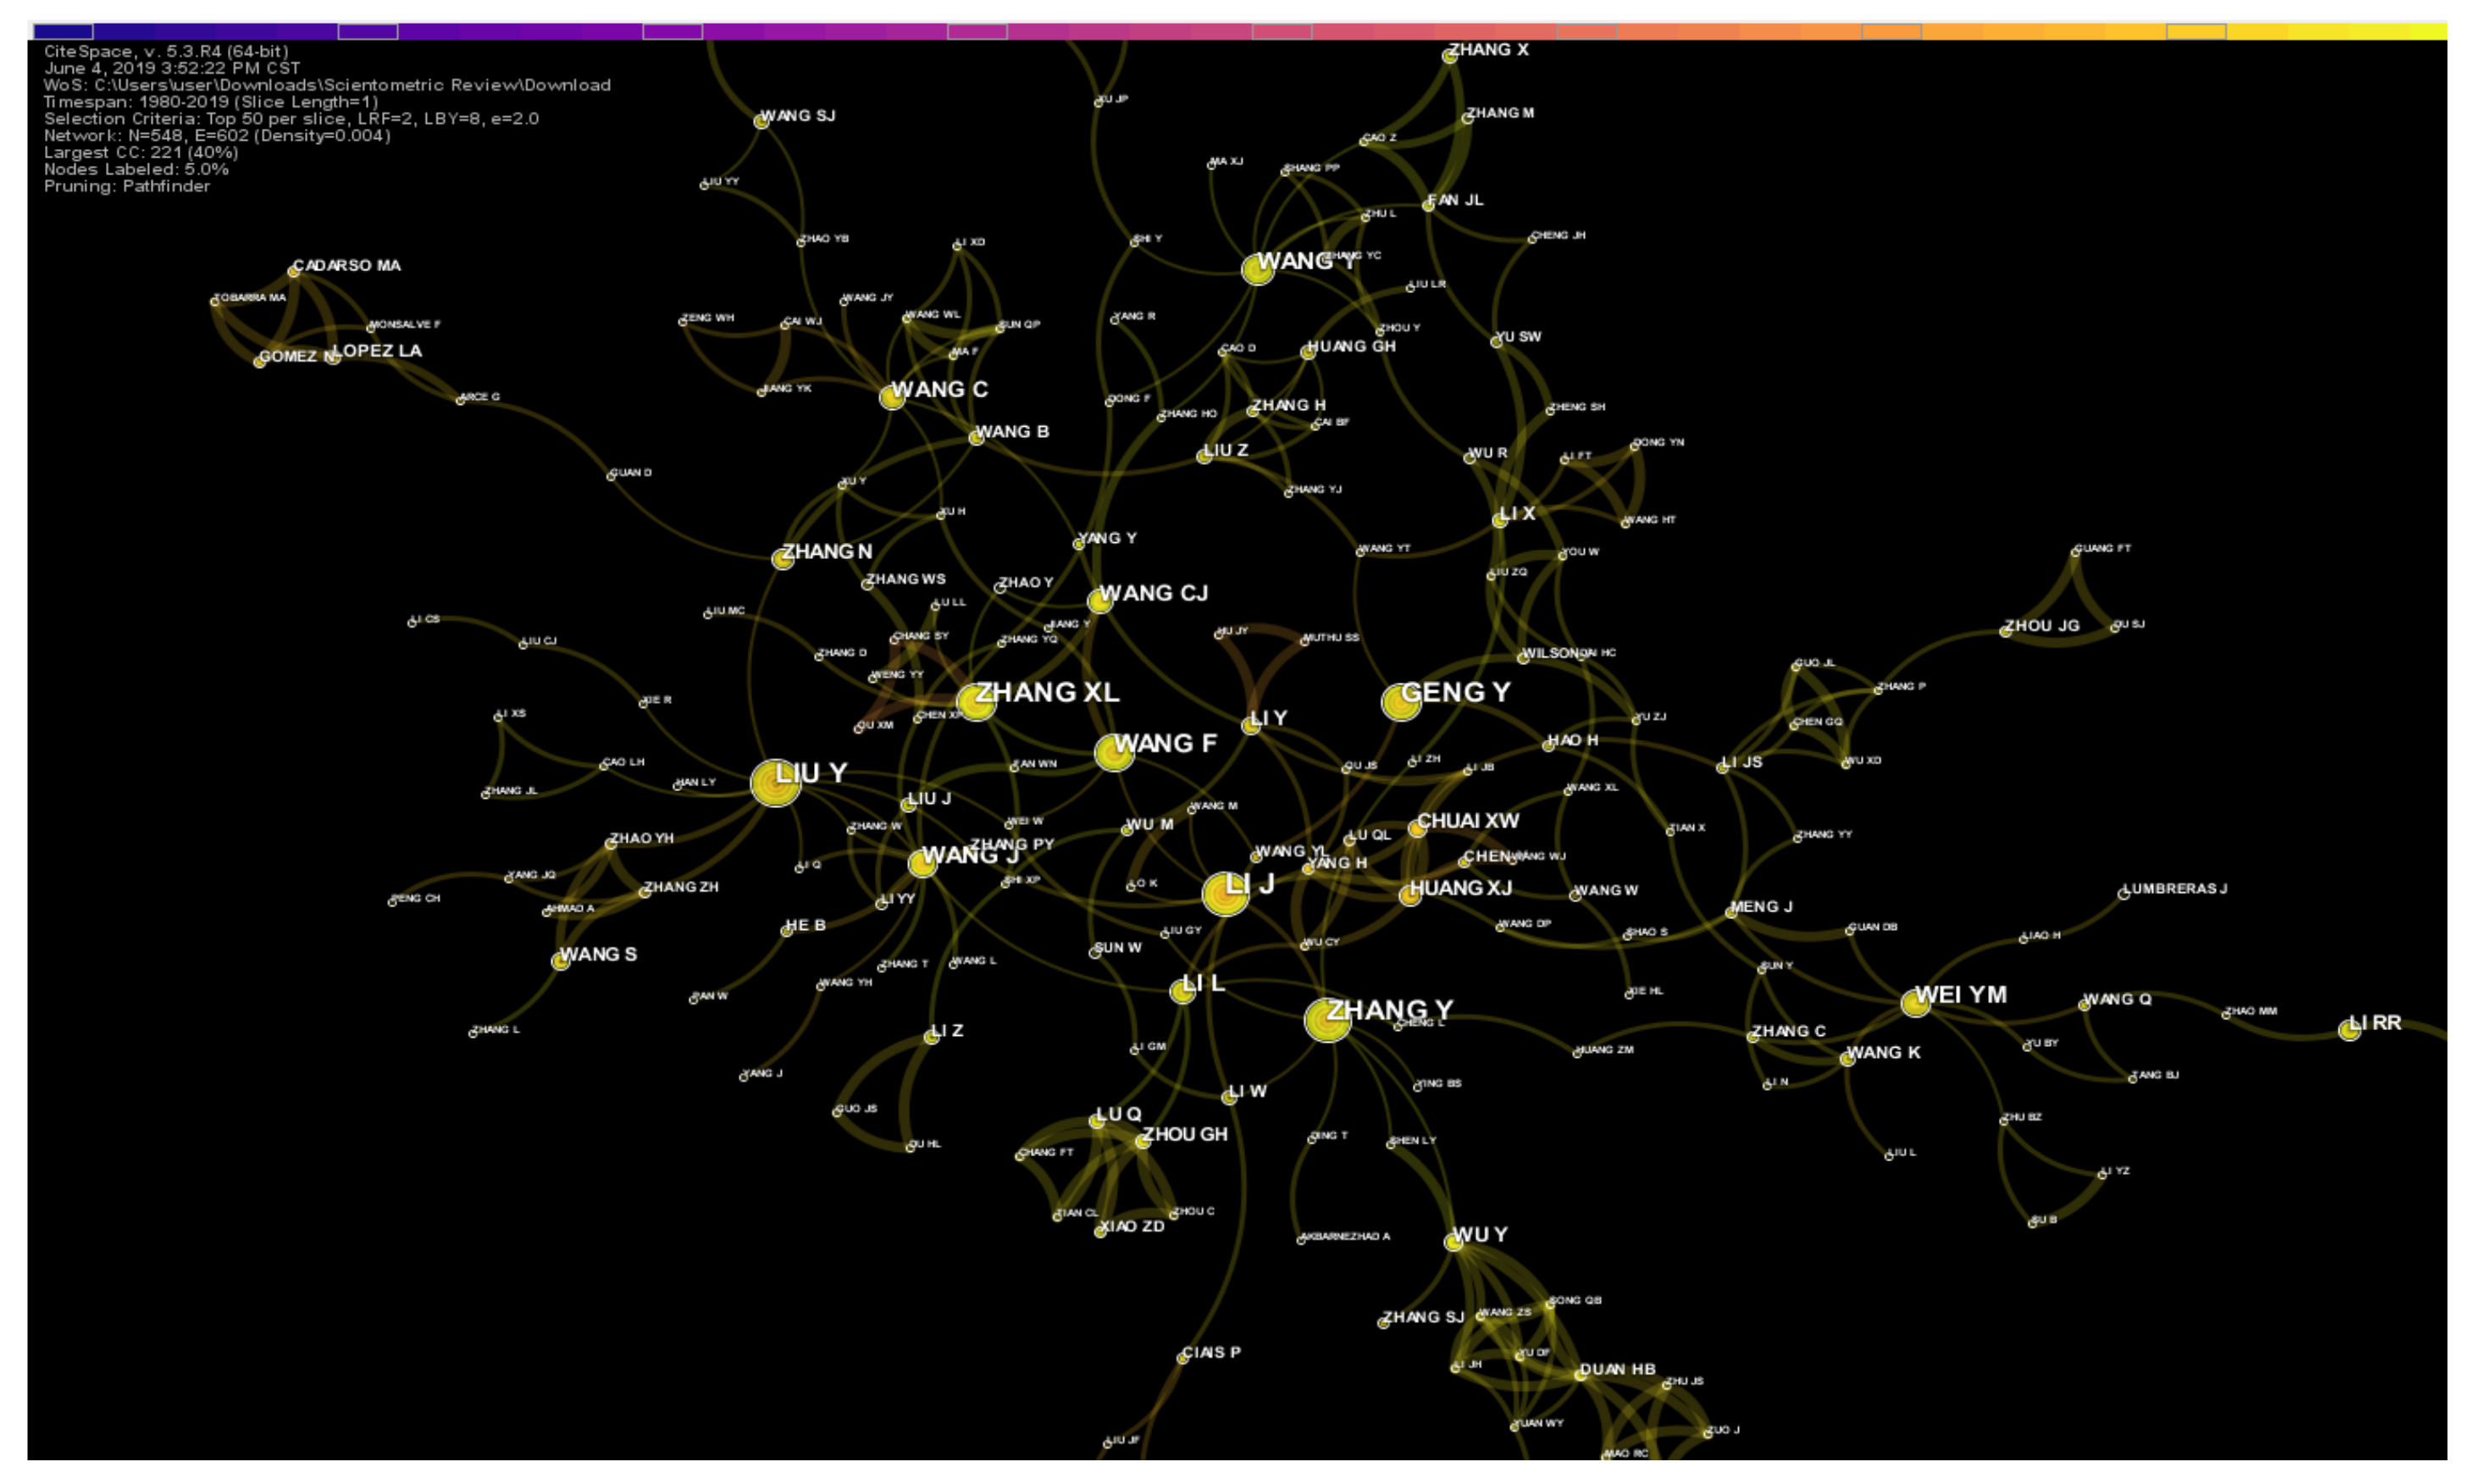
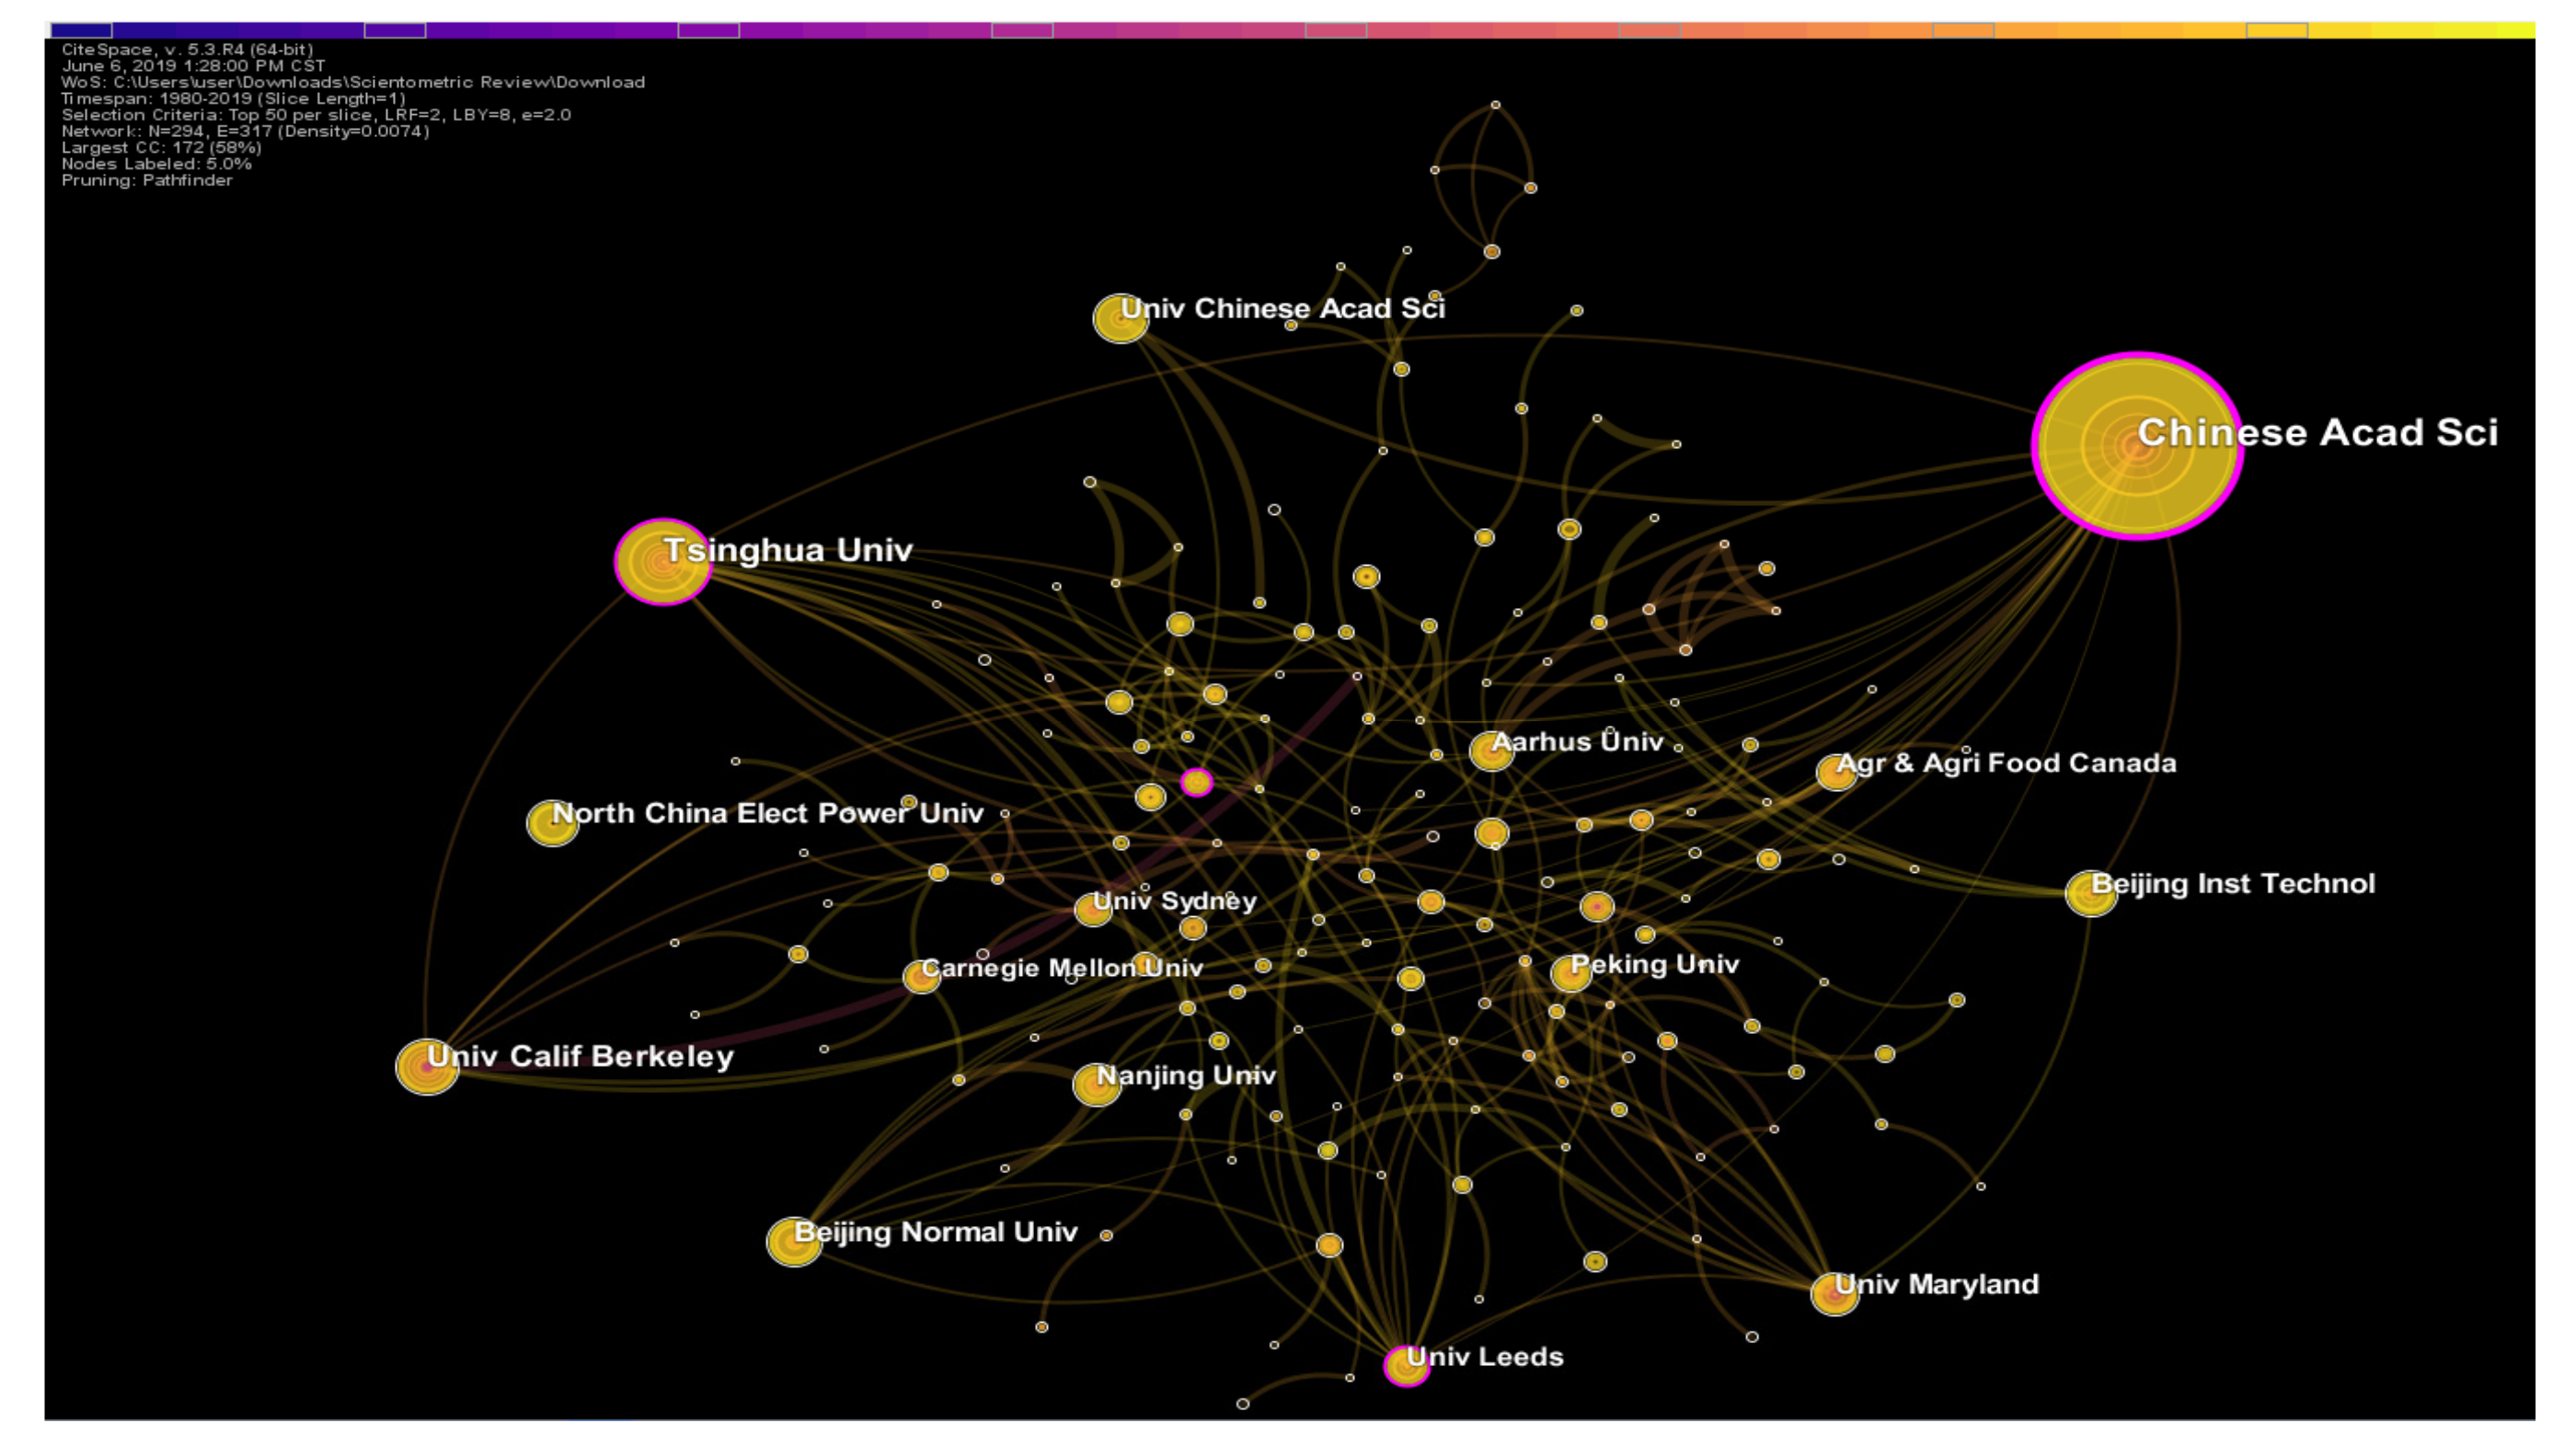
4.2. Co-Author Scientometric Analysis Rresults
4.3. Co-Word Scientometric Analysis Result
4.4. Co-Citation Analysis Result
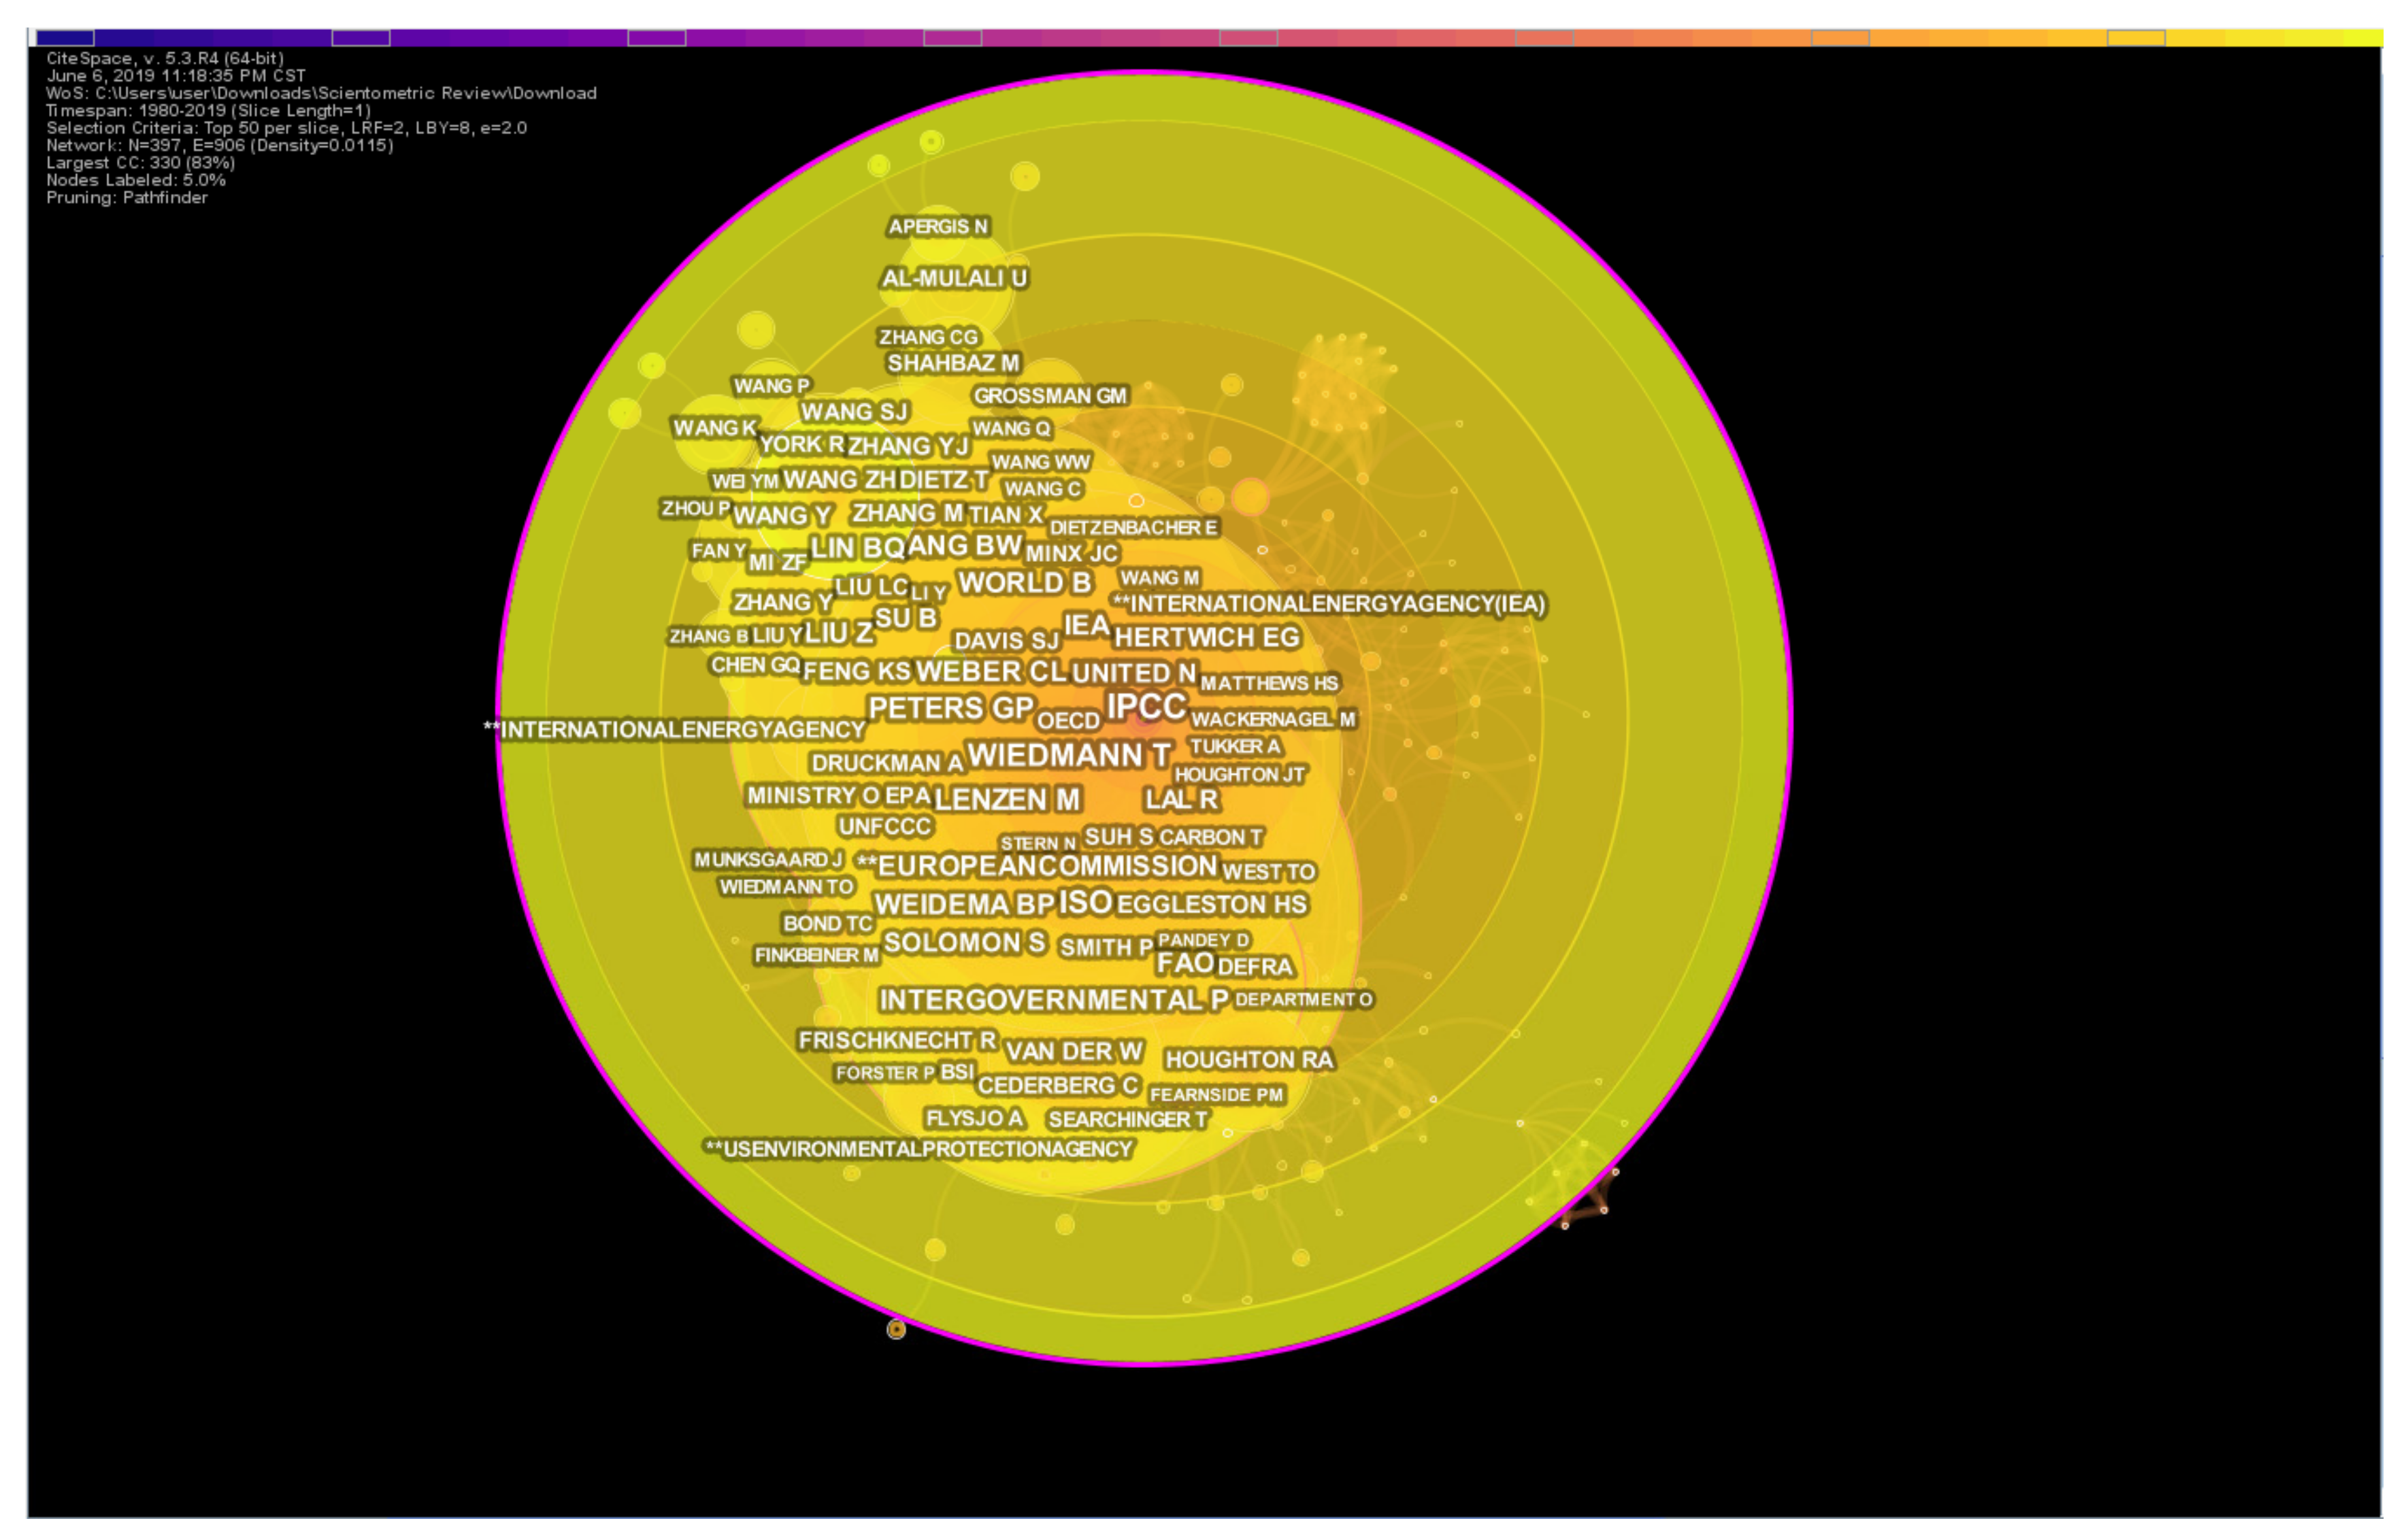
4.5. Author Co-Citation Analysis
4.6. Future Research Areas on Global Carbon Emissions
5. Conclusions
Author Contributions
Funding
Conflicts of Interest
References
- Liu, D.; Guo, X.; Xiao, B. What causes growth of global greenhouse gas emissions? Evidence from 40 countries. Sci. Total. Environ. 2019, 661, 750–766. [Google Scholar] [CrossRef]
- Zhang, Y.-J.; Da, Y.-B. The decomposition of energy-related carbon emission and its decoupling with economic growth in China. Renew. Sustain. Energy Rev. 2015, 41, 1255–1266. [Google Scholar] [CrossRef]
- The World Bank Group. World Development Indicators. 2018. Available online: https://data.worldbank.org/ (accessed on 10 June 2019).
- Heede, R. Tracing anthropogenic carbon dioxide and methane emissions to fossil fuel and cement producers, 1854–2010. Clim. Chang. 2014, 122, 229–241. [Google Scholar] [CrossRef]
- Liu, L.-J.; Liang, Q.-M. Changes to pollutants and carbon emission multipliers in China 2007–2012: An input-output structural decomposition analysis. J. Environ. Manag. 2017, 203, 76–86. [Google Scholar] [CrossRef] [PubMed]
- Wang, H.; Ang, B.; Su, B. A Multi-region Structural Decomposition Analysis of Global CO2 Emission Intensity. Ecol. Econ. 2017, 142, 163–176. [Google Scholar] [CrossRef]
- Voigt, S.; De Cian, E.; Schymura, M.; Verdolini, E. Energy intensity developments in 40 major economies: Structural change or technology improvement? Energy Econ. 2014, 41, 47–62. [Google Scholar] [CrossRef]
- Lan, J.; Malik, A.; Lenzen, M.; McBain, D.; Kanemoto, K. A structural decomposition analysis of global energy footprints. Appl. Energy 2016, 163, 436–451. [Google Scholar] [CrossRef]
- Xu, J.-H.; Fleiter, T.; Eichhammer, W.; Fan, Y. Energy consumption and CO2 emissions in China’s cement industry: A perspective from LMDI decomposition analysis. Energy Policy 2012, 50, 821–832. [Google Scholar] [CrossRef]
- Zhao, Z.-Y.; Chang, R.-D.; Zillante, G. Challenges for China’s energy conservation and emission reduction. Energy Policy 2014, 74, 709–713. [Google Scholar] [CrossRef]
- Michaelowa, A.; Michaelowa, K. Do rapidly developing countries take up new responsibilities for climate change mitigation? Clim. Chang. 2015, 133, 499–510. [Google Scholar] [CrossRef]
- Jiang, M.; An, H.; Gao, X.; Liu, S.; Xi, X. Factors driving global carbon emissions: A complex network perspective. Resour. Conserv. Recycl. 2019, 146, 431–440. [Google Scholar] [CrossRef]
- Hammond, G.; Norman, J. Decomposition analysis of energy-related carbon emissions from UK manufacturing. Energy 2012, 41, 220–227. [Google Scholar] [CrossRef]
- Ren, S.; Yin, H.; Chen, X. Using LMDI to analyze the decoupling of carbon dioxide emissions by China’s manufacturing industry. Environ. Dev. 2014, 9, 61–75. [Google Scholar] [CrossRef]
- Ouyang, X.; Lin, B. An analysis of the driving forces of energy-related carbon dioxide emissions in China’s industrial sector. Renew. Sustain. Energy Rev. 2015, 45, 838–849. [Google Scholar] [CrossRef]
- Hong, J.; Shen, G.Q.; Feng, Y.; Lau, W.S.-T.; Mao, C. Greenhouse gas emissions during the construction phase of a building: A case study in China. J. Clean. Prod. 2015, 103, 249–259. [Google Scholar] [CrossRef]
- Lu, Y.; Stegman, A.; Cai, Y. Emissions intensity targeting: From China’s 12th Five Year Plan to its Copenhagen commitment. Energy Policy 2013, 61, 1164–1177. [Google Scholar] [CrossRef]
- Crawford, R. Life Cycle Assessment in the Built Environment; Routledge: Thames, UK, 2011. [Google Scholar]
- Guo, C.; Gao, Z.; Shen, J. Emission rates of indoor ozone emission devices: A literature review. Build. Environ. 2019, 158, 302–318. [Google Scholar] [CrossRef]
- Bartolini, M.; Bottani, E.; Eric, H. Green warehousing: Systematic literature review and bibliometric analysis. J. Clean. Prod. 2019, 226, 242–258. [Google Scholar] [CrossRef]
- Evans, M.; Kholod, N.; Kuklinski, T.; Denysenko, A.; Smith, S.J.; Staniszewski, A.; Hao, W.M.; Liu, L.; Bond, T.C. Black carbon emissions in Russia: A critical review. Atmospheric Environ. 2017, 163, 9–21. [Google Scholar] [CrossRef]
- Vernon, W.D.; Wyman, B.M.; Hubert, R.V.; Snyder, J.R. A Device for Measuring Volatile Organic-Carbon Emissions from Cooling-Tower Water. J. Air Pollut. Control. Assoc. 1981, 31, 1280–1282. [Google Scholar] [CrossRef]
- Lai, J.H.; Yik, F.W.; Man, C. Carbon audit: A literature review and an empirical study on a hotel. Facilities 2012, 30, 417–431. [Google Scholar] [CrossRef]
- Melillo, J.M.; Richmond, T.; Yohe, G. Climate change impacts in the United States. Third Natl. Clim. Assess. 2014, 52, 841. [Google Scholar]
- Cabeza, L.F.; Rincón, L.; Vilariño, V.; Pérez, G.; Castell, A. Life cycle assessment (LCA) and life cycle energy analysis (LCEA) of buildings and the building sector: A review. Renew. Sustain. Energy Rev. 2014, 29, 394–416. [Google Scholar] [CrossRef]
- Čuček, L.; Klemeš, J.J.; Kravanja, Z. A Review of Footprint analysis tools for monitoring impacts on sustainability. J. Clean. Prod. 2012, 34, 9–20. [Google Scholar] [CrossRef]
- Mathe, S. Integrating participatory approaches into social life cycle assessment: The SLCA participatory approach. Int. J. Life Cycle Assess. 2014, 19, 1506–1514. [Google Scholar] [CrossRef]
- Dormady, N.C. Carbon auctions, energy markets & market power: An experimental analysis. Energy Econ. 2014, 44, 468–482. [Google Scholar]
- Duan, H.; Hu, Q. Local officials’ concerns of climate change issues in China: A case from Jiangsu. J. Clean. Prod. 2014, 64, 545–551. [Google Scholar] [CrossRef]
- Ermolieva, T.; Ermoliev, Y.; Fischer, G.; Jonas, M.; Makowski, M.; Wagner, F. Carbon emission trading and carbon taxes under uncertainties. Clim. Chang. 2010, 103, 277–289. [Google Scholar] [CrossRef]
- Peters, G.P. Carbon footprints and embodied carbon at multiple scales. Curr. Opin. Environ. Sustain. 2010, 2, 245–250. [Google Scholar] [CrossRef]
- Wiedmann, T.; Minx, J. A definition of ‘carbon footprint’. Ecol. Econ. Res. Trends 2018, 1, 1–11. [Google Scholar]
- Allen, M.R.; Frame, D.J.; Huntingford, C.; Jones, C.D.; Lowe, J.A.; Meinshausen, M.; Meinshausen, N. Warming caused by cumulative carbon emissions towards the trillionth tonne. Nature 2009, 458, 1163–1166. [Google Scholar] [CrossRef] [PubMed]
- West, T.O.; Marland, G. A synthesis of carbon sequestration, carbon emissions, and net carbon flux in agriculture: Comparing tillage practices in the United States. Agric. Ecosyst. Environ. 2002, 91, 217–232. [Google Scholar] [CrossRef]
- Dietz, T.; Gardner, G.T.; Gilligan, J.; Stern, P.C.; Vandenbergh, M.P. Household actions can provide a behavioral wedge to rapidly reduce US carbon emissions. Proc. Natl. Acad. Sci. USA 2009, 106, 18452–18456. [Google Scholar] [CrossRef] [PubMed]
- Zhang, X.-P.; Cheng, X.-M. Energy consumption, carbon emissions, and economic growth in China. Ecol. Econ. 2009, 68, 2706–2712. [Google Scholar] [CrossRef]
- Soytas, U.; Sari, R.; Ewing, B.T. Energy consumption, income, and carbon emissions in the United States. Ecol. Econ. 2007, 62, 482–489. [Google Scholar] [CrossRef]
- Chen, C. Expert review. Science mapping: A systematic review of the literature. J. Data Inf. Sci. 2017, 2, 1–40. [Google Scholar]
- Park, J.; Cai, H. WBS-based dynamic multi-dimensional BIM database for total construction as-built documentation. Automation Constr. 2017, 77, 15–23. [Google Scholar] [CrossRef]
- Yalcinkaya, M.; Singh, V.V. Patterns and trends in building information modelling (BIM) research: A latent semantic analysis. Automation Constr. 2015, 59, 68–80. [Google Scholar] [CrossRef]
- Wong, J.K.W.; Zhou, J. Enhancing environmental sustainability over building life cycles through green BIM: A review. Automation Constr. 2015, 57, 156–165. [Google Scholar] [CrossRef]
- Olawumi, T.O.; Chan, D.W.M.; Wong, J.K.W. Evolution in the Intellectual Structure of BIM Research: A Bibliometric Analysis. J. Civ. Eng. Manag. 2017, 23, 1060–1081. [Google Scholar] [CrossRef]
- Albort-Morant, G.; Henseler, J.; Leal-Millán, A.; Cepeda-Carrión, G. Mapping the Field: A Bibliometric Analysis of Green Innovation. Sustainability 2017, 9, 1011. [Google Scholar] [CrossRef]
- Santos, R.; Costa, A.A.; Grilo, A. Bibliometric analysis and review of Building Information Modelling literature published between 2005 and 2015. Autom. Constr. 2017, 80, 118–136. [Google Scholar] [CrossRef]
- Montoya, F.G.; Montoya, M.G.; Gómez, J.; Manzano-Agugliaro, F.; Alameda-Hernández, E. The research on energy in Spain: A scientometric approach. Renew. Sustain. Energy Rev. 2014, 29, 173–183. [Google Scholar] [CrossRef]
- Cobo, M.J.; López-Herrera, A.G.; Herrera-Viedma, E.; Herrera, F. Science mapping software tools: Review, analysis, and cooperative study among tools. J. Am. Soc. Inf. Sci. Technol. 2011, 62, 1382–1402. [Google Scholar] [CrossRef]
- Chen, C.; Morris, S. Visualizing evolving networks: Minimum spanning trees versus pathfinder networks. In Proceedings of the IEEE Symposium on Information Visualization 2003 (IEEE Cat. No. 03TH8714), Seattle, WA, USA, 19–21 October 2003; pp. 67–74. [Google Scholar]
- Olawumi, T.O.; Chan, D.W. A scientometric review of global research on sustainability and sustainable development. J. Clean. Prod. 2018, 183, 231–250. [Google Scholar] [CrossRef]
- Marsilio, M.; Cappellaro, G.; Cuccurullo, C. The intellectual structure of research into PPPS: A bibliometric analysis. Public Manag. Rev. 2011, 13, 763–782. [Google Scholar] [CrossRef]
- Sidorova, A.; Evangelopoulos, N.; Ramakrishnan, J.S.V. Uncovering the Intellectual Core of the Information Systems Discipline. MIS Q. 2008, 32, 467. [Google Scholar] [CrossRef]
- Zhao, X. A scientometric review of global BIM research: Analysis and visualization. Autom. Constr. 2017, 80, 37–47. [Google Scholar] [CrossRef]
- Li, Z. A Comparison between CileSpace and VOSviewer in Information Visualization. J. Inf. Resour. Manag. 2011, 1, 95–98. [Google Scholar]
- Jin, R.; Yuan, H.; Chen, Q. Science mapping approach to assisting the review of construction and demolition waste management research published between 2009 and 2018. Resour. Conserv. Recycl. 2019, 140, 175–188. [Google Scholar] [CrossRef]
- Menegaki, M.; Damigos, D. A review on current situation and challenges of construction and demolition waste management. Curr. Opin. Green Sustain. Chem. 2018, 13, 8–15. [Google Scholar] [CrossRef]
- De Castro e Silva Neto, D.; Cruz, C.O.; Rodrigues, M.F.; Silva, P. Bibliometric Analysis of PPP and PFI Literature: Overview of 25 Years of Research. J. Constr. Eng. Manag. 2016, 142, 6016002. [Google Scholar] [CrossRef]
- Brinkø, R.; Nielsen, S.B.; Van Meel, J. Access over ownership–a typology of shared space. Facilities 2015, 33, 736–751. [Google Scholar] [CrossRef]
- Chen, Z.; Xu, J.; Chen, Y.; Lui, E.M. Recycling and reuse of construction and demolition waste in concrete-filled steel tubes: A review. Constr. Build. Mater. 2016, 126, 641–660. [Google Scholar] [CrossRef]
- Butler, L.; Visser, M.S. Extending citation analysis to non-source items. Scientometrics 2006, 66, 327–343. [Google Scholar] [CrossRef]
- De Magalhães, R.F.; Danilevicz Ângela, D.M.F.; Saurin, T.A. Reducing construction waste: A study of urban infrastructure projects. Waste Manag. 2017, 67, 265–277. [Google Scholar] [CrossRef] [PubMed]
- Ramos-Rodríguez, A.R.; Ruíz-Navarro, J. Changes in the intellectual structure of strategic management research: A bibliometric study of the Strategic Management Journal, 1980–2000. Strategic Manag. J. 2004, 25, 981–1004. [Google Scholar]
- Liang, C.; Luo, A.; Zhong, Z. Knowledge mapping of medication literacy study: A visualized analysis using CiteSpace. SAGE Open Med. 2018, 6, 2050312118800199. [Google Scholar] [CrossRef]
- Jin, Y.; Ji, S.; Li, X.; Yu, J. A scientometric review of hotspots and emerging trends in additive manufacturing. J. Manuf. Technol. Manag. 2017, 28, 18–38. [Google Scholar] [CrossRef]
- Li, N.; Han, R.; Lu, X. Bibliometric analysis of research trends on solid waste reuse and recycling during 1992–2016. Resour. Conserv. Recycl. 2018, 130, 109–117. [Google Scholar] [CrossRef]
- Xu, Y.; Zeng, J.; Chen, W.; Jin, R.; Li, B.; Pan, Z. A holistic review of cement composites reinforced with graphene oxide. Constr. Build. Mater. 2018, 171, 291–302. [Google Scholar] [CrossRef]
- Liu, H.; Zhu, Y.; Guo, Y.; Li, S.; Yang, J. Visualization Analysis of Subject, Region, Author, and Citation on Crop Growth Model by CiteSpace II Software. In Knowledge Engineering and Management; Springer: Berlin/Heidelberg, Germany, 2014; Volume 278, pp. 243–252. [Google Scholar]
- Meng, Y.; Ling, T.-C.; Mo, K.H. Recycling of wastes for value-added applications in concrete blocks: An overview. Resour. Conserv. Recycl. 2018, 138, 298–312. [Google Scholar] [CrossRef]
- Song, J.; Zhang, H.; Dong, W. A review of emerging trends in global PPP research: Analysis and visualization. Scientometrics 2016, 107, 1111–1147. [Google Scholar] [CrossRef]
- Chadegani, A.A.; Salehi, H.; Yunus, M.M.; Farhadi, H.; Fooladi, M.; Farhadi, M.; Ebrahim, N.A. A Comparison between Two Main Academic Literature Collections: Web of Science and Scopus Databases. Asian Soc. Sci. 2013, 9, 18–26. [Google Scholar] [CrossRef]
- Deisman, W. CCTV: Literature review and bibliography. In Research and Evaluation Branch, Community, Contract and Aboriginal Policing Services Directorate; Citeseer; Royal Canadian Mounted: Ottawa, OA, Canada, 2003. [Google Scholar]
- Serenko, A.; Bontis, N.; Booker, L.; Sadeddin, K.; Hardie, T. A scientometric analysis of knowledge management and intellectual capital academic literature (1994–2008). J. Knowl. Manag. 2010, 14, 3–23. [Google Scholar] [CrossRef]
- Chen, C. The Citespace Manual. In College of Computing and Informatics; Drexel University: Philadelphia, PA, USA, 2014. [Google Scholar]
- Chen, C. CiteSpace II: Detecting and visualizing emerging trends and transient patterns in scientific literature. J. Am. Soc. Inf. Sci. Technol. 2006, 57, 359–377. [Google Scholar] [CrossRef]
- Chen, C. CiteSpace Quick Guide 1.2; Drexel University: Philadelphia, PA, USA, 2005. [Google Scholar]
- Li, J. Decoupling urban transport from GHG emissions in Indian cities—A critical review and perspectives. Energy Policy 2011, 39, 3503–3514. [Google Scholar] [CrossRef]
- Chiang, Y.H.; Li, J.; Zhou, L.; Wong, F.K.; Lam, P.T. The nexus among employment opportunities, life-cycle costs, and carbon emissions: A case study of sustainable building maintenance in Hong Kong. J. Clean. Prod. 2015, 109, 326–335. [Google Scholar] [CrossRef]
- Li, J.; Zhang, D.; Su, B. The Impact of Social Awareness and Lifestyles on Household Carbon Emissions in China. Ecol. Econ. 2019, 160, 145–155. [Google Scholar] [CrossRef]
- Li, X.; Feng, D.; Li, J.; Zhang, Z. Research on the Spatial Network Characteristics and Synergetic Abatement Effect of the Carbon Emissions in Beijing–Tianjin–Hebei Urban Agglomeration. Sustainability 2019, 11, 1444. [Google Scholar] [CrossRef]
- Ahmad, A.; Zhao, Y.; Shahbaz, M.; Bano, S.; Zhang, Z.; Wang, S.; Liu, Y. Carbon emissions, energy consumption and economic growth: An aggregate and disaggregate analysis of the Indian economy. Energy Policy 2016, 96, 131–143. [Google Scholar] [CrossRef]
- Liu, Y.; Xiao, H.; Zikhali, P.; Lv, Y. Carbon Emissions in China: A Spatial Econometric Analysis at the Regional Level. Sustainability 2014, 6, 6005–6023. [Google Scholar] [CrossRef]
- Zhao, Y.; Wang, S.; Zhang, Z.; Liu, Y.; Ahmad, A. Driving factors of carbon emissions embodied in China–US trade: A structural decomposition analysis. J. Clean. Prod. 2016, 131, 678–689. [Google Scholar] [CrossRef]
- Hashimoto, S.; Fujita, T.; Geng, Y.; Nagasawa, E. Realizing CO2 emission reduction through industrial symbiosis: A cement production case study for Kawasaki. Resour. Conserv. Recycl. 2010, 54, 704–710. [Google Scholar] [CrossRef]
- Liu, Z.; Geng, Y.; Xue, B.; Xi, F.; Jiao, J. A calculation method of CO2 emission from urban energy consumption. Resour. Sci. 2011, 33, 1325–1330. [Google Scholar]
- Bing, X.; Chunrong, L.; Zhu, L.; Yong, G.; Fengming, X. Analysis on CO2 Emission and Urbanization at Global Level During 1970–2007. Adv. Clim. Chang. Res. 2011, 6, 10. [Google Scholar]
- Liu, Z.; Geng, Y.; Xue, B. Inventorying Energy-related CO2 for City: Shanghai Study. Energy Procedia 2011, 5, 2303–2307. [Google Scholar] [CrossRef]
- Zhu, Q.; Geng, Y. Drivers and barriers of extended supply chain practices for energy saving and emission reduction among Chinese manufacturers. J. Clean. Prod. 2013, 40, 6–12. [Google Scholar] [CrossRef]
- Wang, K.; Zou, L.-L.; Guo, J.; Yi, W.-J.; Feng, Z.-H.; Wei, Y.-M. Carbon emission patterns in different income countries. Int. J. Energy Environ. 2011, 2, 447–462. [Google Scholar]
- Wei, Y.-M.; Liu, L.-C.; Fan, Y.; Wu, G. The impact of lifestyle on energy use and CO2 emission: An empirical analysis of China’s residents. Energy Policy 2007, 35, 247–257. [Google Scholar] [CrossRef]
- Eggleston, S.; Buendia, L.; Miwa, K. 2006 IPCC Guidelines for National Greenhouse Gas Inventories [Recurso Electrónico]: Waste; Institute for Global Environmental Strategies: Kanagawa, Japan, 2006. [Google Scholar]
- Weidema, B.P.; Thrane, M.; Christensen, P.; Schmidt, J.; Løkke, S. Carbon footprint: A catalyst for life cycle assessment? J. Ind. Ecol. 2008, 12, 3–6. [Google Scholar] [CrossRef]
- Ang, B.W. Decomposition analysis for policymaking in energy: Which is the preferred method? Energy Policy 2004, 32, 1131–1139. [Google Scholar] [CrossRef]
- Lal, R. Carbon emission from farm operations. Environ. Int. 2004, 30, 981–990. [Google Scholar] [CrossRef] [PubMed]


| Category | Record Count | Percentage |
|---|---|---|
| Environmental Sciences | 1374 | 46.66% |
| Green Sustainable Science Technology | 635 | 21.56% |
| Engineering Environmental | 586 | 19.90% |
| Environmental Studies | 557 | 18.91% |
| Energy Fuels | 535 | 18.17% |
| Economics | 367 | 12.46% |
| Engineering Chemical | 143 | 5.81% |
| Meteorology Atmospheric Sciences | 157 | 5.33% |
| Ecology | 104 | 3.53% |
| Engineering Civil | 85 | 2.89% |
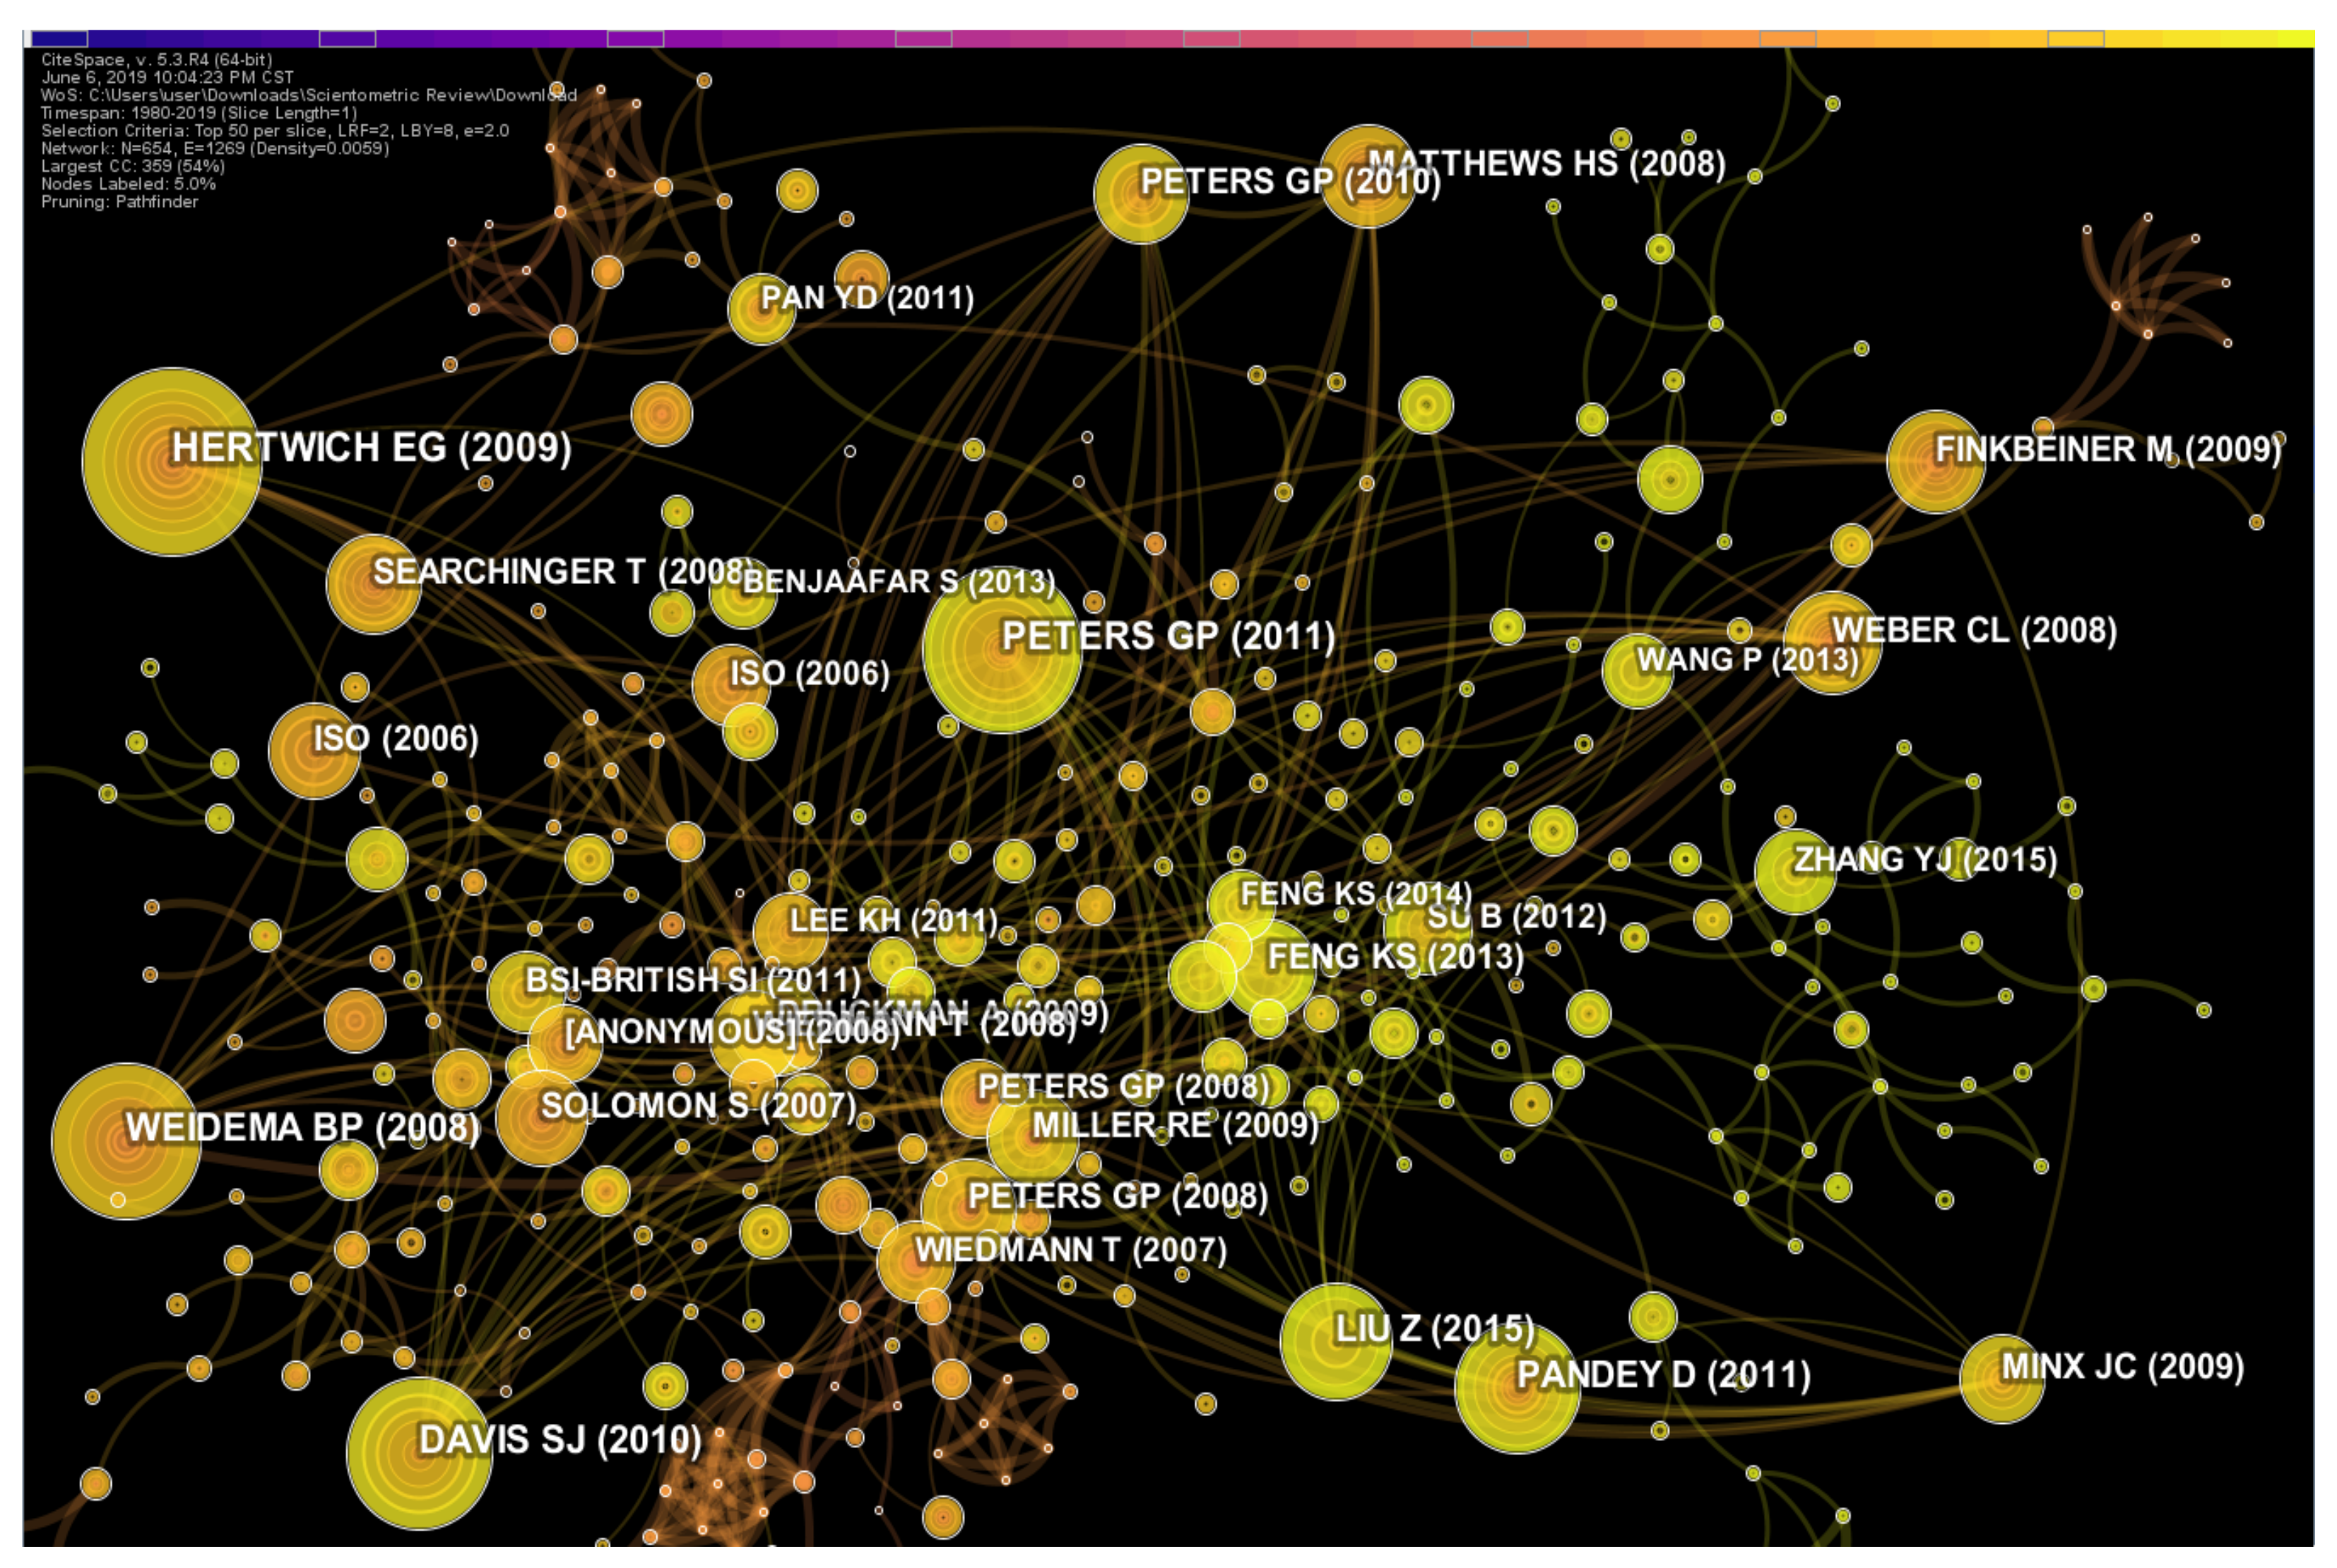
| Year | Author | Institution | Country | Counts | H-index | Rank |
|---|---|---|---|---|---|---|
| 2011 | Li J. | Zhejiang Gongshang University | China | 19 | 8 | 1 |
| 2014 | Liu Y. | Chinese Academy of Sciences | China | 17 | 60 | 8 |
| 2004 | Zhang Y. | Beijing Normal University | China | 16 | 32 | 4 |
| 2014 | Geng Y. | Shanghai Jiao Tong University | China | 15 | 52 | 9 |
| 2010 | Zhang X.L. | Nanjing Normal University | China | 15 | 6 | 6 |
| 2015 | Wang F. | China University of Mining and Technology | China | 14 | 4 | 3 |
| 2015 | Wang J. | China Building Materials Academy | China | 12 | 9 | 10 |
| 2018 | Wang Y. | Dongbei University of Finance and Economics | China | 11 | 5 | 2 |
| 2016 | Wei Y.M. | Beijing Institute of Technology | China | 11 | 50 | 5 |
| 2015 | Li L. | Tsinghua University | China | 10 | 27 | 11 |
| 2015 | Wang C. | Beijing Institute of Technology | China | 9 | 6 | 7 |
| 2015 | Wang C.J. | Guangzhou Institute of Geography | China | 9 | 11 | 12 |
| 2012 | Huang X.J. | Nanjing University | China | 8 | 1 |
| Year | Institution | Country | Centrality | Frequency | Cluster # |
|---|---|---|---|---|---|
| 2010 | Chinese Academy of Sciences | China | 0.27 | 72 | 0 |
| 2010 | Tsinghua University | China | 0.16 | 34 | 0 |
| 2010 | University of Florida | USA | 0.12 | 10 | 3 |
| 2013 | University of Leeds | UK | 0.11 | 15 | 1 |
| 2011 | Hong Kong Polytechnic University | Hong Kong | 0.09 | 13 | 8 |
| 2012 | University of East Anglia | UK | 0.06 | 4 | 1 |
| 2010 | University of Cambridge | UK | 0.06 | 10 | 1 |
| 2011 | Aarhus University | Denmark | 0.06 | 16 | 7 |
| 2009 | University of Sydney | Australia | 0.05 | 14 | 2 |
| 2002 | University of Maryland | USA | 0.05 | 19 | 1 |
| 2015 | US Forest Service | USA | 0.05 | 5 | 4 |
| 2014 | Harbin Institute of Technology | China | 0.05 | 7 | 8 |
| 2011 | Beijing Normal University | China | 0.05 | 22 | 0 |
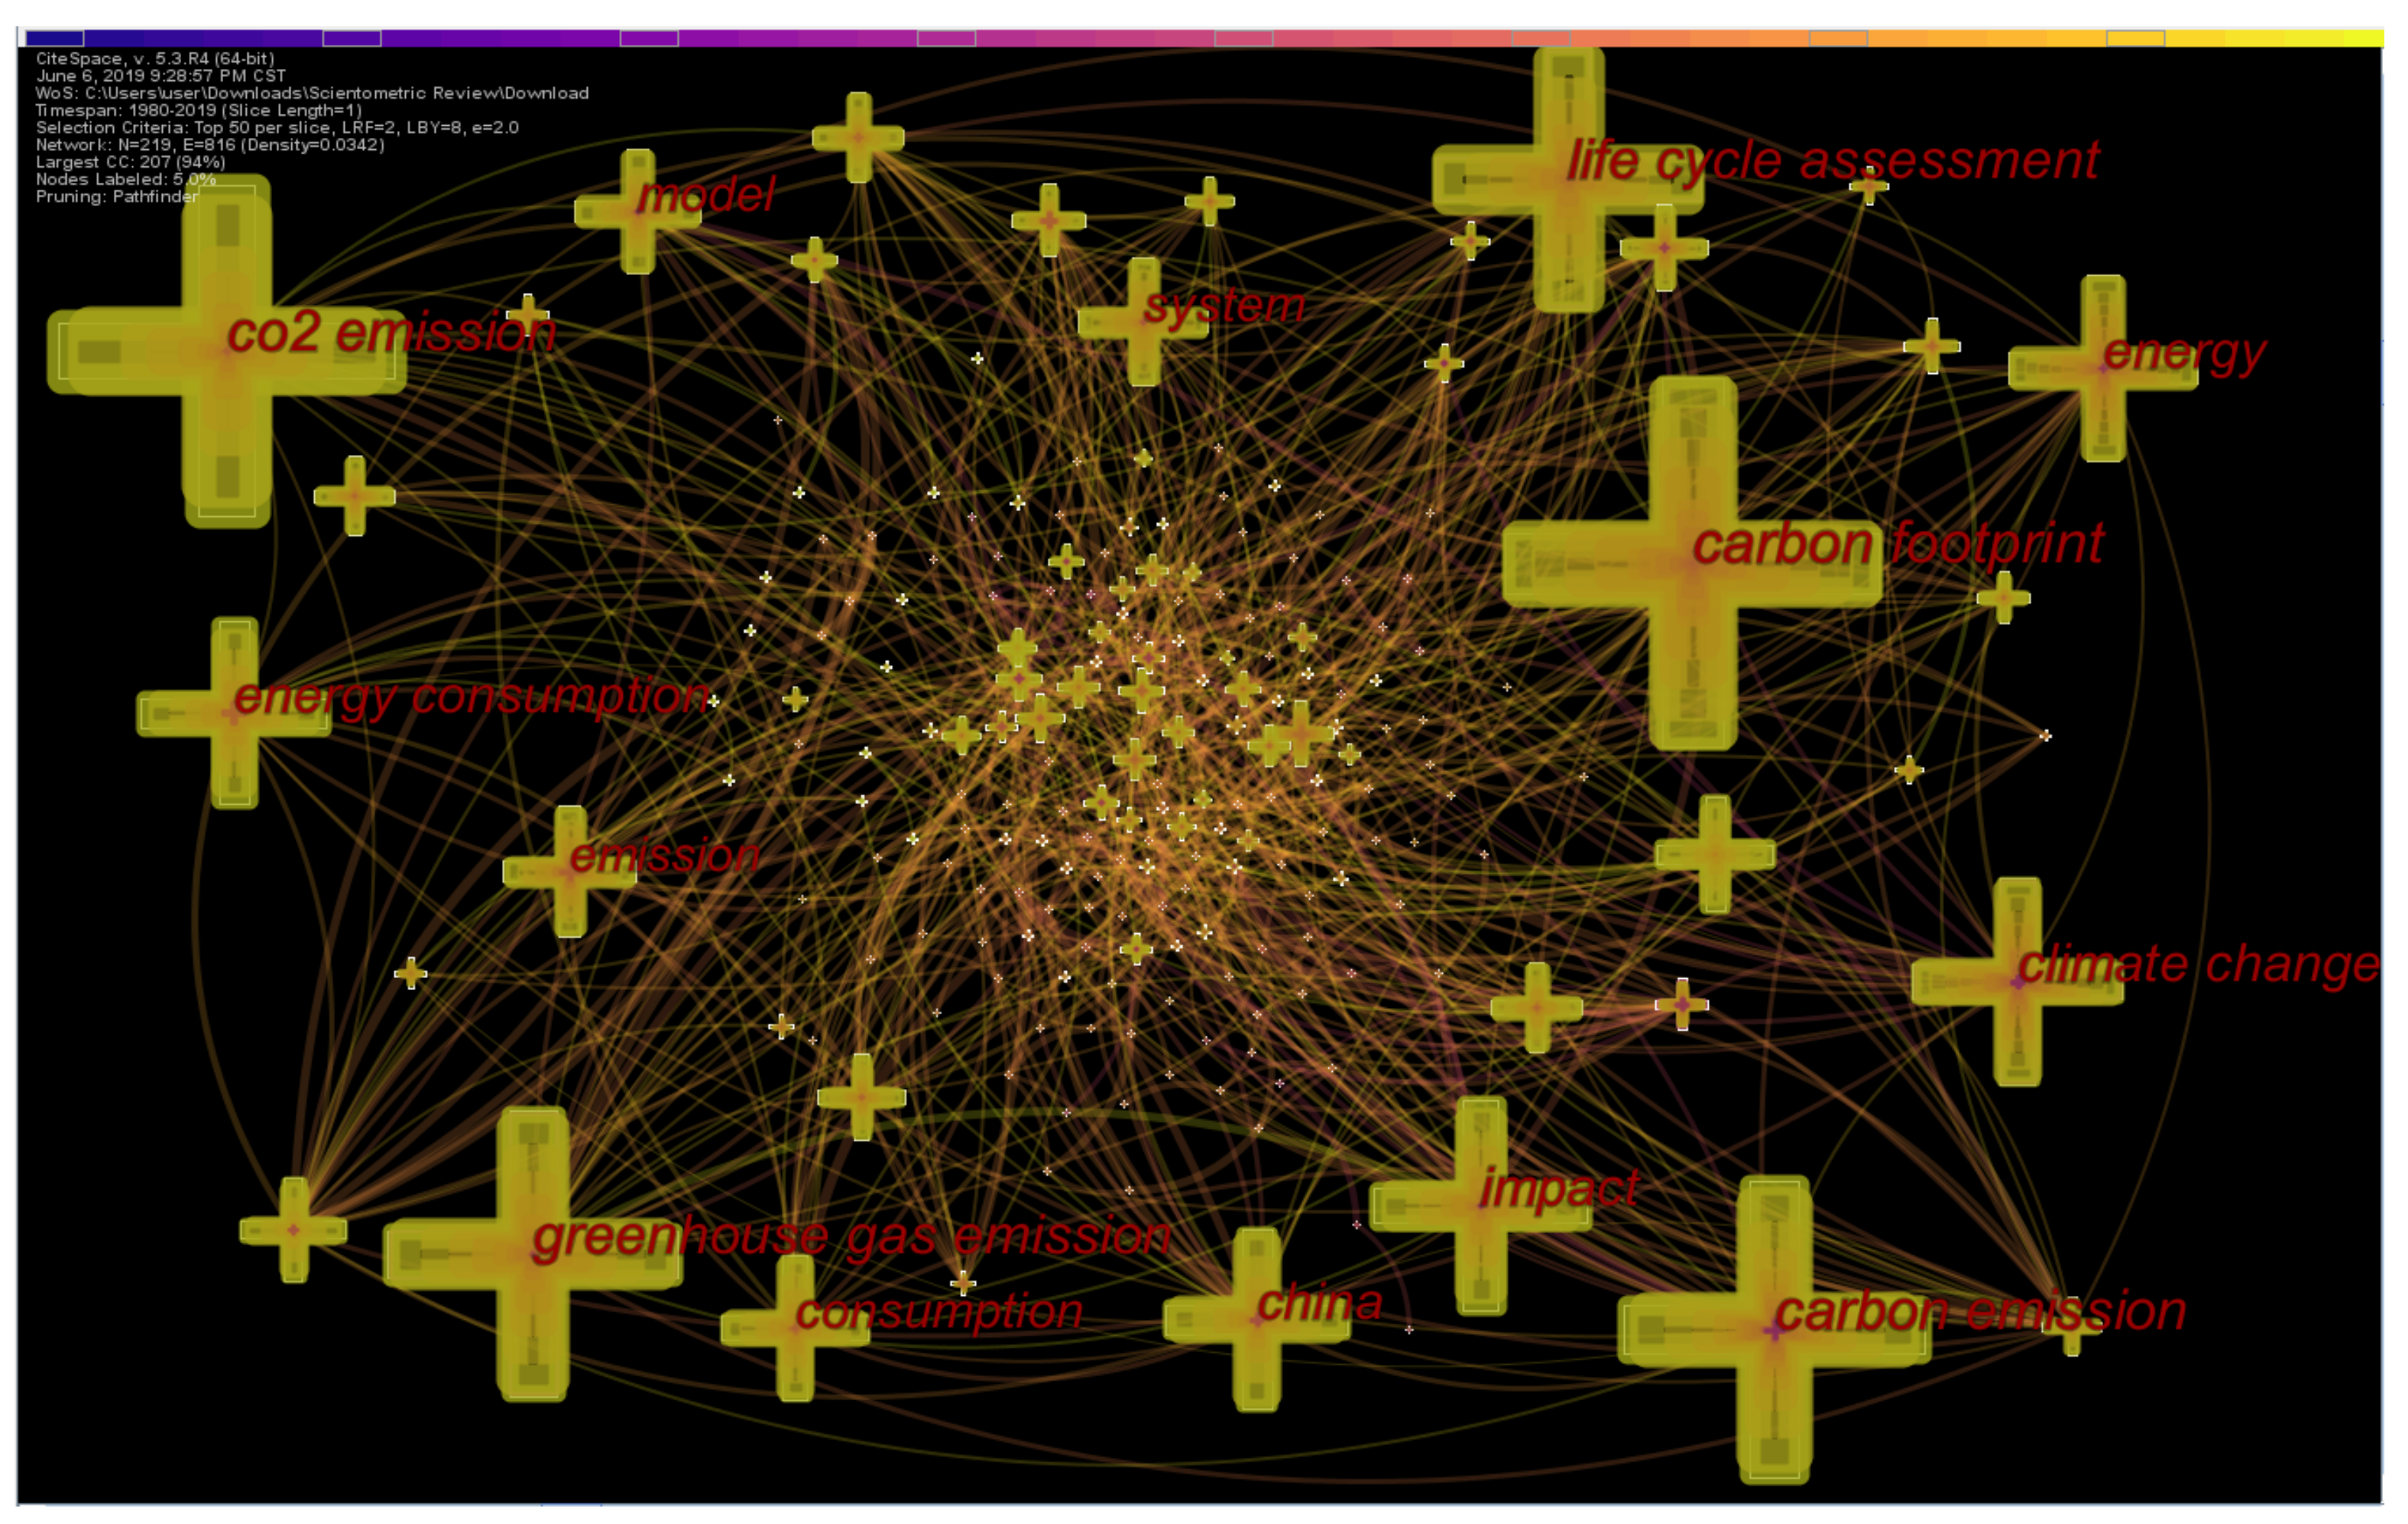
| S/N | Freq. | Keyword | S/N | Freq. | Keywords |
|---|---|---|---|---|---|
| 1 | 553 | Carbon footprint | 11 | 217 | Energy consumption |
| 2 | 503 | CO2 emission | 12 | 210 | consumption |
| 3 | 449 | Carbon emission | 13 | 202 | System |
| 4 | 445 | Greenhouse gas emission | 14 | 200 | Model |
| 5 | 404 | Life cycle assessment | 15 | 175 | Emission |
| 6 | 337 | Climate change | 16 | 173 | Economic growth |
| 7 | 316 | Life cycle assessment | 17 | 146 | Dioxide emission |
| 8 | 291 | Impact | 18 | 143 | Performance |
| 9 | 276 | Energy | 19 | 143 | GHG emission |
| 10 | 272 | China | 20 | 139 | Management |
© 2019 by the authors. Licensee MDPI, Basel, Switzerland. This article is an open access article distributed under the terms and conditions of the Creative Commons Attribution (CC BY) license (http://creativecommons.org/licenses/by/4.0/).
Share and Cite
Udara Willhelm Abeydeera, L.H.; Wadu Mesthrige, J.; Samarasinghalage, T.I. Global Research on Carbon Emissions: A Scientometric Review. Sustainability 2019, 11, 3972. https://doi.org/10.3390/su11143972
Udara Willhelm Abeydeera LH, Wadu Mesthrige J, Samarasinghalage TI. Global Research on Carbon Emissions: A Scientometric Review. Sustainability. 2019; 11(14):3972. https://doi.org/10.3390/su11143972
Chicago/Turabian StyleUdara Willhelm Abeydeera, Lebunu Hewage, Jayantha Wadu Mesthrige, and Tharushi Imalka Samarasinghalage. 2019. "Global Research on Carbon Emissions: A Scientometric Review" Sustainability 11, no. 14: 3972. https://doi.org/10.3390/su11143972
APA StyleUdara Willhelm Abeydeera, L. H., Wadu Mesthrige, J., & Samarasinghalage, T. I. (2019). Global Research on Carbon Emissions: A Scientometric Review. Sustainability, 11(14), 3972. https://doi.org/10.3390/su11143972