Integrating Spatial and Temporal Approaches for Explaining Bicycle Crashes in High-Risk Areas in Antwerp (Belgium)

 , ,
, , 
Abstract
:1. Introduction
1.1. Research Gap
1.2. Research Goals
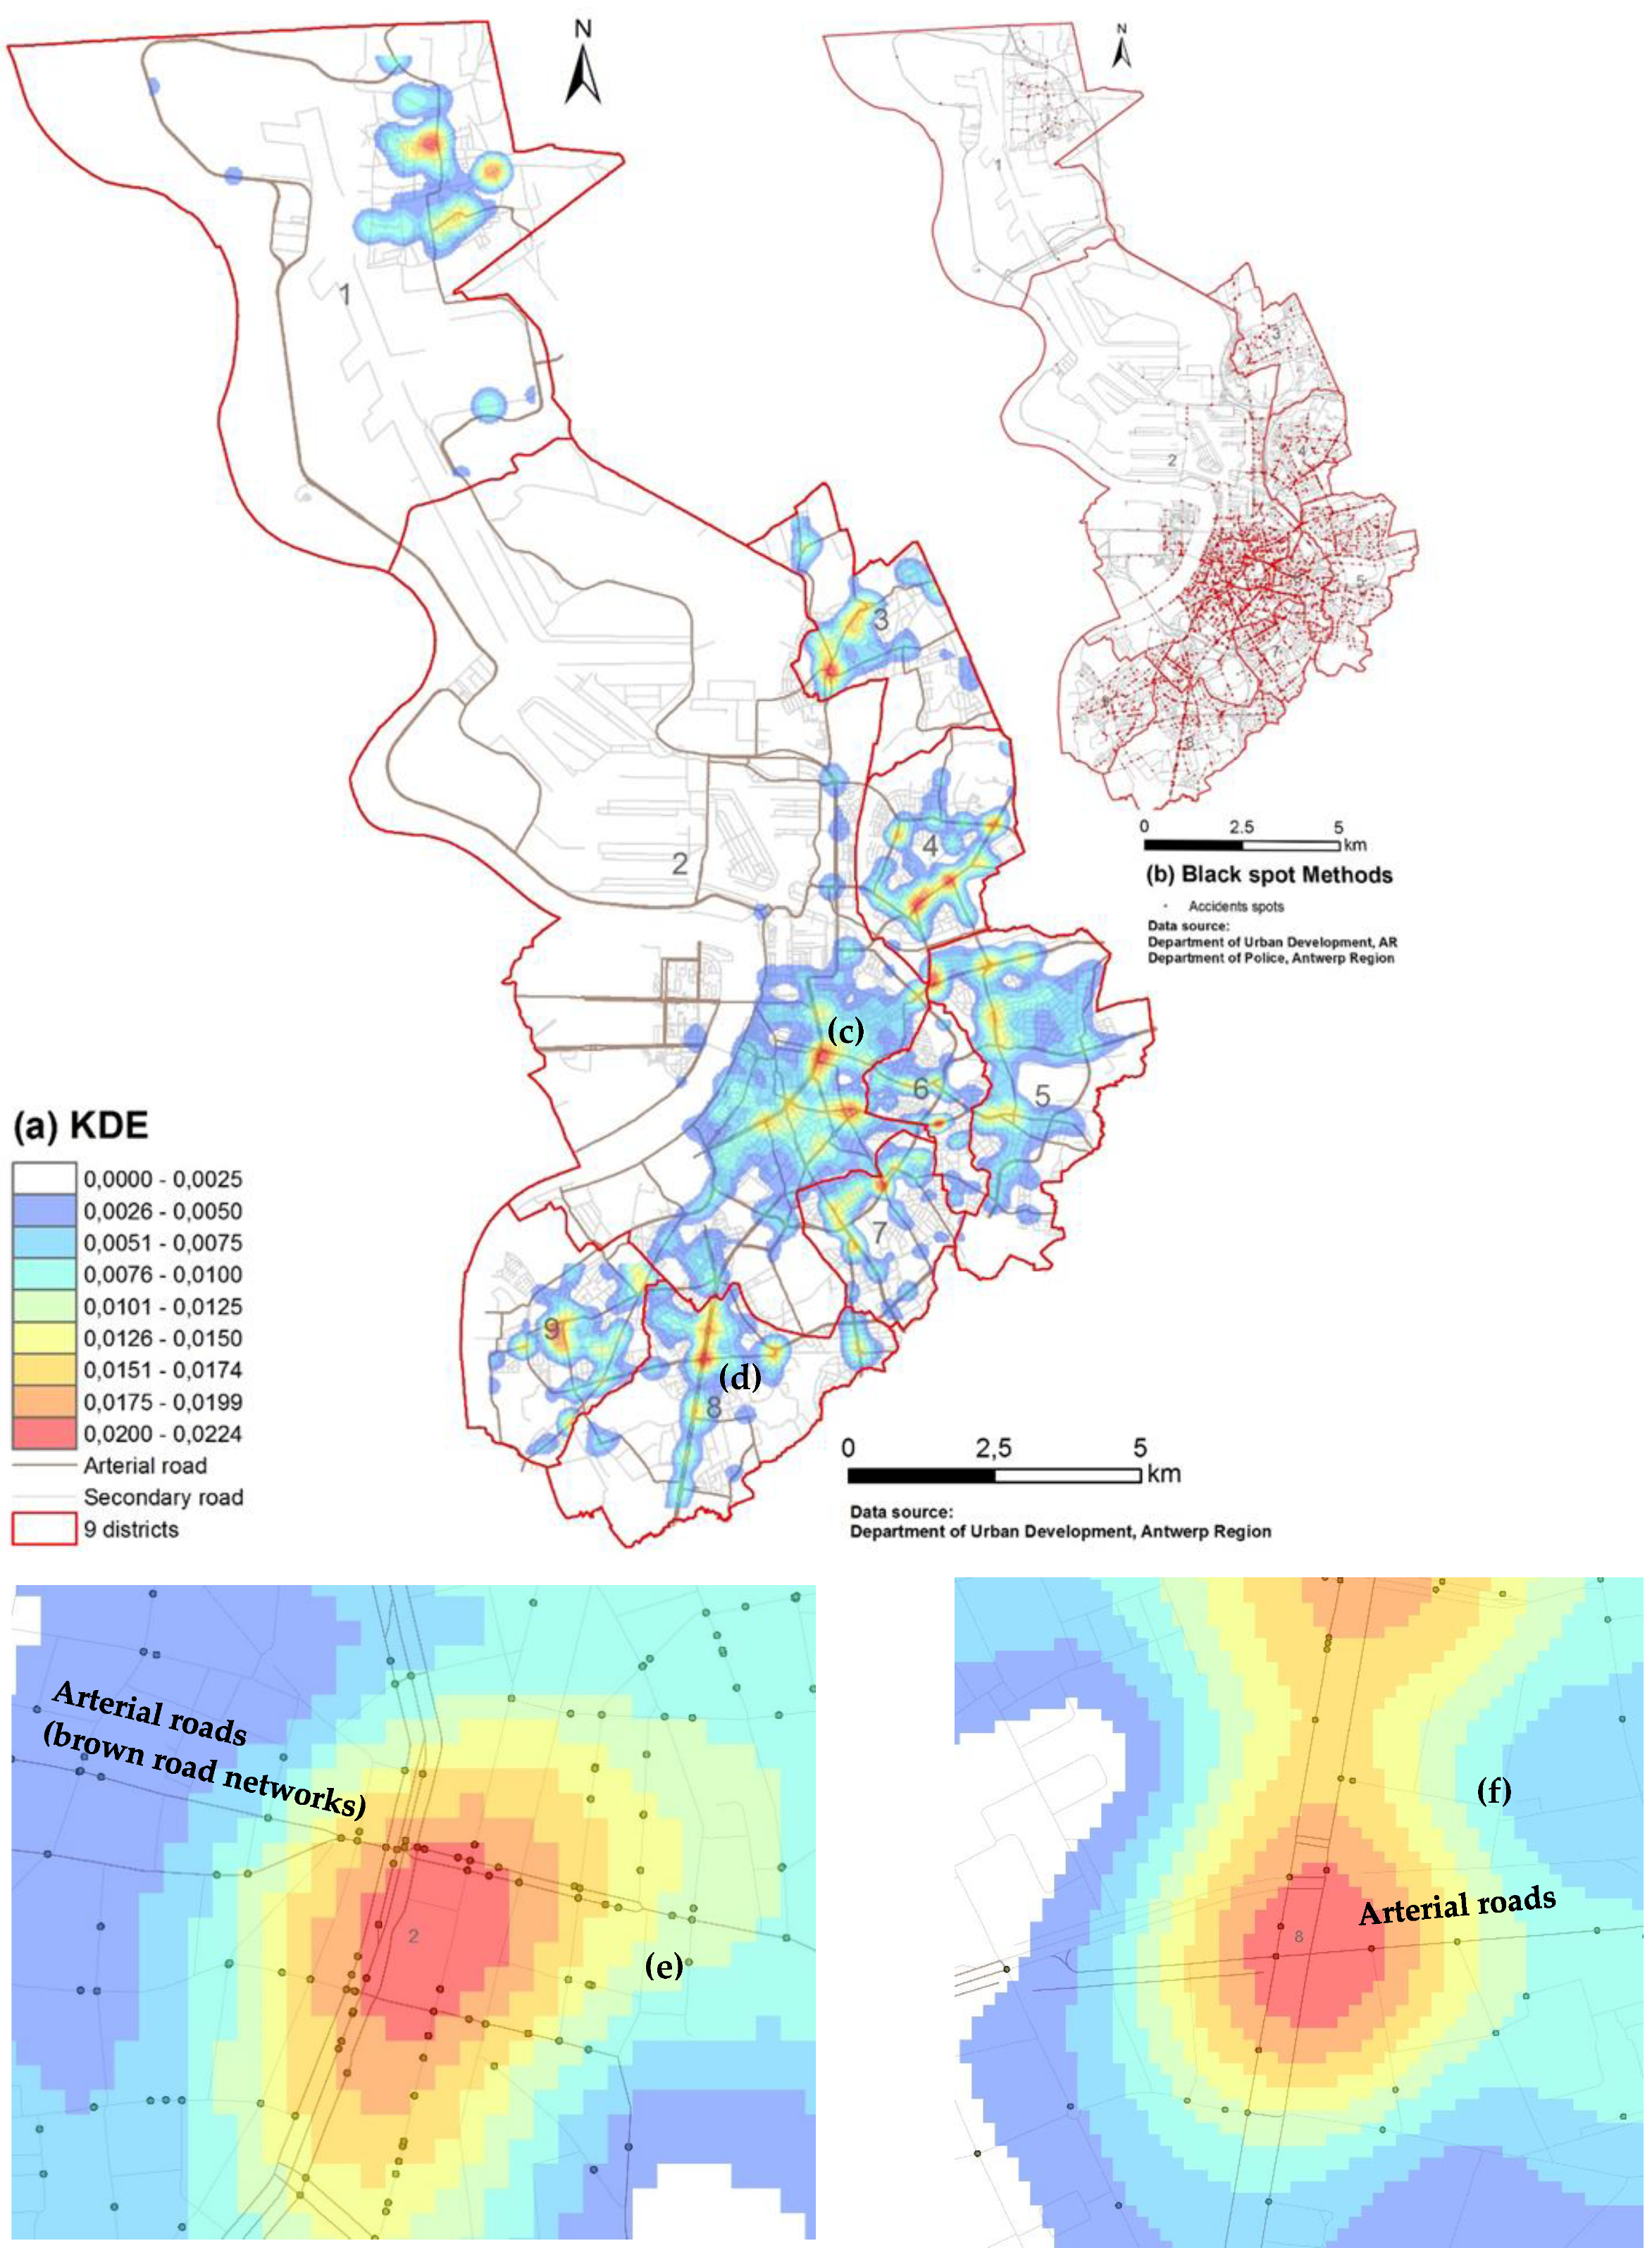
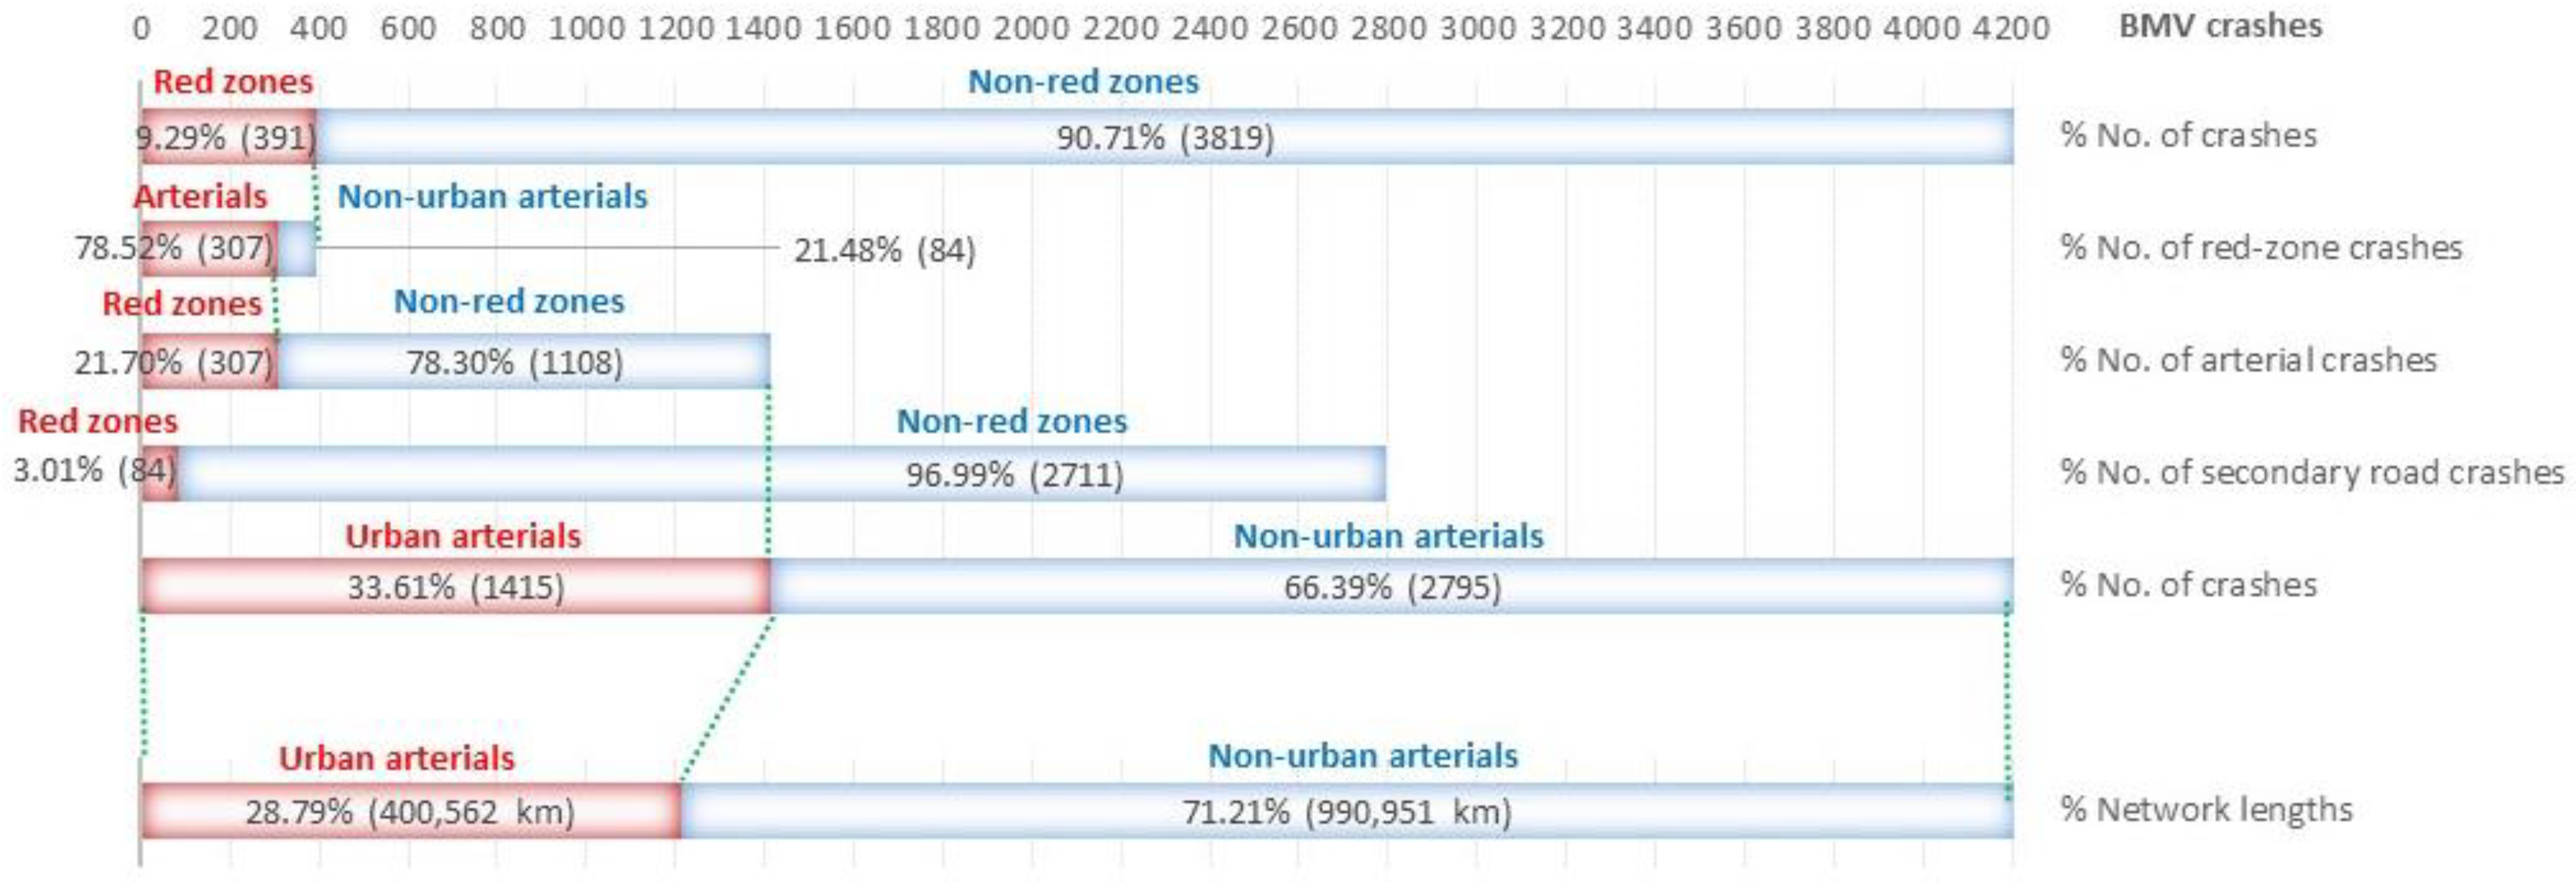
- Reveal the spatial and temporal risk patterns of bicycle crashes (where? and when?) from a regional level to a locational level (a macro scale to a micro scale). To this end, a two-stage workflow (spatial and temporal approaches) is created for exploring bicycle crashes. Through the spatial approach, urban arterials are determined to have the highest bicycle–motorized vehicle BMV crash densities (see Figure 6a and Figure 7).
- Explain how arterial infrastructure affects bicycle crashes in the city of Antwerp (CA, Belgium) by examining possible risk factors.
2. Background of Spatio-Temporal Approaches
2.1. Bicycle–Motorized Vehicle (BMV) Crash Studies
2.2. BMV Crash Patterns
2.2.1. Spatial Patterns of BMV Crashes
2.2.2. Temporal Patterns of BMV Crashes
2.3. BMV Crash Methodology
2.3.1. Methods without Exposure Counting Data
2.3.2. Methods with Exposure Counting Data
2.4. Risk Factors Associated with Cycling Environments
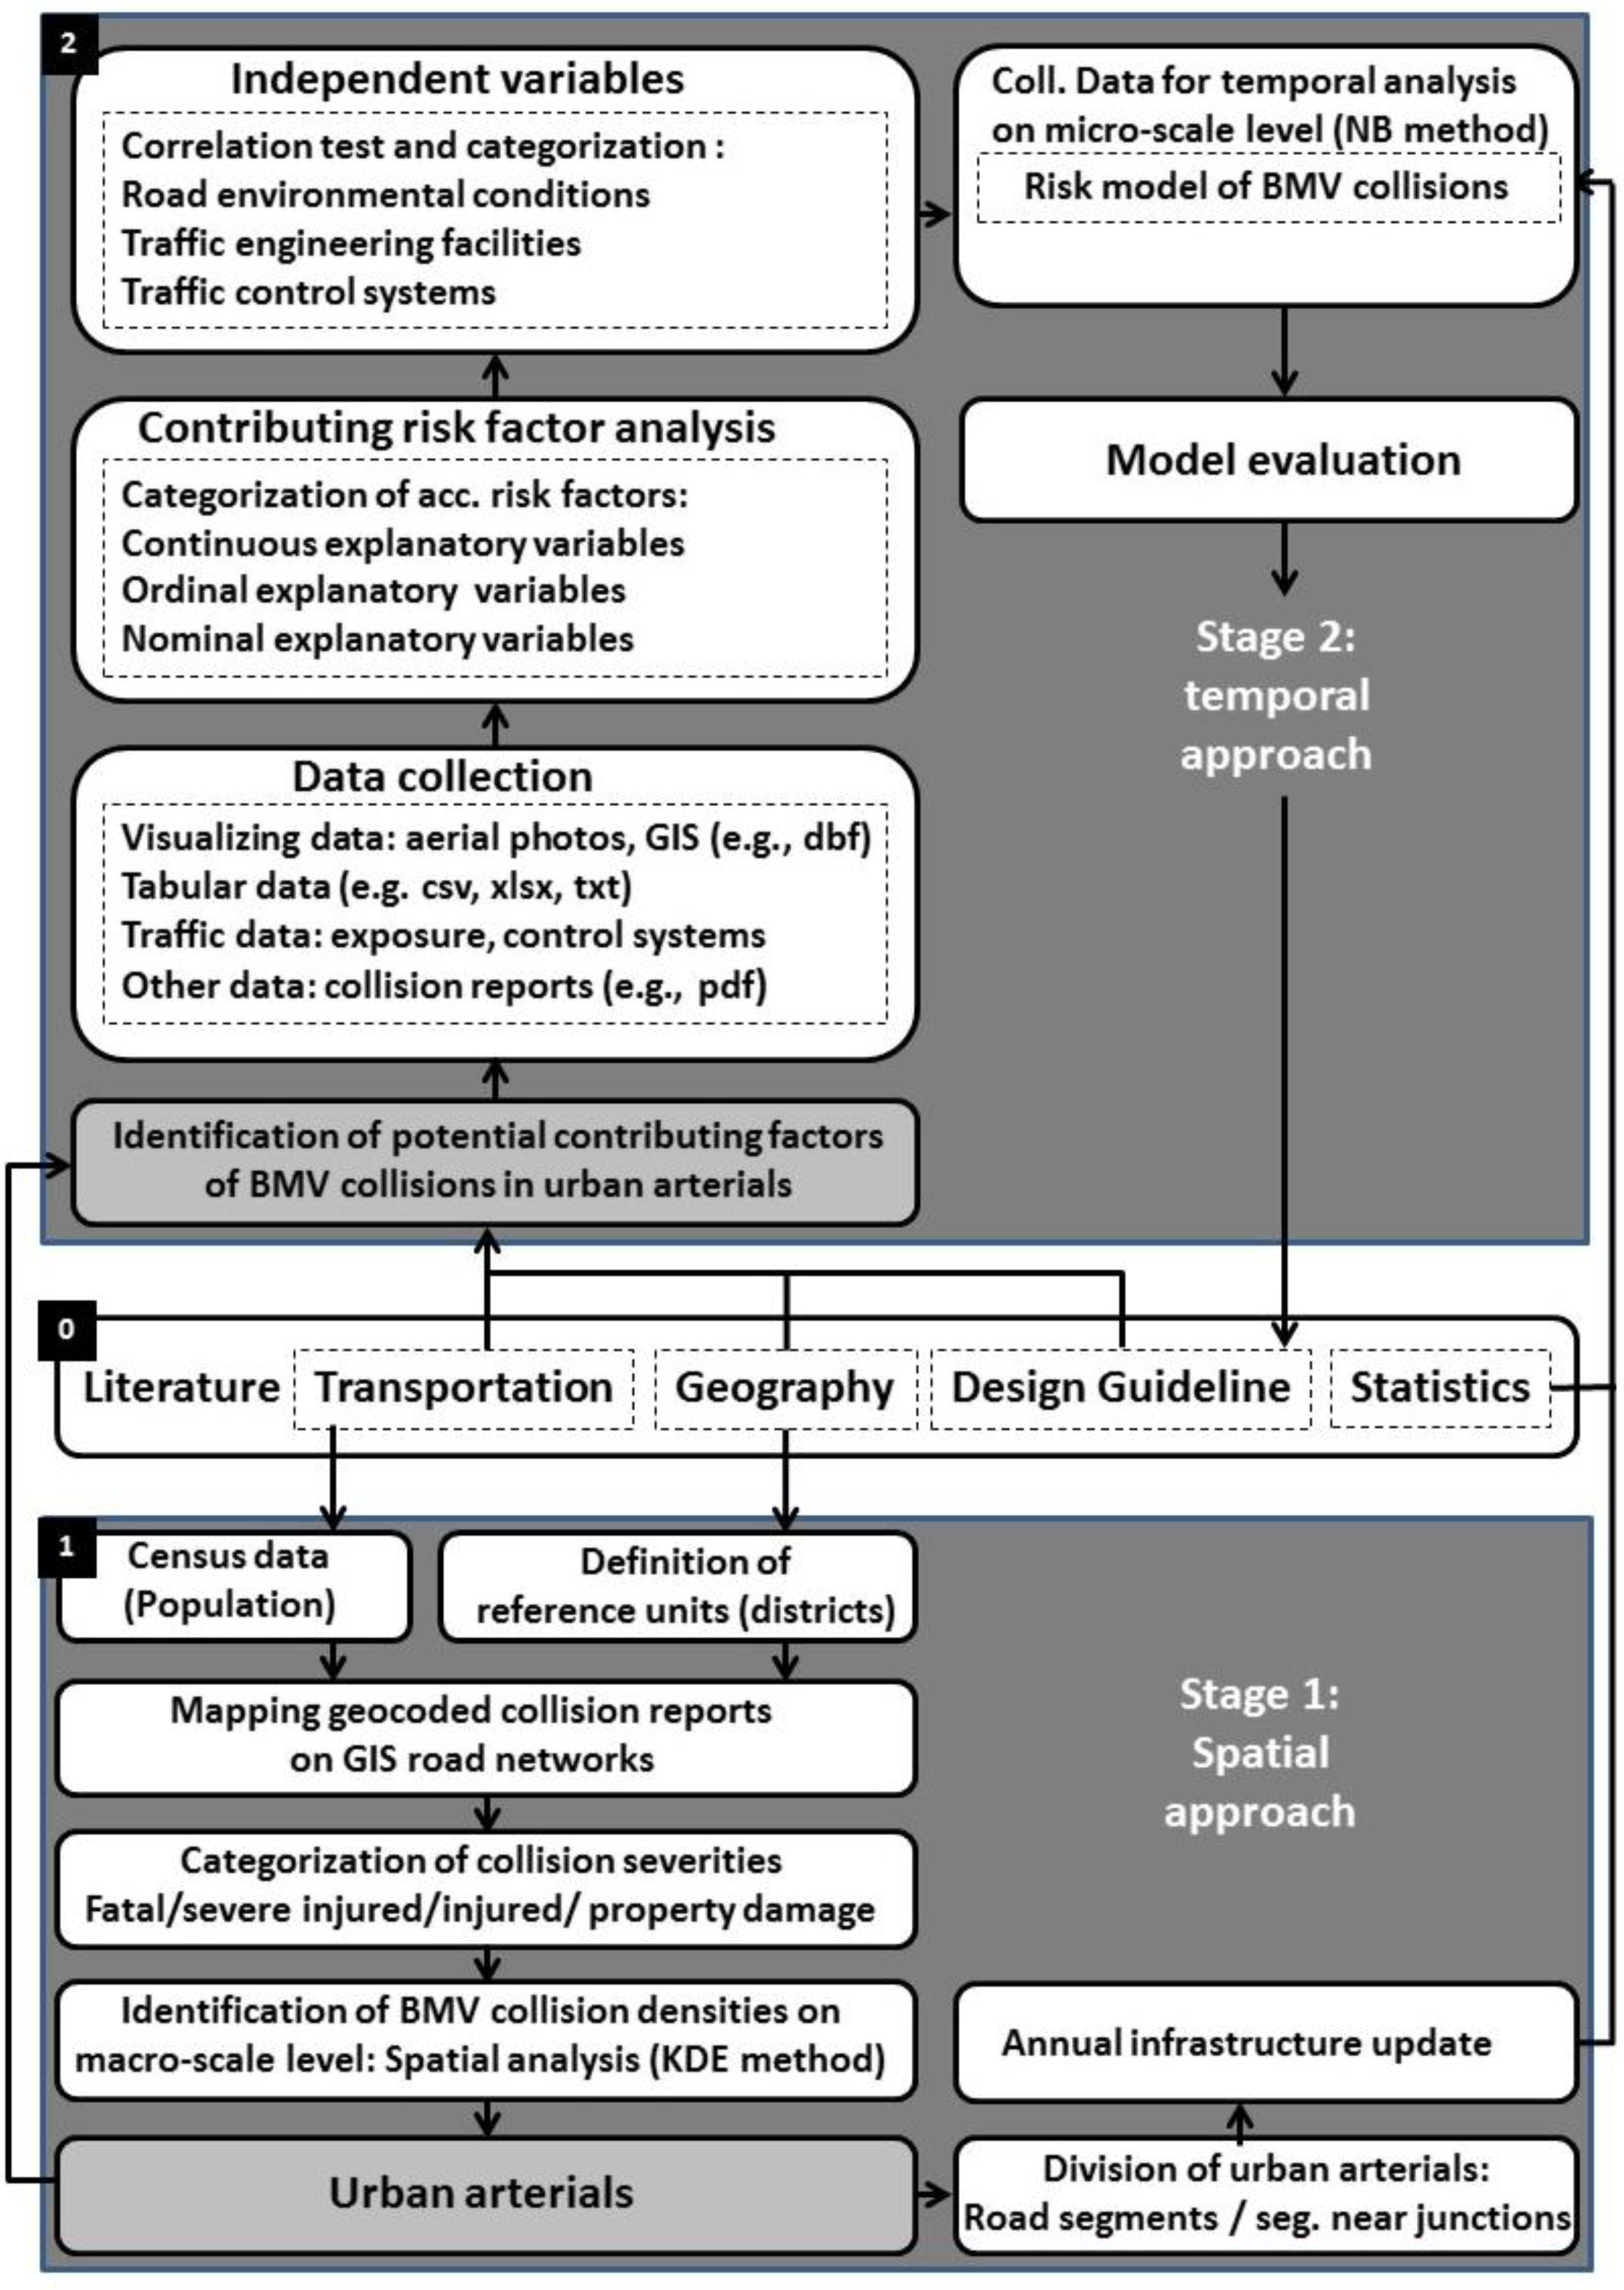
3. Methodology: Integrating Spatial and Temporal Approaches
3.1. The Selection of Spatio-Temporal Approaches
3.1.1. Stage 1: Spatial Approach
3.1.2. Stage 2: Temporal Approach
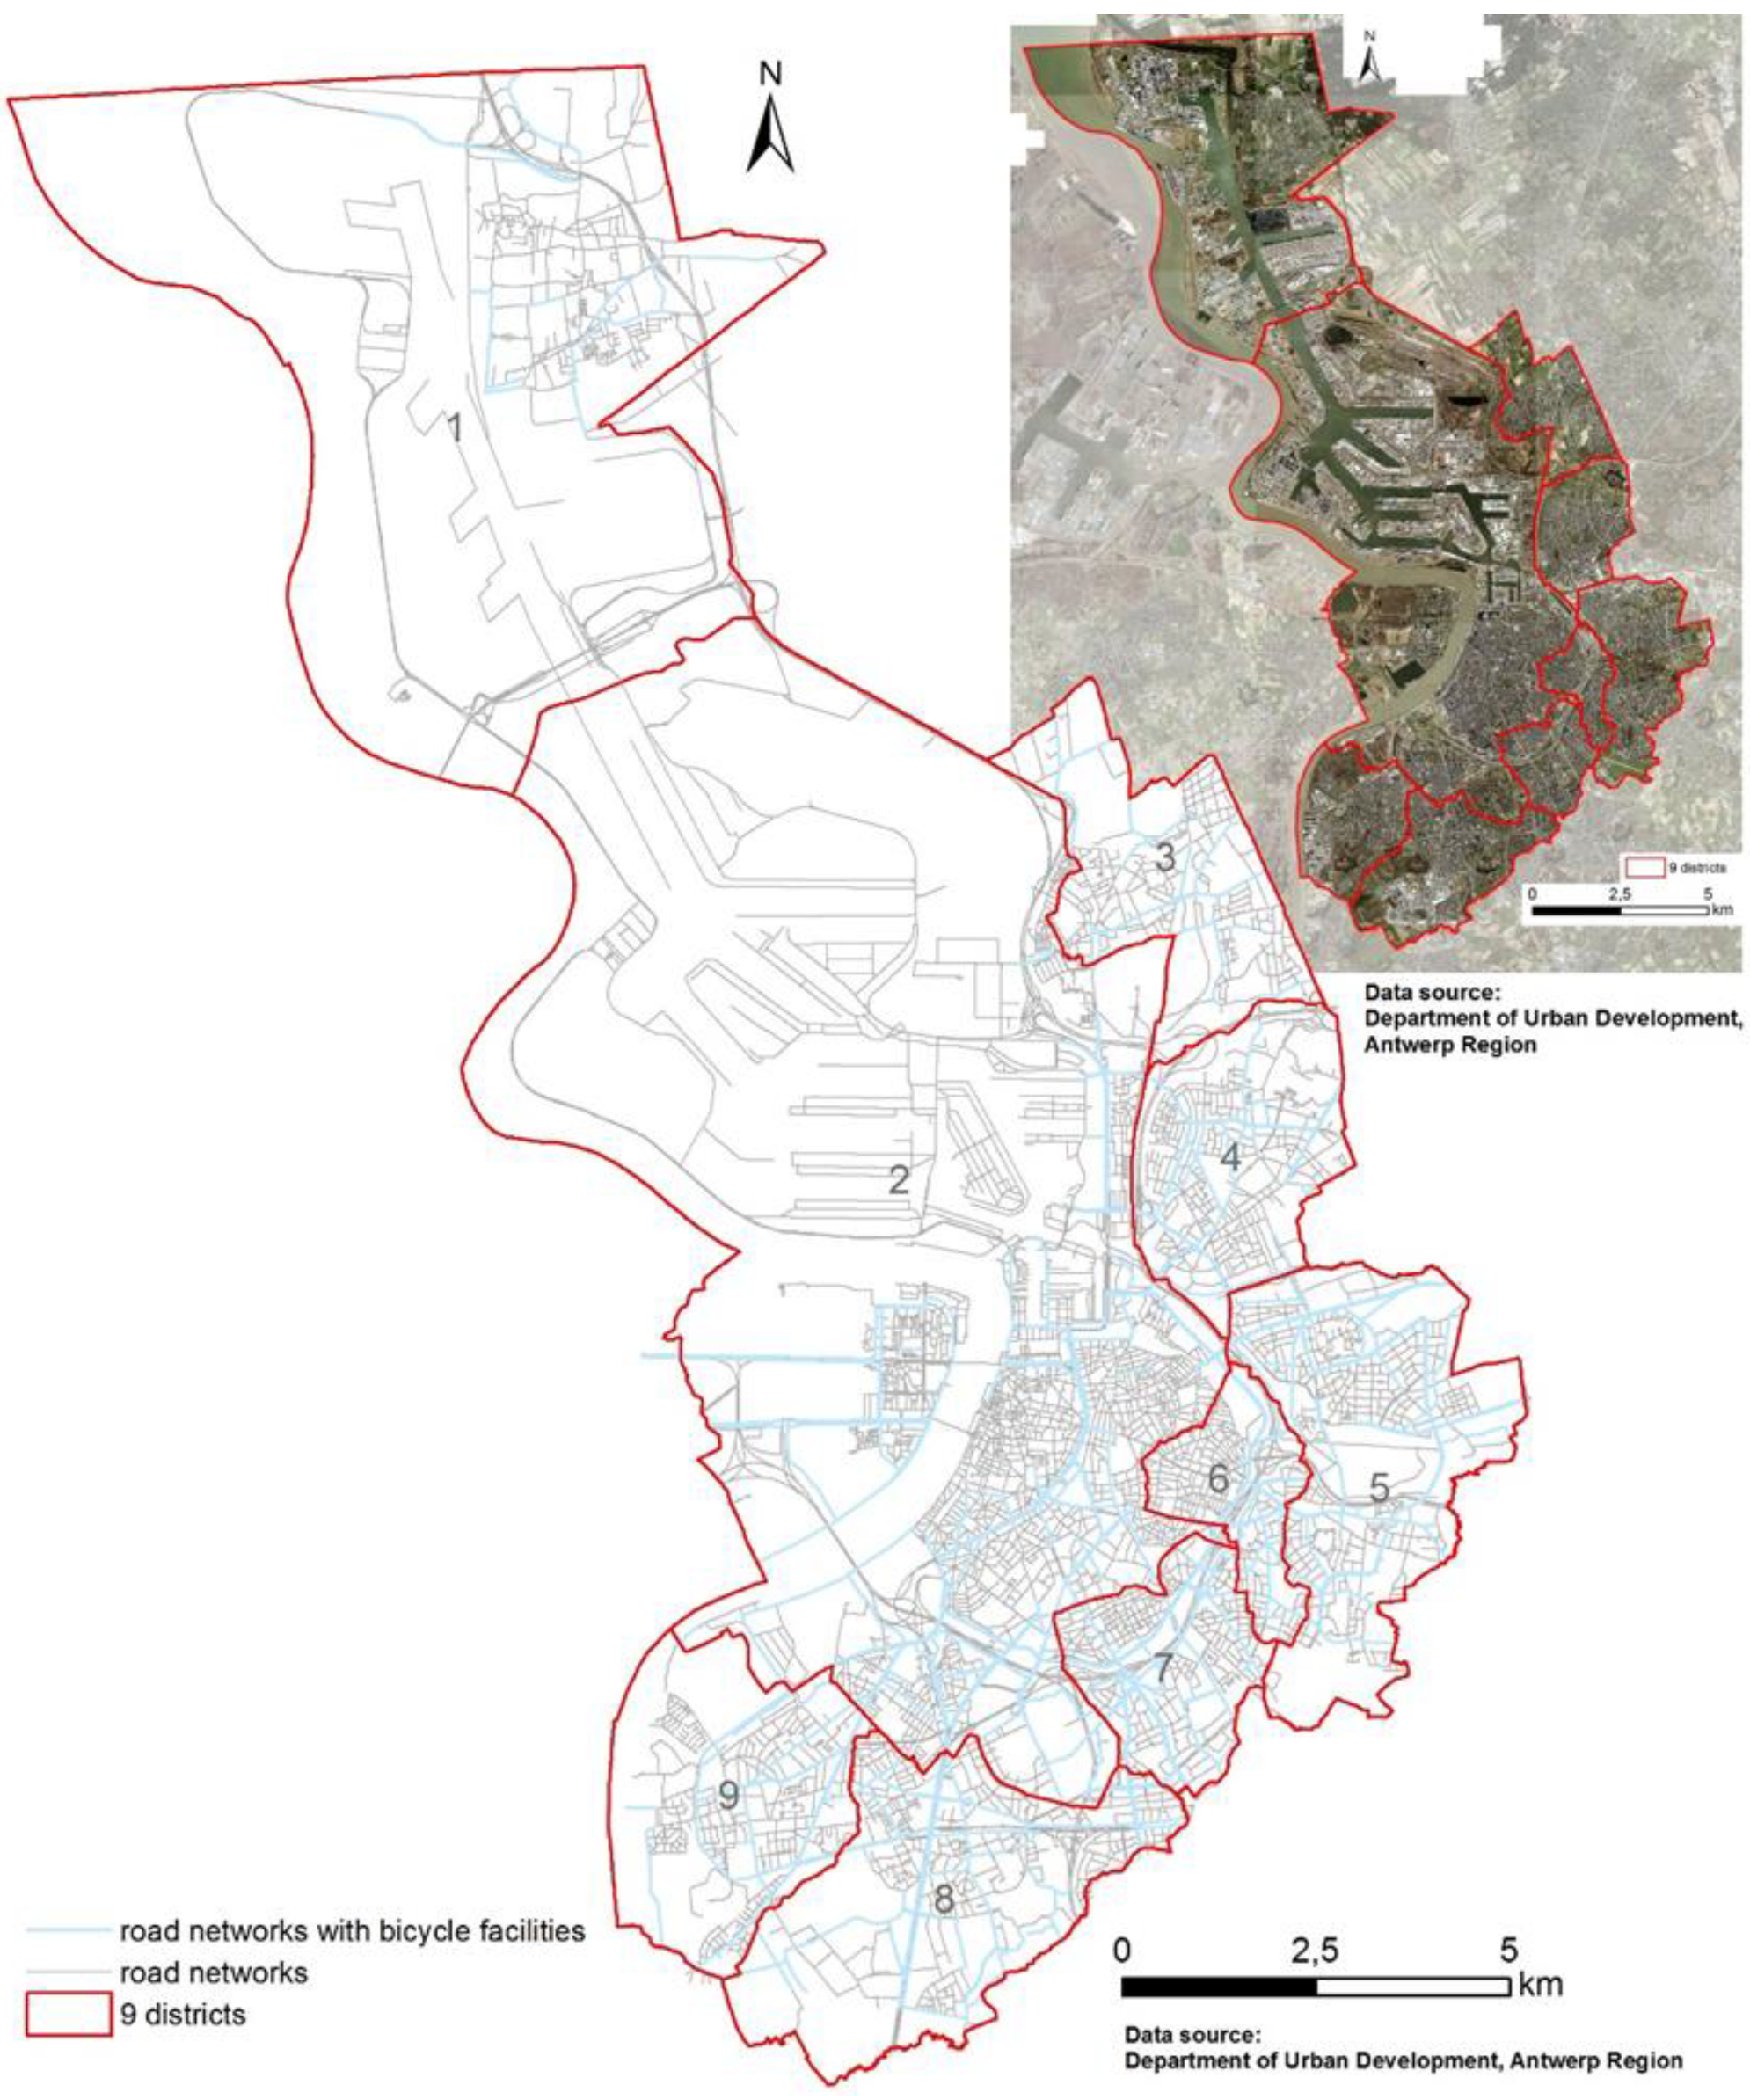
4. Case Study
Study Area
5. Data Attributes and Sources
5.1. Analytical Environments

| Variables and Influencing Factors | Defined Categories | Data Source | Relevant Literature |
| Road networks | (ref. number of road forks) | The road network of ArcGIS from (3) and (4) or from Google Map | [44] |
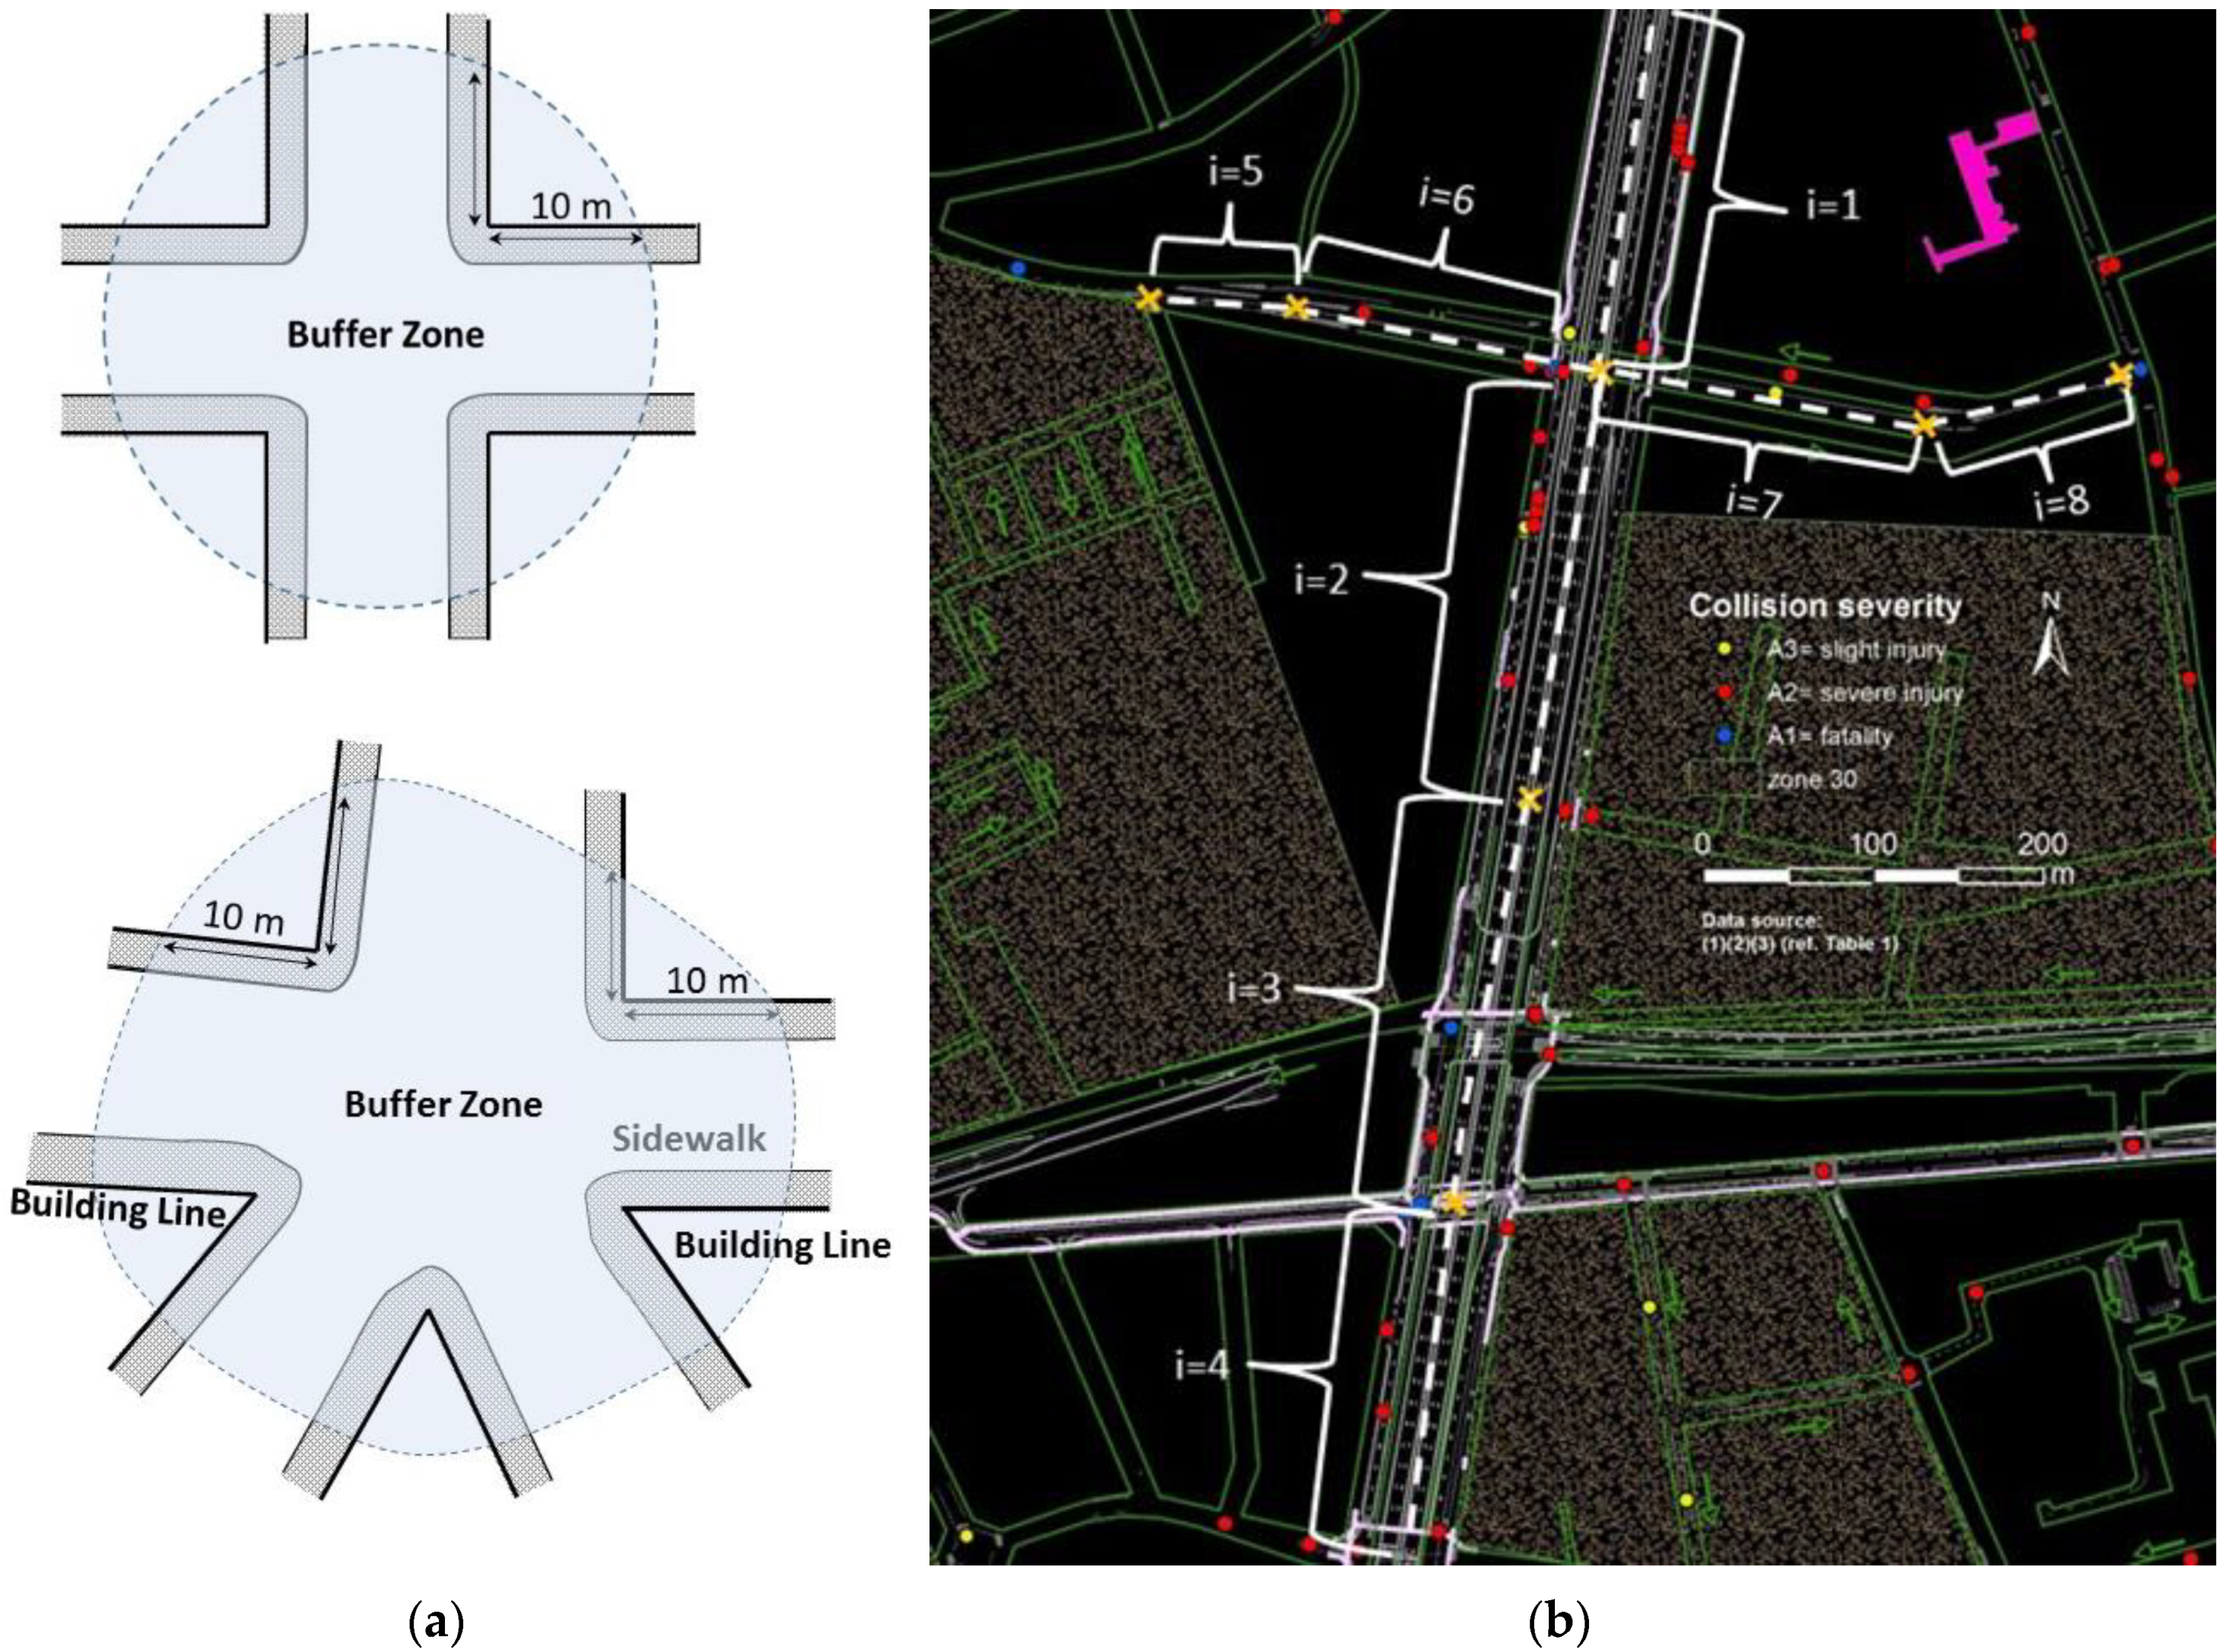
| BMV crash at location i | i = 1–4120, 1415 observed samples were on urban arterials | Crash site figures from (1) | [20,71] |
| BMV crash frequency at location i | 1~45 | Original datasets from crash site figures (1), GIS Analysis through KDE | [88,89,90,91] |
| Daily bicycle flows (ADB) Fi | Original counts = 44–7633 log-transformed ADB = 1.64–3.88 | Data reports from (2); data of traffic sensors from (2) and (6); data mainly from (3) | [53,71,72] |
| Daily traffic flows (ADT) Vi, expressed in passenger car equivalent (PCE) | Original counts = 7003~69,982 log-transformed ADT = 3.85–4.85 | Data reports from (2); data of traffic sensors from (2) and (6); data mainly from (3) | [53,71,91,92,93] |
| Road categories | 0 = others, 1 = rural roads, 2 = urban secondary roads, 3 = urban arterials | Annual aerial photographs from (5); ArcGIS road networks from (3) and (4); Google Map | [4,44,51,53,56] |
| Road Environments | Defined Categories | Data Source | Relevant Literature |
| Morning peak hour volume (M-PHV) (PCU) | Log (M-PHV) = 2.59–3.80 Original counts = 396–6381 | Data reports from (2); data of traffic sensors from (2) and (6); data mainly from (3) | [52,76,94] |
| Afternoon peak hour volume (A-PHV) (PCU) | Log (A-PHV) = 2.45–3.71 Original counts = 284–5116 | Data reports from (2); data of traffic sensors from (2) and (6); data mainly from (3) | [52,76,94] |
| Month (seasonal patterns) | 1–12 = January–December | Brief description of the crash from (1) | [24] |
| Day (daily patterns) | 1–7 = Monday–Sunday | Brief description of the crash from (1) | [24,51] |
| Weekend (weekly patterns) | 0 = weekday, 1 = weekend | Brief description of the crash from (1) | [24,51] |
| Hour (hourly patterns) (h) | 1~24 | Brief description of the crash from (1) | [24] |
| Crash severity index (CSI) | 0 = A4 property damage, 1 = A3 slight injury, 2 = A2 severe injury, 3 = A1 fatality | Data from (1) and hospital records | [4,21,53,59,91,93,94] |
| Light conditions | 0 = daytime, 1 = night-time | Brief description of the crash from (1) | [4,44,56,63,95,96] |
| Number of lanes (unidirectional) | 0–6 | Aerial photos from (4) and (5); crash scene photos, brief description of the crash, crash site figures from (1); | [4,92,93,97,98] |
| Length of segments (m) | Log(LoS) = 1.05–2.72 Original length = 11.17–521.79 m | Road networks of ArcGIS from (3) and (4); crash site figures from (1); Annual traffic engineering facilities of AutoCAD measurements, from (4) | [12,20,99] |
| Area of junctions (m2) | Log(AoJ) = 0, 1.50–4.26, Original counts = 31.79–18,177.19 m2 | Road networks of ArcGIS from (3) and (4); crash site figures from (1); Annual traffic engineering facilities of AutoCAD measurements, from (4) | [20,100] |
| Road Engineering Facilities | Defined Categories | Data Source | Relevant Literature |
| Road section/Intersection | 0 = intersection, 1 = road section | ArcGIS road networks from (4); Google Map; Auto Cad Map | [4,30,59,90,94] |
| Lighting systems | 0 = at daytime, natural light; 1 = at night-time, natural light; 2 = at night-time, with lighting; 3 = at night-time, without lighting | Brief description of the crash from (1) | [4,44,51,56,63,95,96] |
| Residential area | 0 = not adjacent residential areas, otherwise = 1 | ArcGIS residential zones from (3) and (4) | [12,41,51] |
| Major road | 1 = intersect with another major road, otherwise = 0 | ArcGIS road networks from (2), (3) and (4) | [12,45,51] |
| Secondary road | 1 = intersect with a secondary road, otherwise = 0 | ArcGIS road networks from (2), (3) and (4) | [12,24,31,45,51] |
| Collector road | 1 = intersect with a collector road, otherwise = 0 | ArcGIS road networks from (2), (3) and (4) | [12,24,45] |
| Central business district (CBD) | 1 = adjacent CBDs, otherwise = 0 | Annual ArcGIS CBD zones from (4) and (5) | [7,71] |
| One-way bicycle path | 1 = with a one-way bicycle path, otherwise = 0 | Original data from (3) and (4) and field investigation (6) | [7,12] |
| Two-way bicycle paths | 1 = with two-way bicycle paths, otherwise = 0 | Original data from (3) and (4) and field investigation (6) | [7,12] |
| Two-way turns into a one-way bicycle path | 1 = between a one- and two-way bicycle paths, otherwise = 0 | Original data from (3) and (4) and field investigation (6) | [7,12] |
| Distance from the school (m) | 0 = 1–200 m from the school, 1 = 201–400 m, 2 = 401–600 m, 3 = more than 600 m | The location of crashes and schools from (1) and (4) respectively; distance measured by AutoCAD, original data from (2), (3) and (4); | [41,90] |
| Tram tracks | 1 = with tram tracks, otherwise = 0 | The location of tram tracks from (4); | [7,23,46,101] |
| Distance from the bus stop (m) | 0 = 1–200 m from the bus stop, 1 = 201–400 m, 2 = 401–600 m, 3 = more than 600 m | The location of crashes and bus stops from (1) and (4) respectively; distance measured by AutoCAD, original data from (2), (3) and (4); | [31,90,101] |
| Bus routes | 1 = passing through bus routes, otherwise = 0 | Crash site figures from (1); ArcGIS road networks from (3) and (4) | [31,90,101] |
| Main cycling routes | 1 = within main cycling routes, otherwise = 0 | ArcGIS road networks from (3) and (4); field investigation (6) | [101] |
| Lane marking | 0 = no lane marking, 1 = lane marking, 2 = lane marking with directional arrows | Crash site figures, brief description of the crash, the annual dataset of facilities from (2), and crash scene photos from (1) | [21,91,102,103,104] |
| Numbers of lanes (uni-directional) | 0–6 | Annual datasets of facilities from (2); crash scene photos, brief description of the crash, crash site figures from (1) | [4,92,93,97,98] |
| Road Traffic Controls | Defined Categories | Data Source | Relevant Literature |
| Speed limits (km/h) | 20~90 20, 30, 50, 70, 90 | ArcGIS road networks from (3) and (4); annual datasets of facilities from (2) | [4,44,53,56,59,71,97,103] |
| Signalised facilities | 0 = no, 1 = flashing amber signals, 2 = traffic signals, 3 = traffic signals prioritise cyclists and pedestrians | Data from (2) and (3) and crash site figures from (1) | [30,46,53,71,93,100,102,105] |
| Signal cycle lengths (s) | 0 = 0~60, 1 = 61~120, 2 = >120 s | Data from (2) | [91,101,106,107] |
| Zone 20/30 (residential zone) | 0 = non-traffic-calming zone, 1 = within dynamic traffic-calming zone, 2 = within zone 30 km/h, 3 = within zone 20 km/h, | Data from (2); annual ArcGIS traffic calming zones from (4) and (3) | [39,41] |
| One-way road | 1 = one-way road, otherwise = 0 | Annual aerial photographs from (5); ArcGIS road networks from (3) and (4); | [12,20,51] |
| Turning movement of motorists | 0 = straight ahead, 1 = left turns, 2 = right-turning | Crash site figures and brief description of the crash from (1), and sensor data from (2) | [4,93,100] |
| Turning movement of cyclists | 0 = straight, 1 = left-turning, 2 = right turning | Crash site figures and brief description of the crash from (1), and sensor data from (2) | [4,93,103] |
5.2. Influencing Risk Factors
6. Results
7. Discussion
7.1. Spatial Dimension
7.2. Temporal Dimension
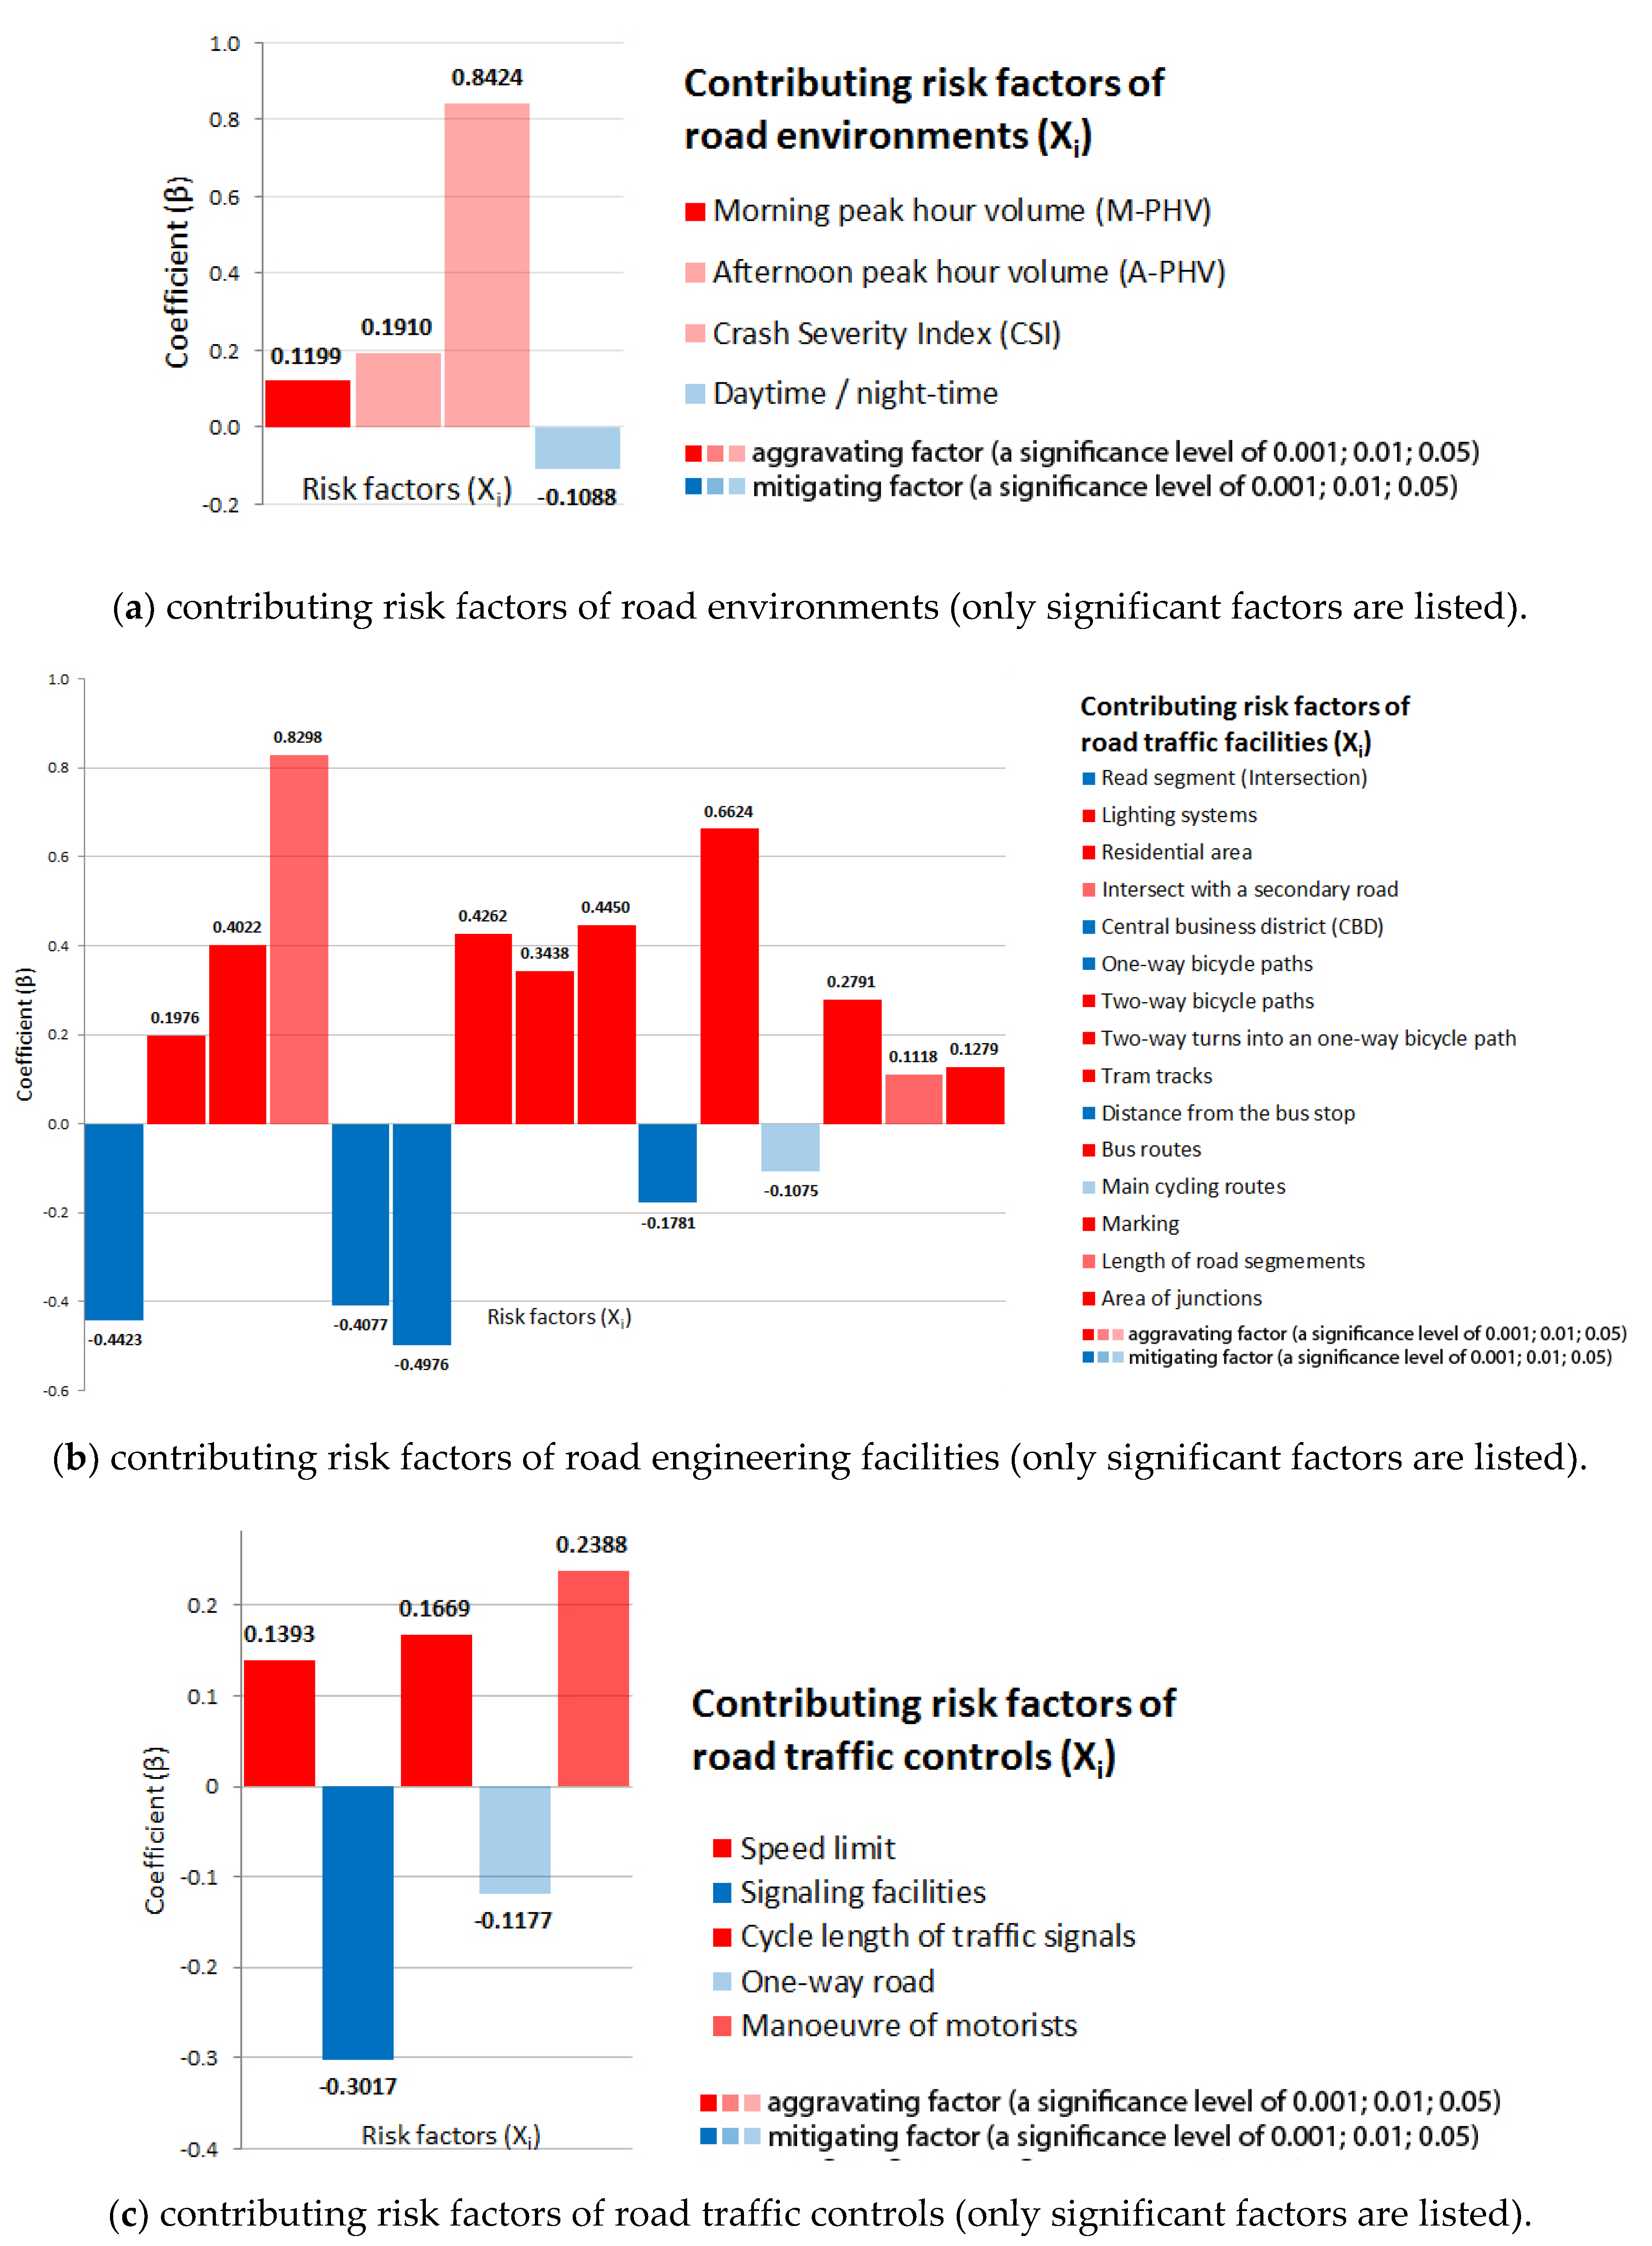
7.2.1. Road Environments
7.2.2. Road Engineering Facilities
7.2.3. Road Traffic Controls
8. Conclusions
8.1. Meaning of the Two-Stage Workflow
8.2. General Conclusions
9. Limitations and Further Research
Author Contributions
Funding
Acknowledgments
Conflicts of Interest
References
- Gössling, S. Urban transport transitions: Copenhagen, city of cyclists. J. Transp. Geogr. 2013, 33, 196–206. [Google Scholar] [CrossRef]
- Holm, L.; Glümer, C.; Diderichsen, F. Health impact assessment of increased cycling to place of work or education in Copenhagen. BMJ Open 2012, 2, 1–8. [Google Scholar] [CrossRef] [PubMed]
- Lee, J.; Abdel-Aty, M. Macro-level analysis of bicycle safety: Focusing on the characteristics of both crash location and residence. Int. J. Sustain. Transp. 2017, 12, 1–8. [Google Scholar] [CrossRef]
- Kaplan, S.; Vavatsoulas, K.; Prato, C.G. Aggravating and mitigating factors associated with cyclist injury severity in Denmark. J. Saf. Res. 2014, 50, 75–82. [Google Scholar] [CrossRef] [PubMed]
- Stipdonk, H.; Reurings, M. The effect on road safety of a modal shift from car to bicycle. Traffic Inj. Prev. 2012, 13, 412–421. [Google Scholar] [CrossRef] [PubMed]
- Vandenbulcke-Plasschaert, G. Spatial Analysis of Bicycle Use and Accident Risks for Cyclists; Université Catholique de Louvain: Louvain-la-Neuve, Belgium, 2011. [Google Scholar]
- Vandenbulcke, G.; Thomas, I.; Int Panis, L. Predicting cycling accident risk in Brussels: A spatial case–control approach. Accid. Anal. Prev. 2014, 62, 341–357. [Google Scholar] [CrossRef] [PubMed]
- Reynolds, C.C.O.; Harris, M.A.; Teschke, K.; Cripton, P.A.; Winters, M. The impact of transportation infrastructure on bicycling injuries and crashes: A review of the literature. Environ. Health 2009, 8, 47. [Google Scholar] [CrossRef] [PubMed]
- Schepers, P.; Hagenzieker, M.; Methorst, R.; van Wee, B.; Wegman, F. A conceptual framework for road safety and mobility applied to cycling safety. Accid. Anal. Prev. 2014, 62, 331–340. [Google Scholar] [CrossRef] [Green Version]
- International Transport Forum (ITF); Organisation for Economic Co-operation and Development (OECD). Cycling, Health and Safety; OECD Publishing: Paris, France, 2013. [Google Scholar]
- Ryus, P.; Ferguson, E.; Laustsen, K.M.; Schneider, R.J.; Proulx, F.R.; Hull, T.; Miranda-Moreno, L. Guidebook on Pedestrian and Bicycle Volume Data Collection; Report 797; The National Academies Press: Washington, DC, USA, 2014; p. 139. [Google Scholar]
- Kondo, M.C.; Morrison, C.; Guerra, E.; Kaufman, E.J.; Wiebe, D.J. Where do bike lanes work best? A Bayesian spatial model of bicycle lanes and bicycle crashes. Saf. Sci. 2018, 103, 225–233. [Google Scholar] [CrossRef]
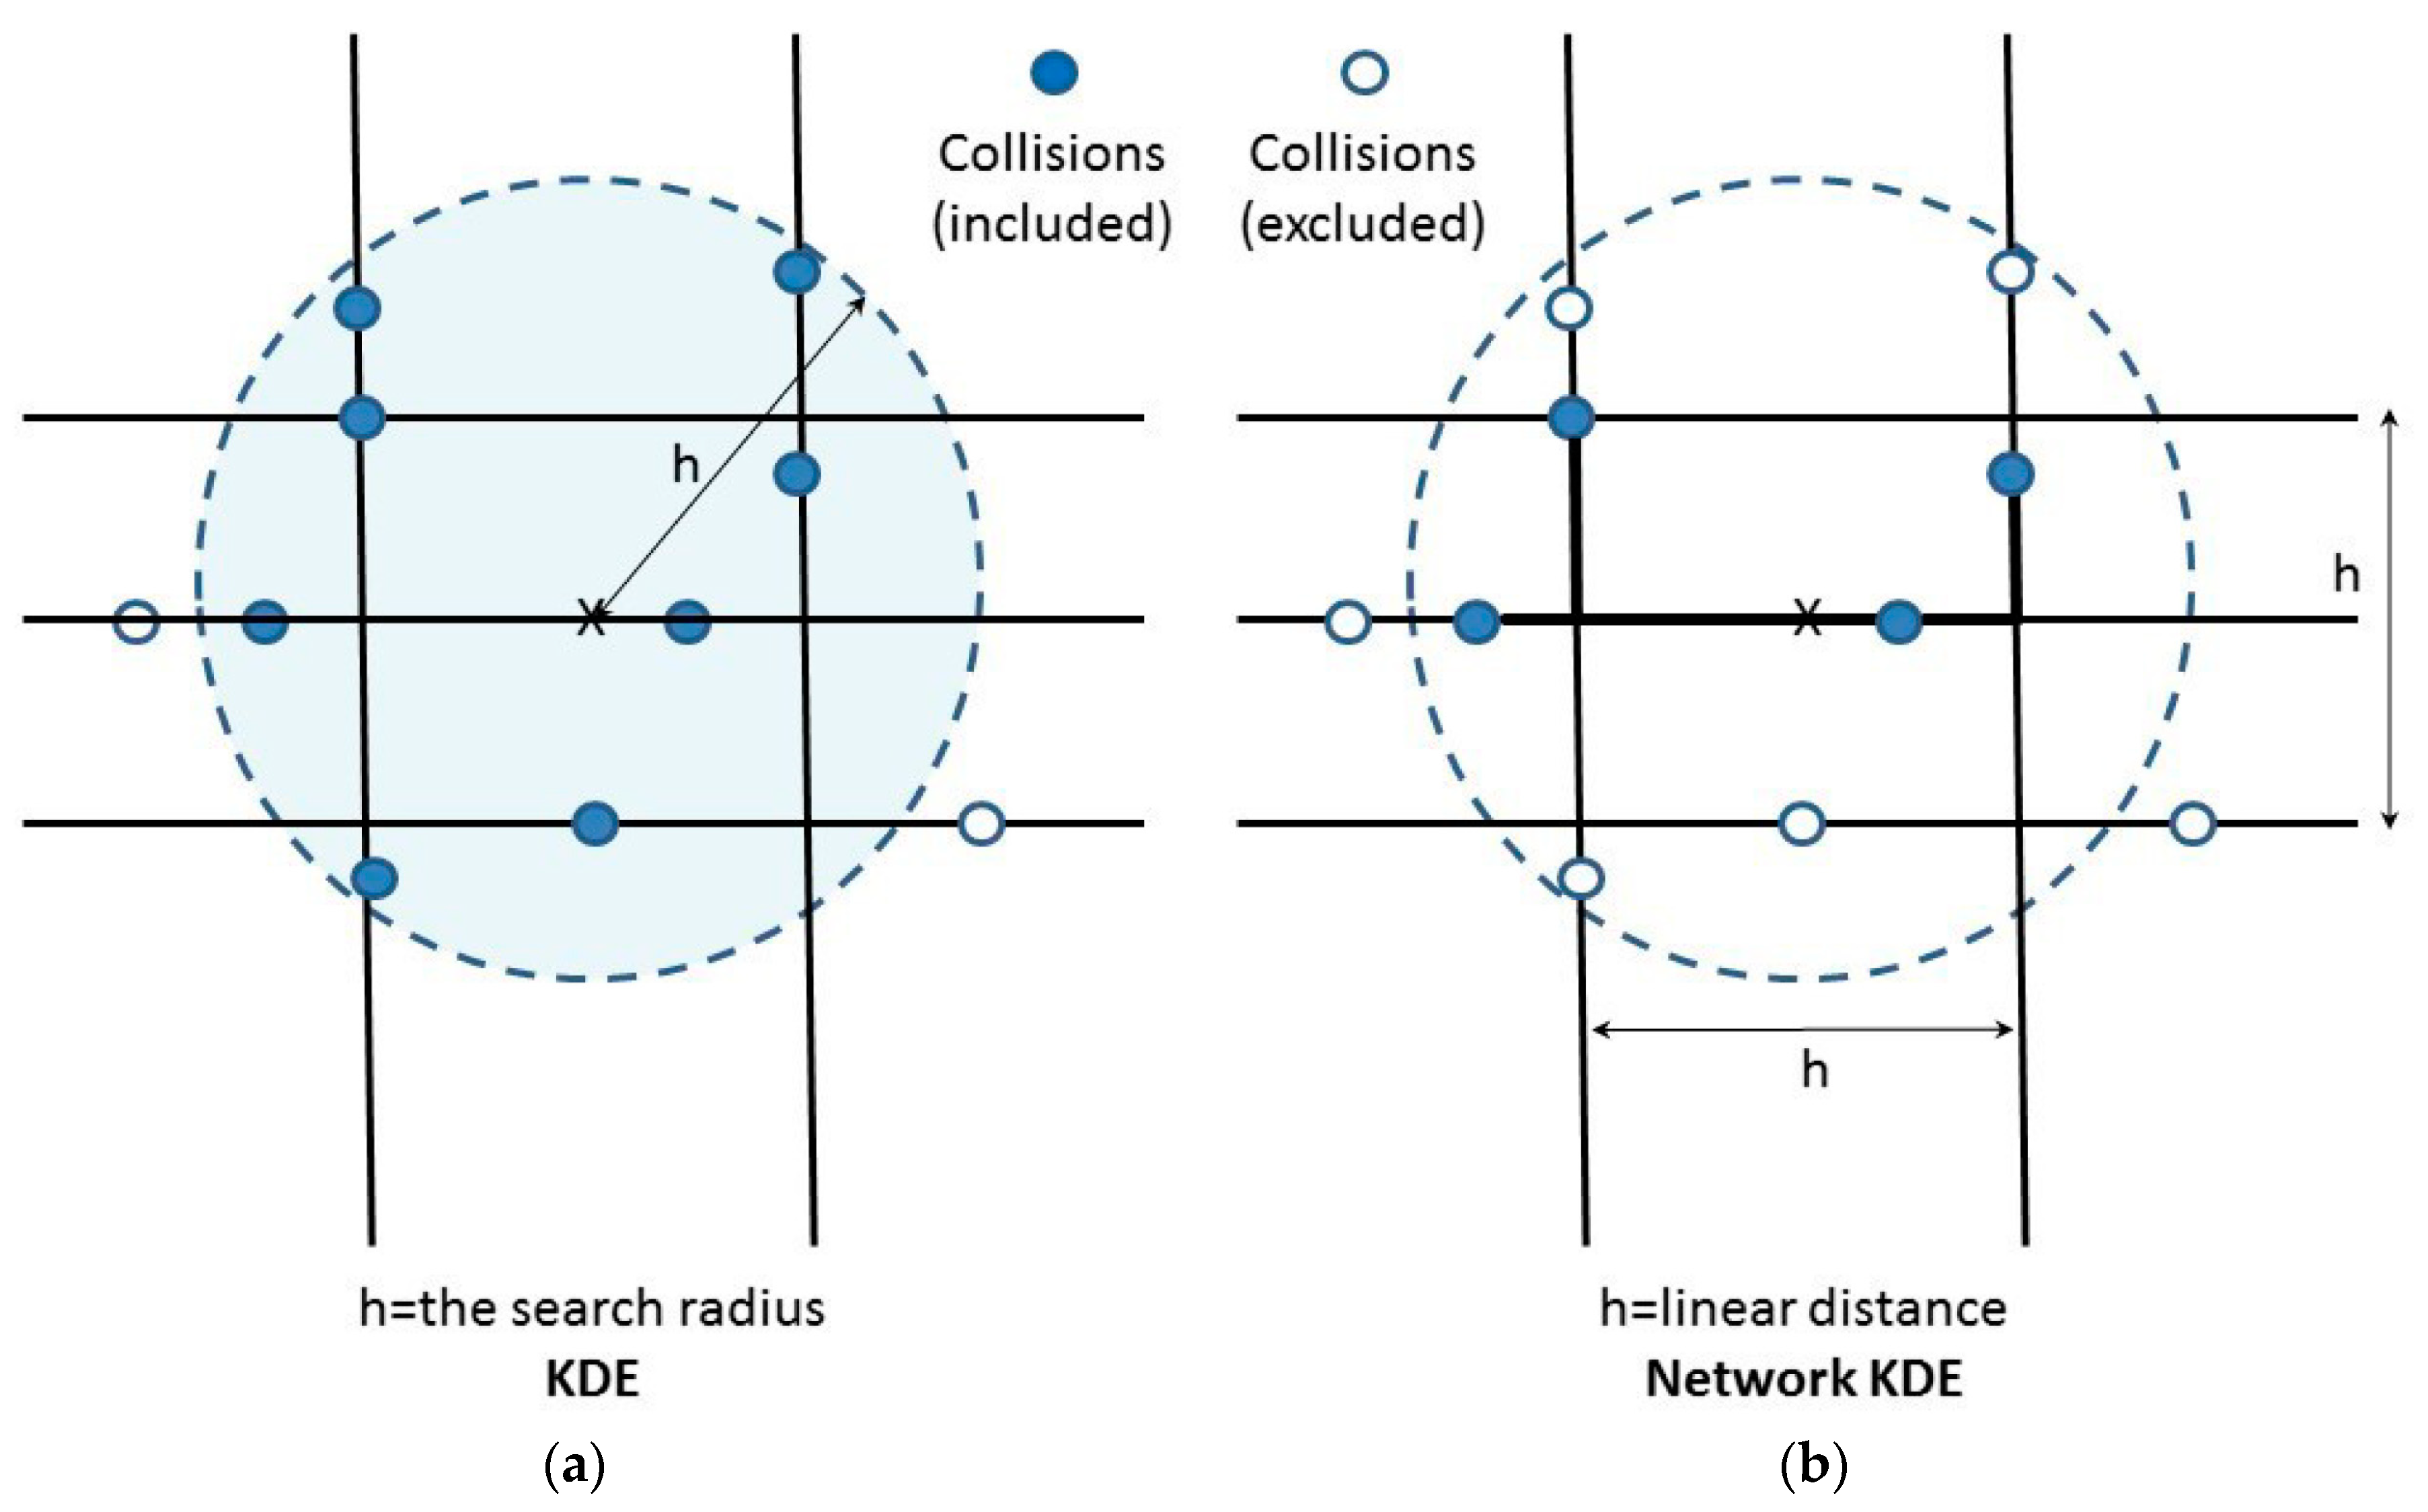
- Xie, Z.; Yan, J. Kernel density estimation of traffic accidents in a network space. Comput. Environ. Urban. Syst. 2008, 32, 396–406. [Google Scholar] [CrossRef]
- Wagenbuur, M. How Child Road Deaths Changed the Netherlands; BBC World Service: London, UK, 2013. [Google Scholar]
- Haddon, W., Jr. Advances in the epidemiology of injuries as a basis for public policy. Public Health Rep. (Washington, D.C. 1974) 1980, 95, 411–421. [Google Scholar]
- Othman, S.; Thomson, R.; Lannér, G. Identifying critical road geometry parameters affecting crash rate and crash type. Ann. Adv. Automot. Med. Ann. Sci. Conf. 2009, 53, 155–165. [Google Scholar]
- Useche, S.; Montoro, L.; Alonso, F.; Oviedo-Trespalacios, O. Infrastructural and human factors affecting safety outcomes of cyclists. Sustainability 2018, 10, 299. [Google Scholar] [CrossRef]
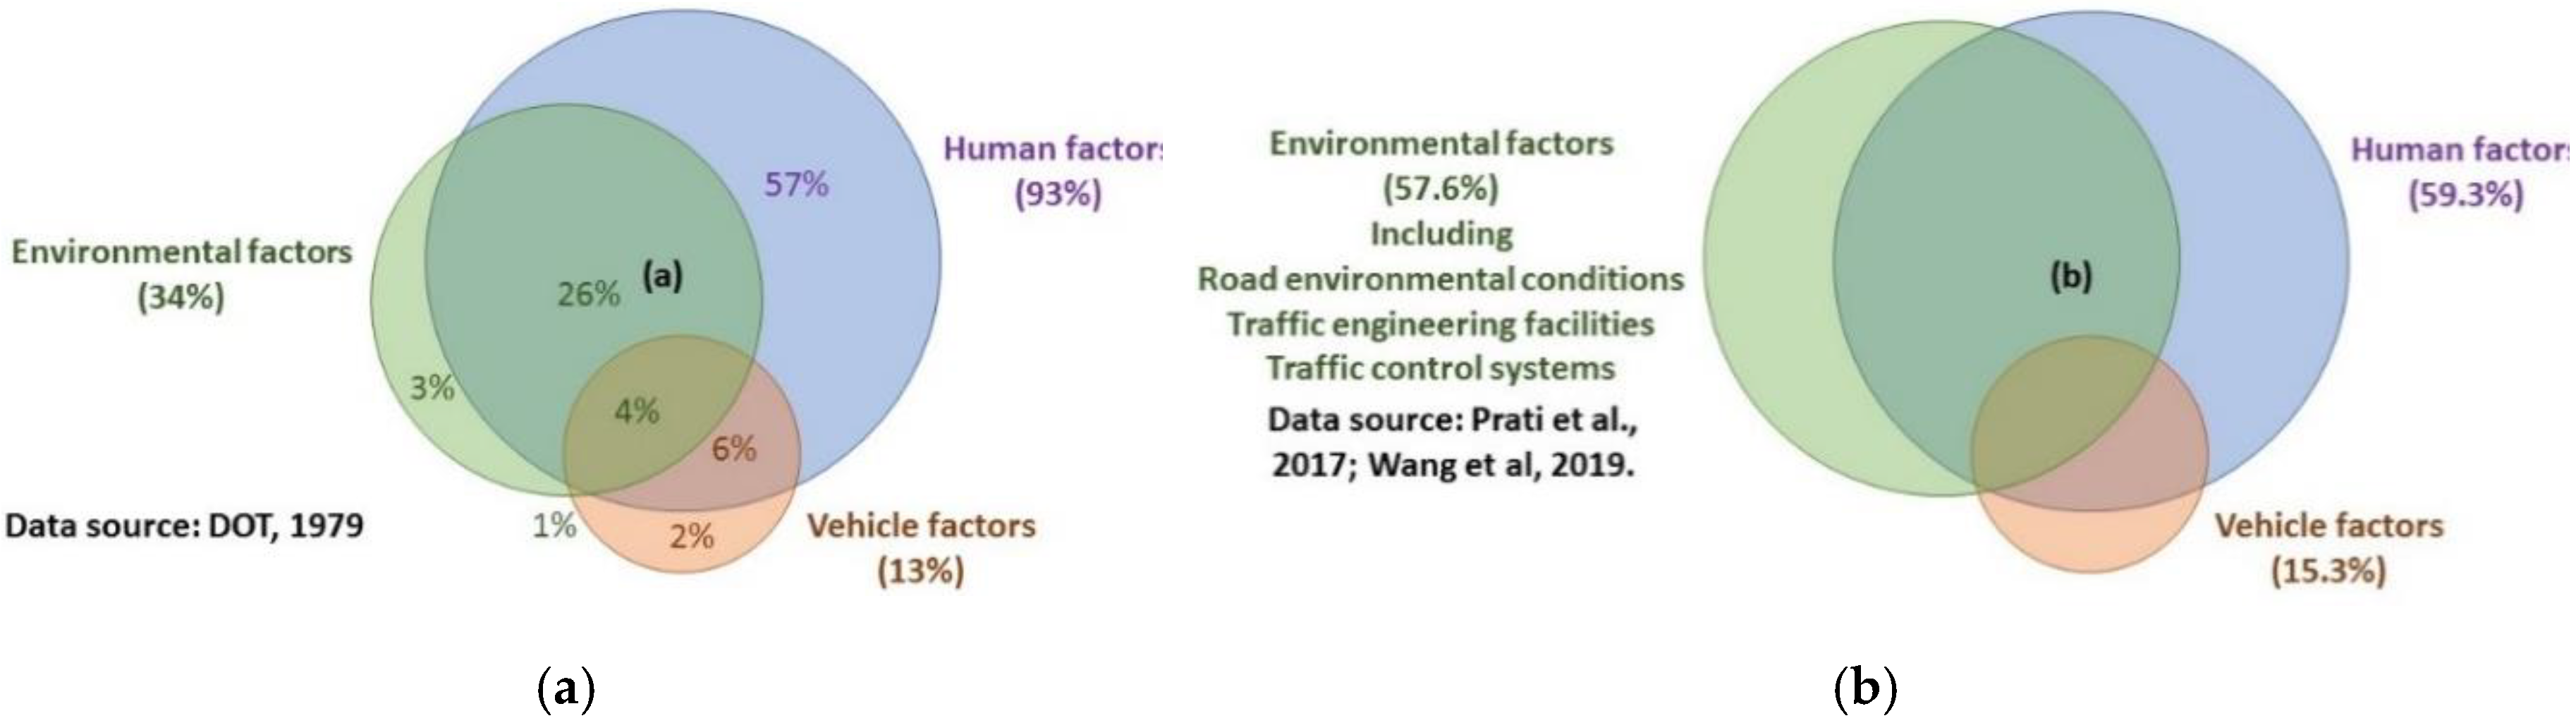
- DOT. Tri-Level Study of the Causes of Traffic Accidents: Final Report; Institute for Research in Public Safety, Indiana University: Bloomington, IN, USA, 1979. [Google Scholar]
- Prati, G.; Marín Puchades, V.; De Angelis, M.; Fraboni, F.; Pietrantoni, L. Factors contributing to bicycle–motorised vehicle collisions: A systematic literature review AU—Prati, Gabriele. Transp. Rev. 2018, 38, 184–208. [Google Scholar] [CrossRef]
- Wang, H.; De Backer, H.; Lauwers, D.; Chang, S.K.J. A spatio-temporal mapping to assess bicycle collision risks on high-risk areas (Bridges)—A case study from Taipei (Taiwan). J. Transp. Geogr. 2019, 75, 94–109. [Google Scholar] [CrossRef]
- Prati, G.; Pietrantoni, L.; Fraboni, F. Using data mining techniques to predict the severity of bicycle crashes. Accid. Anal. Prev. 2017, 101, 44–54. [Google Scholar] [CrossRef] [PubMed]
- Mulvaney, C.A.; Smith, S.; Watson, M.C.; Parkin, J.; Coupland, C.; Miller, P.; Kendrick, D.; McClintock, H. Cycling infrastructure for reducing cycling injuries in cyclists. Cochrane Database Syst. Rev. 2015. [Google Scholar] [CrossRef] [PubMed]
- Teschke, K.; Harris, M.A.; Reynolds, C.C.O.; Winters, M.; Babul, S.; Chipman, M.; Cusimano, M.D.; Brubacher, J.R.; Hunte, G.; Friedman, S.M.; et al. Route infrastructure and the risk of injuries to bicyclists: A case-crossover study. Am. J. Public Health 2012, 102, 2336–2343. [Google Scholar] [CrossRef] [PubMed]
- Loidl, M.; Traun, C.; Wallentin, G. Spatial patterns and temporal dynamics of urban bicycle crashes—A case study from Salzburg (Austria). J. Transp. Geogr. 2016, 52, 38–50. [Google Scholar] [CrossRef]
- Kaplan, S.; Janstrup, K.H.; Prato, C.G. Investigating the reasons behind the intention to report cycling crashes to the police and hospitals in Denmark. Transp. Res. Part F Traffic Psychol. Behav. 2017, 44, 159–167. [Google Scholar] [CrossRef]
- Beck, B.; Stevenson, M.; Newstead, S.; Cameron, P.; Judson, R.; Edwards, E.R.; Bucknill, A.; Johnson, M.; Gabbe, B. Bicycling crash characteristics: An in-depth crash investigation study. Accid. Anal. Prev. 2016, 96, 219–227. [Google Scholar] [CrossRef] [PubMed]
- Bíl, M.; Bílová, M.; Müller, I. Critical factors in fatal collisions of adult cyclists with automobiles. Accid. Anal. Prev. 2010, 42, 1632–1636. [Google Scholar] [CrossRef] [PubMed]
- Chen, L.; Chen, C.; Srinivasan, R.; McKnight, C.E.; Ewing, R.; Roe, M. Evaluating the safety effects of bicycle lanes in New York City. Am. J. Public Health 2012, 102, 1120–1127. [Google Scholar] [CrossRef] [PubMed]
- Hels, T.; Orozova-Bekkevold, I. The effect of roundabout design features on cyclist accident rate. Accid. Anal. Prev. 2007, 39, 300–307. [Google Scholar] [CrossRef] [PubMed]
- Harris, M.A.; Reynolds, C.C.O.; Winters, M.; Cripton, P.A.; Shen, H.; Chipman, M.L.; Cusimano, M.D.; Babul, S.; Brubacher, J.R.; Friedman, S.M.; et al. Comparing the effects of infrastructure on bicycling injury at intersections and non-intersections using a case–crossover design. Inj. Prev. 2013, 19, 303–310. [Google Scholar] [CrossRef] [PubMed]
- Wei, F.; Lovegrove, G. An empirical tool to evaluate the safety of cyclists: Community based, macro-level collision prediction models using negative binomial regression. Accid. Anal. Prev. 2013, 61, 129–137. [Google Scholar] [CrossRef] [PubMed]
- Romanow, N.T.R.; Couperthwaite, A.B.; McCormack, G.R.; Nettel-Aguirre, A.; Rowe, B.H.; Hagel, B.E. Environmental determinants of bicycling injuries in Alberta, Canada. J. Environ. Public Health 2012, 2012, 12. [Google Scholar] [CrossRef]
- Wessels, R.L. Bicycle collisions in Washington State: A six-year perspective, 1988–1993. Transp. Res. Rec. 1996, 1538, 81–90. [Google Scholar] [CrossRef]
- Vandenbulcke, G.; Thomas, I.; de Geus, B.; Degraeuwe, B.; Torfs, R.; Meeusen, R.; Int Panis, L. Mapping bicycle use and the risk of accidents for commuters who cycle to work in Belgium. Transp. Policy 2009, 16, 77–87. [Google Scholar] [CrossRef]
- Kaplan, S.; Giacomo Prato, C. A spatial analysis of land use and network effects on frequency and severity of cyclist–motorist crashes in the Copenhagen region. Traffic Inj. Prev. 2015, 16, 724–731. [Google Scholar] [CrossRef]
- De Geus, B.; Vandenbulcke, G.; Int Panis, L.; Thomas, I.; Degraeuwe, B.; Cumps, E.; Aertsens, J.; Torfs, R.; Meeusen, R. A prospective cohort study on minor accidents involving commuter cyclists in Belgium. Accid. Anal. Prev. 2012, 45, 683–693. [Google Scholar] [CrossRef] [PubMed]
- Cai, Q.; Lee, J.; Eluru, N.; Abdel-Aty, M. Macro-level pedestrian and bicycle crash analysis: Incorporating spatial spillover effects in dual state count models. Accid. Anal. Prev. 2016, 93, 14–22. [Google Scholar] [CrossRef] [PubMed]
- Lee, J.; Abdel-Aty, M.; Jiang, X. Multivariate crash modeling for motor vehicle and non-motorized modes at the macroscopic level. Accid. Anal. Prev. 2015, 78, 146–154. [Google Scholar] [CrossRef] [PubMed]
- Siddiqui, C.; Abdel-Aty, M.; Choi, K. Macroscopic spatial analysis of pedestrian and bicycle crashes. Accid. Anal. Prev. 2012, 45, 382–391. [Google Scholar] [CrossRef]
- Yiannakoulias, N.; Bennet, S.A.; Scott, D.M. Mapping commuter cycling risk in urban areas. Accid. Anal. Prev. 2012, 45, 164–172. [Google Scholar] [CrossRef] [PubMed]
- Abdel-Aty, M.; Siddiqui, C.; Huang, H.; Wang, X. Integrating trip and roadway characteristics to manage safety in traffic analysis zones. Transp. Res. Rec. 2011, 2213, 20–28. [Google Scholar] [CrossRef]
- Noland, R.; Quddus, M. Analysis of pedestrian and bicycle casualties with regional panel data. Transp. Res. Rec. 2004, 1897. [Google Scholar] [CrossRef]
- Schepers, J.P.; Kroeze, P.A.; Sweers, W.; Wüst, J.C. Road factors and bicycle–motor vehicle crashes at unsignalized priority intersections. Accid. Anal. Prev. 2011, 43, 853–861. [Google Scholar] [CrossRef]
- Haleem, K.; Abdel-Aty, M. Examining traffic crash injury severity at unsignalized intersections. J. Saf. Res. 2010, 41, 347–357. [Google Scholar] [CrossRef] [PubMed]
- Saha, D.; Alluri, P.; Gan, A.; Wu, W. Spatial analysis of macro-level bicycle crashes using the class of conditional autoregressive models. Accid. Anal. Prev. 2018, 118, 166–177. [Google Scholar] [CrossRef] [PubMed]
- Chen, P. Built environment factors in explaining the automobile-involved bicycle crash frequencies: A spatial statistic approach. Saf. Sci. 2015, 79, 336–343. [Google Scholar] [CrossRef]
- Lord, D.; Mannering, F. The statistical analysis of crash-frequency data: A review and assessment of methodological alternatives. Transp. Res. Part A Policy Pract. 2010, 44, 291–305. [Google Scholar] [CrossRef] [Green Version]
- Lord, D.; Geedipally, S.R.; Guikema, S.D. Extension of the application of Conway-Maxwell-Poisson models: Analyzing traffic crash data exhibiting underdispersion. Risk Anal. 2010, 30, 1268–1276. [Google Scholar] [CrossRef] [PubMed]
- Vanparijs, J.; Int Panis, L.; Meeusen, R.; de Geus, B. Exposure measurement in bicycle safety analysis: A review of the literature. Accid. Anal. Prev. 2015, 84, 9–19. [Google Scholar] [CrossRef] [PubMed]
- Dozza, M. Crash risk: How cycling flow can help explain crash data. Accid. Anal. Prev. 2017, 105, 21–29. [Google Scholar] [CrossRef] [PubMed]
- Kim, J.-K.; Kim, S.; Ulfarsson, G.F.; Porrello, L.A. Bicyclist injury severities in bicycle–motor vehicle accidents. Accid. Anal. Prev. 2007, 39, 238–251. [Google Scholar] [CrossRef] [PubMed]
- Yan, X.; Ma, M.; Huang, H.; Abdel-Aty, M.; Wu, C. Motor vehicle–bicycle crashes in Beijing: Irregular maneuvers, crash patterns, and injury severity. Accid. Anal. Prev. 2011, 43, 1751–1758. [Google Scholar] [CrossRef]
- Chen, C.; Anderson, J.C.; Wang, H.; Wang, Y.; Vogt, R.; Hernandez, S. How bicycle level of traffic stress correlate with reported cyclist accidents injury severities: A geospatial and mixed logit analysis. Accid. Anal. Prev. 2017, 108, 234–244. [Google Scholar] [CrossRef]
- Chen, D.; Fuller, D. Analyzing road surface conditions, collision time, and road structural factors associated with bicycle collisions from 2000 to 2010 in Saskatoon, Saskatchewan. J. Transp. Health 2014, 1, 40–44. [Google Scholar] [CrossRef]
- Andrey, J.; Yagar, S. A temporal analysis of rain-related crash risk. Accid. Anal. Prev. 1993, 25, 465–472. [Google Scholar] [CrossRef]
- Klop, J.R.; Khattak, A.J. Factors influencing bicycle crash severity on two-lane, undivided roadways in North Carolina. Transp. Res. Rec. 1999, 1674, 78–85. [Google Scholar] [CrossRef]
- Juhra, C.; Wieskötter, B.; Chu, K.; Trost, L.; Weiss, U.; Messerschmidt, M.; Malczyk, A.; Heckwolf, M.; Raschke, M. Bicycle accidents—Do we only see the tip of the iceberg?: A prospective multi-centre study in a large German city combining medical and police data. Injury 2012, 43, 2026–2034. [Google Scholar] [CrossRef] [PubMed]
- Møller, M.; Hels, T. Cyclists’ perception of risk in roundabouts. Accid. Anal. Prev. 2008, 40, 1055–1062. [Google Scholar] [CrossRef] [PubMed]
- Vorko-Jović, A.; Kern, J.; Biloglav, Z. Risk factors in urban road traffic accidents. J. Saf. Res. 2006, 37, 93–98. [Google Scholar] [CrossRef] [PubMed] [Green Version]
- Moore, D.N.; Schneider, W.H.; Savolainen, P.T.; Farzaneh, M. Mixed logit analysis of bicyclist injury severity resulting from motor vehicle crashes at intersection and non-intersection locations. Accid. Anal. Prev. 2011, 43, 621–630. [Google Scholar] [CrossRef] [PubMed]
- Zhang, Y.; Bigham, J.; Ragland, D.; Chen, X. Investigating the associations between road network structure and non-motorist accidents. J. Transp. Geogr. 2015, 42, 34–47. [Google Scholar] [CrossRef]
- Boss, D.; Nelson, T.; Winters, M. Monitoring city wide patterns of cycling safety. Accid. Anal. Prev. 2018, 111, 101–108. [Google Scholar] [CrossRef] [PubMed]
- Lovelace, R.; Roberts, H.; Kellar, I. Who, where, when: The demographic and geographic distribution of bicycle crashes in West Yorkshire. Transp. Res. Part F Traffic Psychol. Behav. 2016, 41, 277–293. [Google Scholar] [CrossRef]
- Delmelle, E.C.; Thill, J.-C. Urban bicyclists: Spatial analysis of adult and youth traffic hazard intensity. Transp. Res. Rec. 2008, 2074, 31–39. [Google Scholar] [CrossRef]
- Jestico, B.; Nelson, T.; Winters, M. Mapping ridership using crowdsourced cycling data. J. Transp. Geogr. 2016, 52, 90–97. [Google Scholar] [CrossRef] [Green Version]
- Esawey, M.E. Estimation of annual average daily bicycle traffic with adjustment factors. Transp. Res. Rec. J. Transp. Res. Board 2014, 2443, 106–114. [Google Scholar] [CrossRef]
- Dezman, Z.; de Andrade, L.; Vissoci, J.R.; El-Gabri, D.; Johnson, A.; Hirshon, J.M.; Staton, C.A. Hotspots and causes of motor vehicle crashes in Baltimore, Maryland: A geospatial analysis of five years of police crash and census data. Injury 2016, 47, 2450–2458. [Google Scholar] [CrossRef] [PubMed] [Green Version]
- Steenberghen, T.; Dufays, T.; Thomas, I.; Flahaut, B. Intra-urban location and clustering of road accidents using GIS: A Belgian example. Int. J. Geogr. Inf. Sci. 2004, 18, 169–181. [Google Scholar] [CrossRef]
- Twisk, D.A.M.; Reurings, M. An epidemiological study of the risk of cycling in the dark: The role of visual perception, conspicuity and alcohol use. Accid. Anal. Prev. 2013, 60, 134–140. [Google Scholar] [CrossRef] [PubMed] [Green Version]
- Nordback, K.; Marshall, W.E.; Janson, B.N. Bicyclist safety performance functions for a U.S. city. Accid. Anal. Prev. 2014, 65, 114–122. [Google Scholar] [CrossRef]
- Wang, Y.; Nihan, N.L. Estimating the risk of collisions between bicycles and motor vehicles at signalized intersections. Accid. Anal. Prev. 2004, 36, 313–321. [Google Scholar] [CrossRef]
- Fishman, E.; Schepers, P. Global bike share: What the data tells us about road safety. J. Saf. Res. 2016, 56, 41–45. [Google Scholar] [CrossRef]
- Aertsens, J.; de Geus, B.; Vandenbulcke, G.; Degraeuwe, B.; Broekx, S.; De Nocker, L.; Liekens, I.; Mayeres, I.; Meeusen, R.; Thomas, I.; et al. Commuting by bike in Belgium, the costs of minor accidents. Accid. Anal. Prev. 2010, 42, 2149–2157. [Google Scholar] [CrossRef]
- Gatrell, A.C.; Bailey, T.C.; Diggle, P.J.; Rowlingson, B.S. Spatial point pattern analysis and its application in geographical epidemiology. Trans. Inst. Br. Geogr. 1996, 21, 256–274. [Google Scholar] [CrossRef]
- Fotheringham, S.; Brunsdon, C.; Charlton, M. Quantitative Geography: Perspectives on Spatial Data Analysis; Sage: London, UK, 2000; p. 272. [Google Scholar]
- Thakali, L.; Kwon, T.J.; Fu, L. Identification of crash hotspots using kernel density estimation and kriging methods: A comparison. J. Mod. Transp. 2015, 23, 93–106. [Google Scholar] [CrossRef]
- Anderson, T.K. Kernel density estimation and K-means clustering to profile road accident hotspots. Accid. Anal. Prev. 2009, 41, 359–364. [Google Scholar] [CrossRef] [PubMed]
- Okabe, A.; Satoh, T.; Sugihara, K. A kernel density estimation method for networks, its computational method and a GIS-based tool. Int. J. Geogr. Inf. Sci. 2009, 23, 7–32. [Google Scholar] [CrossRef]
- Jovanis, P.P.; Chang, H.-L. Modeling the relationship of accidents to miles traveled. Transp. Res. Rec. 1986, 1068, 42–51. [Google Scholar]
- Taylor, H.M.; Karlin, S. An Introduction to Stochastic Modeling, 3rd ed.; Academic Press: Waltham, MA, USA, 1994. [Google Scholar]
- Hauer, E.; Ng, J.C.N.; Lovell, J. Estimation of safety at signalized intersections. Transp. Res. Rec. 1988, 1185, 48–61. [Google Scholar]
- Poch, M.; Mannering, F.; Member, A. Negative binomial analysis of intersection-accident frequencies. J. Transp. Eng. 1996, 122, 105–113. [Google Scholar] [CrossRef]
- Hadayeghi, A.; Shalaby, A.S.; Persaud, B.N. Development of planning level transportation safety tools using geographically weighted poisson regression. Accid. Anal. Prev. 2010, 42, 676–688. [Google Scholar] [CrossRef] [PubMed]
- Evans, J.D. Straightforward Statistics for the Behavioral Sciences; Brooks/Cole Publishing Company: Pacific Groove, CA, USA, 1996. [Google Scholar]
- Verhaert, J.; Cappaert, S.; Van Proeyen, D. Antwerp Bicycle Policy Plan, 2015–2019; European Cyclists Federation: Brussels, Belgium, 2015. [Google Scholar]
- Police Department, Antwerp Region. Bicycle Accident Database; Police Department, Antwerp Region: Antwerp, Belgium, 2018. [Google Scholar]
- Carlos, H.A.; Shi, X.; Sargent, J.; Tanski, S.; Berke, E.M. Density estimation and adaptive bandwidths: A primer for public health practitioners. Int. J. Health Geogr. 2010, 9, 39. [Google Scholar] [CrossRef] [PubMed]
- Levine, N.; Kim, K.E.; Nitz, L.H. Spatial analysis of Honolulu motor vehicle crashes: I. Spatial patterns. Accid. Anal. Prev. 1995, 27, 663–674. [Google Scholar] [CrossRef]
- Kim, K.; Takeyama, D.; Nitz, L. Moped safety in Honolulu, Hawaii. J. Saf. Res. 1995, 26, 177–185. [Google Scholar] [CrossRef]
- Schneider, R.J.; Ryznar, R.M.; Khattak, A.J. An accident waiting to happen: A spatial approach to proactive pedestrian planning. Accid. Anal. Prev. 2004, 36, 193–211. [Google Scholar] [CrossRef]
- Anjana, S.; Anjaneyulu, M.V.L.R. Safety analysis of urban signalized intersections under mixed traffic. J. Saf. Res. 2015, 52, 9–14. [Google Scholar]
- Sando, T.; Mussa, R.; Sobanjo, J.; Spainhour, L. Advantages and disadvantages of different crash modeling techniques. J. Saf. Res. 2005, 36, 485–487. [Google Scholar] [CrossRef]
- Daniels, S.; Brijs, T.; Nuyts, E.; Wets, G. Injury crashes with bicyclists at roundabouts: Influence of some location characteristics and the design of cycle facilities. J. Saf. Res. 2009, 40, 141–148. [Google Scholar] [CrossRef] [PubMed]
- Mussone, L.; Bassani, M.; Masci, P. Analysis of factors affecting the severity of crashes in urban road intersections. Accid. Anal. Prev. 2017, 103, 112–122. [Google Scholar] [CrossRef] [PubMed]
- Blomberg, R.D.; Hale, A.; Preusser, D.F. Experimental evaluation of alternative conspicuity-enhancement techniques for pedestrians and bicyclists. J. Saf. Res. 1986, 17, 193–195. [Google Scholar] [CrossRef]
- Gamble, J.; Snizek, B.; Nielsen, T.S. From people to cycling indicators: Documenting and understanding the urban context of cyclists’ experiences in Quito, Ecuador. J. Transp. Geogr. 2017, 60, 167–177. [Google Scholar] [CrossRef]
- Abdel-Aty, M.; Chundi, S.S.; Lee, C. Geo-spatial and log-linear analysis of pedestrian and bicyclist crashes involving school-aged children. J. Saf. Res. 2007, 38, 571–579. [Google Scholar] [CrossRef] [PubMed]
- Apasnore, P.; Ismail, K.; Kassim, A. Bicycle-vehicle interactions at mid-sections of mixed traffic streets: Examining passing distance and bicycle comfort perception. Accid. Anal. Prev. 2017, 106, 141–148. [Google Scholar] [CrossRef] [PubMed]
- Alluri, P.; Gan, A.; Liu, K. Statewide implementation of safety analyst: The Florida experience AU. J. Transp. Saf. Secur. 2018, 10, 525–544. [Google Scholar] [CrossRef]
- Preusser, D.F.; Leaf, W.A.; DeBartolo, K.B.; Blomberg, R.D.; Levy, M.M. The effect of right-turn-on-red on pedestrian and bicyclist accidents. J. Saf. Res. 1982, 13, 45–55. [Google Scholar] [CrossRef] [Green Version]
- Pei, X.; Wong, S.C.; Sze, N.N. A joint-probability approach to crash prediction models. Accid. Anal. Prev. 2011, 43, 1160–1166. [Google Scholar] [CrossRef] [PubMed]
- Hunter, W.W.; Pein, W.E.; Stutts, J.C. Bicycle-motor vehicle crash types: The early 1990s. Transp. Res. Rec. 1997, 1502, 65–74. [Google Scholar]
- Räsänen, M.; Koivisto, I.; Summala, H. Car driver and bicyclist behavior at bicycle crossings under different priority regulations. J. Saf. Res. 1999, 30, 67–77. [Google Scholar] [CrossRef]
- Van Houten, R.; Seiderman, C. How pavement markings influence bicycle and motor vehicle positioning: Case study in Cambridge, Massachusetts. Transp. Res. Rec. 2005, 1939, 3–14. [Google Scholar] [CrossRef]
- Gårder, P.; Leden, L.; Thedéen, T. Safety implications of bicycle paths at signalized intersections. Accid. Anal. Prev. 1994, 26, 429–439. [Google Scholar] [CrossRef]
- National Association of City Transportation Officials (NACTO). Urban Bikeway Design Guide; National Association of City Transportation Officials: New York, NY, USA, 2014. [Google Scholar]
- Jiang, H.; Ma, Y.; Jiang, L.; Chen, G.; Wang, D. Evaluation of the dispersion effect in through movement bicycles at signalized intersection via cellular automata simulation. Phys. A Stat. Mech. Appl. 2018, 498, 138–147. [Google Scholar] [CrossRef]
- Spencer, P.; Watts, R.; Vivanco, L.; Flynn, B. The effect of environmental factors on bicycle commuters in Vermont: Influences of a northern climate. J. Transp. Geogr. 2013, 31, 11–17. [Google Scholar] [CrossRef]
- Wong, S.C.; Sze, N.N.; Li, Y.C. Contributory factors to traffic crashes at signalized intersections in Hong Kong. Accid. Anal. Prev. 2007, 39, 1107–1113. [Google Scholar] [CrossRef]
- Elvik, R. The non-linearity of risk and the promotion of environmentally sustainable transport. Accid. Anal. Prev. 2009, 41, 849–855. [Google Scholar] [CrossRef]
- Jacobsen, P. Safety in numbers: More walkers and bicyclists, safer walking and bicycling. Inj. Prev. 2003, 9, 205–209. [Google Scholar] [CrossRef]
- Dumbaugh, E.; Li, W. Designing for the safety of pedestrians, cyclists, and motorists in urban environments. J. Am. Plann. Assoc. 2010, 77, 69–88. [Google Scholar] [CrossRef]
- Nankervis, M. The effect of weather and climate on bicycle commuting. Transp. Res. Part A Policy Pract. 1999, 33, 417–431. [Google Scholar] [CrossRef]
- Thomas, T.; Jaarsma, R.; Tutert, B. Exploring temporal fluctuations of daily cycling demand on Dutch cycle paths: The influence of weather on cycling. Transportation 2013, 40, 1–22. [Google Scholar] [CrossRef]
- Eluru, N.; Bhat, C.R.; Hensher, D.A. A mixed generalized ordered response model for examining pedestrian and bicyclist injury severity level in traffic crashes. Accid. Anal. Prev. 2008, 40, 1033–1054. [Google Scholar] [CrossRef] [PubMed] [Green Version]
- Strauss, J.; Miranda-Moreno, L.F.; Morency, P. Cyclist activity and injury risk analysis at signalized intersections: A Bayesian modelling approach. Accid. Anal. Prev. 2013, 59, 9–17. [Google Scholar] [CrossRef] [PubMed]
- Wanvik, P.O. Effects of road lighting: An analysis based on Dutch accident statistics 1987–2006. Accid. Anal. Prev. 2009, 41, 123–128. [Google Scholar] [CrossRef] [PubMed]
- Chen, P.; Sun, F.; Wang, Z.; Gao, X.; Jiao, J.; Tao, Z. Built environment effects on bike crash frequency and risk in Beijing. J. Saf. Res. 2018, 64, 135–143. [Google Scholar] [CrossRef] [PubMed]
- Teschke, K.; Frendo, T.; Shen, H.; Harris, M.A.; Reynolds, C.C.; Cripton, P.A.; Brubacher, J.; Cusimano, M.D.; Friedman, S.M.; Hunte, G.; et al. Bicycling crash circumstances vary by route type: A cross-sectional analysis. BMC Public Health 2014, 14, 1205. [Google Scholar] [CrossRef] [PubMed]
- Wall, S.P.; Lee, D.C.; Frangos, S.G.; Sethi, M.; Heyer, J.H.; Ayoung-Chee, P.; DiMaggio, C.J. The effect of sharrows, painted bicycle lanes and physically protected paths on the severity of bicycle injuries caused by motor vehicles. Safety 2016, 2, 26. [Google Scholar] [CrossRef]
- Lusk, A.C.; Furth, P.G.; Morency, P.; Miranda-Moreno, L.F.; Willett, W.C.; Dennerlein, J.T. Risk of injury for bicycling on cycle tracks versus in the street. Inj. Prev. 2011, 17, 131. [Google Scholar] [CrossRef]
- AASHTO Executive Committee. Guide for the Development of Bicycle Facilities; American Association of State Highway Transportation Officials: Washington, DC, USA, 1999. [Google Scholar]
- Shackel, S.C.; Parkin, J. Influence of road markings, lane widths and driver behaviour on proximity and speed of vehicles overtaking cyclists. Accid. Anal. Prev. 2014, 73, 100–108. [Google Scholar] [CrossRef] [PubMed]
- Dozza, M.; Schindler, R.; Bianchi-Piccinini, G.; Karlsson, J. How do drivers overtake cyclists? Accid. Anal. Prev. 2016, 88, 29–36. [Google Scholar] [CrossRef] [PubMed] [Green Version]
- Mehta, K.; Mehran, B.; Hellinga, B. Evaluation of the passing behavior of motorized vehicles when overtaking bicycles on urban arterial roadways. Transp. Res. Rec. J. Transp. Res. Board 2015, 2520, 8–17. [Google Scholar] [CrossRef]
- ODOT. Risk Factors for Pedestrian and Bicycle Crashes; Oregon Department of Transportation: Washington, DC, USA, 2017; p. 99. [Google Scholar]
- AASHTO, American Association of State Highway Transportation Officials. LRFD Bridge Design Specifications, 4th ed.; American Association of State Highway Transportation Officials: Washington, DC, USA, 2007. [Google Scholar]
- FHWA. Federal Highway Administration University Course on Bicycle and Pedestrian Transportation; U.S. Department of Transportation: McLean, VA, USA, 2006.
- Andersen, T.; Bredal, F.; Weinreich, M.; Jensen, N.; Riisgaard-Dam, M.; Kofod Nielsen, M. Collection of Cycle Concepts 2012; Cycling Embassy of Denmark: København, Denmark, 2012. [Google Scholar]
- Strauss, J.; Miranda-Moreno, L.F.; Morency, P. Multimodal injury risk analysis of road users at signalized and non-signalized intersections. Accid. Anal. Prev. 2014, 71, 201–209. [Google Scholar] [CrossRef] [PubMed]
- Taylor, D.B. Analysis of traffic signal clearance interval requirements for bicycle-automobile mixed traffic. Transp. Res. Rec. 1993, 1405, 13–20. [Google Scholar]
- Raihan, M.A.; Alluri, P.; Wu, W.; Gan, A. Estimation of bicycle crash modification factors (CMFs) on urban facilities using zero inflated negative binomial models. Accid. Anal. Prev. 2019, 123, 303–313. [Google Scholar] [CrossRef] [PubMed]
- Summala, H.; Pasanen, E.; Räsänen, M.; Sievänen, J. Bicycle accidents and drivers’ visual search at left and right turns. Accid. Anal. Prev. 1996, 28, 147–153. [Google Scholar] [CrossRef]
- Thomas, B.; DeRobertis, M. The safety of urban cycle tracks: A review of the literature. Accid. Anal. Prev. 2013, 52, 219–227. [Google Scholar] [CrossRef]


| Contributing Factors | Mean | Std Dev | Minimum | Maximum |
|---|---|---|---|---|
| Dependent Variables | ||||
| Crash (4120 observations) | 3.66 | 16.94 | 1 | 45 |
| Arterial crash | 5.16 | 17.42 | 1 | 45 |
| Contributing Factors | ||||
| Log(average daily bicycle flows (ADB)) | 2.59 | 1.52 | 1.64 | 3.88 |
| Log(morning peak hour volume (M-PHV)) | 3.63 | 0.78 | 2.59 | 3.86 |
| Log(morning peak hour volume (M-PHV)) | 3.60 | 0.64 | 2.45 | 3.71 |
| Numbers of lanes (unidirectional) | 2.92 | 1.43 | 0 | 6 |
| Log(length of segments (LoS)) | 2.05 | 2.21 | 1.05 | 2.72 |
| Log(area of junctions (AoJ)) | 2.99 | 3.11 | 1.50 | 4.26 |
| Speed limit Xi3 (km/h) | 52.48 | 9.226 | 20 | 90 |
| The Category and Number (%) of BMV Crash Occurrences | ||||
|---|---|---|---|---|
| Category = 0–3 (See Table 1) | 0 | 1 | 2 | 3 |
| Historical crash severity (CSI) | 272 (19.2) | 1049 (74.1) | 87 (6.1) | 7 (0.5) |
| Daytime or night-time | 1099 (77.7) | 316 (22.3) | ||
| Intersection/Road section | 744 (52.6) | 671 (47.4) | ||
| Lighting systems | 906 (64.0) | 14 (1.0) | 199 (14.1) | 296 (20.9) |
| Residential area | 1264 (89.3) | 151 (10.7) | ||
| Intersect with a secondary road | 1294 (91.4) | 121 (8.6) | ||
| Central business district (CBD) | 1099 (77.7) | 316 (22.3) | ||
| Two-way bicycle paths | 1328 (93.9) | 87 (6.1) | ||
| Two-way turns into a one-way bicycle path | 1372 (97.0) | 43 (3.0) | ||
| Tram track | 1004 (70.0) | 411 (29.0) | ||
| Distance from the bus stop (m) | 601 (42.5) | 327 (23.1) | 275 (19.4) | 212 (15.0) |
| Bus routes | 670 (47.3) | 745 (52.7) | ||
| Main cycling routes | 975 (68.9) | 440 (31.1) | ||
| Lane marking | 830 (58.7) | 46 (31.5) | 139 (9.8) | |
| Signalised facilities | 1298 (91.7) | 117 (8.3) | ||
| Signal cycle lengths (s) | 549 (42.0) | 424 (30.0) | 397 (28.1) | |
| Manoeuvre of motorists | 710 (50.2) | 210 (14.8) | 945 (35.0) | |
© 2019 by the authors. Licensee MDPI, Basel, Switzerland. This article is an open access article distributed under the terms and conditions of the Creative Commons Attribution (CC BY) license (http://creativecommons.org/licenses/by/4.0/).
Share and Cite
Wang, H.; Chang, S.K.J.; De Backer, H.; Lauwers, D.; De Maeyer, P. Integrating Spatial and Temporal Approaches for Explaining Bicycle Crashes in High-Risk Areas in Antwerp (Belgium). Sustainability 2019, 11, 3746. https://doi.org/10.3390/su11133746
Wang H, Chang SKJ, De Backer H, Lauwers D, De Maeyer P. Integrating Spatial and Temporal Approaches for Explaining Bicycle Crashes in High-Risk Areas in Antwerp (Belgium). Sustainability. 2019; 11(13):3746. https://doi.org/10.3390/su11133746
Chicago/Turabian StyleWang, Hwachyi, S. K. Jason Chang, Hans De Backer, Dirk Lauwers, and Philippe De Maeyer. 2019. "Integrating Spatial and Temporal Approaches for Explaining Bicycle Crashes in High-Risk Areas in Antwerp (Belgium)" Sustainability 11, no. 13: 3746. https://doi.org/10.3390/su11133746
APA StyleWang, H., Chang, S. K. J., De Backer, H., Lauwers, D., & De Maeyer, P. (2019). Integrating Spatial and Temporal Approaches for Explaining Bicycle Crashes in High-Risk Areas in Antwerp (Belgium). Sustainability, 11(13), 3746. https://doi.org/10.3390/su11133746