Article

The Benefits of Randomly Delayed Charging of Electric Vehicles

1
Institute of Systems Sciences, Innovation and Sustainability Research, University of Graz, Graz 8010, Austria
2
Information Technologies & Business Informatics, CAMPUS 02 University of Applied Sciences, Graz 8010, Austria
*
Author to whom correspondence should be addressed.
Sustainability 2019, 11(13), 3722; https://doi.org/10.3390/su11133722
Submission received: 14 June 2019 / Revised: 5 July 2019 / Accepted: 5 July 2019 / Published: 8 July 2019
(This article belongs to the Section Energy Sustainability)

Abstract

:
The increasing use of electric vehicles, combined with the trend of higher charging currents, puts a significant strain on the electrical grid. Many solutions to this problem are being discussed, some relying on some form of smart grid, others proposing stricter regulations concerning charging electric vehicles. In this study, a different approach, called randomly delayed charging, is explored. The main idea is to charge a battery over night, but instead of starting the charging process as soon as possible, introduce a random delay, satisfying the boundary condition that the battery is sufficiently charged in the morning. Benefits of this technique are investigated by using an agent-based simulation that simulates commuters and calculates the electricity demand with temporal resolution. Results suggest that randomly delayed charging can have a significant effect on peak load caused by charging and that this benefit increases the higher the used charging current is. Randomly delayed charging can be a viable option for reducing the peak electricity demand that is caused by charging electric vehicles.

1. Introduction

The transportation sector is responsible for a significant fraction of global energy use. In the US, nearly 30% of all used energy is used for transportation [1]. This has a huge impact on the environment and global warming, since over 90% of the energy required for transportation comes from fossil sources [1]. A possible way of reducing greenhouse gas (GHG) emissions is to transition from vehicles with internal combustion engines to electric vehicles. If the electricity used to charge these vehicles comes from non-fossil sources, both plug-in electric vehicles (EVs) and plug-in hybrid vehicles (PHEVs) have the potential to reduce GHG emissions and thus combat climate change.
Both EVs and PHEVs have become increasingly common in recent years and this trend is believed to continue in the near future [2,3,4,5]. The reasons behind this development are many: Ecological concerns become more relevant for society as well as for individuals [6,7,8]. Additionally, many governments subsidize EVs [9,10,11] or try to offer incentives and build infrastructure to support their dispersion [12,13]. Although some barriers still exist [14,15], such as the limited range of EVs compared to conventional vehicles or their low energy transfer rate during charging, it is believed that these issues can be overcome by technological progress in the near future [16], making EVs even more popular than they are today.
A widespread use of EVs would have many effects on society, individuals, and the environment. Although the exact environmental benefits that EVs offer are the subject of current research and scientific discussion [17,18] and difficult to quantify, since they depend on many factors, such as how the used energy is produced and what type of battery is used, there is a common understanding that EVs have the potential to have a positive impact on the environment.
Apart from the positive effects of a widespread use of EVs, there are also negative effects [17] and challenges [19]. One obvious problem is the increasing demand for electric energy [20], and, more importantly, the peak in power demand that arises when many people want to charge their car simultaneously, using currents that are otherwise unusual for households. This has a significant impact on regional power generation [21], the distribution grid [22] and the distribution network [23,24] today, and this impact is believed to increase in the future. Therefore, many different solutions to this problem are discussed. One suggestion is to coordinate the charging process to avoid such peaks [25,26] or using sophisticated control techniques [27,28]. A similar approach, which would have many other advantages for the grid, is using a smart grid [29,30,31] to achieve optimal scheduling [32]. Although the idea of a smart grid is promising, it faces various obstacles concerning privacy and security [33].
In this work, we propose a different solution to the problem of peak power demand originating from EV charging, called randomly delayed (RD) charging. The basic principle is to give each user the option to start the charging process not right away, i.e., as soon as the vehicle is plugged in, but after a certain delay. The delay is chosen randomly within an acceptable range, to smooth out the resulting demand on an aggregated level. In this study, we investigate the benefits of this approach in various scenarios, using an agent-based computer model.

Randomly Delayed Charging

RD charging can be used to reduce the peak power demand originating from charging EVs. It does not require any form of communication with the power grid or other charging stations, nor any modification on the vehicles that use it. RD charging relies on the stochastic effect, where power demand is automatically smoothed out, if the starting times are randomly distributed. In the following, we differentiate between simple RD charging and smart RD charging. Both version guarantee that the charging process is finished by a certain time, so that the user has no disadvantage compared to conventional charging. While simple RD charging estimates a viable starting time from the used charging system and average daily consumption, smart RD charging calculates the exact time the charging process would take and finds a suitable starting time accordingly.
Charging EVs [34] is a complicated process, influenced by the used battery [35] and the charging mode [34]. One commonly differentiates between level 1, level 2 and level 3 charging [36,37,38]. Level 1 charging uses 1.92 kW, level 2 ranges from 2.5 to 19.2 kW and level 3 charging uses 11.6 to 96 kW. The International Electrotechnical Commission [39] defines four modes of charging:
  • Mode 1: slow charging from a regular electrical socket
  • Mode 2: slow charging from a regular socket with a specific protection arrangement
  • Mode 3: slow or fast charging using a specific EV multi-pin socket with control and protection functions
  • Mode 4: fast charging using some special charger technology
In principle, RD charging can be used for every level and mode. For slow charging however (e.g., charging with 1.92 kW) the benefits are negligible, since in that case an average charging process can only be finished if it starts as soon as the EV is plugged in. Calculating the benefit for other charging levels is challenging, since it depends on many factors, such as the range of the daily commute and the time at which the EV arrives at the charging station. To quantify the benefits of RD charging it is paramount to include specifics about the car owners and their behavior. Thus, we employ an agent-based computer model, detailed in the following section.

2. Methods

Agent-based models [40] are based on the idea to simulate a system not from the top down, i.e., starting from the macro perspective, but rather from the bottom up, starting from the individual components (agents) that constitute the system. In many cases, the rules and equations for the dynamic of individual agents are easier to define and the macroscopic behavior of the system then emerges from the micro scale. Agent-based models are successfully applied in many scientific fields, such as human systems [41,42,43,44], competition and cooperation research [45], social simulations [46], ecology [47] and economics [48,49,50]. Since the problem at hand also consists of many agents (individuals, who want to charge their EV), agent-based modeling is a promising approach.
The aim of the model is to assess the benefits for the electrical grid, specifically the reduction of peak power demand, resulting from applying RD charging in various scenarios. A schematic of the model is depicted in Figure 1. The model is implemented in Python 3.7 and uses special classes to describe agents, giving them features, such as their daily commuting distance and the ability to commute and charge their car.
Naturally, the quantitative benefits of RD charging are very sensitive to the specifics of the investigated system, so it is of great importance to accurately define the scope of the model. We investigate a system consisting of 10,000 individuals, who use their BEV for their daily commute of up to 56 km (35 miles) in one direction and charge it over night. This maximal range of 35 miles per trip is chosen, so that most common commuting distances are covered [51]. Commutes longer than 35 miles are excluded, since they are not perfectly well suited for all EVs, because of range restrictions. To simplify the system, we make the following assumption: Each individual starts their commute at 5 p.m. and wants their car to be recharged at 6 a.m. the following day. This simplification is not done to maximize realism (a smoother distribution would be more realistic), but to investigate the possible peaks in power demand in greater detail.
Within this scope, power demand is calculated as follows. First a population of agents is randomly generated. Their main property is their commuting distance, extracted from [51], giving each agent a certain probability to have a commuting distance in a certain range, shown in Table 1. Commuting distances within each bracket are distributed uniformly.
Based on these commuting distances d c , commuting times t c are calculated according to Equation (1) for trips below 5 km and (2) for trips above 5 km.
t c = d c v 1 ρ 1
t c = 5 v 1 ρ 1 + ( d c 5 ) v 2 ρ 2 ,
with the distance d c , the average urban speed v 1 , the average highway speed v 2 and Gaussian distributed random numbers ρ with mean 1 and standard deviation 0.2. That way, the assumed average speed of the commute increases with its length, representing that a larger portion of it is performed on a road that allows higher speeds.
The energy consumption of each EV is randomly distributed within a realistic margin for currently available models, ranging from 10 kWh/100 km to 23 kWh/100 km. We do not investigate energy consumption with temporal resolution, since we are only interested in the amount of consumed energy after the commute. Therefore, it is sufficient to store the energy consumption per 100 km as an agent property for each agent.
After the agent generation process, the simulation starts at 5 p.m., when the home commute starts. Depending on their commuting distance and additional random fluctuations, see Equations (1) and (2), agents then arrive at their charging station. Each agent has its own charging station, so there is no delay, waiting time, or additional distance to cover.
Next an ordinary charging process, as well as a simple RD and a smart RD charging process are simulated. The charging model uses realistic demand profiles [52,53,54], meaning that especially for fast charging, the charging current needs to be reduced for batteries above a certain state of charge (SOC) threshold. The model also includes effects such as power loss [55] and current-depending efficiency. More local effects, such as temperature dependency, are neglected, since we are interested in aggregated results, where such effects would nearly average out. In every time step (here we use a discretization of minutes) the overall power demand D is calculated via
D ( t ) = i = 1 N d i s i ( t ) ,
with i running over all EVs and the individual power demand d i , which depends on the time-dependent SOC s i . However, due to various losses, the energy transferred to the battery c i is different from the energy taken from the grid, but is calculated via
c i ( t ) = d i s i ( t ) f ( s i ) ,
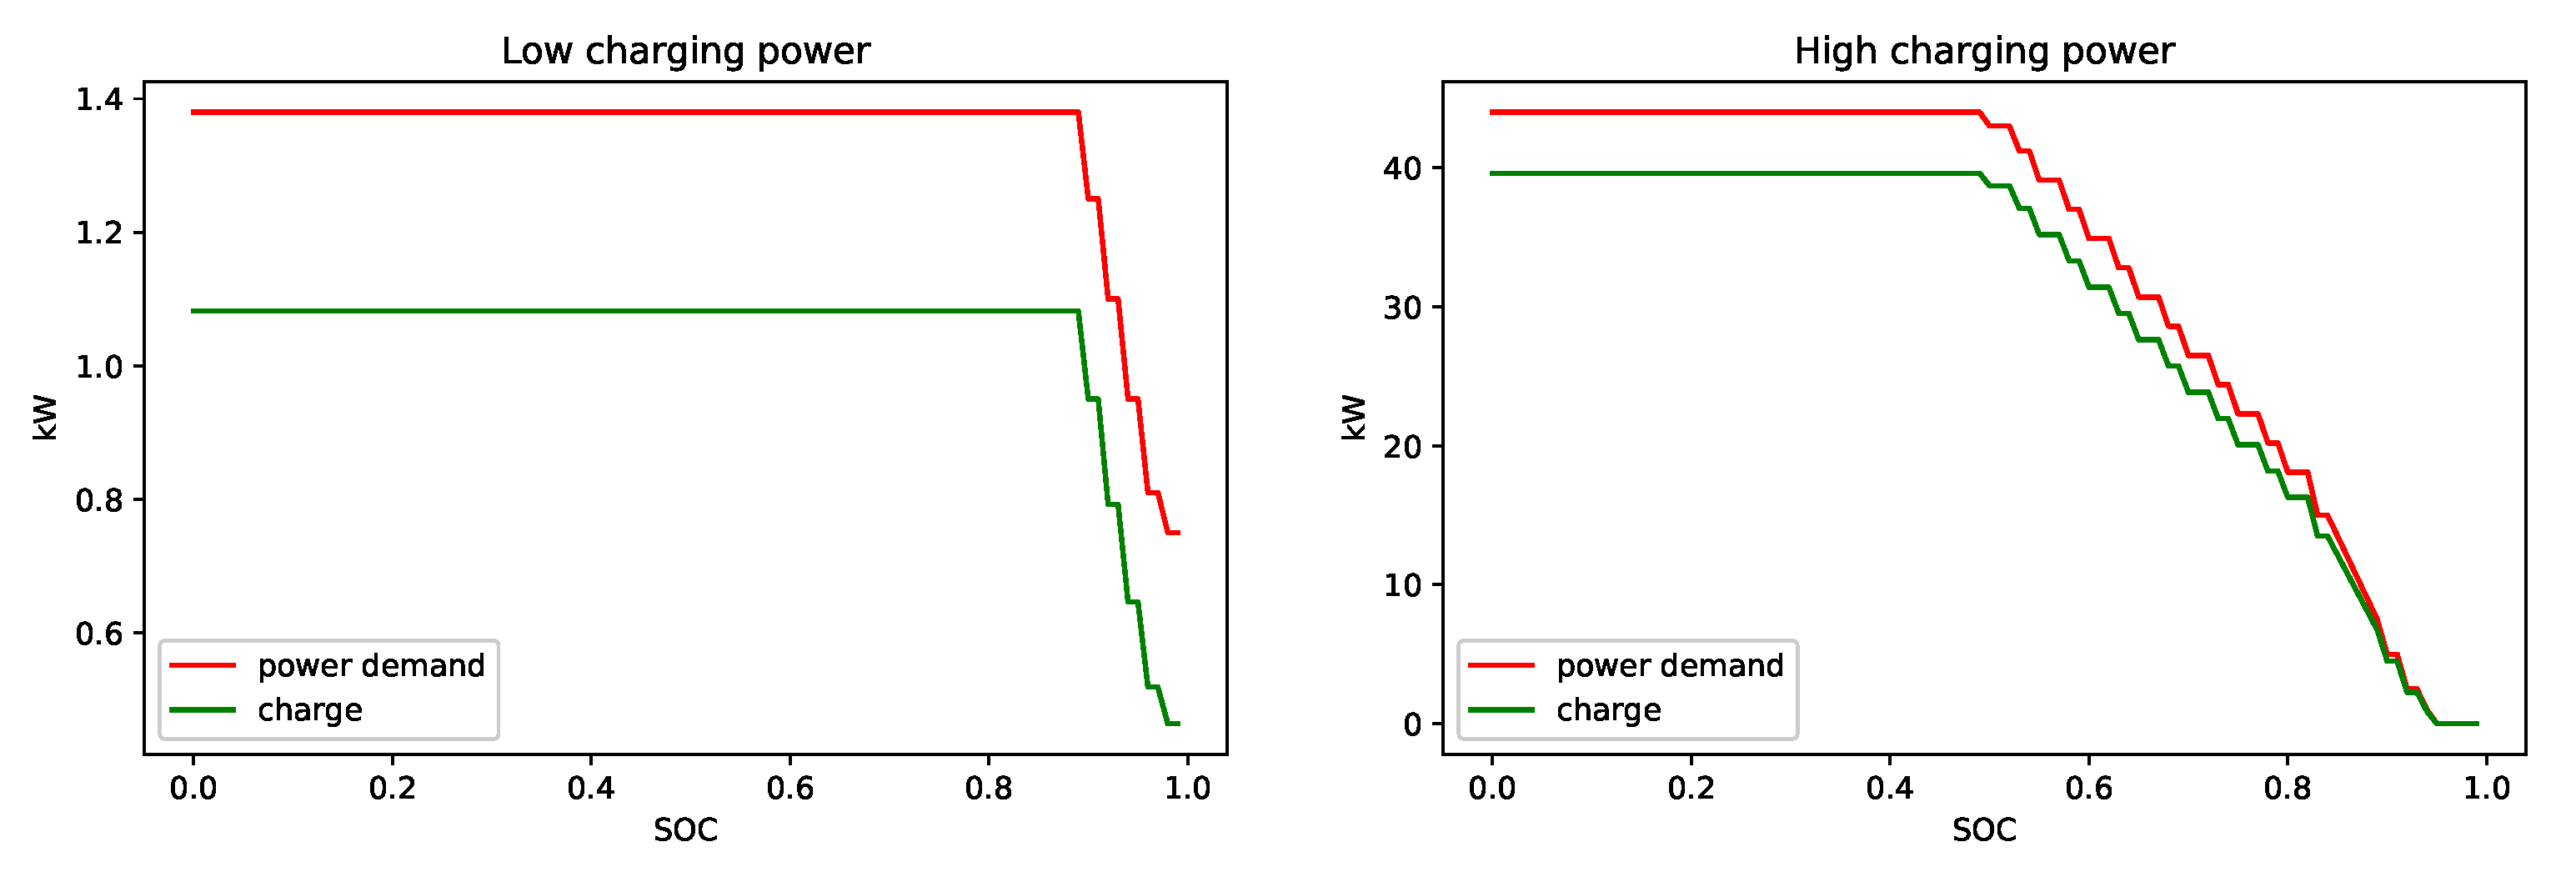
with a SOC-dependent factor f. Figure 2 shows the used demand profiles for low and high charging power.
For ordinary charging, the charging process starts right away, as soon as the EV enters the charging station. For simple RD charging, there is a randomized delay, after which the charging process starts normally. The maximal length of this delay is dependent on the energy transfer rate of the system. The chosen values of 5 h for 3.3 kW, 8 h for 6.6 kW and 10 h for 44 kW ensure that each charging process is finished at 6 a.m. For smart RD charging, these maximal delay times d m a x are calculated from the estimated charging time, as
d m a x = T f T a T c ,
with T f , the time at which the charging process should be finished, T a , the time the EV arrives at the charging station and T c , the approximate charging time. Since the results of this simulation are very sensitive to the energy transfer rate and it is currently not clear, which charging technology will be used most commonly in the future, we investigate the benefits of RD charging for the most relevant scenarios: a maximal charging power of 3.3 kW (for example used by the Toyota Prius Plug-In, the Ford C-Max Energi, or the Mitsubishi i-MiEV), a maximal charging power of 6.6 kW (for example used by the Fiat 500e, the Ford Focus Electric or the Kia Soul EV) and a maximal charging power of 44 kW (currently only possible with the Tesla Model X and the Tesla Model S). Results of these simulations are presented in the following section.

3. Results

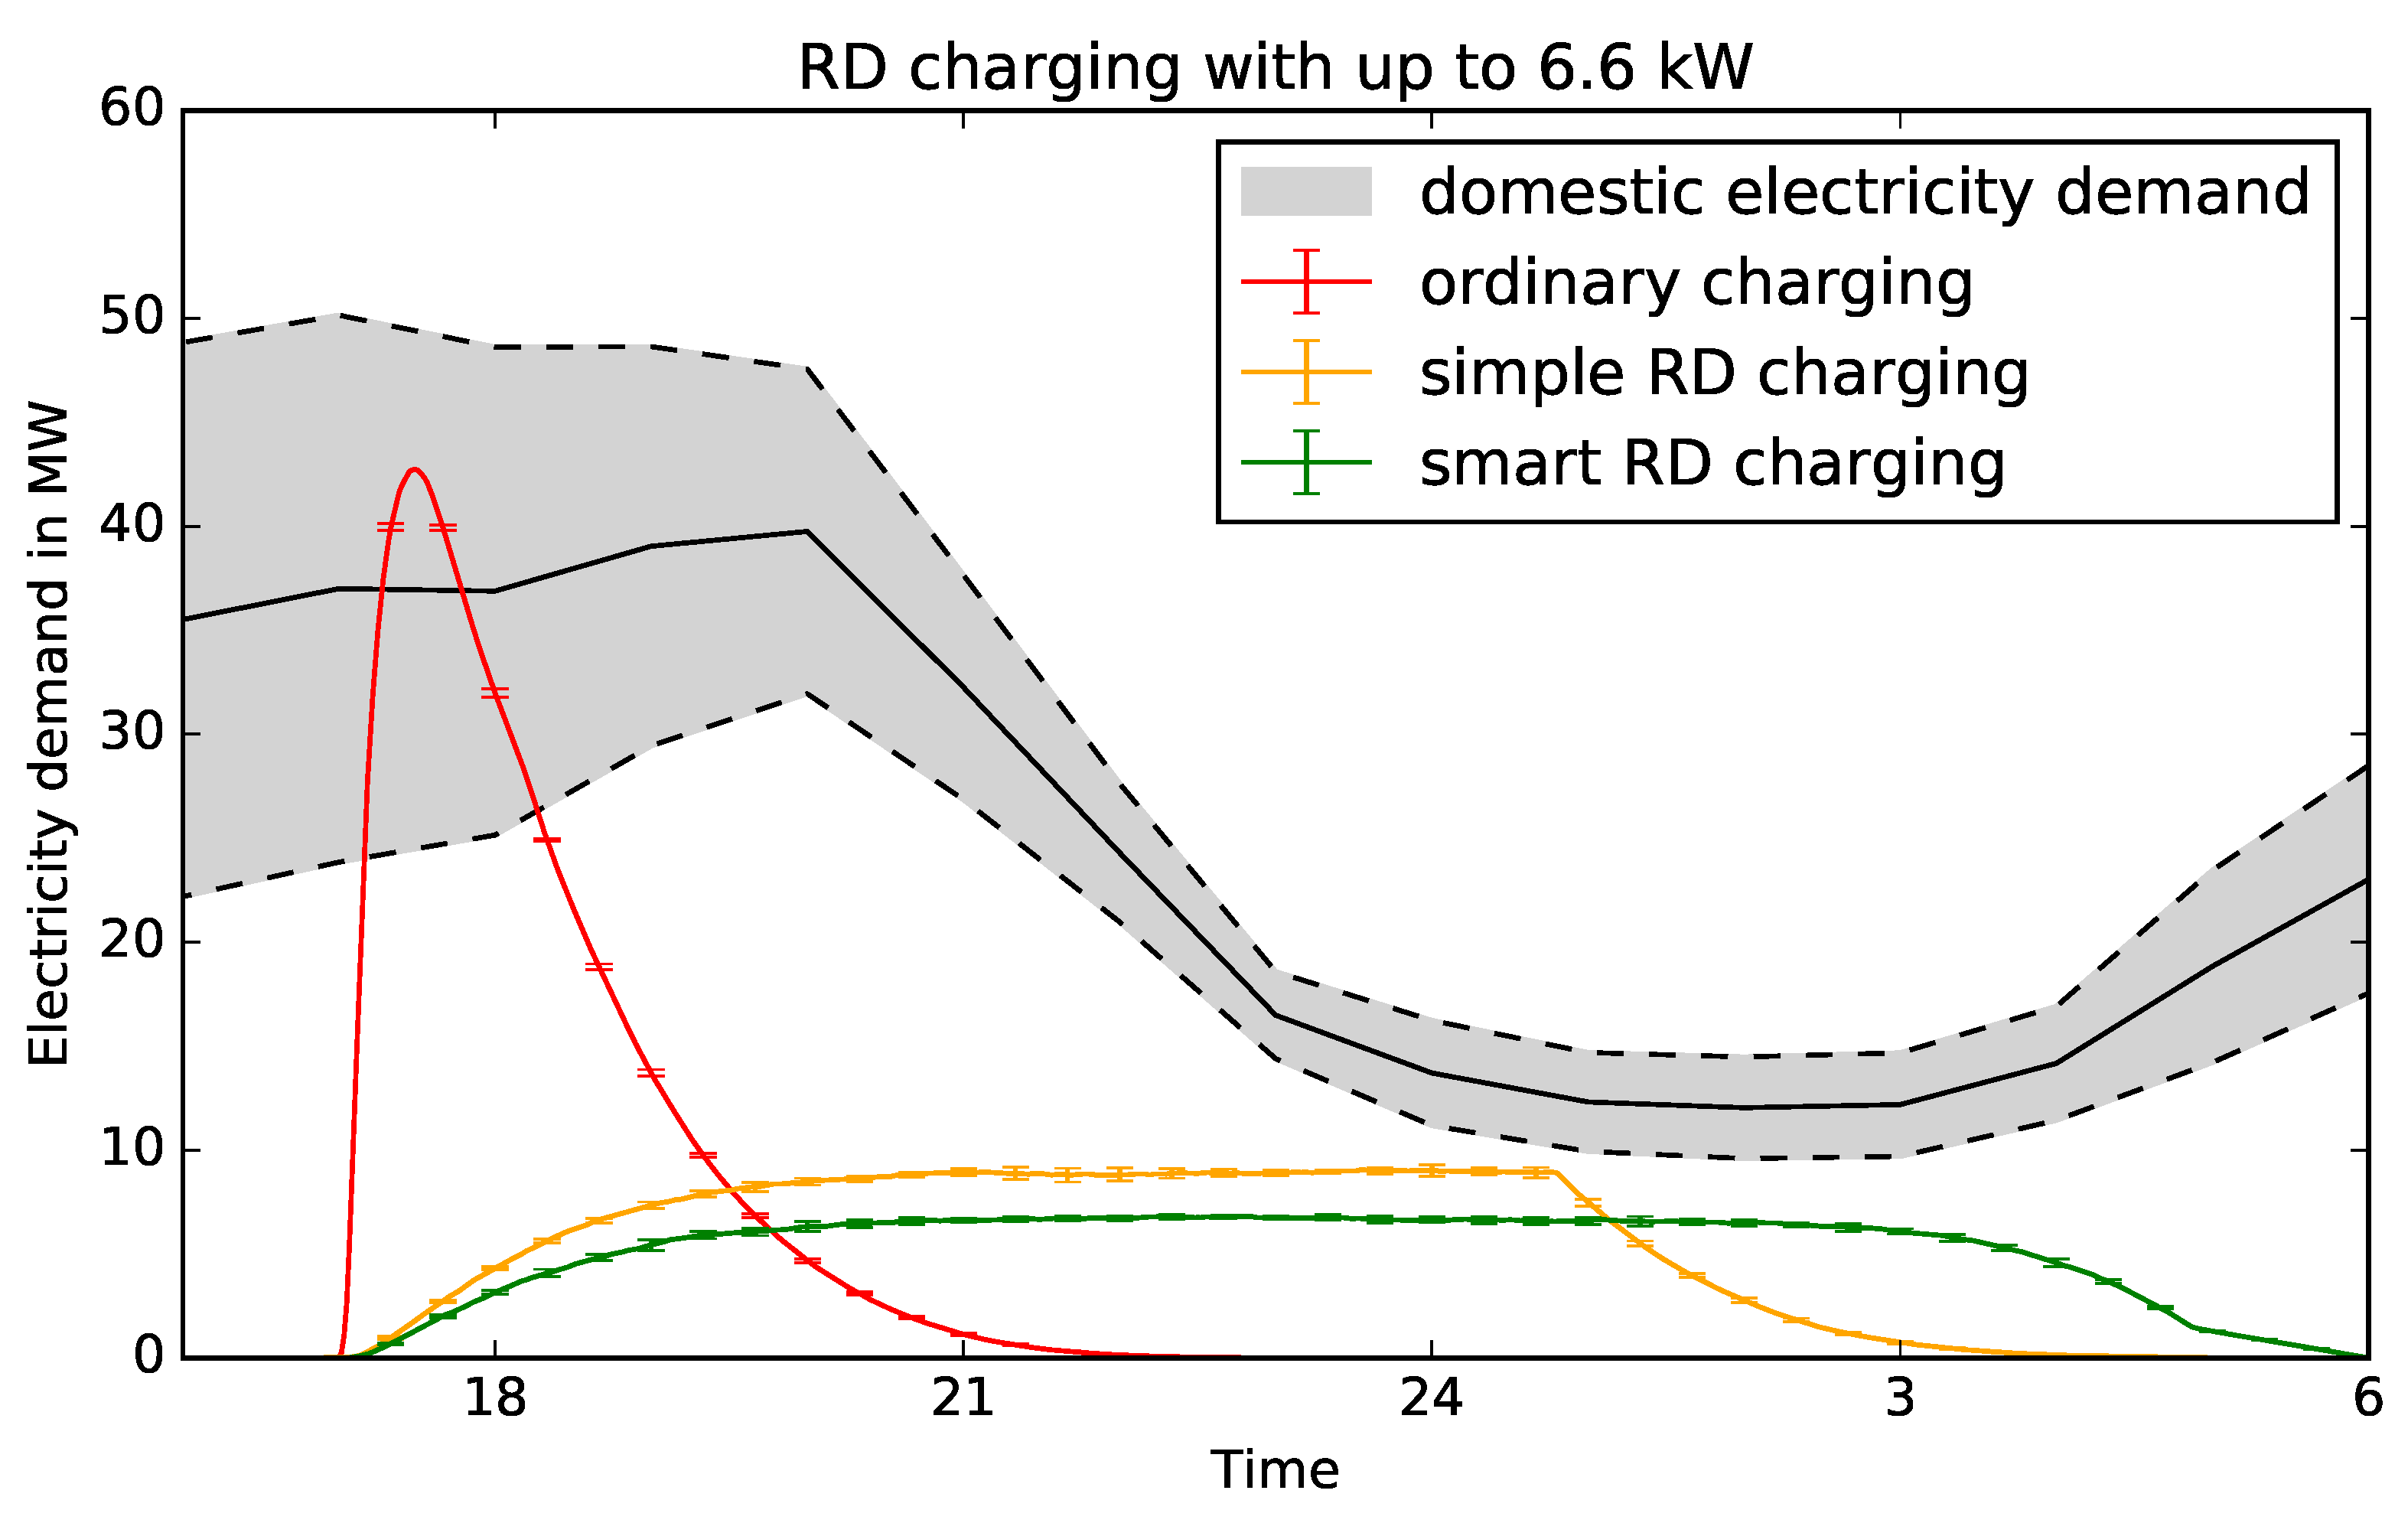
Results for various charging powers are shown in the following figures. We plot the electricity demand generated by charging 10,000 electric cars that were used for commuting. Shown are ordinary charging (red), simple RD charging (yellow) and smart RD charging (green). The gray area represents the usual domestic electricity demand of 10,000 households for comparison. The solid line shows the average electricity demand, while the shaded area represents standard deviation. Domestic electricity consumption data was extracted from [56], which gives insight into the average electricity consumption of households at different times of the day.
Figure 3 shows the results for charging with 3.3 kW. We compare ordinary charging (red), simple RD charging (yellow) and smart RD charging (green). Ordinary charging has the highest peak power demand with 27.75 MW at roughly 6 p.m., a time where domestic power demand is usually quite high, leading to a significant strain on the electric grid. For simple RD charging, the demand curve is smoother, peaking at 13.2 MW at roughly 10 p.m. The best result is obtained for smart RD charging, with a peak value of 7.7 MW at midnight. The error bars denote the converged standard deviation after several simulation runs. Note that the overall power demand (area below each curve) is constant for all three charging techniques, since the amount of required energy is the same for all.
The results for charging with 6.6 kW are presented in Figure 4. Again, ordinary charging leads to the highest peak power demand, yet the higher charging power results in an even higher peak value of 45.57 MW at 6 p.m. This value is more than 60% higher than for charging with 3.3 kW. However, for both simple and smart RD charging, the peak power demand decreases with the charging power. Simple RD charging leads to a maximal power demand of 7.65 MW, while the maximal power demand for smart RD charging is 6.45 MW. Here, a significant difference between simple and smart RD charging is that simple RD charging has a decreased power demand between 3 a.m. and 6 a.m., which may be beneficial for the electric grid in certain situations.
For very high charging power (44 kW), peaks resulting from ordinary charging are even higher, as shown in Figure 5. Power demand reaches 88.32 MW, more than three times the demand resulting from ordinary charging with 3.3 kW. For RD charging, however, the peak power demand decreases further. The difference between simple and smart RD charging diminishes; they peak at 6.3 MW and 5.82 MW, respectively.

4. Discussion

The presented agent-based simulation suggests that both simple and smart RD charging can have significant positive effects for the electric grid, since peak power demand is reduced, without any negative impact or delays for the individuals charging their EVs. For ordinary charging, the peak power demand is increased for increased charging power. For RD charging, this effect is reversed, and higher charging currents lead to lower peak demands, making this charging technique future-proof.
In addition to lowering the peak power demand, it is also shifted to later times. While ordinary charging leads to a demand peak at times where the domestic demand is already high [57], RD charging translates this peak to a time, where there is less demand. This shift is stronger, the higher the charging power is and for very high charging power (≥44 kW) the power demand is smoothed out to an extent at which no significant peak can be observed.
The difference between simple and smart RD charging is only significant for low charging power. There, smart charging is better suited to produce a smoother power demand. For higher charging power, the main difference between simple and smart RD charging is the power demand between 3 a.m. and 6 a.m., which is decreased for simple RD charging. Depending on regional power demand at these times, this effect may be an advantage or a disadvantage.
The technical implementation of RD charging is straightforward. For simple RD charging a switch and a random number generator (or another random process) controlling it would be sufficient. Smart RD charging could be implemented in the same way, with the additionally required input of the missing charge of the battery. This input could be done automatically, or the user could simply specify how much they want to charge overnight. In any case, currently used domestic charging stations can easily be adapted to use RD charging.
Although the presented model is detailed and realistic enough to investigate the potential benefits of RD charging, there are some assumptions and simplifications that need to be addressed. First, the scope is very specific. It is chosen so that RD charging can be explored in a standardized way, not necessarily to depict reality. In each simulation run, 10,000 BEVs that are used for commuting and charged overnight are simulated; all other EVs (those not used for commuting, those not charged every night, …) are ignored. Nevertheless, the obtained results can be used to approximate the potential benefits of RD charging, since other EVs do not influence RD charging directly, as opposed to solutions relying on a smart grid. The presented scenarios assume that all cars are using the same charging current. In reality the distribution of charging currents is more diverse, but results for a realistic distribution of charging power can be obtained by linear combination of the presented results (e.g., results for a scenario, in which 5000 EVs use 3.3 kW and 5000 EVs use 6.6 kW can be obtained by adding half the power demand presented in Figure 3 to half the power demand presented in Figure 4). Of course, the peak power demand simulated using this model is also sensitive to commuting distances. Here we use average US commuting behavior, but also within the US, regional differences in commuting behavior could lead to different results. In areas outside the US with potentially fundamentally different commuting lengths, the benefits of RD charging could be more or less pronounced.
However, the benefits for the grid might not be sufficient to drive the diffusion of RD charging, since this decision is largely in the hands of the consumers. The direct benefits for them, however, are relatively small. Their electricity demand is shifted towards nighttime, where electric energy tends to be cheaper, but other than that they have no significant advantage from RD charging. The electricity providers on the other hand profit greatly from a smoothed-out demand curve, since spikes require large investments in the power grid infrastructure. Therefore, it is important that the providers relay part of this benefit to the users of RD charging. Many electricity providers request an additional fee for owners of EVs to cover the resulting infrastructure cost. For people who use RD charging this fee could be waived, to give a monetary incentive to EV owners to use RD charging.
An important question concerning this study is the relation of power demand and power system load. Of course, from a macroscopic perspective, those two are linearly dependent, since an increase in power demand also leads to an increase in power system load. Therefore, the power demand is a well suited indicator for power system load and is chosen as the observable in this study. However, things might be more complicated on a microscopic level. Especially at the end of a power grid it is possible for single consumers to potentially overload the system. The presented model could be expanded to a spatial model to include such effects. However, for this also details about the power system would be required and the model would not be generic anymore, but needs to be calibrated to a certain region or power grid, drastically limiting its scope.

5. Conclusions

In conclusion, this study shows the potential of RD charging to reduce the strain on the electrical grid caused by charging EVs. A significant advantage is that this method scales very well with the used charging power: The higher the power the smoother the power demand curve over the course of the day. Since we expect higher and higher charging power in the future to speed up the charging process, this scaling behavior makes RD charging future-proof. For charging with 6.6 kW, the peak in power demand can be reduced from more than 45 MW to below 8 MW for both simple and smart RD charging. An additional benefit is that this form of charging does not rely on any form of communication between the charging stations, the vehicles, or the suppliers of electricity, circumventing many problems that arise for smart grid solutions.
A big downside of RD charging is the lack of direct benefit for the user of the EV: The decision how to charge an EV lies with the user after all, while the benefit of RD charging is mainly relevant for the supplier of electricity. Therefore, it is important to find ways of transferring parts of this benefit to the user. However, with the right incentives, RD charging has the potential to solve several problems that arise from the ongoing diffusion of EVs in a system, where the existing infrastructure was not designed to deal with this challenge.
The next step in the implementation of this technique would be a more detailed analysis of its effect on the electric grid and on consumers as well as an evaluation of how well RD charging would be accepted by consumers and suppliers. In any case, the problems for the electric grid caused by charging EVs will become more important in the near future, mainly due to increased charging currents and a more widespread use of EVs, and RD charging offers a viable solution that needs to be investigated further.

Author Contributions

Conceptualization, G.J., C.H., M.F.; methodology, G.J. ; software, G.J., C.H.; validation, G.J.; formal analysis, G.J.; investigation, G.J.; data curation, G.J. C.H.; writing–original draft preparation, G.J.; writing–review and editing, G.J., C.H., M.F.; visualization, G.J.; supervision, M.F.

Funding

The authors would like to thank the University of Graz for covering the publication fees. This research received no external funding.

Acknowledgments

The authors would like to acknowledge Open Access Funding by the University of Graz.

Conflicts of Interest

The authors declare no conflict of interest.

Abbreviations

The following abbreviations are used in this manuscript:
BEVbattery electric vehicle
EVelectric vehicle
GHGgreenhouse gases
kmkilometers
kWkilo Watt
MWmega Watt
PHEVplug-in hybrid vehicle
RDrandomly delayed
SOCstate of charge

References

  1. U.S. Energy Information Administration. Energy Information Administration Monthly Energy Review; EIA: Washington DC, USA, 2019.
  2. Wirasingha, S.G.; Schofield, N.; Emadi, A. Plug-in hybrid electric vehicle developments in the US: Trends, barriers, and economic feasibility. In Proceedings of the 2008 IEEE Vehicle Power and Propulsion Conference, Harbin, China, 3–5 September 2008; pp. 1–8. [Google Scholar]
  3. Zhang, W.L.; Wu, B.; Li, W.F.; Lai, X.K. Discussion on development trend of battery electric vehicles in China and its energy supply mode. Power Syst. Technol. 2009, 4, 003. [Google Scholar]
  4. Al-Alawi, B.M.; Bradley, T.H. Review of hybrid, plug-in hybrid, and electric vehicle market modeling studies. Renew. Sustain. Energy Rev. 2013, 21, 190–203. [Google Scholar] [CrossRef]
  5. Jayakumar, A.; Chalmers, A.; Lie, T.T. Review of prospects for adoption of fuel cell electric vehicles in New Zealand. IET Electr. Syst. Transp. 2017, 7, 259–266. [Google Scholar] [CrossRef]
  6. Fransson, N.; Gärling, T. Environmental concern: Conceptual definitions, measurement methods, and research findings. J. Environ. Psychol. 1999, 19, 369–382. [Google Scholar] [CrossRef]
  7. Roberts, J.A.; Bacon, D.R. Exploring the subtle relationships between environmental concern and ecologically conscious consumer behavior. J. Bus. Res. 1997, 40, 79–89. [Google Scholar] [CrossRef]
  8. Stern, P.C.; Dietz, T. The value basis of environmental concern. J. Soc. Issues 1994, 50, 65–84. [Google Scholar] [CrossRef]
  9. Helveston, J.P.; Liu, Y.; Feit, E.M.; Fuchs, E.; Klampfl, E.; Michalek, J.J. Will subsidies drive electric vehicle adoption? Measuring consumer preferences in the US and China. Transp. Res. Part A Policy Pract. 2015, 73, 96–112. [Google Scholar] [CrossRef]
  10. Sierzchula, W.; Bakker, S.; Maat, K.; van Wee, B. The influence of financial incentives and other socio-economic factors on electric vehicle adoption. Energy Policy 2014, 68, 183–194. [Google Scholar] [CrossRef]
  11. van Rijnsoever, F.J.; Welle, L.; Bakker, S. Credibility and legitimacy in policy-driven innovation networks: Resource dependencies and expectations in Dutch electric vehicle subsidies. J. Technol. Transf. 2014, 39, 635–661. [Google Scholar] [CrossRef]
  12. Gallagher, K.S.; Muehlegger, E. Giving green to get green? Incentives and consumer adoption of hybrid vehicle technology. J. Environ. Econ. Manag. 2011, 61, 1–15. [Google Scholar] [CrossRef]
  13. Zhou, Y.; Wang, M.; Hao, H.; Johnson, L.; Wang, H. Plug-in electric vehicle market penetration and incentives: A global review. Mitig. Adapt. Strateg. Glob. Chang. 2015, 20, 777–795. [Google Scholar] [CrossRef]
  14. Egbue, O.; Long, S. Barriers to widespread adoption of electric vehicles: An analysis of consumer attitudes and perceptions. Energy Policy 2012, 48, 717–729. [Google Scholar] [CrossRef]
  15. Sovacool, B.K.; Hirsh, R.F. Beyond batteries: An examination of the benefits and barriers to plug-in hybrid electric vehicles (PHEVs) and a vehicle-to-grid (V2G) transition. Energy Policy 2009, 37, 1095–1103. [Google Scholar] [CrossRef]
  16. Rajashekara, K. Present status and future trends in electric vehicle propulsion technologies. IEEE J. Emerg. Sel. Top. Power Electron. 2013, 1, 3–10. [Google Scholar] [CrossRef]
  17. Hawkins, T.R.; Singh, B.; Majeau-Bettez, G.; Strømman, A.H. Comparative environmental life cycle assessment of conventional and electric vehicles. J. Ind. Ecol. 2013, 17, 53–64. [Google Scholar] [CrossRef]
  18. Shiau, C.S.N.; Samaras, C.; Hauffe, R.; Michalek, J.J. Impact of battery weight and charging patterns on the economic and environmental benefits of plug-in hybrid vehicles. Energy Policy 2009, 37, 2653–2663. [Google Scholar] [CrossRef]
  19. Srivastava, A.K.; Annabathina, B.; Kamalasadan, S. The challenges and policy options for integrating plug-in hybrid electric vehicle into the electric grid. Electr. J. 2010, 23, 83–91. [Google Scholar] [CrossRef]
  20. Richardson, D.B. Electric vehicles and the electric grid: A review of modeling approaches, Impacts, and renewable energy integration. Renew. Sustain. Energy Rev. 2013, 19, 247–254. [Google Scholar] [CrossRef]
  21. Hadley, S.W.; Tsvetkova, A.A. Potential impacts of plug-in hybrid electric vehicles on regional power generation. Electr. J. 2009, 22, 56–68. [Google Scholar] [CrossRef]
  22. Clement-Nyns, K.; Haesen, E.; Driesen, J. The impact of charging plug-in hybrid electric vehicles on a residential distribution grid. IEEE Trans. Power Syst. 2010, 25, 371–380. [Google Scholar] [CrossRef]
  23. Fernandez, L.P.; San Román, T.G.; Cossent, R.; Domingo, C.M.; Frias, P. Assessment of the impact of plug-in electric vehicles on distribution networks. IEEE Trans. Power Syst. 2011, 26, 206–213. [Google Scholar] [CrossRef]
  24. Putrus, G.; Suwanapingkarl, P.; Johnston, D.; Bentley, E.; Narayana, M. Impact of electric vehicles on power distribution networks. In Proceedings of the 2009 IEEE Vehicle Power and Propulsion Conference, Dearborn, MI, USA, 7–11 September 2009; pp. 827–831. [Google Scholar]
  25. Sortomme, E.; Hindi, M.M.; MacPherson, S.J.; Venkata, S. Coordinated charging of plug-in hybrid electric vehicles to minimize distribution system losses. IEEE Trans. Smart Grid 2011, 2, 198–205. [Google Scholar] [CrossRef]
  26. Deilami, S.; Masoum, A.S.; Moses, P.S.; Masoum, M.A. Real-time coordination of plug-in electric vehicle charging in smart grids to minimize power losses and improve voltage profile. IEEE Trans. Smart Grid 2011, 2, 456–467. [Google Scholar] [CrossRef]
  27. Salmasi, F.R. Control strategies for hybrid electric vehicles: Evolution, classification, comparison, and future trends. IEEE Trans. Veh. Technol. 2007, 56, 2393–2404. [Google Scholar] [CrossRef]
  28. Lin, C.C.; Peng, H.; Grizzle, J. A stochastic control strategy for hybrid electric vehicles. In Proceedings of the IEEE American Control Conference, Boston, MA, USA, 30 June–2 July 2004; Volume 5, pp. 4710–4715. [Google Scholar]
  29. Farhangi, H. The path of the smart grid. IEEE Power Energy Mag. 2010, 8, 18–28. [Google Scholar] [CrossRef]
  30. Amin, S.M.; Wollenberg, B.F. Toward a smart grid: Power delivery for the 21st century. IEEE Power Energy Mag. 2005, 3, 34–41. [Google Scholar] [CrossRef]
  31. Gungor, V.C.; Sahin, D.; Kocak, T.; Ergut, S.; Buccella, C.; Cecati, C.; Hancke, G.P. Smart grid technologies: Communication technologies and standards. IEEE Trans. Ind. Inform. 2011, 7, 529–539. [Google Scholar] [CrossRef]
  32. He, Y.; Venkatesh, B.; Guan, L. Optimal scheduling for charging and discharging of electric vehicles. IEEE Trans. Smart Grid 2012, 3, 1095–1105. [Google Scholar] [CrossRef]
  33. McDaniel, P.; McLaughlin, S. Security and privacy challenges in the smart grid. IEEE Secur. Priv. 2009, 7, 75–77. [Google Scholar] [CrossRef]
  34. Yilmaz, M.; Krein, P.T. Review of battery charger topologies, charging power levels, and infrastructure for plug-in electric and hybrid vehicles. IEEE Trans. Power Electron. 2013, 28, 2151–2169. [Google Scholar] [CrossRef]
  35. Lu, L.; Han, X.; Li, J.; Hua, J.; Ouyang, M. A review on the key issues for lithium-ion battery management in electric vehicles. J. Power Sources 2013, 226, 272–288. [Google Scholar] [CrossRef]
  36. Sears, J.; Roberts, D.; Glitman, K. A comparison of electric vehicle Level 1 and Level 2 charging efficiency. In Proceedings of the 2014 IEEE Conference on Technologies for Sustainability (SusTech), Portland, OR, USA, 24–26 July 2014; pp. 255–258. [Google Scholar]
  37. Forward, E.; Glitman, K.; Roberts, D. An Assessment of Level 1 and Level 2 Electric Vehicle Charging Efficiency; Vermont Energy Investment Corporation Transportation Efficiency Group: ‎Chittenden County, VT, USA, 2013. [Google Scholar]
  38. Etezadi-Amoli, M.; Choma, K.; Stefani, J. Rapid-charge electric-vehicle stations. IEEE Trans. Power Deliv. 2010, 25, 1883–1887. [Google Scholar] [CrossRef]
  39. Falvo, M.C.; Sbordone, D.; Bayram, I.S.; Devetsikiotis, M. EV charging stations and modes: International standards. In Proceedings of the 2014 IEEE International Symposium on Power Electronics, Electrical Drives, Automation and Motion, Ischia, Italy, 18–20 June 2014; pp. 1134–1139. [Google Scholar]
  40. Gilbert, N. Agent-Based Models; Number 153; Sage: Thousand Oaks, CA, USA, 2008. [Google Scholar]
  41. Bonabeau, E. Agent-based modeling: Methods and techniques for simulating human systems. Proc. Natl. Acad. Sci. USA 2002, 99, 7280–7287. [Google Scholar] [CrossRef] [PubMed] [Green Version]
  42. An, L. Modeling human decisions in coupled human and natural systems: Review of agent-based models. Ecol. Model. 2012, 229, 25–36. [Google Scholar] [CrossRef]
  43. Kennedy, W.G. Modelling human behaviour in agent-based models. In Agent-Based Models of Geographical Systems; Springer: Dordrecht, The Nehterlands, 2012; pp. 167–179. [Google Scholar]
  44. Pan, X.; Han, C.S.; Law, K.H. A multi-agent based simulation framework for the study of human and social behavior in egress analysis. In Proceedings of the ASCE International Conference on Computing in Civil Engineering, Cancun, Mexico, 12–15 July 2005; Volume 92, pp. 1–12. [Google Scholar]
  45. Axelrod, R.M. The Complexity of Cooperation: Agent-Based Models of Competition and Collaboration; Princeton University Press: Princeton, NJ, USA, 1997. [Google Scholar]
  46. Davidsson, P. Agent based social simulation: A computer science view. J. Artif. Soc. Soc. Simul. 2002, 5, 1–7. [Google Scholar]
  47. Judson, O.P. The rise of the individual-based model in ecology. Trends Ecol. Evol. 1994, 9, 9–14. [Google Scholar] [CrossRef]
  48. Tesfatsion, L. Agent-based computational economics: Modeling economies as complex adaptive systems. Inf. Sci. 2003, 149, 262–268. [Google Scholar] [CrossRef]
  49. Deissenberg, C.; Van Der Hoog, S.; Dawid, H. EURACE: A massively parallel agent-based model of the European economy. Appl. Math. Comput. 2008, 204, 541–552. [Google Scholar] [CrossRef] [Green Version]
  50. Tesfatsion, L. Agent-based computational economics: Growing economies from the bottom up. Artif. Life 2002, 8, 55–82. [Google Scholar] [CrossRef] [PubMed]
  51. Santos, A.; McGuckin, N.; Nakamoto, H.Y.; Gray, D.; Liss, S. Summary of Travel Trends: 2009 National Household Travel Survey; Technical Report; U.S. Department of Transportation: Washington, DC, USA, 2011.
  52. Marra, F.; Yang, G.Y.; Træholt, C.; Larsen, E.; Rasmussen, C.N.; You, S. Demand profile study of battery electric vehicle under different charging options. In Proceedings of the 2012 IEEE Power and Energy Society General Meeting, San Diego, CA, USA, 22–26 July 2012; pp. 1–7. [Google Scholar]
  53. Kettles, D.; Raustad, R. Electric Vehicle Charging Technologies Analysis and Standards; Technical Report; Electric Vehicle Transportation Center, University of Central Florida: Orlando, FL, USA, 2017. [Google Scholar]
  54. Nissan North America, Inc. 2011 Nissan Leaf Owners Manual; Nissan North America, Inc.: Franklin, TN, USA, 2011. [Google Scholar]
  55. Apostolaki-Iosifidou, E.; Codani, P.; Kempton, W. Measurement of power loss during electric vehicle charging and discharging. Energy 2017, 127, 730–742. [Google Scholar] [CrossRef]
  56. Wilson, E. Commercial and Residential Hourly Load Profiles for all TMY3 Locations in the United States. In U.S. Department of Energy Open Data Catalog; U.S. Department of Energy: Washington, DC, USA, 2014. [Google Scholar]
  57. Richardson, I.; Thomson, M.; Infield, D.; Clifford, C. Domestic electricity use: A high-resolution energy demand model. Energy Build. 2010, 42, 1878–1887. [Google Scholar] [CrossRef] [Green Version]
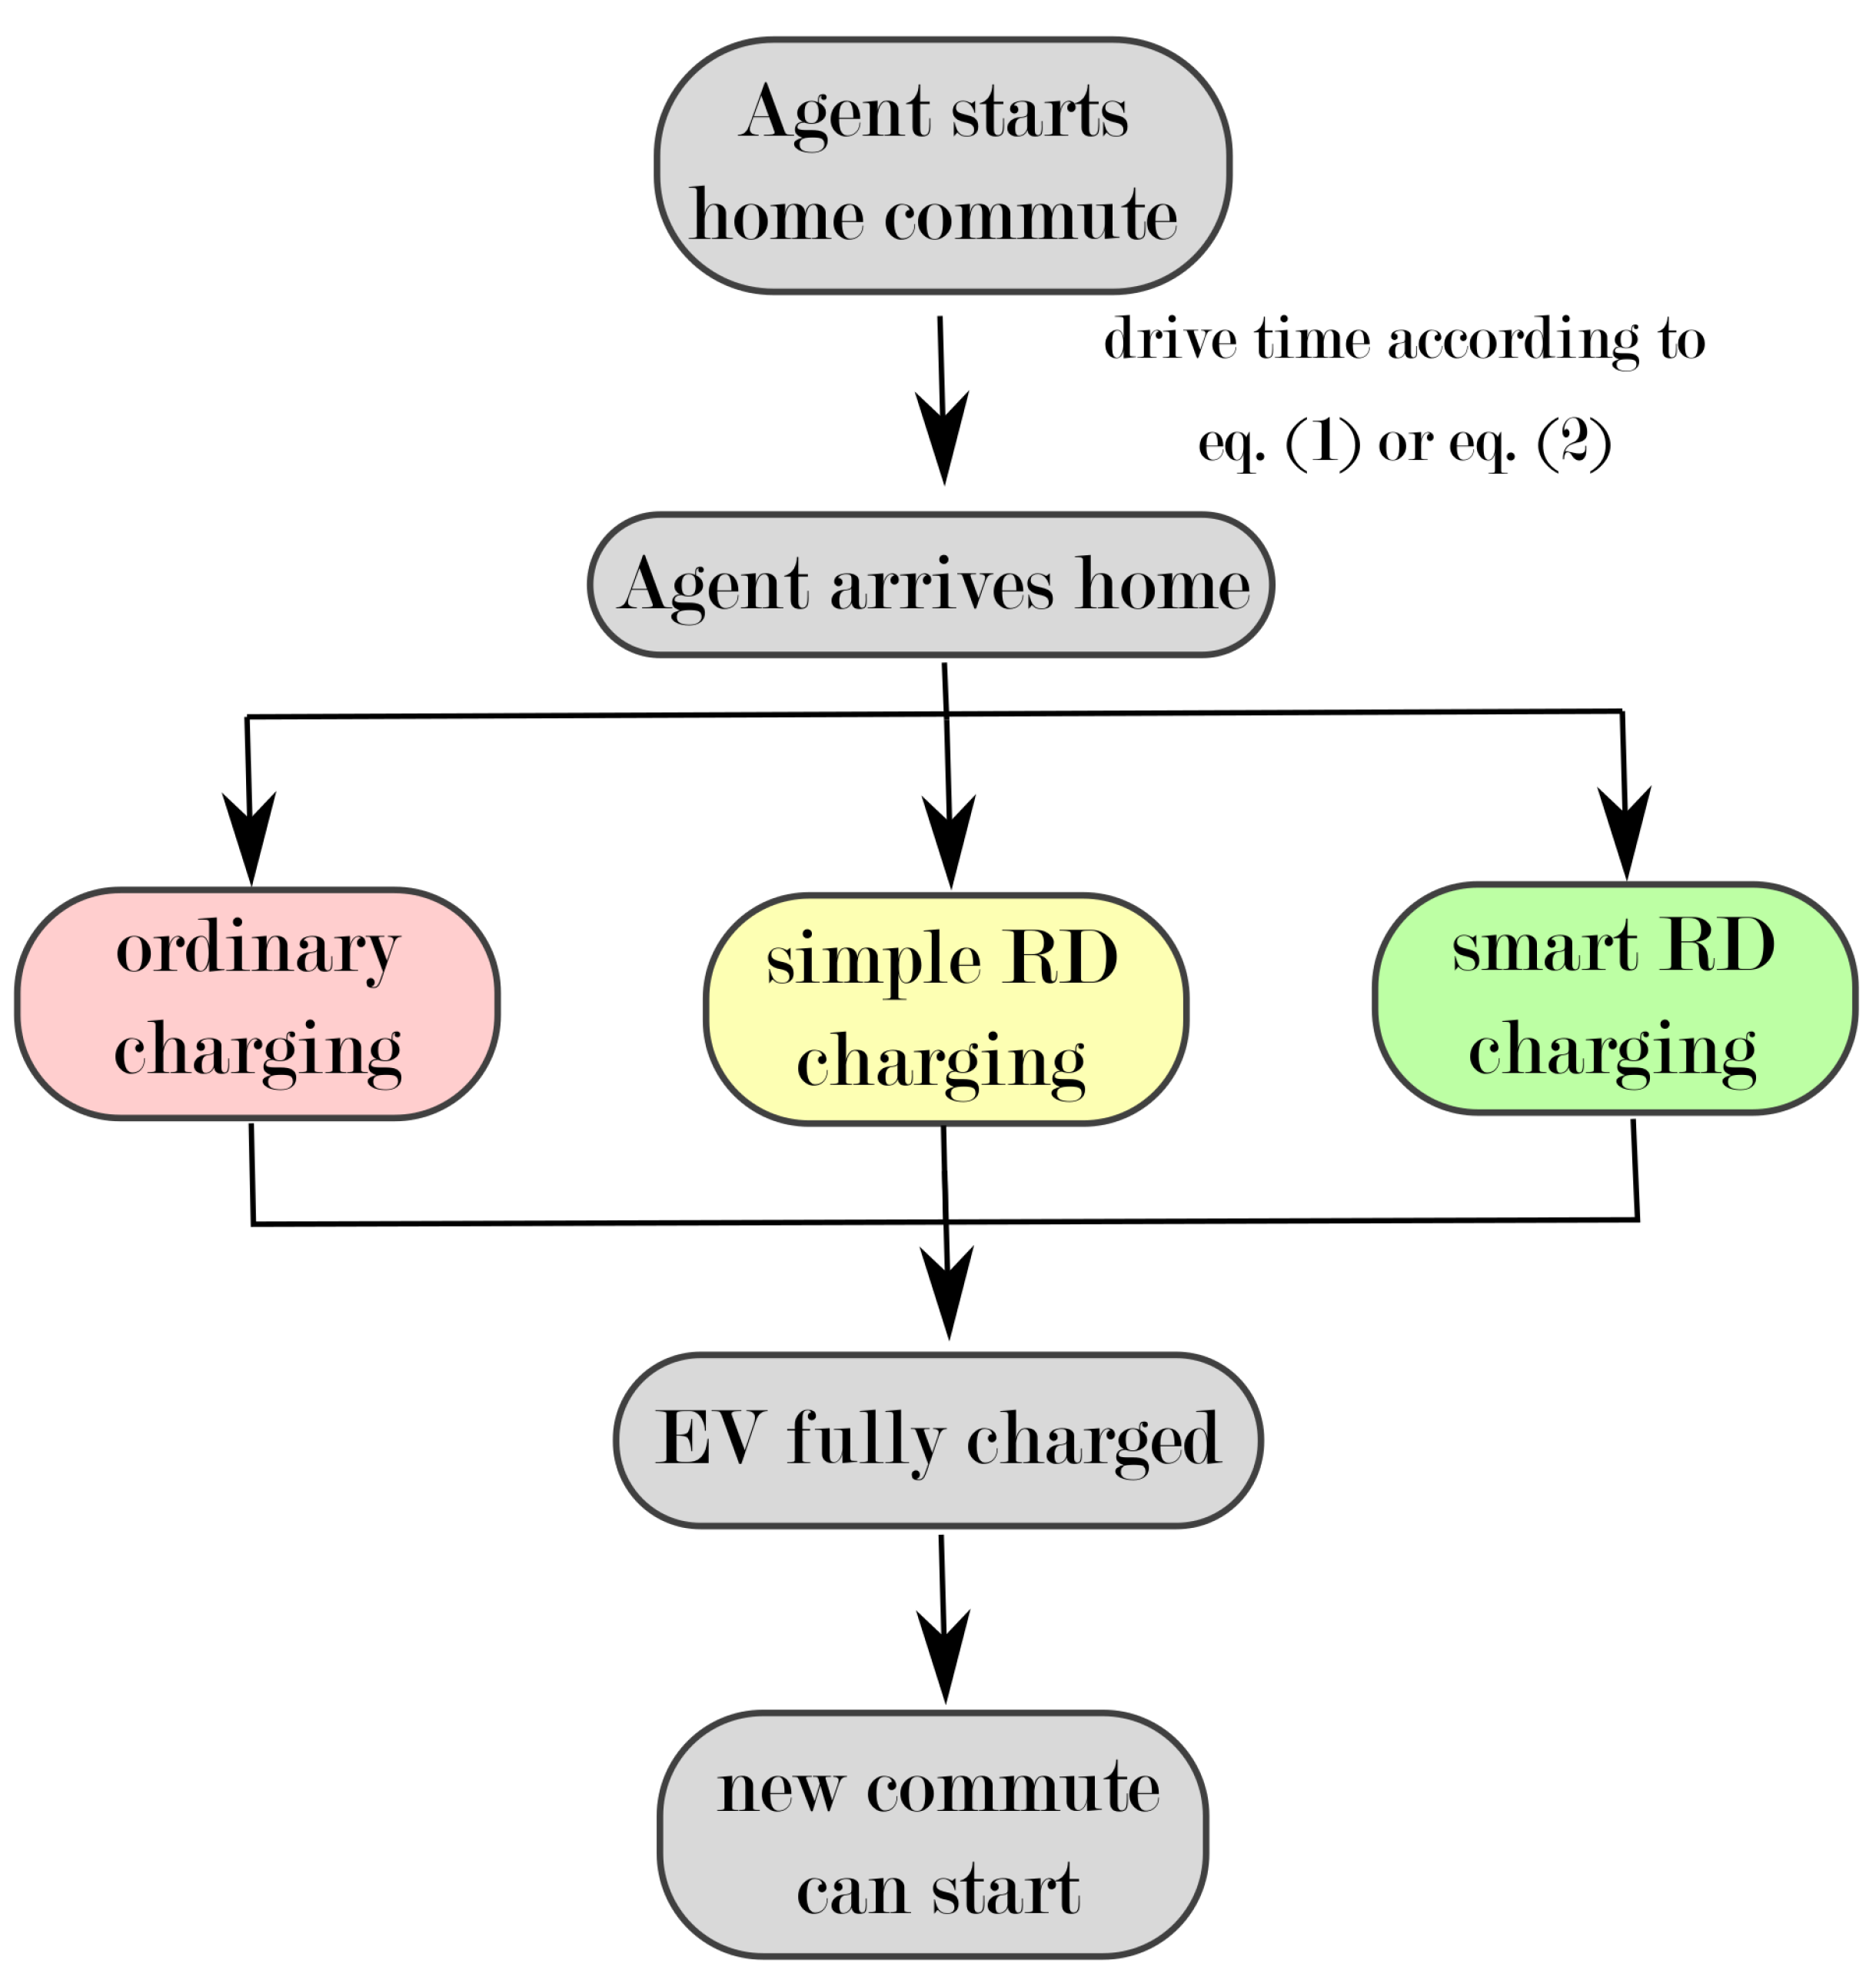
Figure 1. Schematic of the agent-based simulation.
Sustainability 11 03722 g001
Figure 2. Demand profiles for charging. Shown is the power demand (red) and the power gain of the battery (green) depending on the SOC.
Sustainability 11 03722 g002
Figure 3. Power demand for charging 10,000 EVs overnight using a charging power of up to 3.3 kW. While ordinary charging (red) leads to a high peak demand of 27.75 MW, simple RD charging (yellow) has a reduced maximal power demand of 13.2 MW. Best results are obtained for smart RD charging (green), resulting in a peak power demand of 7.7 MW. Time is measured in hours after midnight, i.e., 18 = 6 p.m.
Sustainability 11 03722 g003
Figure 4. Power demand for charging 10,000 EVs overnight using a charging power of up to 6.6 kW. Ordinary charging (red) leads to a peak demand of 45.57 MW. Simple RD charging (yellow) has a maximal power demand of 7.65 MW. Smart RD charging (green) results in a peak power demand of 6.45 MW. Time is measured in hours after midnight, i.e., 18 = 6 p.m.
Sustainability 11 03722 g004
Figure 5. Power demand for charging 10,000 EVs overnight using a charging power of up to 44 kW. Ordinary charging (red) leads to a peak demand of 88.32 MW. Results for simple RD charging (yellow) are close to the ones for smart RD charging (green), with peak values of 6.3 MW and 5.82 MW, respectively. Time is measured in hours after midnight, i.e., 18 = 6 p.m.
Sustainability 11 03722 g005
Table 1. Distribution of commuting distances.
Commuting DistanceProbability
1–5 miles30%
5–10 miles23%
10–15 miles18%
15–20 miles11%
20–25 miles8%
25–30 miles6%
30–35 miles4%