Abstract
After the authors of this study encounter a series of peculiar examples of products and services that are not normally sold online in Canada, the authors assess the psychometric properties of net-enablement capability, as an internal rather than external factor, regarding the decision to implement online selling tools as technology innovation to achieve growth. According to the literature, other authors rarely consider internal factors when they assess the relationship between technology adoption and business model innovation. The study contributes to the continuous dialogue involving the Net-Enabled Business Innovation Cycle (NEBIC) model by analyzing online sellers and offline sellers in Canadian sectors with below-average rates of online selling adoption. The findings indicate that net-enablement capability is a significant internal factor that positively affects innovation in business models for Canadian online sellers across different sectors regardless of the level of online selling adoption rate.
1. Introduction
This research responds to the body of literature that argues that the adoption of any new technology necessitates undergoing innovations in the business models in order to utilize the opportunities of that new technology fully (e.g., [1,2,3]). Furthermore, this research investigates specific internal organizational capabilities that help firms adopt online selling tools (e.g., [4,5]). The authors come across a series of peculiar examples of products and services that are not normally sold online in Canada (e.g., animal semen, dried products and seeds, minerals, and chemicals, wood in natural or processed forms, concrete and drilling products/services, water softener salt and other salt-based products, and professional consulting services). These examples motivate the authors to perform further research of challenging sectors for the e-business adoption in Canada.
Wheeler [6] discusses the connection between the use of digital networks and customer value edifice using the four factors: Adapting new IT, identical economic opportunities with technology, implementing business innovation for expansion, and examining customer value. Wheeler [6] continues on the research of [7], the developers of the original dynamic capabilities theory.
There has been a continuous dialogue involving Wheeler [6] theory. For more than a decade, numerous scholars have continued to cite the NEBIC model in their research (e.g., [8,9,10,11,12,13,14,15,16,17,18,19,20,21]). The authors of this study join the dialogue by analyzing Canadian online sellers and offline sellers in sectors with below-average rates of online selling adoption.
Many studies cite and confirm the validity of the conceptual model (e.g., [15,16,22,23,24]). Williams [25] and Standing, Standing [26] use the model for their business development studies. Ende and Wei [27], Baker, Jones [28], and Ainin, Akma Mohd Salleh [20] employ the model to explore organizational capability development. Apigian, Ragu-Nathan [29], Wu and Hisa [30], and Bremser and Chung [31] use the model to research e-business. Wheeler [6], Zahra and George [32], Williams [25], Dow, Hackbarth [33], Soto-Acosta and Meroño-Cerdan [34], Ahuja and Chan [35], and Nicholson, Shen [3] brought attention to the academic community to empirically examine the model’s effect on customer value. The authors of this research respond to the request by assessing the psychometric properties of net-enablement from a Canadian point of view.
2. Background of the Study
The NEBIC model emphasizes that net-enablement brings customer value and develops a feedback loop that assists future technology choices. Wheeler [6] values significantly that successfully establishing technology innovation to maintain business expansion is correlated with improved net-enablement capabilities. Companies use their net-enablement capabilities to improve the processes of identifying, selecting, and implementing new information technologies and thus create customer value by maintaining business expansion and competitiveness.
The NEBIC model is a recurring model that consists of four capabilities within two levels of value recognition—the value potential level and the value realization level. These capabilities involve (1) selecting emerging/enabling technologies (ET), (2) suitable proposed technologies with economic opportunities (EO), (3) implementing business innovation for expansion (BI), and (4) evaluating customer value (CV). The ET, EO, and BI capabilities compositely result in the value potential level, and the CV capability by itself forms the value realization level. This research paper addresses the first three capabilities by discussing internal organizational capabilities. For this purpose, company data was used and it was tested against the business model of innovation for online selling as a dependent variable and an outcome of the research model.
3. The Model
A net-enabled firm can be benefited from market barriers reduction, shortened time and distance, electronic information exchange rather than physical travel for information collection, enhancement in firm’s agility to cope with external changes, and engagement in innovation that aligns the firm to its competitive environment Wheeler [6]. Net-enablement includes connections with suppliers, customers, alliance partners, and observation of competitors and new market trends. Using these connections firms will be able to collect patterns and then generate new business ideas. The implementation of new perceived idea terms as innovation is also relevant to technical innovations, such as new products, services, and technologies, managerial innovations, new procedures, policies, and organizational structures [35].
An organization’s business model performs a major role in meeting the new business requirements of the newly invested technology by delivering value to the customer through commercialization of the firm’s products or services via the new technology [20,36,37,38].
The current research model refers to the adoption of online selling as new technology implemented by firms. The BMIOS targeted in this research is the changes a Canadian firm makes in its way of doing business to accommodate and utilize the online selling adoption that resulted from a well-developed net-enablement capability (i.e., represented by the IITBIG variable). These targeted innovations can occur in many aspects of the firm, such as the firm’s products, services, sales channels, and supply chain, and they can take many innovative forms, including technological, procedural, and managerial.
Adapting Wheeler [6] NEBIC model, this study aims to explore if Canadian firms that adopt technology innovation strategies are likely to present stronger established net-enablement capabilities based on the NEBIC model and whether non-adopters are likely to have less developed net-enablement capabilities. Wheeler [6] model hypothesizes that there is a positive relationship between successfully implementing technology innovation to retain expansion, on one side, and improved net-enablement capability, on the other. The study depends on dynamic capability theory in estimating a firm’s ability to organize resources in dynamic business environments and a firm’s ability to retain growth by identifying and implementing new technologies. The study also applies absorptive capacity theory to determine previous knowledge, organizational learning, and the presence of a compassionate culture for firm-level change. That is, high absorptive capacity supports a firm’s strategic plans for new information technology implementation and the creation of business innovation for growth. Low absorptive capacity, however, can hinder a firm’s ability to recognize new information technology opportunities and limit that firm’s investment in strategic options to respond to the changing environment. Additionally, the existing level of absorptive capacity of a firm can be extended by net-enablement capability through exposure to other digital networks and information technology knowledge resources. The study also addresses the resultant actions of the implementation of online selling in order to test the impact of prior knowledge on technology execution.
3.1. Model Design and Theoretical Input
The research model has four variables: (1) Selecting enabling technologies (SET); (2) comparing proposed technologies with economic opportunities (CEO); (3) implementing information technology as business innovation for growth (IITBIG); and (4) business model innovation for online selling (BMIOS)—this is the model outcome variable and the theoretical contribution to the existing NEBIC model addressing issues related to innovation in business models that are needed to utilize the benefits of the adopted online selling tools. BMIOS measures the level of business model innovation development when a firm decided to sell online and consequently reconfigured its business resources accordingly. That is, the business model becomes the mediator between the new technology adopted and the value created by changing the current business configuration [36].
To show the prediction power of the model, the net-enablement variables (SET, CEO, and IITBIG) accommodate both online sellers and offline sellers in Canada to test whether online sellers are associated with better developed net-enablement variables compared to offline sellers in Canada. The proposed model argues that online sellers strongly believe to have better developed net-enablement design than will offline sellers.
3.2. Hypotheses
This study evaluates the following seven hypotheses (see Figure 1) in the Canadian context: (H1) There is a positive correlation between the level of development in net-enablement capability and technology adoption; (H2) The SET variable consists of four elements; (H3) The CEO variable consists of two elements; (H4) There is a positive correlation between the SET and CEO elements; (H5) The IITBIG variable consists of three elements; (H6) There is a positive correlation between the CEO and IITBIG variables; and (H7) There is a positive correlation between the IITBIG and BMIOS variables.
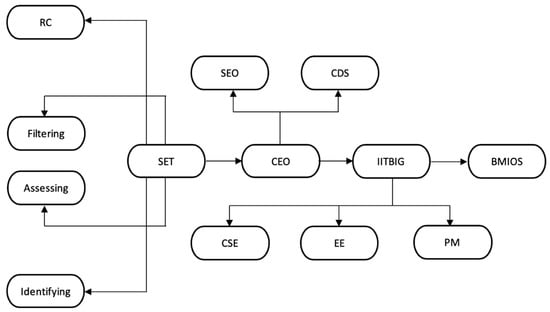
Figure 1.
The Net-Enabled Business Innovation Cycle (NEBIC) conceptual model for business model innovations of online selling.
4. Research Design
4.1. Framework
The framework rests on the four components that reflect a firm’s capability to take up innovation and restructure its business model in order to enhance the benefits of the adopted innovation. This empirical evaluation of the NEBIC model includes four sequential phases: (1) Diagnosing Canadian online sellers that sell nonconforming items, (2) identifying scales and relevant processes from the literature, (3) developing and testing an appropriate scale for a particular component to evaluate Cronbach’s alpha, and reducing items to increase the scale’s efficiency, and (4) applying various validation tests.
4.2. Exploratory and Empirical Study
The authors of this study retrieved specific processes from 131 related research articles to form scale dimensions. There are nine studies selected (i.e., Corbett [39], Cook [40], Williams [25], Wheeler [41], Akgün, Lynn [42] and the authors designed a 7-point Likert scale questionnaire which consists of 67 questions to signifies the NEBIC. The questionnaire also contains a demographic section which carries 8 items. The target of this study is all Canadian industry sectors by referring to the Canadian Company Capabilities (CCC) directory, which provides enterprises of all sizes and types.
4.2.1. Common Method Variance Concerns
The data collected depicts the attitudes and impression of an individual regarding the performance of his/her firm, this the individual response would lead to data entry errors, biases, and common method variance (CMV) issues [43]. However, few researchers believe this approach to be the most straightforward way of carrying out market-related studies. Moreover, researchers like Podsakoff, MacKenzie [44], Spector [43] and Chang, van Witteloostuijn [45] noted that certain statistical tools can lessen the effects of CMV.
4.2.2. Data Collection, Non-Response Bias, and Accusation
The effective sample of delivered surveys consists of 6134 Canadian firms with a response rate of 34% (2097 returned surveys). Usually, the response rates seem lower than 50% and common in empirical research [46,47,48,49].
Wave analysis tests assess whether and how early responders diverge from late responders. The authors incorporate a wave analysis for the two groups (475 early responders and 336 late responders). The statistical results reveal the differences between the four variables. The remaining 51 variables display no significant differences, which draws the reasonable conclusion that the results of the study about the non-response bias do not affect by the means and variances of the two groups. The test results reveal that there is no disparity between the sample’s observed missing data pattern and a random pattern; therefore, the missing values are completely at random. Furthermore, many other tests also employed such as t-test (for fairness of means) and Levene’s test (for fairness of variances and to achieve satisfactory values); the t-test p-value is 0.66, and the Levene’s test p-value is 0.62). In order to ensure normality as per Byrne [50], Hair, Anderson [51], and Mitrevski and Hristoski [52], the authors examine extreme kurtosis and skewness. Statistical indicators for these items do not indicate the presence of extreme kurtosis or skewness.
5. Empirical Evaluation
This study encompasses that there are positive correlations among the variables. The team validates internal consistency and reliability using Cronbach’s alpha, carries on empirical tests for content and convergence, and performs a factor analysis to diagnose measurement errors. All items are of the same sign, and all are significant. According to Diamantopoulos and Siguaw [53], Coltman, Devinney [54], Hair, Anderson [51] and Jiang and Balasubramanian [55] any variable that shares these empirical characteristics is a reflective variable.
5.1. Factor Analyses
To test and validate the research model, the authors incorporate both Exploratory Factor Analysis (EFA) and Confirmatory Factor Analysis (CFA) on the total of 811 valid responses. As per Park, Zo [56] and Liu, Kauffman [57], Bartlett’s test of sphericity has been performed to determine the degree of correlation and the Kaiser-Meyer-Olkin test to find sampling adequacy on the first half of the collected sample, NEFA=405. As per Andy [58], Hair, Anderson [51], and Mitrevski and Hristoski [52], the researchers also carried out a Tolerance and Variance Inflation (VIF) test to examine multicollinearity. Since all VIF values are less than 10, therefore, multicollinearity does not exist. The researchers measured that the average variance explained (AVE) values for all variables are higher than the recommended threshold of 45% [59]. See Table 1.

Table 1.
Bartlett’s, KMO, and average variance explained (AVE) results for each construct.
The extracted factors have been rotated to simplify the basic structure and identify the number of factors for every variable based on the number of Kaiser Eigenvalues higher than 1 (K1 criterion). The results present that the SET variable includes four factors that the CEO variable has two factors, that the IITBIG variable contains three factors, and that the BMIOS variable consists of one factor. See Table 2.
Table 2.
Factors extracted from the model constructs using K1 criterion and Parallel Analysis (PA) approaches.
Hayton, Allen [60] and Thompson [61] criticize the K1 criterion approach because there is a likelihood of exaggerating the number of factors. Instead, they support the use of Parallel Analysis (PA). Thompson [61] presents that real eigenvalues must be higher than random eigenvalues to retain a factor when adopting the PA approach. This study reveals the PA results are aligned with the K1 criterion results for the first three variables while for the BMIOS variable one additional factor is retained when using the PA approach.
After identifying the research variables, performed a CFA to verify the EFA results using the leftover the dataset, NCFA = 406. As per Koufteros, Babbar [62] and Lai, Tong [63], the research team employs the SEM analytical method to test and validate the research model (see Table 3, Table 4, Table 5 and Table 6).
Table 3.
Corrected item-total correlation and item loading for the selecting enabling technologies (SET) construct.
Table 4.
Corrected item-total correlation and item loading for the comparing proposed technologies with economic opportunities (CEO) construct.
Table 5.
Corrected item-total correlation and item loading of the implementing information technology as business innovation for growth (IITBIG) construct.
Table 6.
Corrected item-total correlation and item loading for the business model innovation for online selling (BMIOS) construct.
All loadings are more than 0.4. AVE for all factors is greater than the minimum threshold of 45%. Andy [58] recommends executing a corrected item-total correlation (CITC) analysis to find whether each item consistently measures the whole variable measures. The reported results for all four variables are greater than the threshold value of 0.6.
5.2. Reliability Test
Table 7 furnishes all of Cronbach’s alpha values that are higher than 0.9. The study concludes that the scale explains the NEBIC theoretical model, and the scale consistently provides the four variables.
Table 7.
Reliability coefficients.
The study also employs the Squared Multiple Correlations (SMC) test to validate the reliability of the scale. Most of the items score above 0.5. Although Gefen, Straub [64] and Hair, Anderson [51] do not suggest the cutoff value, they do state that greater values specify better measurements. In short, the scale is reliable.
5.3. Convergent Validity
Hair, Anderson [51] explored that items with convergent validity contribute a high degree of variance among all associated factors. Convergent validity is present when loading scores attain at least 0.71 and when AVE generates for at least 50%. Fornell and Larcker [65] also brought into consideration that loadings of 0.5 or higher are acceptable with at least 50% AVE. Table 3, Table 4, Table 5 and Table 6 present that all loadings are more than 0.5 and that all AVE values are higher than 50% for all variables. According to Li [66], the authors calculate the Critical Ratio (CR) value as well to furthermore evaluate convergent validity. Since all the stated CR values are higher than |1.96|, the authors furnish that convergent validity exists in the study.
5.4. Discriminate Validity
Validity types predict the intensity to which a variable differentiates from other variables [51]. All stated AVE values are higher than the corresponding squared correlation estimates. Associated variables are very much closely associated with one another than they are to other variables. Fruchter and Guilford [67] and Zimmaro [68] suggest point-biserial correlation computation examine discriminate validity and urge a threshold of 0.4. All of the reported values in Table 3, Table 4, Table 5 and Table 6 fall fairly above the proposed value. Therefore, discriminate validity exists in the study.
5.5. Goodness-of-Fit Analysis and Second-Order Factor Model
The authors of this study carried out a second-order factor analysis to examine the hierarchal structure of the model by determining the dimensions that best correspond to the data. This type of analysis also examines model validity, transparency, and accuracy [51,62]. Following Edwards [69], the team produces four models for each variable. Model 1 brings about the variable in uni-dimensional form. Models 2 and 3 separate the variables into three first-order factors; they are uncorrelated in Model 2, and they are correlated in Model 3. Model 4 shows the variable in its full second-order factor form.
The research team also assesses the goodness-of-fit (GOF) of the models. Table 8 presents an analysis of the four models versus the four variables. All the GOF values for Model 4 confirm Wheeler [6] theoretical model. Therefore, the study validates the dimensions of H2, H3, and H5.
Table 8.
The goodness-of-fit (GOF) comparisons for the four models.
5.6. Structural Equation Modeling
The next table presents the GOF indices for Structural Equation Modeling (SEM). The CFI model achieves 0.87 with the RMSEA of 0.07. The results show the rational overall fit of the research model. All of the path coefficient values are significant. The standard estimates for the SET, CEO, and IITBIG variables are quite higher than 0.5; the standard estimate for the BMIOS variable is 0.33 (see Table 9). The study thus affirms H4, H6, and H7 which explain the relationships among the research variables.
Table 9.
Structural Equation Modeling (SEM) Estimates.
5.7. Analyzing Technology Adopters to Non-Adopters
This study determines online sales in Canada as an example of technology novelty adoption. Although online sales choices have been accessible in the market for approximately twenty years, numerous Canadian organizations throughout different sectors are not yet ready to take up this method (e.g., [5,70,71,72]). The research team gathers data for both online and offline sales in Canada. Following Hair, Anderson [51], the authors perform an analysis of variance t-test to assess any significant difference between the two sample means. Table 10 shows that online sales have significantly greater mean scores amongst all variables compare to offline sales. These results sustain H1, which suggests that Canadian non-technology adopters tend to have lower levels of net-enablement capability development.
Table 10.
Levene’s test for equality of variances and t-test for equality of means.
This research also incorporates analysis of online sellers and offline sellers in Canadian business firms with low-average rates of online selling adoption. The outcomes in Table 11 demonstrate that the average score in all variables is greater for online sellers than for offline sellers in Canadian business firms with below-average rates of online selling acceptance. Furthermore, all the research variables show statistically different means for Canadian online sellers than to offline sellers at a 0.05 level of significance. These results are reliable with previous results displaying significant mean differences between online sellers and offline sellers with greater mean scores for online sellers for all levels of online selling adoption rates.
Table 11.
Levene’s test for equality of variances and t-test for equality of means.
This research shows how firms in Canadian business sectors with below-average rates of online selling adoption compare to firms in Canadian business sectors with more adoption rates. The findings reveal that net-enablement capability is a significant internal factor that positively affects innovation in business models for online sellers among various Canadian business sectors apart from the level of online selling adoption rate.
6. Discussion and Contribution
This research attempts to understand online selling of products and services that seem unlikely to be suitable for the online environment and to explain the surprising observations from Canadian sectors with below-average rates of online selling adoption. Although these sectors do not experience pressing demand for online selling from their immediate external environment, some firms from these sectors are able to sell innovatively products and services that are not normally sold online.
This research aims to understand the impact of net-enablement capability, as an internal rather than external factor, regarding the decision to implement online selling tools as technology innovation to achieve growth. This study develops and validates a variable to capture and assess any innovation that may take place within the firm’s business model after the implementation of online selling tools (BMIOS). This variable is introduced as an extension to the NEBIC model in order to assess and understand the impact of the net-enablement capability on business model innovation for online selling. All the net-enablement capability variables are developed, validated, and confirmed. All the underlying dimensions and hypotheses are also tested and found to be relevant and supported.
The authors advocate repeating the model in other countries and amongst various business sectors. Such repetition may engage the analysis of results with those for Canadian private sectors. The authors emphasize net-enablement assessments as well of other networking contexts (e.g., Internet social networking). This method may enhance the model’s validity and reliability.
Besides, there has been a chief limitation of this study engages the expectation for CMV bias because of the use of a single responder. The authors forecast that consulting many responders may decrease the degree of CMV bias, although this method may also decline response rate. However, other empirical methods of research, such as case studies and laboratory experiments, may increase response rates, as well as the validity and reliability of research results.
7. Theoretical Implications
The current study contributes to Wheeler [6] theoretical model of net-enablement and enhances its related theories. This includes operationalizing concepts and developing measurable scales for the CET, MEO, and EITBIG constructs by implementing a systematic and interactive model that emphasizes a firm’s internal factors of net-enablement when adopting a technology for business growth as technology innovation. The developed construct is an extension to the NEBIC theoretical model, which lacks in addressing the innovation in business models needed after technology implementation. As such, the development of the BMIOS construct and its relationship with net-enablement capability is intended to respond to the body of literature that argues that the adoption of any new technology necessitates undergoing innovations in the business models so as to fully utilize the opportunities of that new technology (e.g., Teece, Pisano [73] and Ciborra [1]).
Beside product/service characteristics and business external factors already addressed in the literature, the findings of this research show that development in internal net-enablement capability is the key issue that characterized successful online sellers compared with non-online sellers, regardless of the level of online selling adoption. Additionally, sharing information, communication with internal and external parties, and supportive culture for innovation are essential characteristics of the current research model to address aspects related to both dynamic capability and absorptive capacity theories and address the associated suggested development of the theories.
8. Practical Implications
The research provides useful guidelines and helpful examples to stimulate and support firm growth and assist both practitioners that have not implemented online selling and those that failed in such implementation. In order to be better candidates for selling online, decision-makers should develop their firms’ capability in net-enablement. This capability includes three constructs, namely, choosing enabling technologies (CET), matching proposed technologies with economic opportunities (MEO), and executing information technology as business innovation for growth (EITBIG).
Decision- makers are encouraged to implement efficient procedures to use to scour the market for new technologies (represented in the research on the CET construct). This search can be accomplished through internal and external parties i.e. pilot testing, competitor experiences, and consolations from in/outside.
Then, decision-makers should evaluate their strategic options for growth and find how the proposed technology will help achieve the desired business growth (represented as MEO construct)—for example, seeking IT solutions that create additional opportunities while solving existing problems. Further, decision-makers should seek help from employees, customers, and vendors and their opinions related to the new technology and its suitability for possible implementation.
The last construct in the capability of net-enablement for technology identification, selection, and implementation is executing the proposed technology as business innovation for growth (EITBIG), done by managing project implementation, creating a business culture that supports and appreciates new ideas, and providing needed training for targeted employees.
It is important to notice that these recommendations for net-enablement development and the associated innovation in the business model for online sellers are not developed or acquired in a one-step solution. They are developed gradually and over time. Further, they require continuous investments in both manpower and technologies.
9. Conclusions & Outlook
This one-dimensional model of BMIOS was found reliable and valid. Notwithstanding, further investigation may propose that the BMIOS has two or more dimensions. In this way, researchers are urged to further build up the scale and test it in different settings. The exploration model can be connected to various settings that identify with net-enablement capacity, looking for conceivable generalizability of the model. For this purpose, social networking sites (i.e., Twitter, Facebook, Instagram, ... and so forth.) could be analyzed for further evaluation.
In addition to the effect of the external business environment, researchers are urged to explore different variables that are forestalling/urging firms to sell on the web. This examination would create better results whenever directed through a subjective research process that permits inside and out an investigation to accumulate more extensive and setting delicate data.
The current study was conducted using one key source of information which is one of the limitations of the research. Accordingly, reproducing the study with different sources would be prescribed augmentation of future research.
Author Contributions
Conceptualization, A.A. and A.F.B.; Formal analysis, A.F.B.; Methodology, N.A.; Software, A.A.; Validation, N.A.; Writing – original draft, N.A.; Writing—review & editing, A.A. and H.M.A.; revision, H.M.A.
Funding
This research received no external funding.
Acknowledgments
The authors of the paper would like to acknowledge the support brought by University of Waterloo, ON, Canada, King Fahd University of Petroleum and Minerals (KFUPM), Dhahran, Saudi Arabia, and Yanbu University College, Royal Commission for Yanbu Project, Saudi Arabia. Author would also like to acknowledge the support we received from Prof. Rod B. McNaughton during the validation stage of the study.
Conflicts of Interest
The authors declare no conflict of interest.
References
- Ciborra, C. The Labyrinths of Information: Challenging the Wisdom of Systems: Challenging the Wisdom of Systems; OUP Oxford: New York, NY, USA, 2002. [Google Scholar]
- Ye, H.J.; Feng, Y.; Choi, B.C.F. Understanding knowledge contribution in online knowledge communities: A model of community support and forum leader support. Electron. Commer. Res. Appl. 2015, 14, 34–45. [Google Scholar] [CrossRef]
- Nicholson, J.; Shen, Y.; Nicholson, D. Increasing Intrapreneurial Intentions among Business Students: Using a Net-Enabled Business Innovation Cycle (NEBIC) Theory Team Project. J. High. Educ. Theory Pract. 2016. [Google Scholar]
- Rask, M.; Kragh, H. Motives for e-marketplace Participation: Differences and Similarities between Buyers and Suppliers. Elec. Mark. 2004, 14, 270–283. [Google Scholar] [CrossRef]
- Bilgihan, A.; Bujisic, M. The effect of website features in online relationship marketing: A case of online hotel booking. Electron. Commer. Res. Appl. 2015, 14, 222–232. [Google Scholar] [CrossRef]
- Wheeler, B.C. NEBIC: A Dynamic Capabilities Theory for Assessing Net-Enablement. Inf. Syst. Res. 2002, 13, 125–146. [Google Scholar] [CrossRef]
- Eisenhardt, K.M.; Martin, J.A. Dynamic capabilities: What are they? Strateg. Manag. J. 2000, 21, 1105–1121. [Google Scholar] [CrossRef]
- Lyytinen, R. The Disruptive Nature of Information Technology Innovations: The Case of Internet Computing in Systems Development Organizations. Mis Q. 2003, 27, 557. [Google Scholar] [CrossRef]
- Hackbarth, G.; Kettinger, W.J. Strategic aspirations for net-enabled business. Eur. J. Inf. Syst. 2004, 13, 273–285. [Google Scholar] [CrossRef]
- Burn, J.; Ash, C. A dynamic model of e-business strategies for ERP enabled organisations. Ind. Mngmnt Data Syst. 2005, 105, 1084–1095. [Google Scholar] [CrossRef]
- Paarup Nielsen, A. Understanding dynamic capabilities through knowledge management. J Knowl. Manag. 2006, 10, 59–71. [Google Scholar] [CrossRef]
- Joo, J. An empirical study on the relationship between customer value and repurchase intention in Korean internet shopping malls. J. Comput. Inf. Syst. 2007, 48, 53–62. [Google Scholar]
- Butler, T.; Murphy, C. An Exploratory Study on IS Capabilities and Assets in a Small-to-Medium Software Enterprise. J. Inf. Technol. 2008, 23, 330–344. [Google Scholar] [CrossRef]
- Harris, M.L.; Collins, R.W.; Hevner, A.R. Control of Flexible Software Development Under Uncertainty. Inf. Syst. Res. 2009, 20, 400–419. [Google Scholar] [CrossRef]
- Patrakosol, B.; Lee, S.M. IT capabilities, interfirm performance, and the state of economic development. Ind. Mngmnt Data Syst. 2009, 109, 1231–1247. [Google Scholar] [CrossRef]
- Yoo, Y.; Henfridsson, O.; Lyytinen, K. The New Organizing Logic of Digital Innovation: An Agenda for Information Systems Research. Inf. Syst. Res. 2010, 21, 724–735. [Google Scholar] [CrossRef]
- Jacks, T.; Palvia, P.; Schilhavy, R.; Wang, L. A framework for the impact of IT on organizational performance. Bus. Process Mgmt J. 2011, 17, 846–870. [Google Scholar] [CrossRef]
- Chiang, C.Y.; Kocabasoglu-Hillmer, C.; Suresh, N. An empirical investigation of the impact of strategic sourcing and flexibility on firm’s supply chain agility. Int Jrnl Op Prod Mnagemnt 2012, 32, 49–78. [Google Scholar] [CrossRef]
- Chakravarty, A.; Grewal, R.; Sambamurthy, V. Information Technology Competencies, Organizational Agility, and Firm Performance: Enabling and Facilitating Roles. Inf. Syst. Res. 2013, 24, 976–997. [Google Scholar] [CrossRef]
- Ainin, S.; Akma Mohd Salleh, N.; Bahri, S.; Mohd Faziharudean, T. Organization’s Performance, Customer Value and the Functional Capabilities of Information Systems. Inf. Syst. Manag. 2015, 32, 2–14. [Google Scholar] [CrossRef]
- Tallon, P.; Queiroz, M.; Coltman, T.; Sharma, R. Business Process and Information Technology Alignment: Construct Conceptualization, Empirical Illustration, and Directions for Future Research. JAIS 2016, 17, 563–589. [Google Scholar] [CrossRef]
- Saeed, K.A.; Grover, V.; Hwang, Y. The Relationship of E-Commerce Competence to Customer Value and Firm Performance: An Empirical Investigation. J. Manag. Inf. Syst. 2005, 22, 223–256. [Google Scholar] [CrossRef]
- Bendoly, E. Resource enablement modeling: Implications for studying the diffusion of technology. Eur. J. Oper. Res. 2007, 179, 537–553. [Google Scholar] [CrossRef]
- Tarafdar, M.; Gordon, S.R. Understanding the influence of information systems competencies on process innovation: A resource-based view. J. Strateg. Inf. Syst. 2007, 16, 353–392. [Google Scholar] [CrossRef]
- Williams, M.L. Organizational Routines for Choosing Information Technology: A Multiple Case Study Examination of NEBIC Theory’s Choosing Capability; Indiana University: Bloomington, IN, USA, 2004. [Google Scholar]
- Standing, S.; Standing, C.; Love, P.E.D. A review of research on e-marketplaces 1997–2008. Decis. Support Syst. 2010, 49, 41–51. [Google Scholar] [CrossRef]
- Ende, L.V.D.; Wei, J. E-energy security model development based on value chain analysis for oil enterprises. IJMED 2007, 4, 489. [Google Scholar] [CrossRef]
- Baker, J.; Jones, D.; Cao, Q.; Song, J. Conceptualizing the dynamic strategic alignment competency. JAIS 2011, 12, 2. [Google Scholar] [CrossRef]
- Apigian, C.H.; Ragu-Nathan, B.S.; Ragu-Nathan, T.S. Strategic profiles and Internet Performance: An empirical investigation into the development of a strategic Internet system. Inf. Manag. 2006, 43, 455–468. [Google Scholar] [CrossRef]
- Wu, J.-H.; Hisa, T.-L. Analysis of E-commerce innovation and impact: A hypercube model. Electron. Commer. Res. Appl. 2004, 3, 389–404. [Google Scholar] [CrossRef]
- Bremser, W.G.; Chung, Q.B. A framework for performance measurement in the e-business environment. Electron. Commer. Res. Appl. 2005, 4, 395–412. [Google Scholar] [CrossRef]
- Zahra, S.A.; George, G. The Net-Enabled Business Innovation Cycle and the Evolution of Dynamic Capabilities. Inf. Syst. Res. 2002, 13, 147–150. [Google Scholar] [CrossRef]
- Dow, K.E.; Hackbarth, G.; Wong, J. Enhancing customer value through IT investments: A NEBIC perspective. Sigmis Database 2006, 37, 167. [Google Scholar] [CrossRef]
- Soto-Acosta, P.; Meroño-Cerdan, A.L. Analyzing e-business value creation from a resource-based perspective. Int. J. Inf. Manag. 2008, 28, 49–60. [Google Scholar] [CrossRef]
- Ahuja, S.; Chan, Y. The enabling role of IT in frugal innovation. 2014. [Google Scholar]
- Chesbrough, H. The role of the business model in capturing value from innovation: Evidence from Xerox Corporation’s technology spin-off companies. Ind. Corp. Chang. 2002, 11, 529–555. [Google Scholar] [CrossRef]
- Hamermesh, R.G.; Marshall, P.W.; Pirmohamed, T. Note on Business Model Analysis for the Entrepreneur; Harvard Business School: Boston, MA, USA, 2005. [Google Scholar]
- Laugesen, J.; Yuan, Y. What Factors Contributed to the Success of Apple’s iPhone? In Proceedings of the 2010 Ninth International Conference on Mobile Business and 2010 Ninth Global Mobility Roundtable (ICMB-GMR), Athens, Greece, 13–15 June 2010; pp. 91–99. [Google Scholar]
- Corbett, A.C. Opportunity recognition: A learning and cognitive approach. 2003. [Google Scholar]
- Cook, B.W. Measuring the Value of Success in Project Management Organizations; Argosy University/Orange County: Santa Ana, CA, USA, 2004. [Google Scholar]
- Wheeler, B. Nokia NEBIC & IT Governance Program: Net-enabled Business Innovation Cycle (NEBIC). 2005. [Google Scholar]
- Akgün, A.E.; Lynn, G.S.; Yılmaz, C. Learning process in new product development teams and effects on product success: A socio-cognitive perspective. Ind. Mark. Manag. 2006, 35, 210–224. [Google Scholar] [CrossRef]
- Spector, P.E. Method Variance in Organizational Research: Truth or Urban Legend? Organ. Res. Methods 2006, 9, 221–232. [Google Scholar] [CrossRef]
- Podsakoff, P.M.; MacKenzie, S.B.; Lee, J.-Y.; Podsakoff, N.P. Common method biases in behavioral research: A critical review of the literature and recommended remedies. J. Appl. Psychol. 2003, 88, 879–903. [Google Scholar] [CrossRef]
- Chang, S.-J.; van Witteloostuijn, A.; Eden, L. From the Editors: Common method variance in international business research. J Int Bus Stud 2010, 41, 178–184. [Google Scholar] [CrossRef]
- Cook, C.; Heath, F.; Thompson, R.L. A Meta-Analysis of Response Rates in Web- or Internet-Based Surveys. Educ. Psychol. Meas. 2000, 60, 821–836. [Google Scholar] [CrossRef]
- Dillman, D.A.; Bowker, D.K. The web questionnaire challenge to survey methodologists. Online Soc. Sci. 2001, 53–71. [Google Scholar]
- Cobanoglu, C.; Moreo, P.J.; Warde, B. A Comparison of Mail, Fax and Web-Based Survey Methods. Int. J. Mark. Res. 2001, 43, 1–15. [Google Scholar] [CrossRef]
- Loukis, E.; Pazalos, K.; Salagara, A. Transforming e-services evaluation data into business analytics using value models. Electron. Commer. Res. Appl. 2012, 11, 129–141. [Google Scholar] [CrossRef][Green Version]
- Byrne, B.M. Structural Equation Modeling with AMOS: Basic Concepts, Applications, and Programming; Routledge: Abingdon, UK; London, UK, 2016. [Google Scholar]
- Hair, J.F.; Anderson, R.E.; Babin, B.J.; Black, W.C. Multivariate Data Analysis: A Global Perspective; Pearson: Upper Saddle River, NJ, USA, 2010; Volume 7. [Google Scholar]
- Mitrevski, P.J.; Hristoski, I.S. Behavioral-based performability modeling and evaluation of e-commerce systems. Electron. Commer. Res. Appl. 2014, 13, 320–340. [Google Scholar] [CrossRef]
- Diamantopoulos, A.; Siguaw, J.A. Formative Versus Reflective Indicators in Organizational Measure Development: A Comparison and Empirical Illustration. Br J Manag. 2006, 17, 263–282. [Google Scholar] [CrossRef]
- Coltman, T.; Devinney, T.M.; Midgley, D.F.; Venaik, S. Formative versus reflective measurement models: Two applications of formative measurement. J. Bus. Res. 2008, 61, 1250–1262. [Google Scholar] [CrossRef]
- Jiang, P.; Balasubramanian, S.K. An empirical comparison of market efficiency: Electronic marketplaces vs. traditional retail formats. Electron. Commer. Res. Appl. 2014, 13, 98–109. [Google Scholar] [CrossRef]
- Park, S.; Zo, H.; Ciganek, A.P.; Lim, G.G. Examining success factors in the adoption of digital object identifier systems. Electron. Commer. Res. Appl. 2011, 10, 626–636. [Google Scholar] [CrossRef]
- Liu, J.; Kauffman, R.J.; Ma, D. Competition, cooperation, and regulation: Understanding the evolution of the mobile payments technology ecosystem. Electron. Commer. Res. Appl. 2015, 14, 372–391. [Google Scholar] [CrossRef]
- Andy, F. Discovering statistics using SPSS. Saga Publ. Ltd. 2005, 521–570. [Google Scholar]
- Netemeyer, R.G.; Bearden, W.O.; Sharma, S. Scaling Procedures: Issues and Applications; Sage Publications: Thousand Oaks, CA, USA, 2003. [Google Scholar]
- Hayton, J.C.; Allen, D.G.; Scarpello, V. Factor Retention Decisions in Exploratory Factor Analysis: A Tutorial on Parallel Analysis. Organ. Res. Methods 2004, 7, 191–205. [Google Scholar] [CrossRef]
- Thompson, B. Exploratory and confirmatory factor analysis: Understanding concepts and applications. Appl. Psychol. Meas. 2007, 31, 245–248. [Google Scholar]
- Koufteros, X.; Babbar, S.; Kaighobadi, M. A paradigm for examining second-order factor models employing structural equation modeling. Int. J. Prod. Econ. 2009, 120, 633–652. [Google Scholar] [CrossRef]
- Lai, I.K.W.; Tong, V.W.L.; Lai, D.C.F. Trust factors influencing the adoption of internet-based interorganizational systems. Electron. Commer. Res. Appl. 2011, 10, 85–93. [Google Scholar] [CrossRef]
- Gefen, D.; Straub, D.; Boudreau, M.-C. Structural Equation Modeling and Regression: Guidelines for Research Practice. CAIS 2000, 4. [Google Scholar] [CrossRef]
- Fornell, C.; Larcker, D.F. Evaluating structural equation models with unobservable variables and measurement error. J. Mark. Res. 1981, 18, 39–50. [Google Scholar] [CrossRef]
- Li, Y. A multi-level model of individual information privacy beliefs. Electron. Commer. Res. Appl. 2014, 13, 32–44. [Google Scholar] [CrossRef]
- Fruchter, B.; Guilford, J.P. Fundamental Statistics in Psychology and Education; McGraw-Hill: New York, NY, USA, 1983. [Google Scholar]
- Zimmaro, D. Test item analysis and decision making. Retrieved 9 May 2011. 2003.
- Edwards, J.R. Multidimensional Constructs in Organizational Behavior Research: An Integrative Analytical Framework. Organ. Res. Methods 2001, 4, 144–192. [Google Scholar] [CrossRef]
- Fischer, E.; Reuber, R. Building international sales in a digitized economy-Best practices for SMEs. In Proceedings of the Conference Board of Canada, Ottawa, ON, Canada, 10 June 2011. [Google Scholar]
- Weber, D.M.; Kauffman, R.J. What drives global ICT adoption? Analysis and research directions. Electron. Commer. Res. Appl. 2011, 10, 683–701. [Google Scholar] [CrossRef]
- Bounie, D.; Eang, B.; Sirbu, M.; Waelbroeck, P. Superstars and outsiders in online markets: An empirical analysis of electronic books. Electron. Commer. Res. Appl. 2013, 12, 52–59. [Google Scholar] [CrossRef]
- Teece, D.J.; Pisano, G.; Shuen, A. Dynamic capabilities and strategic management. Strateg. Manag. J. 1997, 18, 509–533. [Google Scholar] [CrossRef]

© 2019 by the authors. Licensee MDPI, Basel, Switzerland. This article is an open access article distributed under the terms and conditions of the Creative Commons Attribution (CC BY) license (http://creativecommons.org/licenses/by/4.0/).