1. Introduction
With the continuous development of Chinese economy, people are increasingly demanding the fresher and better-quality agricultural product. However, the cold chain transportation rate of primary agricultural products in China has been lower than developed countries. The cold chain transportation rate of fruits and vegetables, meat, aquatic products are only 15%, 30%, 40%, while the developed countries have reached between 80% and 90%. Even with cold chain transportation, the proportion of “broken chain” in these three kinds of products are as high as 67%, 50%, 42%, while the proportion in developed countries is below 5% [
1,
2]. According to the statics, Chinese fresh product market has about 280-billion-yuan (about 40.55-billion-dollar) worth of goods lost in transportation every year [
3]. Therefore, improving the reliability of cold chain logistics is the key to ensuring the quality of fresh agricultural products and reducing the circulation loss rate. In the cold chain logistics system, the distribution and transportation process occupy about 80% of the time in the entire logistics process [
4]. The reliability of the cold chain distribution system reflects the ability to complete the distribution tasks and meet customer demands within the specified time and conditions [
5], which will directly affect the quality and safety of fresh agricultural products and customer satisfaction. Therefore, the reliability analysis of cold chain distribution system is of great significance to reduce the circulation loss rate and ensure the quality and safety of agricultural products.
Cold chain logistics of fresh agricultural products means that the agricultural products are kept in a low temperature environment during pre-cooling, packaging, transportation, storage until delivering to the consumer, to prevent the decay of agricultural products [
6]. Barrier and Ruddich first proposed the concept of “Cold Chain” [
7]. But until 1940, cold chain logistics began to be valued.
Many scholars proposed principles or theories such as “3T principle” for frozen products [
8], “3P theory” and “3C principle” for cooling process [
9], “3M principle” and “3Q principle” for cold chain logistics management [
10], which lay the foundation for the research of cold chain logistics [
11]. Research on the distribution of fresh agricultural products mainly focuses on vehicle routing problem [
12,
13,
14,
15,
16], location selection of logistics center [
17,
18,
19,
20], factor analysis and performance evaluation [
21,
22,
23,
24]. Only a few studies on the reliability of the cold chain logistics system. Zou [
25] treated each phase of the food logistics system as a logistics unit and established a safety model of the food logistics system. Guo [
26] explored the factors affecting customer satisfaction of cold chain logistics and combined reliability engineering theory with Bayesian network to find out the main factors leading to reduce customer satisfaction.
Bayesian network is a graphical network based on probabilistic reasoning [
27], which consists of a directed acyclic graph and a conditional probability table. Maryam [
28] proposed a reliability analysis method based on Bayesian network, which combines historical data with expert judgement to handle data scarcity. Cai [
29] combined the fuzzy set theory with the Bayesian network model and used it in the reliability analysis of the logistics service system with a large amount of uncertainty information in the system. Reliability allocation is a method often used in system reliability optimization with the expectation that uses the least resource to maximize the whole system reliability through assigns the reliability value to each composing unit in a certain method [
30]. Qi [
31] combined the reliability analysis with the correlation analysis, sorted the subsystems by TOPSIS method, and then established a reliability allocation model based on structural correlation and failure correlation to optimize the allocation results. Wang [
32] studied the reliability of the complex emergency logistics network through simulation analysis.
This research takes the cold chain distribution system of fresh agricultural product as the research object. Firstly, we analyze the factors affecting the reliability of the cold chain distribution system through fault tree model and Bayesian network, and the probability importance is introduced to identify the key factors affecting the cold chain distribution system reliability. Then, we propose an optimization model through combining the reliability allocation method with probability importance and solve it by the particle swarm optimization algorithm. The contribution of this research can help the logistics enterprise of fresh agricultural product to intuitively find the factors affecting its cold chain distribution system reliability and make the decision on how to improve the cold chain distribution system reliability within a limited cost.
2. Modelling Approach
2.1. Factor Analysis of Cold Chain Distribution System based on Fault Tree Model
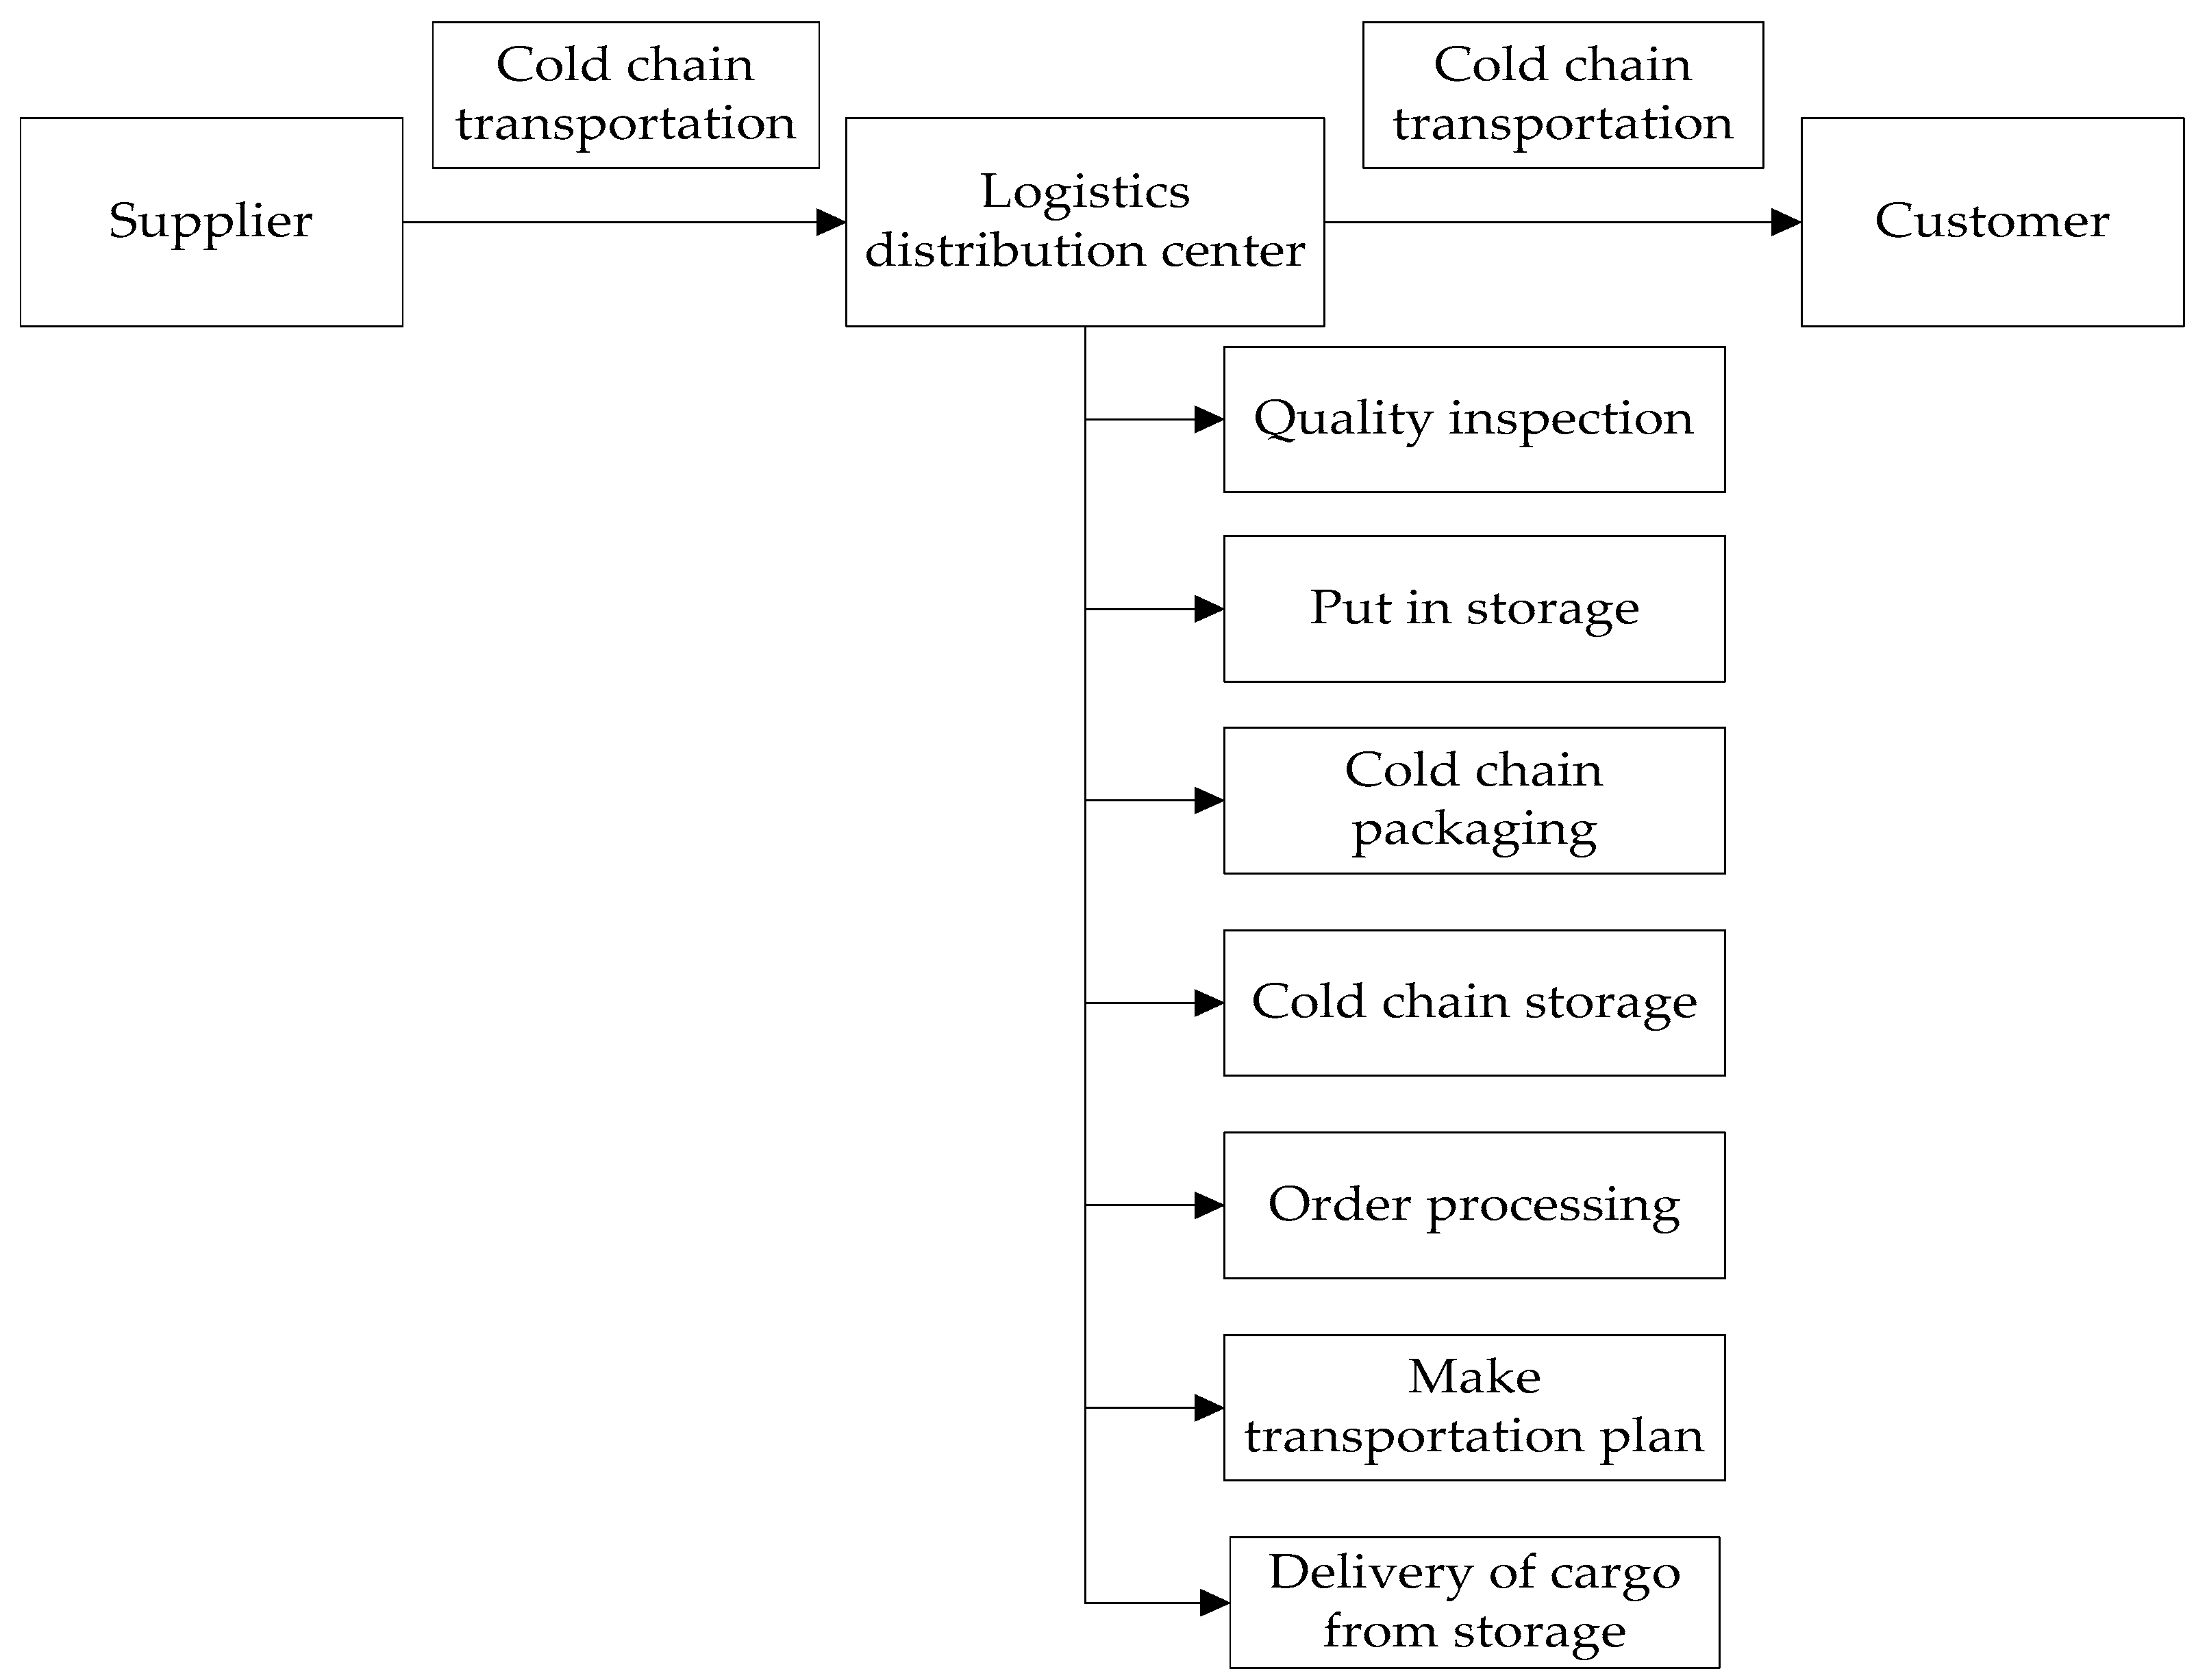
The normal temperature logistics distribution system consists of logistics functions such as transportation, storage, packaging, loading and unloading, and logistics information management. Compared with room temperature logistics, cold chain distribution system not only pays attention to distribution efficiency and logistics service level, but also guarantees that the goods are in the specified temperature and humidity environment throughout the distribution process. Therefore, cold chain distribution system requires more resource elements.
Figure 1 shows a cold chain distribution process and the phases involved.
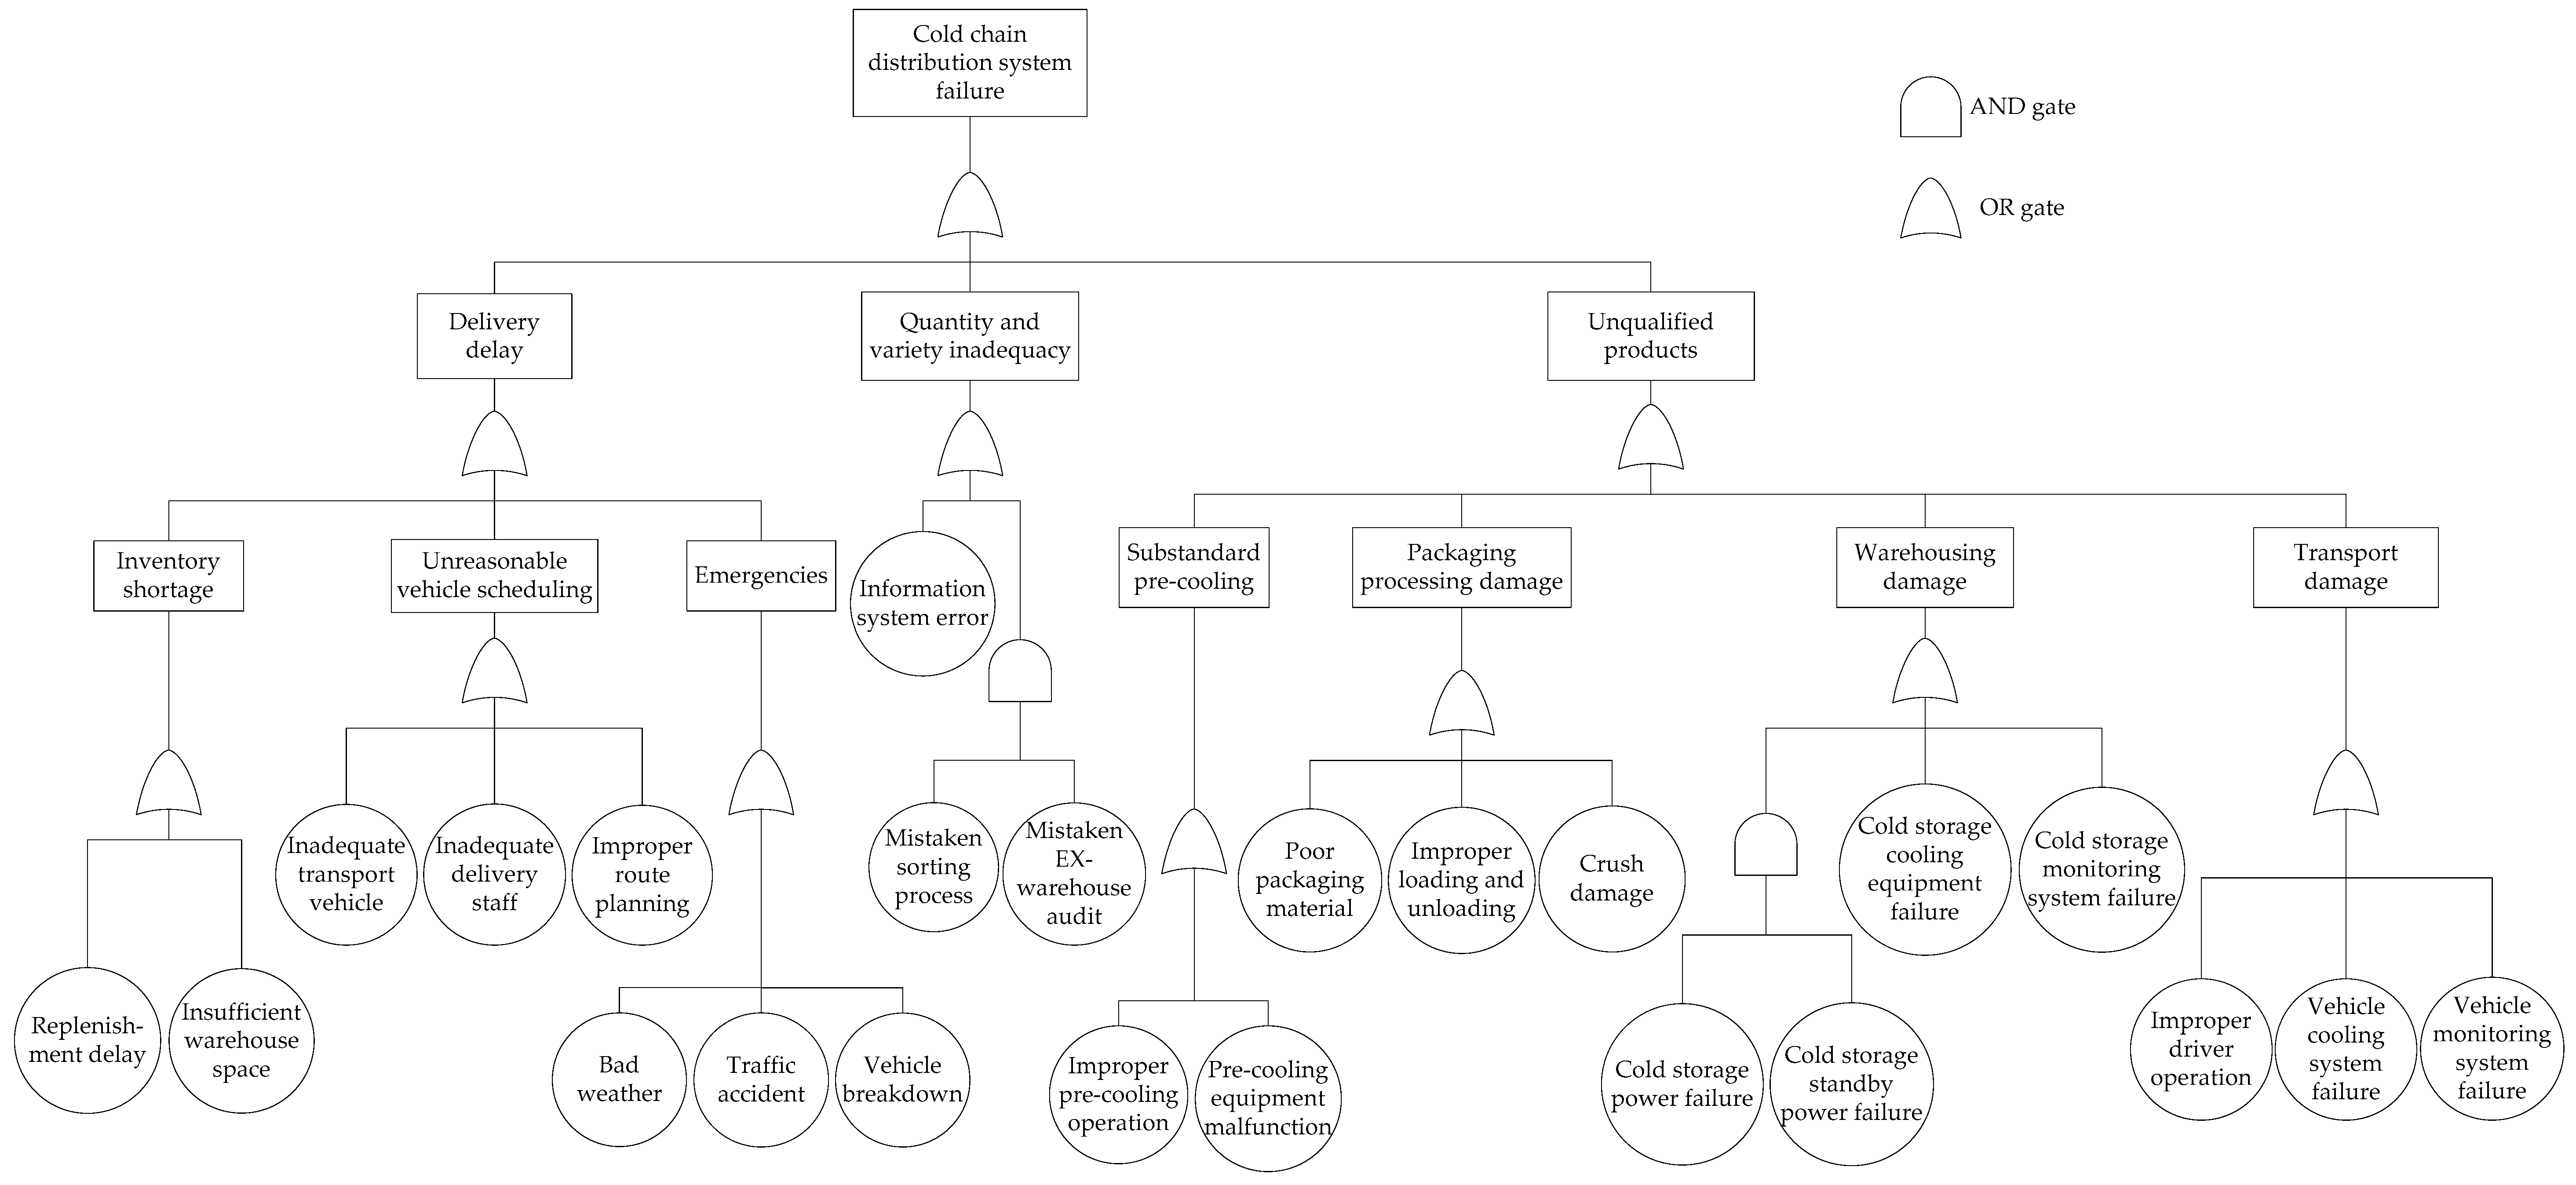
The failure to complete the logistics goals within the specified time is considered as a failure of the cold chain distribution system, and then all direct causes of failure of the cold chain distribution system are sought:
Delivery delay: The package cannot be delivered to the designated location within the specified time;
Quantity and variety inadequacy: Mistakes in sorting process or information errors will result in the quantity or categories of products not meeting the customer’s demand;
Unqualified products: The temperature and humidity are not strictly controlled during transportation or storage, or the product is deteriorated due to cross-contamination between different goods, which could lead to logistics loss of fresh agricultural products.
The cold chain distribution system failure is defined as a top event. The intermediate events are delivery delay, quantity and variety inadequacy, and unqualified products. Since any of these three events will cause the failure of cold chain distribution system, they are connected to the top event by logical OR gates. Then look for the lower-level cause events that cause the intermediate events to occur. According to their logical relationship with the intermediate events, select the appropriate logic gates to connect them with the intermediate events. Follow the above principles until the factors are decomposed to its failure mechanism or probability can be collected by daily events.
Figure 2 is the fault tree model of the cold chain distribution system.
After receiving the customer’s order, the logistics center will sort the products from the warehouse. If the information system fails, or the sorting operators pick the wrong category or miss some products, and the inspectors do not review the mistake when the products were moving out of the warehouse. Although these factors will not affect the quality and safety of fresh agricultural products, there is a risk of returns from customers. Due to the short shelf life of fresh agricultural products, the circulation loss rate will increase during the process of returning freight, and the logistics cost of fresh agricultural products will be increased.
The loss of cold chain transportation is mainly caused by the increase of transportation time. It can be divided into three causes: unreasonable vehicle scheduling, vehicle breakdown and emergencies.
Table 1 gives the fault causes and analysis in cold chain transportation.
Cold chain storage is a logistics activity that uses temperature control facilities to create a suitable temperature and humidity environment for fresh agricultural products to extend the shelf time. If the cold chain storage cannot be accurately controlled, a large amount of logistics loss will be generated, which would also affect the efficiency of the cold chain transportation process. Cold chain storage includes pre-cooling process, cold storage, and packaging.
Table 2 shows the fault causes and analysis in cold chain transportation storage.
The fault tree model of the cold chain distribution system can intuitively show the reasons for the system failure and the logical relationship between the various influencing factors. However, the model can only be reasoned from top to down, and its reasoning is limited and not efficient. For a system with many fault events and complex structures, it requires the large amount of calculation and is prone to errors. Therefore, it is converted to a Bayesian network for further inferential calculation.
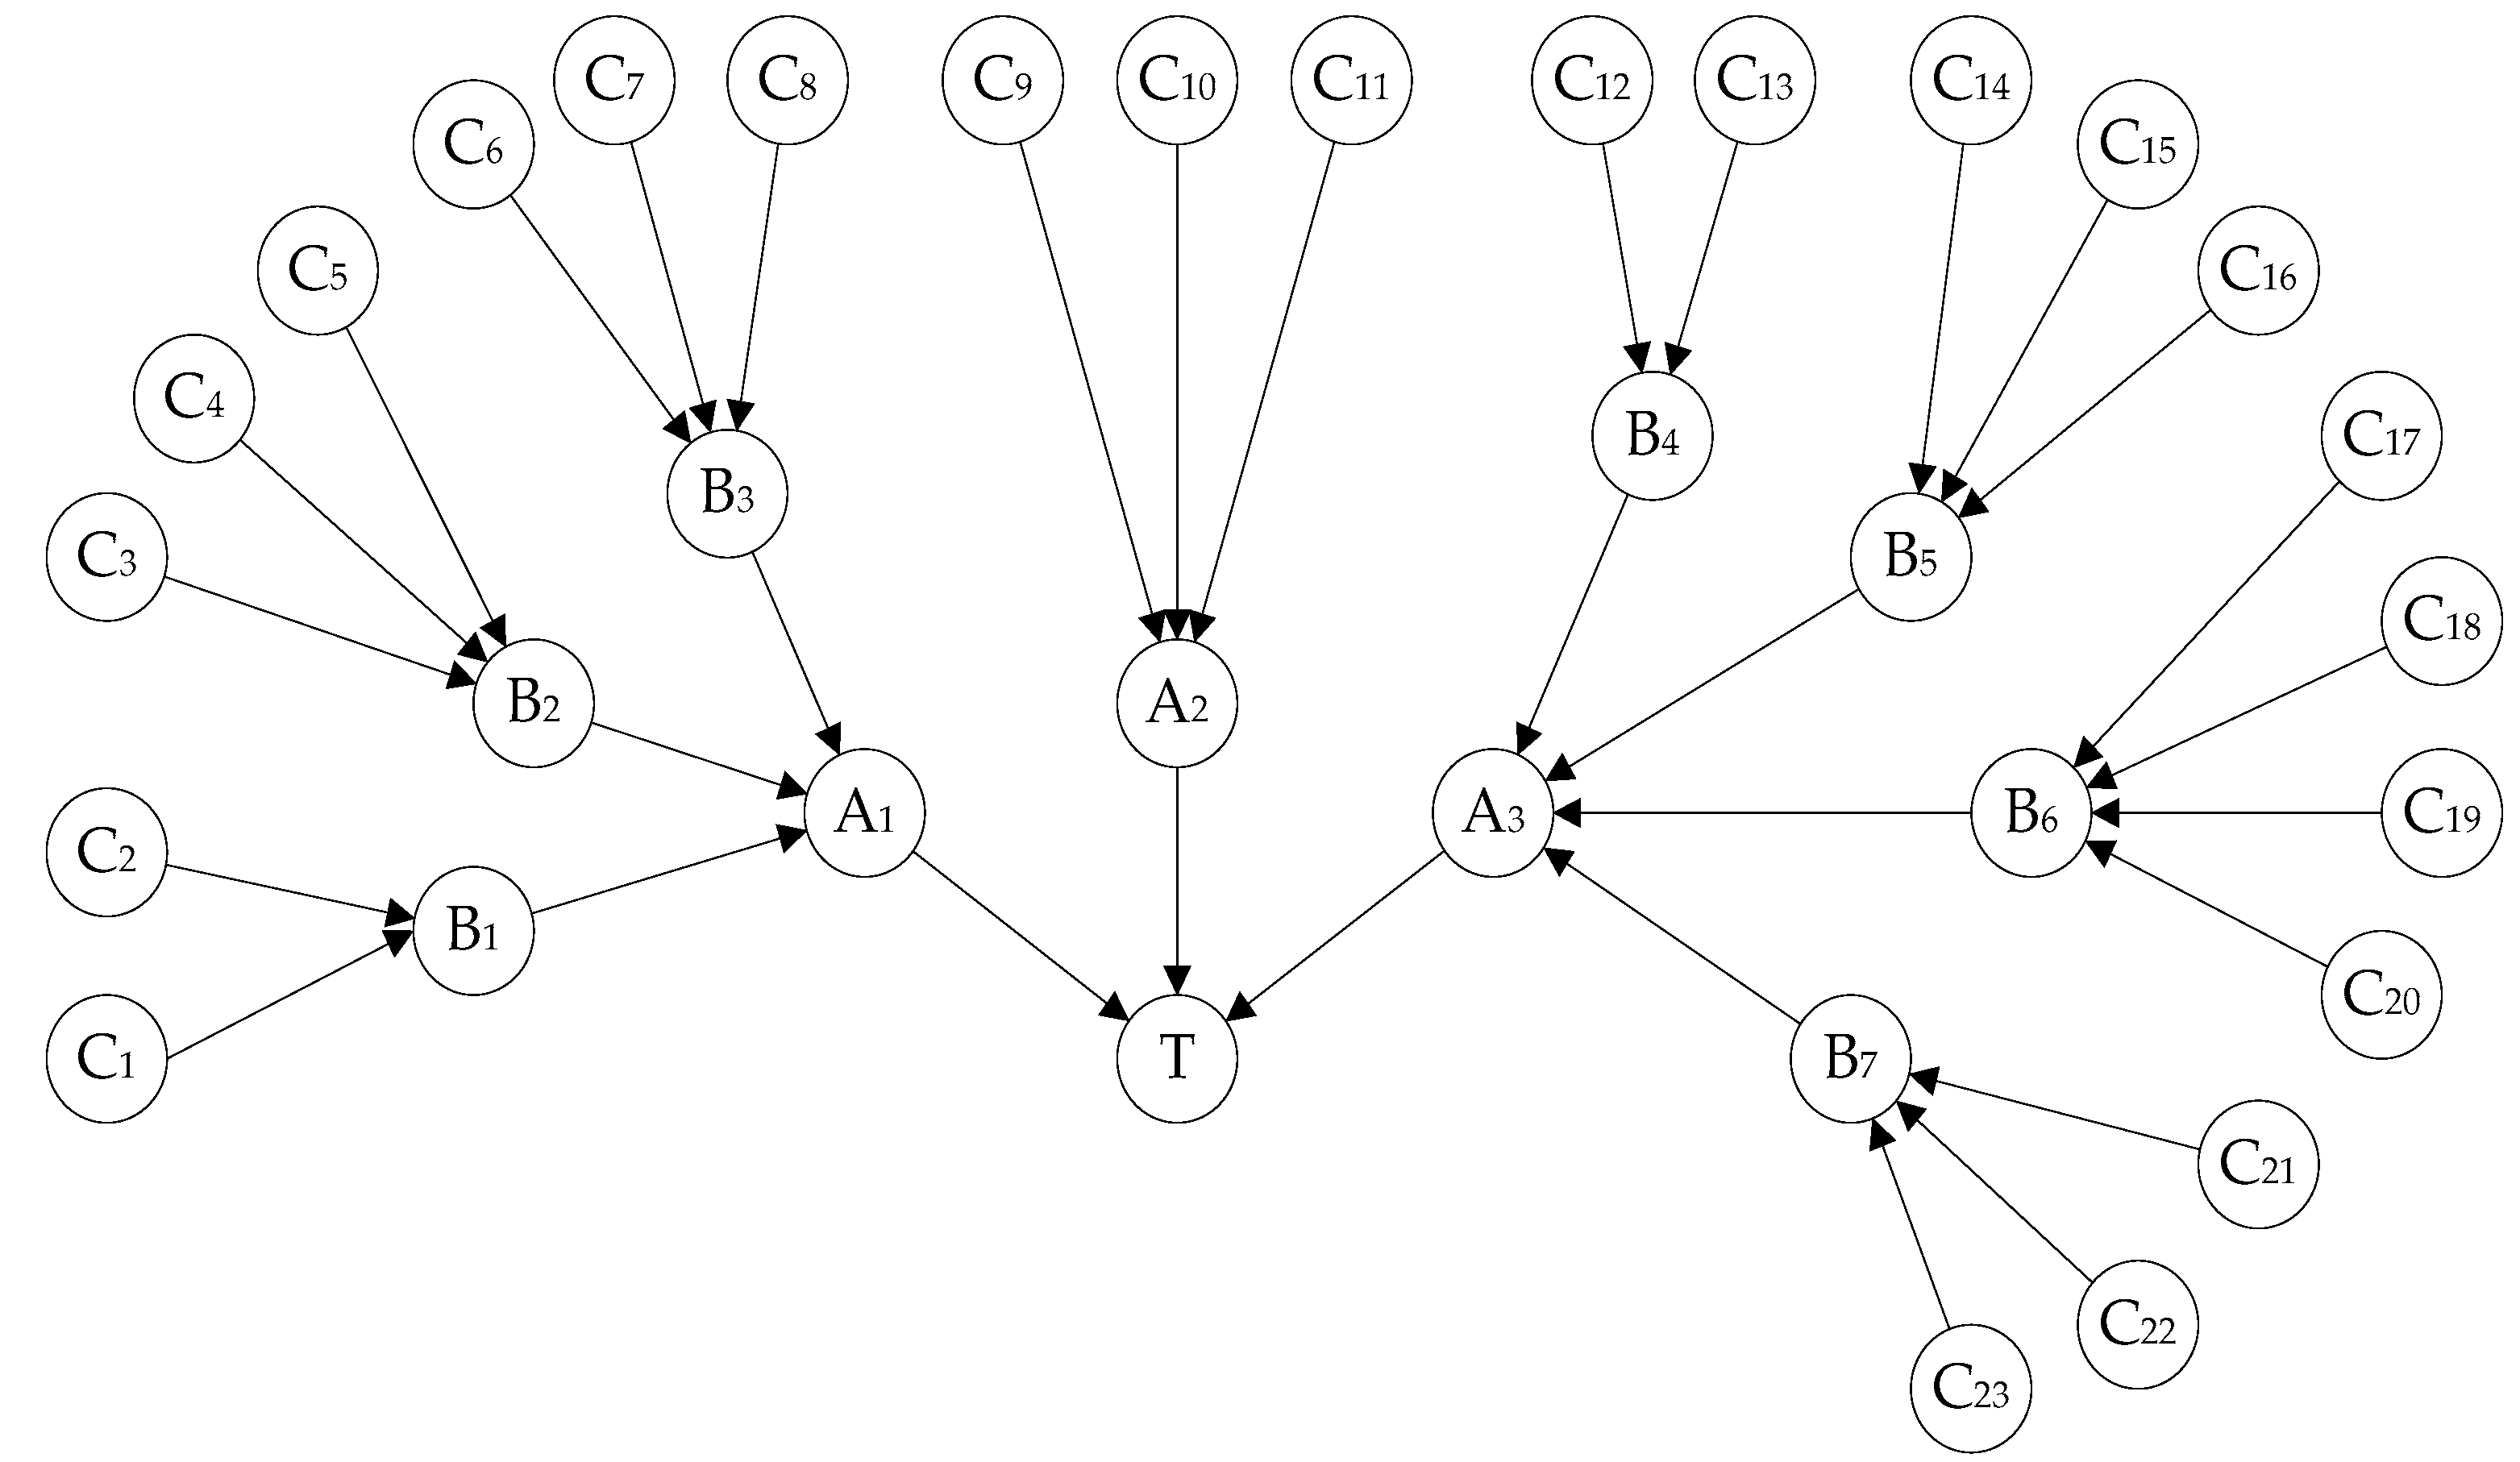
2.2. Reliability Analysis of Cold Chain Distribution System based on Bayesian Network
Figure 3 is the Bayesian network of the cold chain distribution system failure by converting the fault tree model constructed in
Figure 2 according to the certain rules.
Table 3 shows the node names in Bayesian network in the failure of the cold chain distribution system.
In the Bayesian network, all nodes are represented by
xi (i=1, 2…, n) and the state of each node is represented by (0, 1), then,
2.2.1. System Reliability
The prior probability of the root node in the Bayesian network is generally obtained through the historical data of the information system and the work log of the operators. When the historical data is sufficiently rich, the frequency of occurrence can be regarded as the prior probability. However, when the data is missing or difficult to count, the prior probability of the root node can be obtained by fuzzy evaluation method.
where, π(T) means the father nodes of node T, π(y
1, y
2…y
m) means the father nodes of node y
1,y
2…y
m respectively. So, the reliability of the cold chain distribution system is R = 1 − P(T = 1).
2.2.2. Posterior Probability Inference
In the case where the cold chain distribution system is known to be failure, the probability of each factor causing the system failure can be determined by calculating the posterior probability of each root node.
Under the condition that the influencing factors are faulted, the probability of the system failure can be judged by calculating the conditional probability.
2.3. Reliability Allocation of Cold Chain Distribution System for Fresh Agricultural Products
The reliability cost function describes the functional relationship between the reliability and cost of the system, including the human resources, materials and financial resources needed to improve the reliability of the unit. In order to solve this problem, scholars have proposed a generalized reliability cost function [
33], which has the following properties:
If , indicates the cost of reliability of i-th unit, Ri increasing from to , then:
, which means the cost of improving the reliability should be non-negative;
, which means the cost of improving the reliability from to is same as the cost of the of improving the reliability from to and from to ;
is a monotonically increasing function, and the higher value of reliability improvement, the higher the cost;
The cost will be infinite if the reliability is increased to 1.
According to the characteristics of the generalized reliability cost function, foreign scholars proposed a reliability cost function based on feasibility.
The reliability cost of unit i is
Ci (Ri, fi, Ri, min, Ri, max), then
where,
fi indicates the feasibility of improving the reliability of the unit
i, and its value is between 0 and 1. The larger the value is, the greater the feasibility of improving the reliability of the unit.
Ri,max indicates the maximum reliability value that the unit
i can be achieved according to the prior art.
Ri,min indicates the current reliability value of unit
i;
Ri is the reliability value assigned unit
i with a value range between
Ri,max and
Ri,min.
Feasibility refers to the difficulty of improving system reliability. For the quantification of feasibility, many studies have adopted the weighting factor method. This research determines the feasibility of each factor from the three aspects: the degree of standardization, the difficulty to detect the fault and maintainability. The weight of the feasibility indicators and each index of factors are scored by experts based on the below tables [
34].
Table 4 shows the definition of the judgement matrix, which a
ij indicates the degree of impact on the cost between the i
-th indicator and the j
-th indicator.
Calculate the weight vector
and the largest eigenvalue
of matrix A, and check the perform consistency on matrix A, calculate the consistency index is
. Then calculate the consistency ratio
according to the random consistency index RI in
Table 5. If
, then matrix A meets the consistency requirement. On the contrary, the expert needs to re-rate (
Table 6).
The weighted sum is obtained by scoring the three indicators of each factor to obtain the total score
of the factors:
and the feasibility is
According to the analysis in the last section. The factors with higher probability importance have greater impact on the system reliability. Therefore, more attention should be paid to the factor with high probability importance during the optimization. That is to say, it should spend more resources to optimize the factors with high probability importance. So, this paper combines the probability importance with the constraint of reliability allocation, and proposes the reliability cost function,
is the normalized probability importance of the unit i, which is between 0 and 1. It can be seen from the equations that for factors with higher importance, the lower limit of the reliability value assigned is higher than the factor with lower importance.
3. Numerical Example and Results
3.1. Reliability Analysis of Cold Chain Distribution System for Fresh Agricultural Product
Based on the reference [
26], this research combines expert opinions to obtain the prior probability of the root node with faulted state in the Bayesian network, as shown in
Table 7. In the actual circulation, even the influencing factors are faulted, it does not necessarily lead to the cold chain distribution system failure. For example, when the pre-cooling operation is not standardized, there is a possibility that the fresh agricultural products are not rotten. Therefore, in constructing the conditional probability table of intermediate nodes in the Bayesian network, this research adjusts some conditional probability table based on the fuzzy evaluation method. Not all the intermediate nodes’ conditional probability tables are transformed according to the logic gated in the fault tree.
Appendix A gives the conditional probability table for each intermediate node and leaf node.
The probability of failure of the cold chain distribution system is:
Therefore, the reliability of the cold chain distribution system is R = 1 − P(T = 1) = 1 − 0.2312 = 0.7688, that is, at the current level, the probability of normal operation of the system is 76.88%, and there is a 23.12% probability that the cold chain distribution system cannot complete the scheduled delivery task within the specified delivery time.
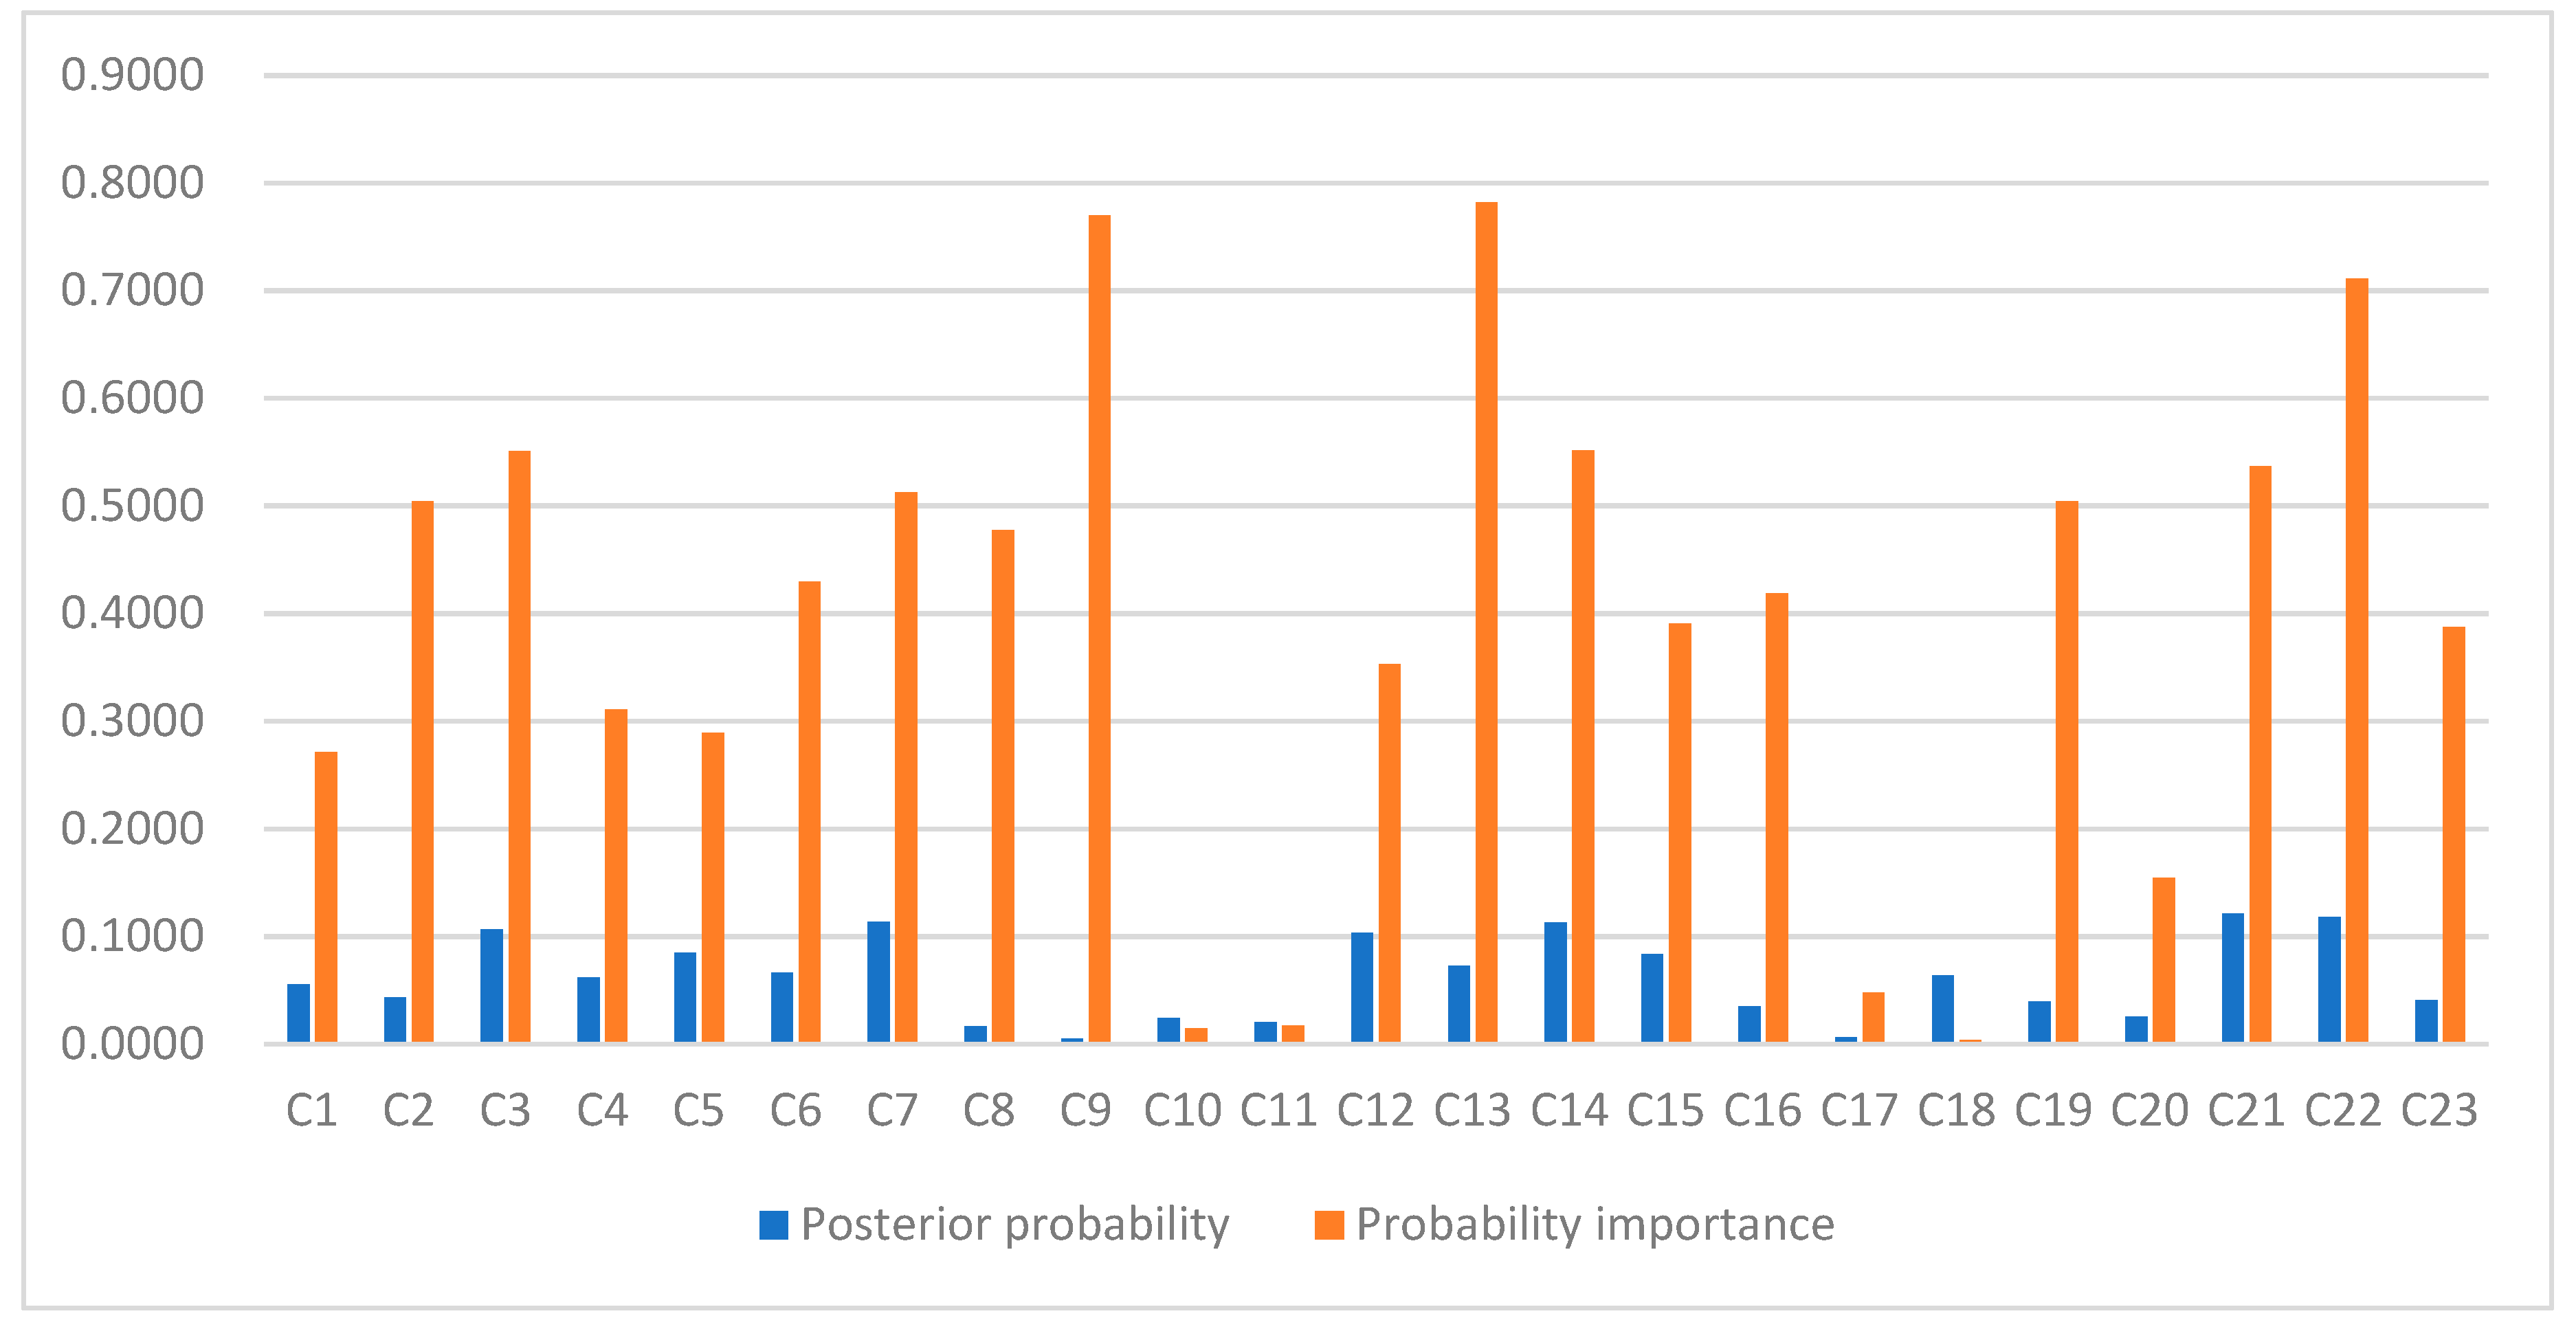
Then the posterior probability value and probability importance value of each node are calculated according to Equations (3) and (4), as shown in
Table 7, and
Figure 4 shows the comparison between them.
As can be seen from the above figure, the probability importance of the root nodes C13, C9, C22 are relatively high, which means, pre-cooling equipment breakdown, information system error and vehicle refrigeration equipment breakdown are the key factors affecting the reliability of the cold chain distribution system. By comparison, it can be found that the main factors leading to the failure of the cold chain distribution system do not necessarily have a great impact on system reliability. Therefore, the posterior probability is suitable for the purpose of detecting system malfunction, and the probability importance is more suitable as a basis for judging the reliability of the system.
3.2. Reliability Allocation of Cold Chain Distribution System for Fresh Agricultural Product
In the Bayesian network of cold chain distribution system failure, since the bad weather, traffic accidents and vehicle breakdown are emergency events that cannot be subjectively assigned reliability value, these three factors are removed. Then, the minimum reliability value R
i,min for each factor is set to 0.85, the maximum reliability value R
i,max is set to 0.99, and the expected system reliability value R* is set to 0.80. The scores of the three indicators are shown in
Appendix B.
According to Equations (5) and (9), combined with particle swarm optimization algorithm, the optimal results can be obtained by MATLAB.
Table 8 shows the allocation results based on the feasibility and probability importance.
It can be seen from the table that although the optimization results of the two methods have reached the expected system reliability, the cost of adopting the optimization model based on probability importance is lower than the other one, which proves the feasibility and effectiveness of the model based on probability importance.
4. Discussions
Through the analysis in the previous section, the first three nodes with the highest probability importance are C13, C9 and C22. In the feasibility-based reliability allocation method, the nodes C13, C9 and C19 are assigned the highest reliability value, which is 0.97799, 0.9775, and 0.97737, respectively. While the reliability allocation method based on the probability importance assigns the highest reliability to the nodes C22, C9 and C13, which is 0.98106, 0.98058 and 0.97999. Although the former method has also assigned relatively high reliability to the nodes C13 and C9, the reliability assigned to all factors are at the same unit level, and the difference is not large. However, the reliability allocation model based on the probability importance assigned the higher reliability to the factors with higher probability importance while improving the reliability of other factors. Therefore, when the reliability of the system satisfies the reliability index, the reliability allocation method based on probability importance requires less cost.
Comparing the reliability allocation results, based on probability importance with the reliability of each factor before optimization, it is found that the reliability values of nodes C16, C17 and C19 are lower than those before optimization. This is because the probability importance of these three nodes is low, so it is assigned relatively low reliability value to the nodes. Although both two allocation methods assign a relatively high reliability value for node C9 (i.e., information system errors), they are still lower than the values before optimization. This is due to the high reliability of the node before optimization. The cost will increase greatly if it keeps assigning higher reliability to this node, but the improvement of the system reliability is not obvious. Therefore, for enterprises, the reliability improvement of cold chain distribution system has basically dynamic characteristics, and it would be better to calculate the probability importance value again after optimization.
5. Conclusions
In this research, the fault tree model of the cold chain distribution system of fresh agricultural products is constructed and transformed into Bayesian network to evaluate the reliability of the system. Then, we identify the key factors affecting the system reliability through calculating the probability importance, while previous researches only compared the posterior probability value to decide the key factors affecting the system reliability. Through comparing the posterior probability value and the probability importance, it shows that the posterior probability is suitable for the purpose of detecting system malfunction, and the probability importance is more suitable as a basis for judging the reliability of the system.
To improve the reliability of the cold chain system, this paper constructs an optimization model with the object of minimizing the reliability cost and the constraint conditions of the expected system reliability, and proposes an improved reliability allocation model, based on probability importance, which costs less than the primary method based on the feasibility.
Due to the limited data, part of the data in this paper is obtained through a fuzzy comprehensive evaluation. With the development of the Internet of Things, real-time monitoring and control of the entire distribution process environment can be carried out. The follow-up work can study the reliability of the cold chain distribution system based on the collection of historical data. The research can be further improved by establishing the optimization model through converting the feasibility into the actual reliability cost coefficients to reduce the delay of the cold chain distribution and the loss in the circulation process, as well as to improve the distribution efficiency.

