2. Literature Review
An effective tax administration system should bring sufficient revenues to the state treasury [
9,
10,
11], it should not be an administrative burden and have to be sufficiently transparent. The optimal tax system emphasizes two aspects: justice and efficiency. We must also point out that for the creation of a quality business environment necessary for economic development, social, cultural and other factors besides those economic are important [
12]. In this context [
13] add that optimism of the economic system participants is also substantial for its optimal functioning.
For establishment of an effective tax system that complies with international standards, it is necessary to strive for the implementation of ongoing reforms in the tax sector, including the change of image of tax and customs officers [
1,
14,
15,
16,
17,
18,
19].
Hence, the implementation of reforms in tax and customs system in response to time challenges is crucially important [
1,
2,
19]. The most important objectives of every country are public administration, security of the country, political stability, sustainable development of economy and tax system takes on a unique role in ensuring the economic stability and progress [
8,
14,
19,
20,
21,
22]. The requirements to tax and customs officers are the same, namely, to be knowledgeable, proactive, innovative, goal-oriented, conscientious, professional and eager for further development of professional skills [
1,
14,
15,
16,
17,
18,
19,
23,
24,
25,
26].
To obtain this objective, it is necessary to ensure appropriate conditions for the business environment in which the tax system of the country significantly contributes [
11,
18,
27,
28]. It is important to emphasize that, in addition to economic (tax system) factors, social, cultural and other factors are important for the creation of a quality business environment that is essential to economic development [
12,
29]. Today’s management should focus on strategic thinking, responsiveness to change and so on [
14,
23,
24,
30]. Emphasis is placed on the greater effectiveness of changing organizations in the context of sustainability [
8,
31].
An optimal tax system puts emphasis on two aspects: Justice and efficiency [
32]. Taxes, from the early beginnings to the present, have been linked to the development of state and political institutions, reflecting changes in society, opinions and the economic situation [
33]. The fact remains, however, that taxes have existed for some time, and they are expected to remain in place for quite some time as they are irreplaceable in the functioning of the economy [
9].
Attributes of satisfaction and dissatisfaction within a specific timeframe provide an objective and unbiased view of the situation [
34]. The link between innovation capacity and increasing performance guarantees the strategic growth of the company and focuses managerial decision-making on the knowledge of innovation outputs [
1,
14,
15,
16,
17,
23,
24,
30].
The EU public sector reforms in recent years have demonstrated an over-reliance on accounting-based financial measurements, which has essentially created a sort of “hierarchization” of performance situation [
25,
33]. These researches demonstrate whether and how this predominance only on accounting-based financial measurements leads to negative consequences in the evaluation (and management) of public sector organizations: First, because in definitive governments, performance should be assessed coupling financial parameters with non-financial measures and qualitative judgments; and second, for the lack of a systemic approach, financial performance should not be the ultimate objective of public management but instead an instrument to evaluate the financial comparability of various priorities to pursue such as the public value, social, environmental, etc. [
33,
35,
36,
37,
38].
The management of the tax administration in Slovakia is governed by the principles established after 1989. Despite the efforts made in recent years to reduce the number of employees, the financial administration in Slovakia can be considered inefficient in terms of increasing the competitiveness of the state. The general tendency of the present is to complain of an inflexible, reluctant bureaucratic apparatus responsible for the unwillingness of some businesses to fulfill their tax obligations and ever more stringent measures introduced the state [
39]. This situation ultimately leads to the aforementioned decrease in the competitiveness of the state and the decrease of its credibility in the eyes of citizens [
40]. The most important objectives of every country are public administration, security of the country, political stability, sustainable development of economy and tax system, which play an essential role in ensuring economic stability and sustainable progress [
1,
8,
9,
15,
16,
21,
41,
42,
43].
“Economic policy” sets the following objectives in the area of tax administration: Simplify tax legislation, to amend parts of tax laws that allow ambiguous interpretation [
2], simplify the tax system, reduce direct taxes, shift from direct taxes to indirect taxes in appropriate cases, reassess property tax rates, unify income tax rates, analyze the possibility of introducing an equal tax, strengthen tax revenues of municipalities, set tax revenues of the higher territorial units, ensure strict, direct, fair and effective tax collection, reduce tax evasion [
44,
45] and create a new system of horizontal financial equalization [
39,
46].
The reason for the reform of public finances is the completion of public administration reforms. The Strategy for the Development of the Financial Administration of the Slovak Republic (Ministry of Finance, 2013) states that in the light of the current significant macroeconomic changes, the consolidation of public resources and the economic growth is a particularly difficult task. Financial administration plays a key role in securing the public resources of the Slovak Republic. Its principal role is to ensure public resources as efficiently as possible from the point of view of revenues as well as from the point of view of operating costs necessary for its activities. The title of the reform is UNITAS (the unification of the collection of taxes, duties and charges). The government of the Slovak Republic has, as a part of its program for 2012–2016, identified as one of the priorities the completion of the Tax Administration Reform through the UNITAS project, the aim of which is to unite a collection of taxes, levies and duties and sustainable budget [
47]. The benefits of the UNITAS reform are expected at two levels. The first represents the benefits for taxpayers, especially when we talk about the reduction of the administrative burden and agenda. The second level presents benefits to public administration, like reducing tax evasion while reducing the costs of tax collection and inspections [
32,
47].
The current state of tax management can be defined as a two-step management. However, by imposing some competencies of the Financial Directorate of the Slovak Republic to the Tax Directorate (TD) and the Tax Authority (TA), we are in fact talking about three-step management. This process is justified by the need for effective management of eight tax authorities, which is not possible to secure from one center. It is assumed that such management of the financial administration in the Slovak Republic is not suitable for many reasons. Therefore, in our long-term scientific research, we would like to identify key factors for the successful implementation of the process approach in the management of the financial administration in the Slovak Republic with a proposal for a methodical procedure for the implementation of the process approach in the management of the financial administration focusing on the creation of transfer pricing and tax harmonization models in the conditions of the EU [
32].
“Slovakia is the eighth most attractive European country in terms of tax systems. KPMG International, based on a survey of European business representatives’ views on the attractiveness of domestic tax regimes, ranked Cyprus, followed by Ireland and Switzerland to be the leaders in the field. All three countries received a high rating thanks to uniform interpretation of tax legislation, minimum changes in tax laws and relatively low tax rates” [
32]. The survey has been conducted by KPMG International, and its results reflect the views of more than 400 tax experts in international companies across Europe. The benchmarks are attractiveness, administrative difficulty, consistency, long-term stability, the scope of legislation, rates and relations with tax authorities. According to the survey results, the least attractive area is the scope of tax legislation. The ranking of states is determined based on “absolute attractiveness”, which is calculated as the difference in the percentage of respondents favoring the key aspects of tax systems and the percentage of dissatisfied respondents [
32]. However, total tax harmonization in the EU is an impossible task as each country has its specifics [
9,
48].
Improvements for taxpayers—the taxpayer fills in the overview of social and health insurance contributions and taxes electronically and the state, based on a unique identifier, redistributes funds to individual institutions [
32].
In the context above mentioned the aim of the paper was to analyze the management system of the financial administration in Slovakia using the key identifiers of the reform assessment and to find critical points that affect the undesirable state of matters. However, the study of Slovakia’s financial administration must be seen in the broader context. The authors based their assumptions on the existing functional organizational structure and system of the financial administration. The authors anticipated the need to change/optimize the organizational structure as well as introduce marketing principles [
27] in order to build a positive image of the financial administration in the eyes of the public. For this purpose, a scientific research survey was carried out. The results reflected the assessment of the current situation and also provided a new scientific view on the evaluation of the reform of the financial administration’s management system in the Slovak Republic as well as its functioning in the context of its non-macroeconomic especially social, technological and process aspects. It was also assumed that the reform of the financial administration will significantly contribute to the efficiency of the system and, ultimately, to the positive perception of taxes and duties.
3. Research Objectives, Data Collection and Methodology
The results of the survey and the presented analyzes will enrich the knowledge and help the people to understand the reform of tax system in the Slovak Republic from the point of view of their main participants, namely entrepreneurs and financial administration offices.
The survey, as well as the selection of the representative sample, was carried out as follows:
Time horizon of the survey: 20/02/2018–20/07/18;
Representative sample: 1500;
Number of questionnaires issued: 4500;
Number of (completed) questionnaires collected: 3624.
The selection representative file (N = 1500) was defined from the basic file (N = 3624), the first selection criterion being a fully completed questionnaire. Subsequently, a random number generator was applied to the base file cleared from incompletely filled out questionnaires. The representative sample was selected using the random number generator on 3624 completed questionnaires to represent roughly the same number of males and females as well as geographic areas—the four largest cities in Slovakia (Prešov, Košice, Banská Bystrica and Bratislava). Respondents responded to the questionnaire on a voluntary basis. The basic characteristics of the questionnaire included gender, age, employment and region of residence. The sample size enabled us to generalize the basic results of the survey on the population of the SR from the age of 18 with a maximum deviation of ±3.1% (Statistical Office of the Slovak Republic).
The actual processing of the research was carried out as follows:
While interpreting the results of analyzes, it should also be borne in mind that all conclusions are based on subjective self-evaluation of respondents, stratified selection and responses of respondents.
The paper presents the views and attitudes of a third, significant group of the population—students. The main research objective was to define the main identifiers of the assessment of the reform of the management of the financial administration of SR using the main indicators of the reform assessment. By decomposing the main goal of the research, the study arrived at the partial objectives:
Define and subsequently analyze the differences in views on the three main targets of the research—entrepreneurs, financial administration authorities and students.
To analyze relations and differences in opinions on the identified key factors of the tax system reform concerning the selected identifiers related to entrepreneurs, financial administration authorities and students.
The research hypothesis was derived from this main scientific objective. The hypothesis was based on the assumption that the perception of effectiveness of the tax administration of the Slovak Republic was statistically and significantly influenced by several key non-macroeconomics especially social, technological and process factors. Many types of research in the world have been devoted mainly to macroeconomic factors in financial tax administration such as tax rate, deductible tax, tax exemption, tax structure and others mostly macroeconomic factors. However, it is believed that many non-macroeconomic factors also affect the optimal and efficient tax system. Based on the research of scientific literature as well as on our knowledge and experience in this research field, the authors focused on several especially social, technological and process aspects and factors (12 factors).
In order to obtain the most relevant data to identify the main indicators of tax reform, a simple questionnaire built on the Likert scale was used. The categories are as follows:
Willingness of the tax office employees;
Competence of the tax office employees;
Tax collection—process/method and simplicity;
Collection of tariffs/customs—process/method and simplicity;
Collection of levies—process/method and simplicity;
Administrative difficulty of the tax and customs agenda;
Time-saving;
Availability;
Electronization/computerization—great user comfort;
Transaction costs;
Postage costs;
Labor costs.
Selected key criteria were created based on the expected benefits of the reform (if implemented). This was qualitative and quantitative research based on the facts associated with the reform (mentioned in the introductory part of the paper). The aim of the survey was to identify the needs and expectations of people most affected by the reform. Besides, the present research spontaneously revealed the need for the reform, its effectiveness and inefficiency. The analysis of individual segments was based on the experience of respondents and the perception of the benefits of tax and customs reform from a citizen’s point of view.
However, the focus of the analysis was on the results of the factor analysis. The factor analysis is a multidimensional statistical method that focuses on generating new variables and attempts to reduce the amount of data (data reduction) with the minimum loss of information. It is based on the assumption that the dependence between the observed variables is due to the effect of a smaller number of non-measurable variables in the background, which are referred to as common factors. These common factors are defined as a linear combination of original variables. The factor analysis’ main objective was to find out and use the structure of common factors that were considered to be the hidden causes of mutually correlated variables with the aim explain the observed dependencies in the best way possible.
5. Research Results
The Cronbach alpha coefficient was used to assess the reliability of the research tool used, i.e., reliability. Its value reached 0.856371. Based on this result, we could say that we did not have to remove any variable to increase the alpha value because the change would be negligible. Since the value of Cronbach’s alpha exceeded 0.7, we could say that the research tool was reliable, and we could continue to work with the data we had obtained.
The aim of the main component method is to simplify the description of a group of mutually dependent characters, namely the decomposition of the source matrix. Each of the main components represents a linear combination of the original characters. The main components are ranked according to their importance—decreasing variance (
Table 1). It follows that most of the information about the variability of the original data was centered in the first major component, and the least information was centered in the last major component.
The
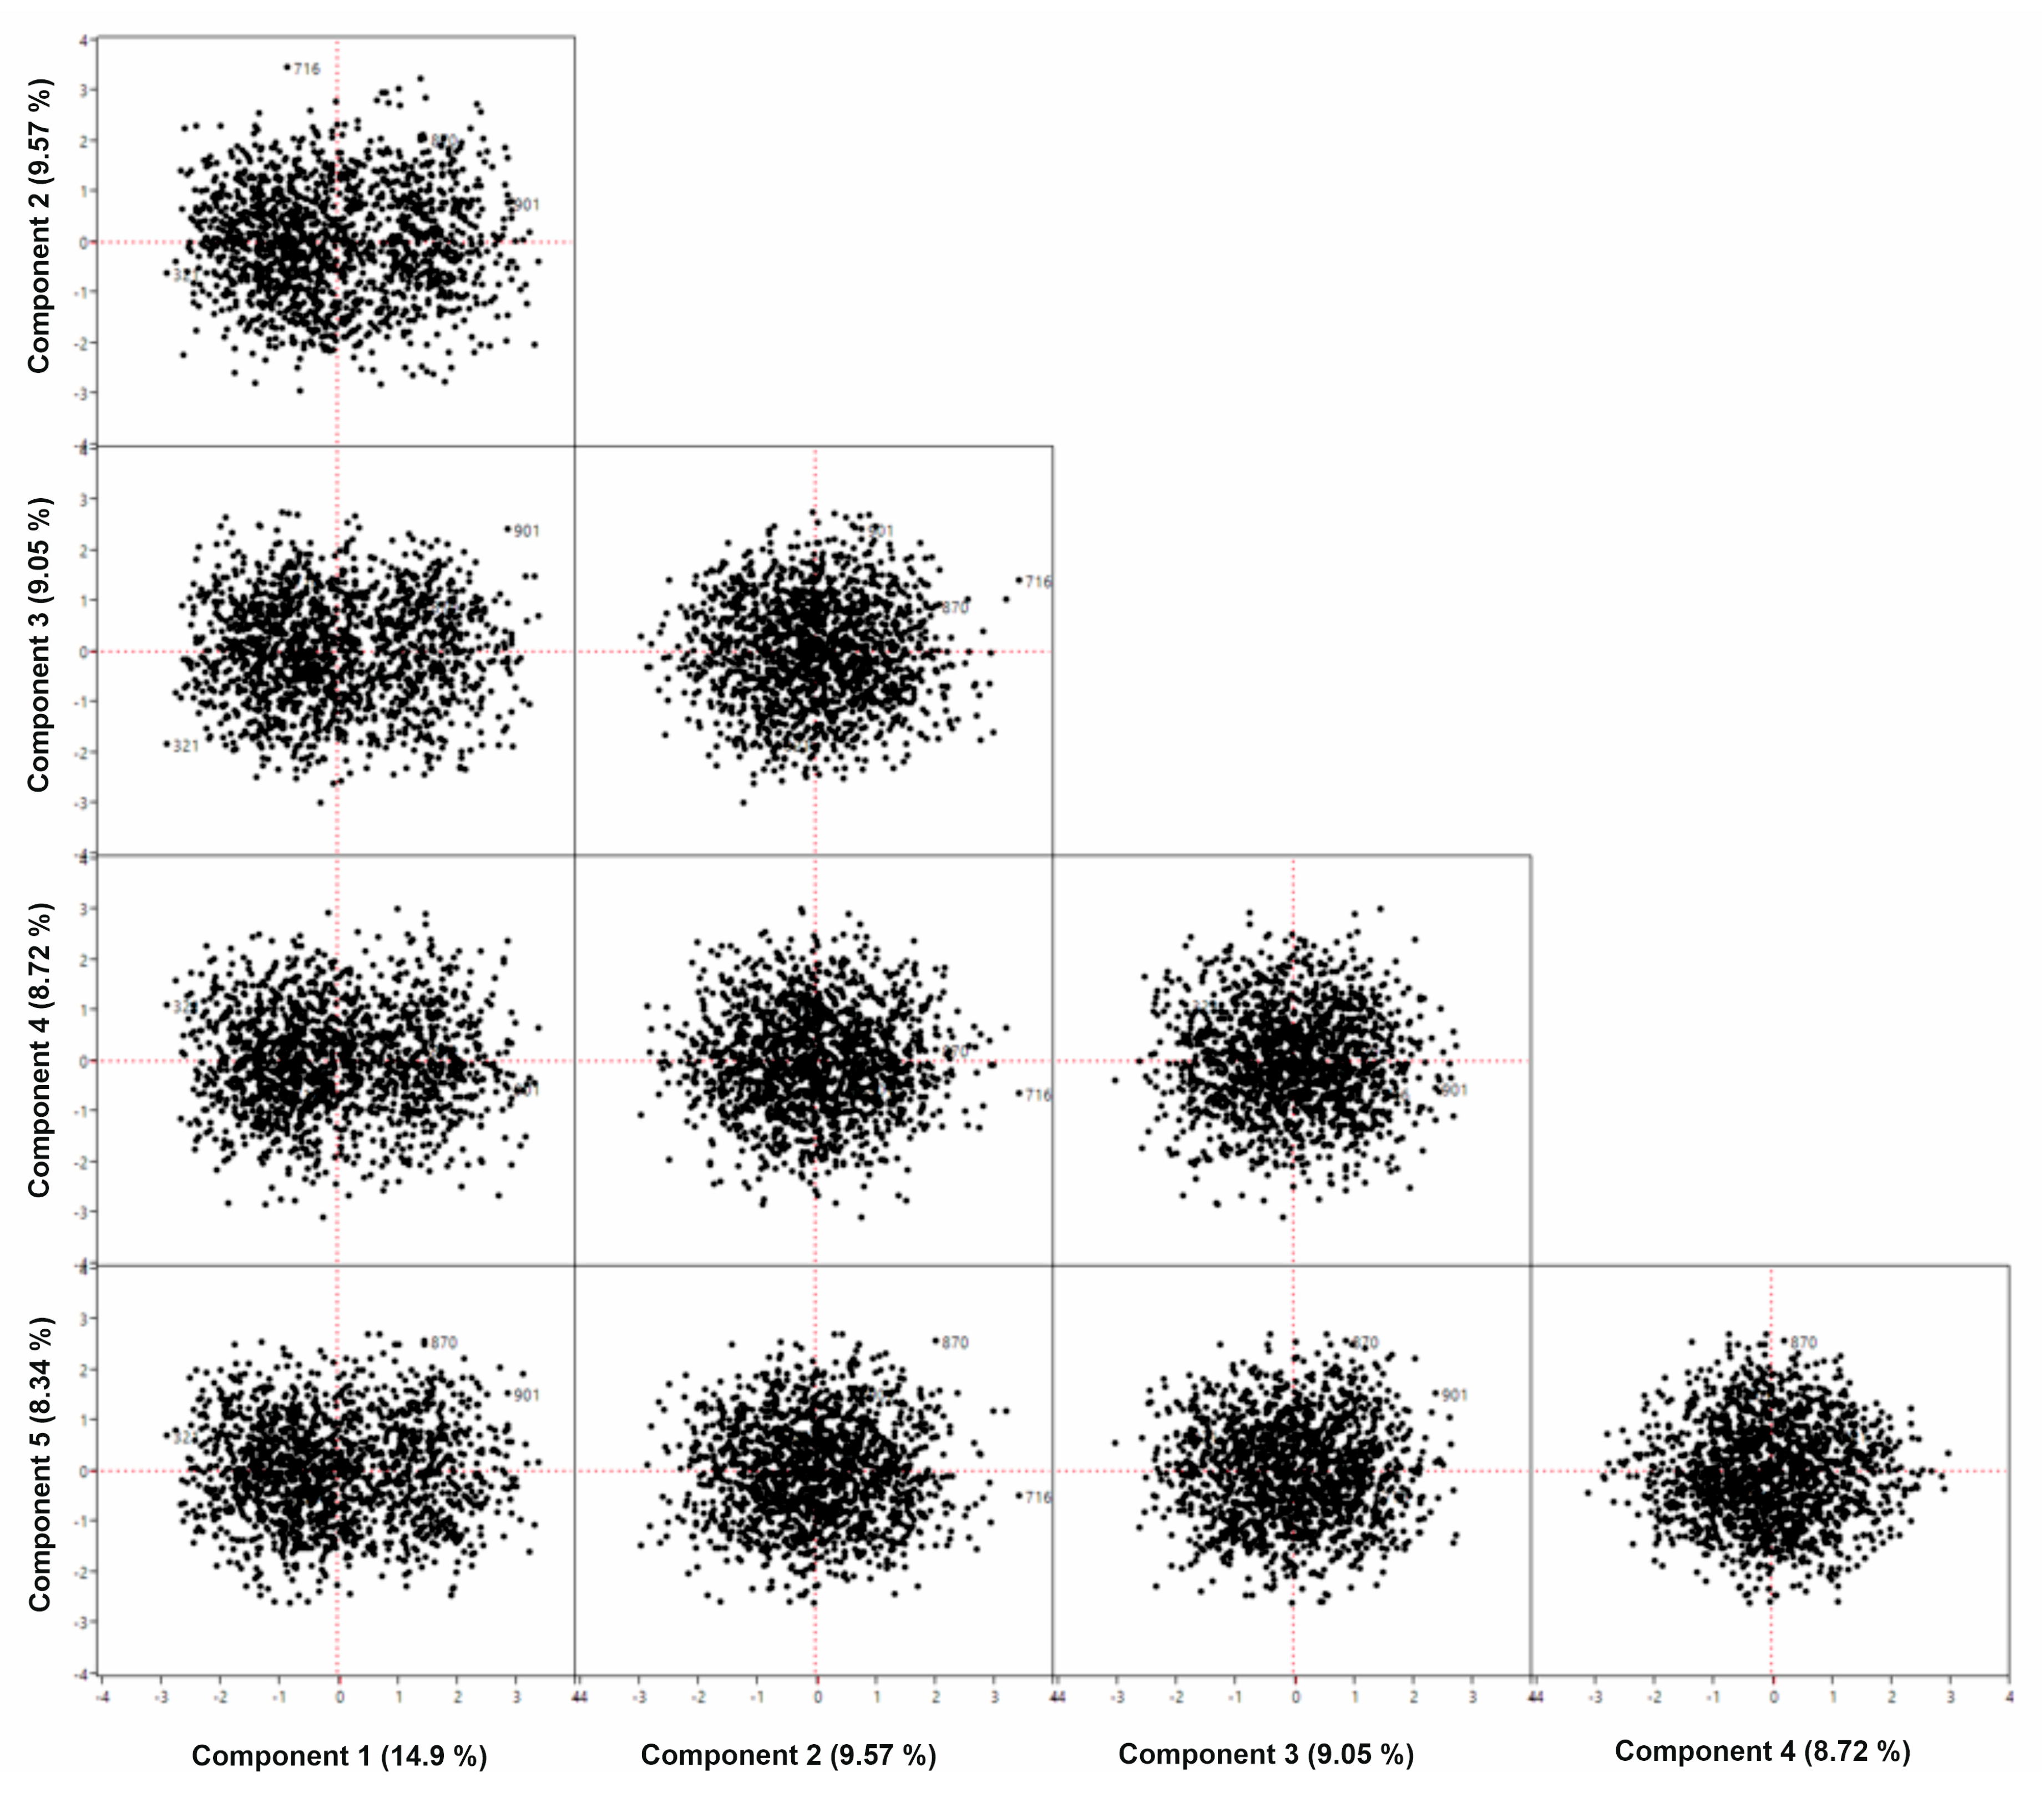
Table 1 shows that the first major component featured 14.949% of the original data variance, the second major component featured 9.572%, the third 9.055%, the fourth 8.719% and the fifth 8.344%. These five major components, whose own number was greater than 1, amass 50.649% of the variance of the original data of the research file. These results would be used to describe and identify factors within the factor analysis. The scatter plot (
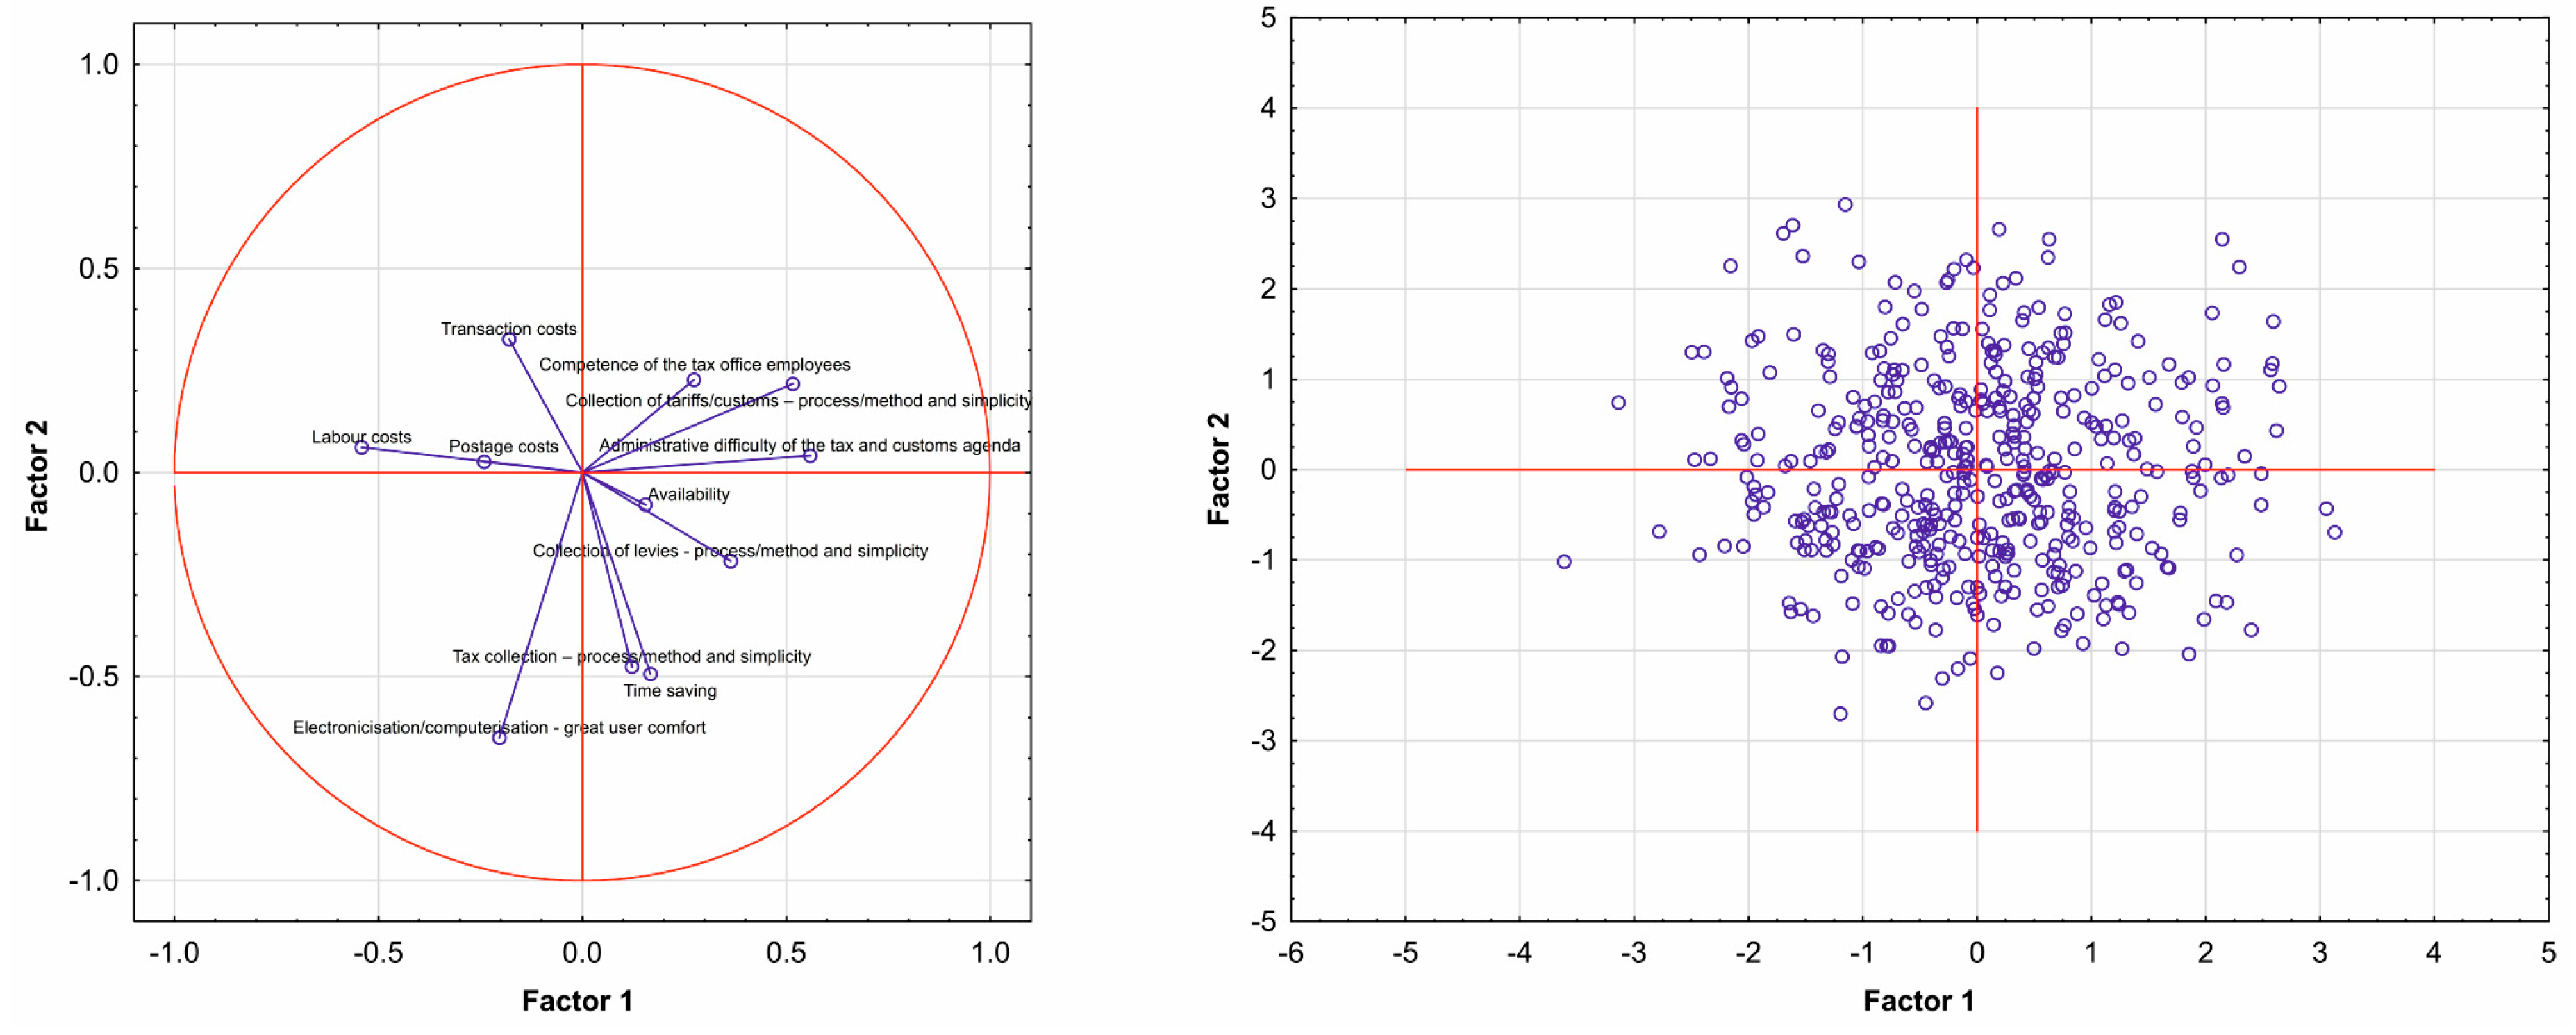
Figure 3) suggests that the first major component, Factor 1, divided respondents’ responses into two clusters separated by a vertical axis. These clusters were more apparent than featuring component 3, component 4 and component 5 in the charts. The scatter plot shows that the combination of components 2 to 5 did not form these clusters as the research objects were centralized approximately in the center of the coordinate system. On the other hand, it is possible to identify outlying respondents in terms of their views on the reform of the tax system (e.g., respondents 716 shows different behaviors in component 1 and component 2, respondents 870 in component 2 and component 3).
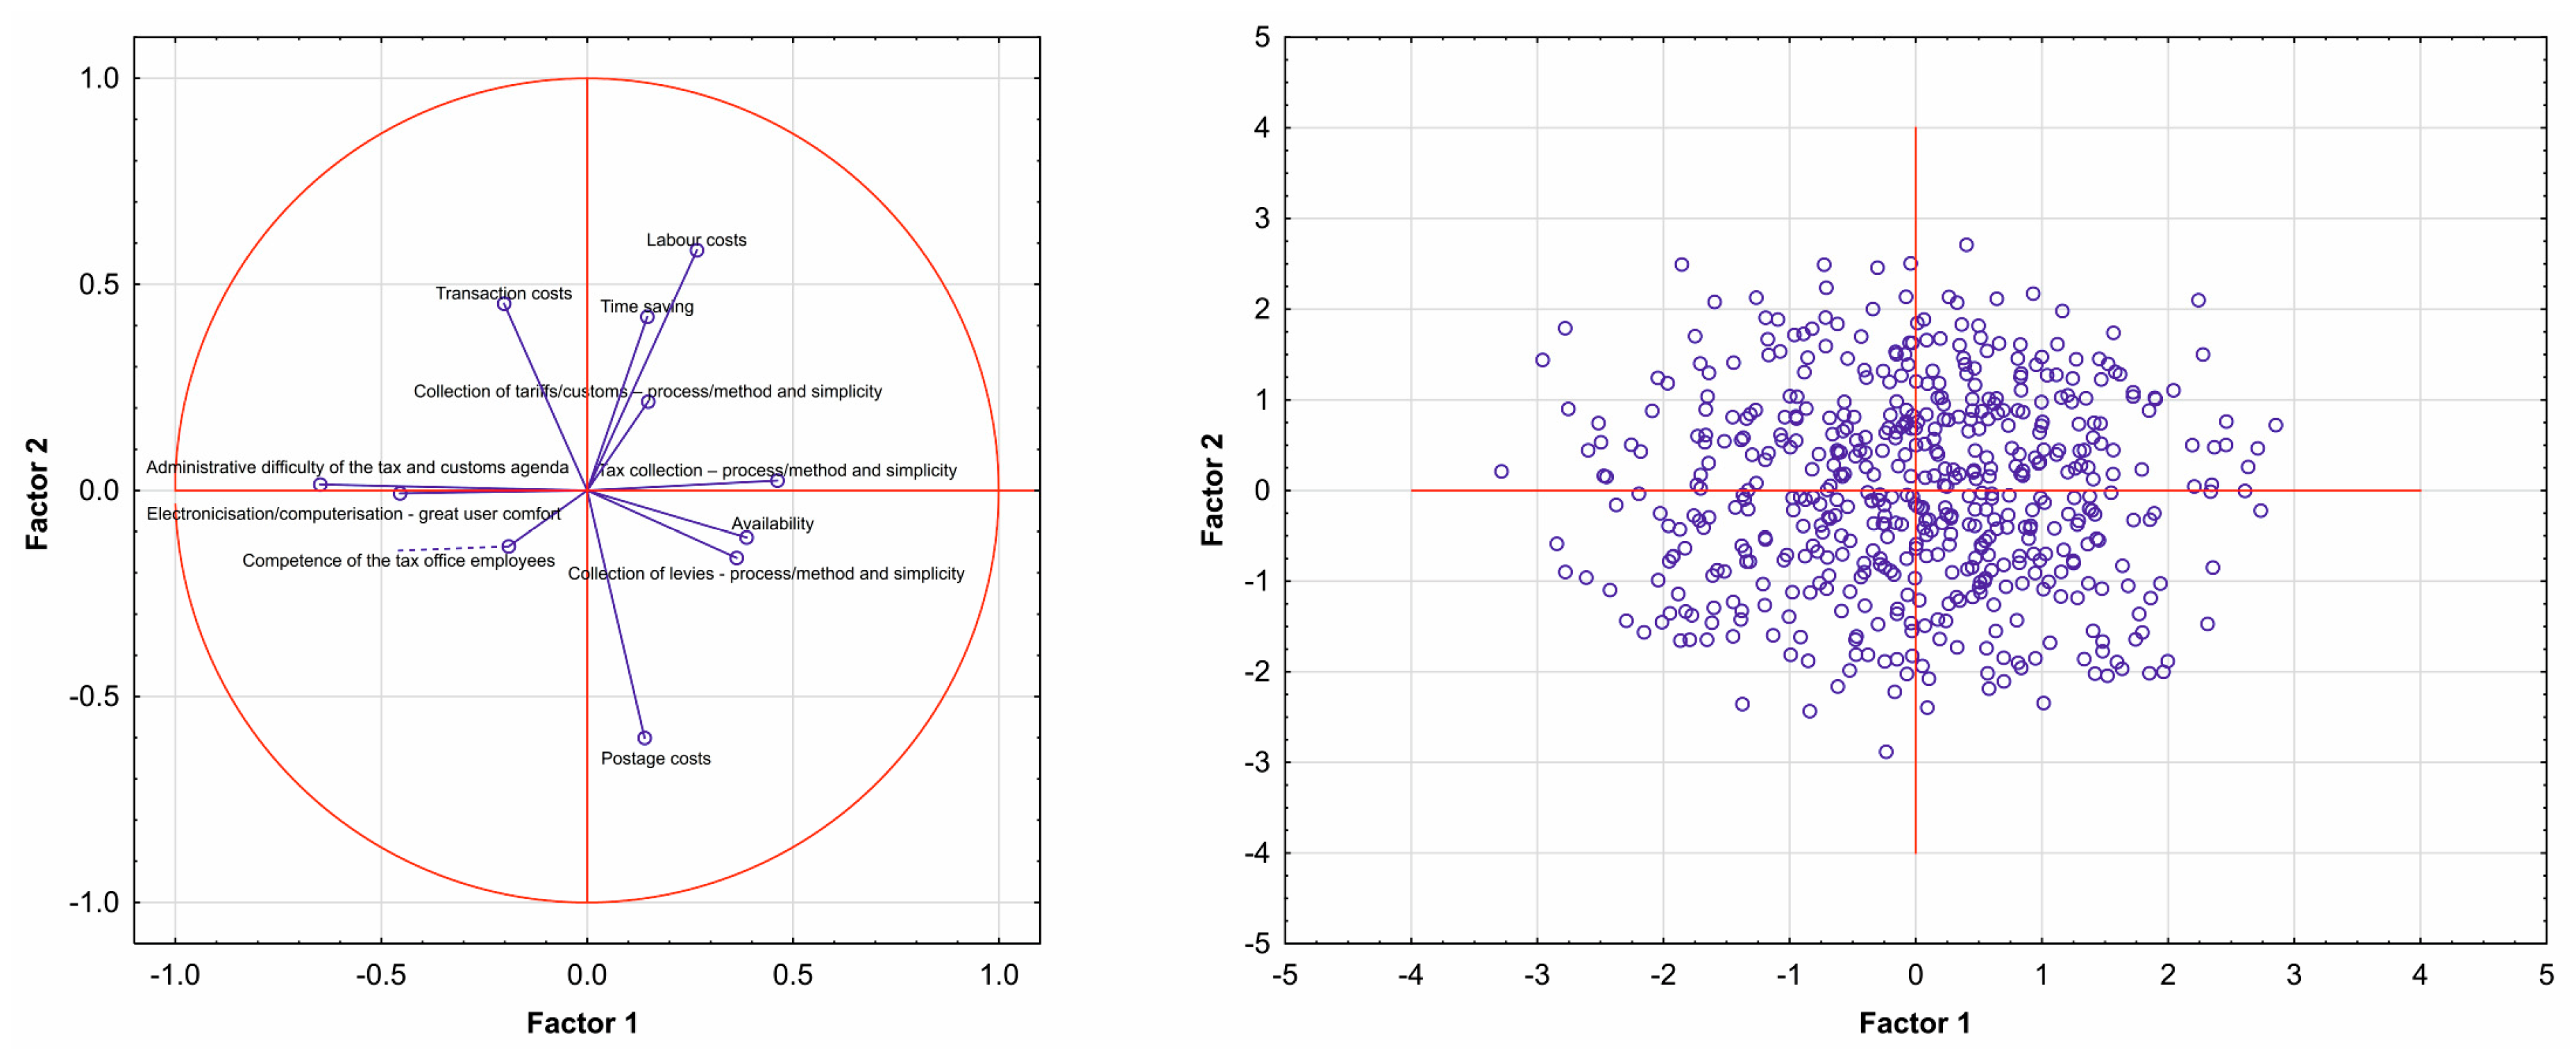
From the scatter plot and the figure containing component weights of the group of respondents identifying themselves as “Entrepreneurs” and the first and second major components (
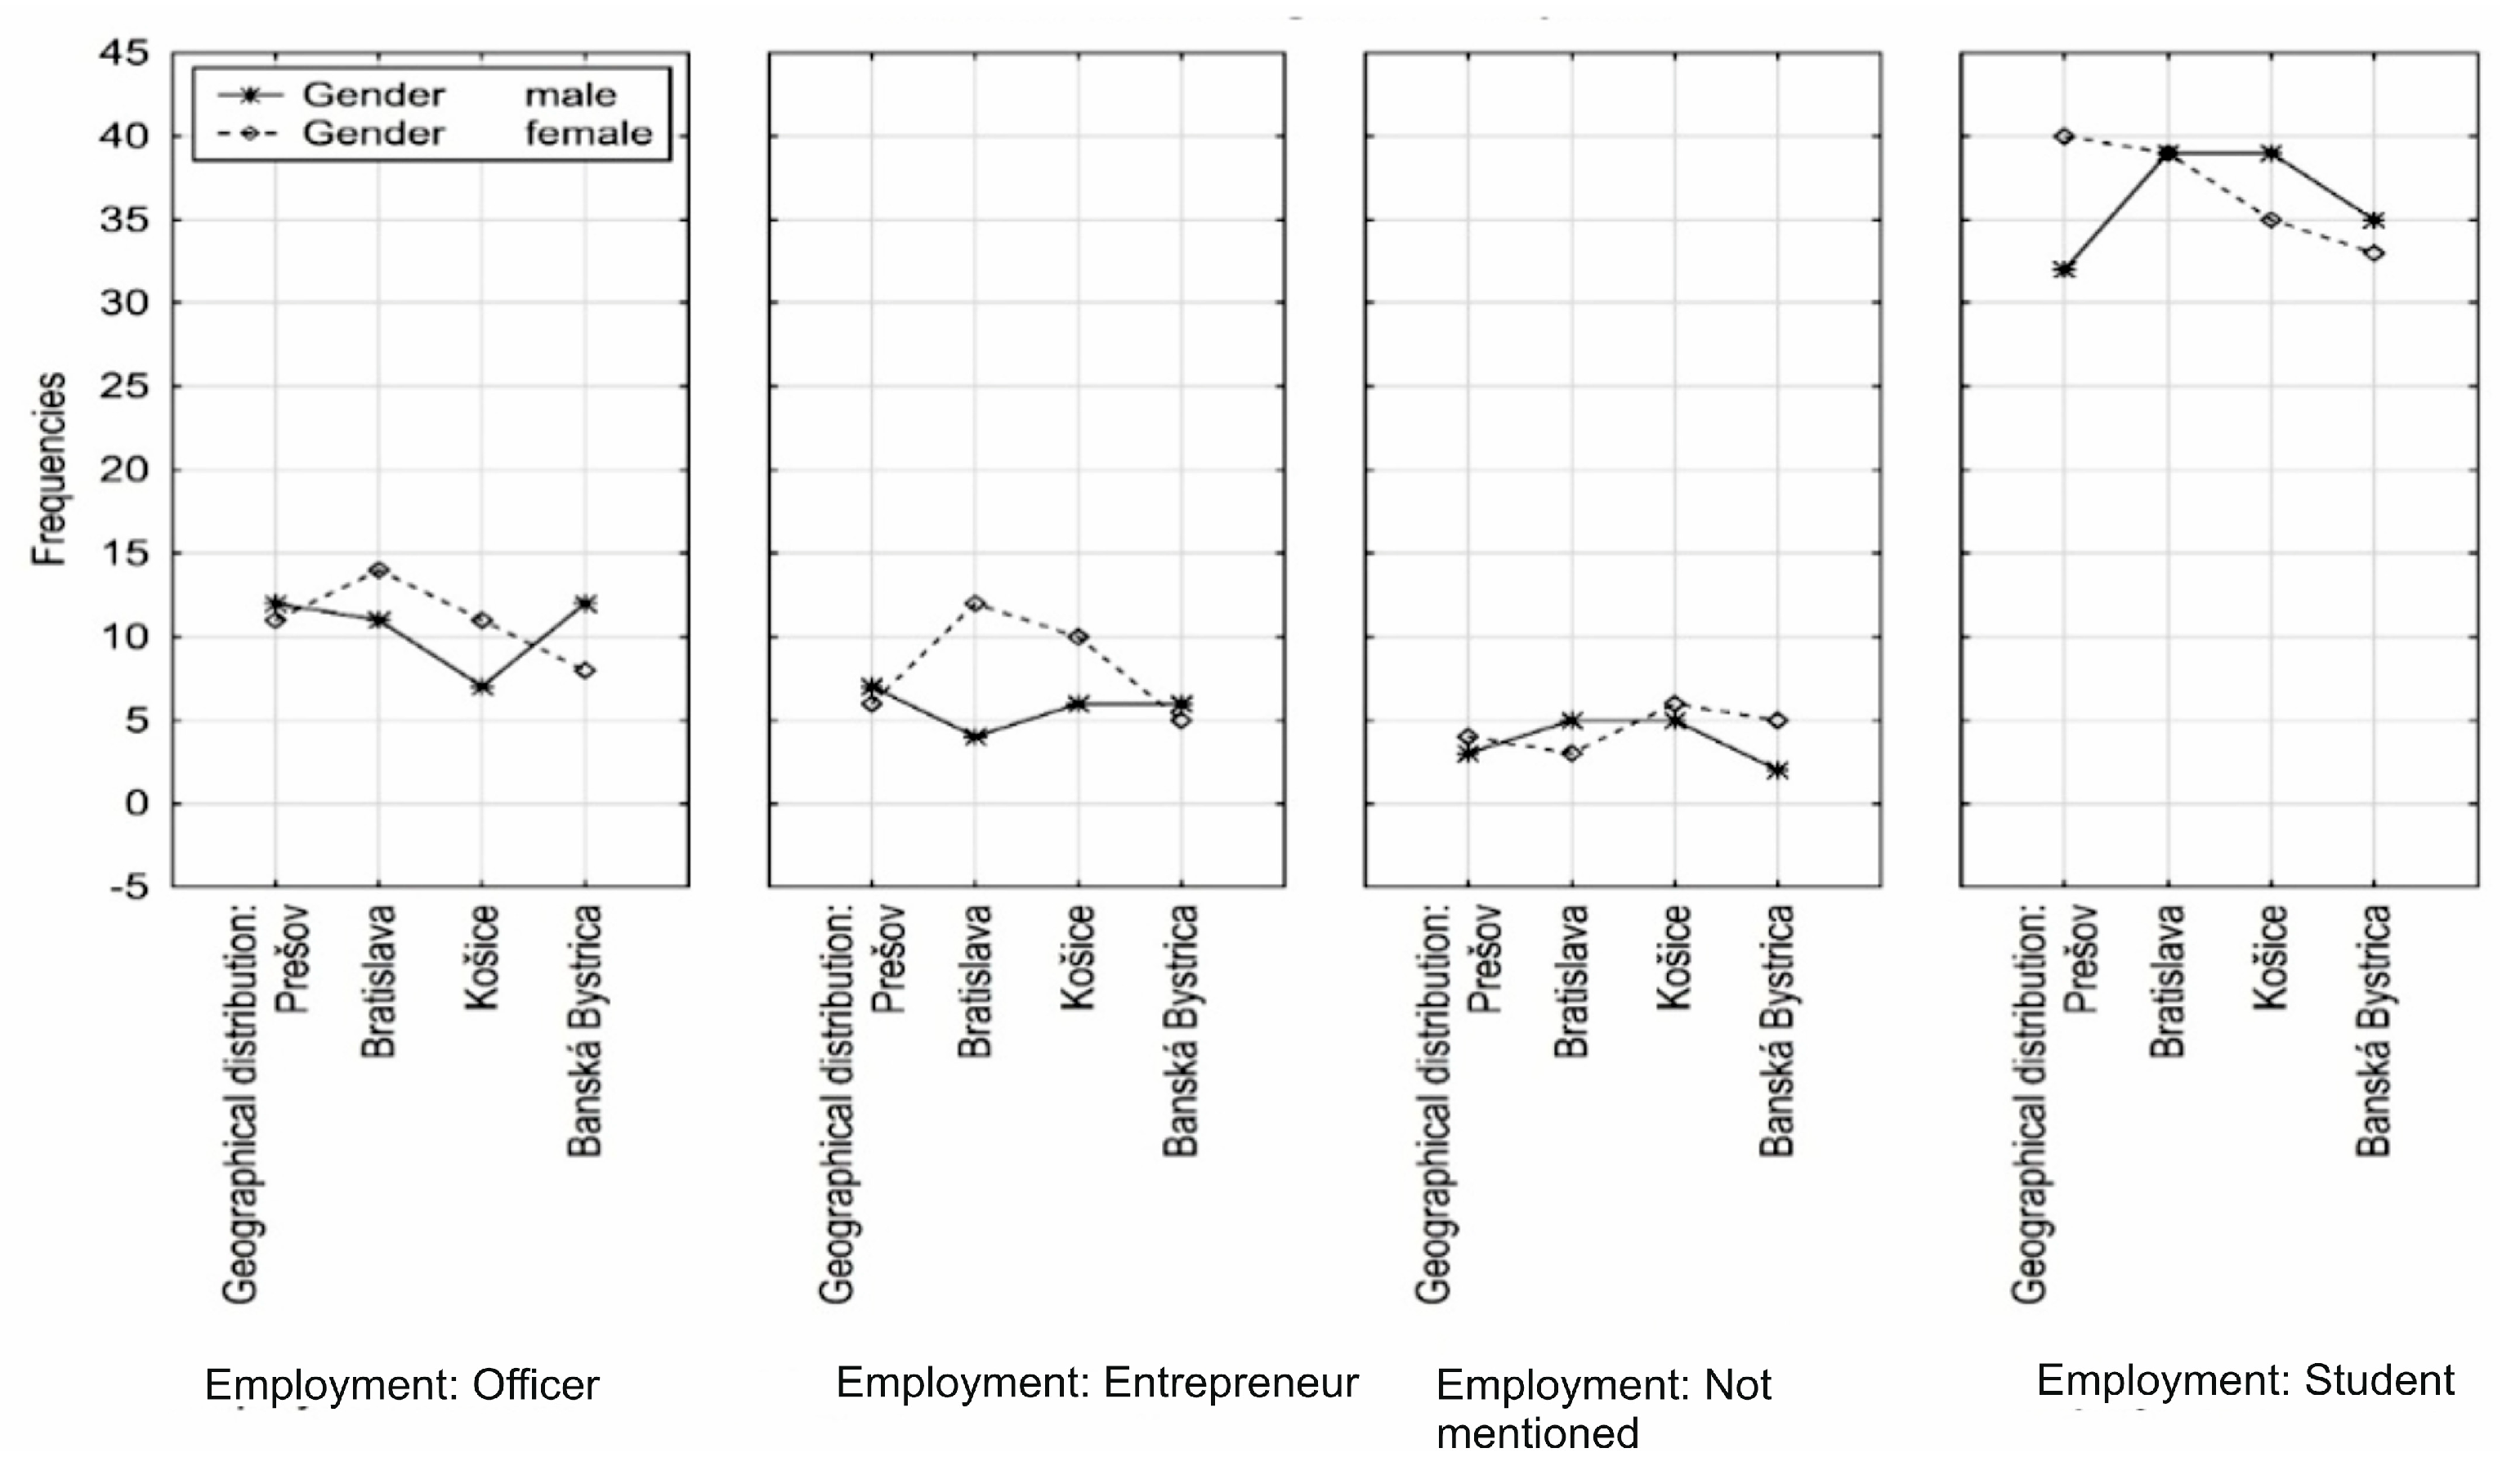
Figure 4), the following conclusions can be drawn. The positive correlation for the group of “Entrepreneurs” was identified for the collection of levies—process/method and simplicity and availability, while these two characters did not correlate with the postage cost. On the other hand, the authors found a negative correlation between transaction costs and postage costs. Considering the second major component, there was a positive correlation between the collection of tariffs/customs—process/method and simplicity, time saving and labor costs. From the point of view of importance, postage costs, labor costs, transaction costs and electronization/computerization—great user comfort were the most important factors for the group of entrepreneurs. It could be further inferred from the figure of the component weights that the least important factor for the entrepreneurs was the administrative difficulty of the tax and customs agenda. The very last two conclusions were closely related to the importance of electronization. It could be assumed that if the computerization of the tax system reached the required level, compliance and convenience, then willingness of the tax office employees would become a pointless indicator. From the scatter plot, it is clear that the attitudes of entrepreneurs towards the items of the research tool were almost homogeneous. However, this could only be said when accepting the assumptions of the analysis that we did not take into account differences between men and women, age categories and geographical location. These assumptions form the basis for the conclusions drawn for the group of clerks and students (
Figure 5 and
Figure 6).
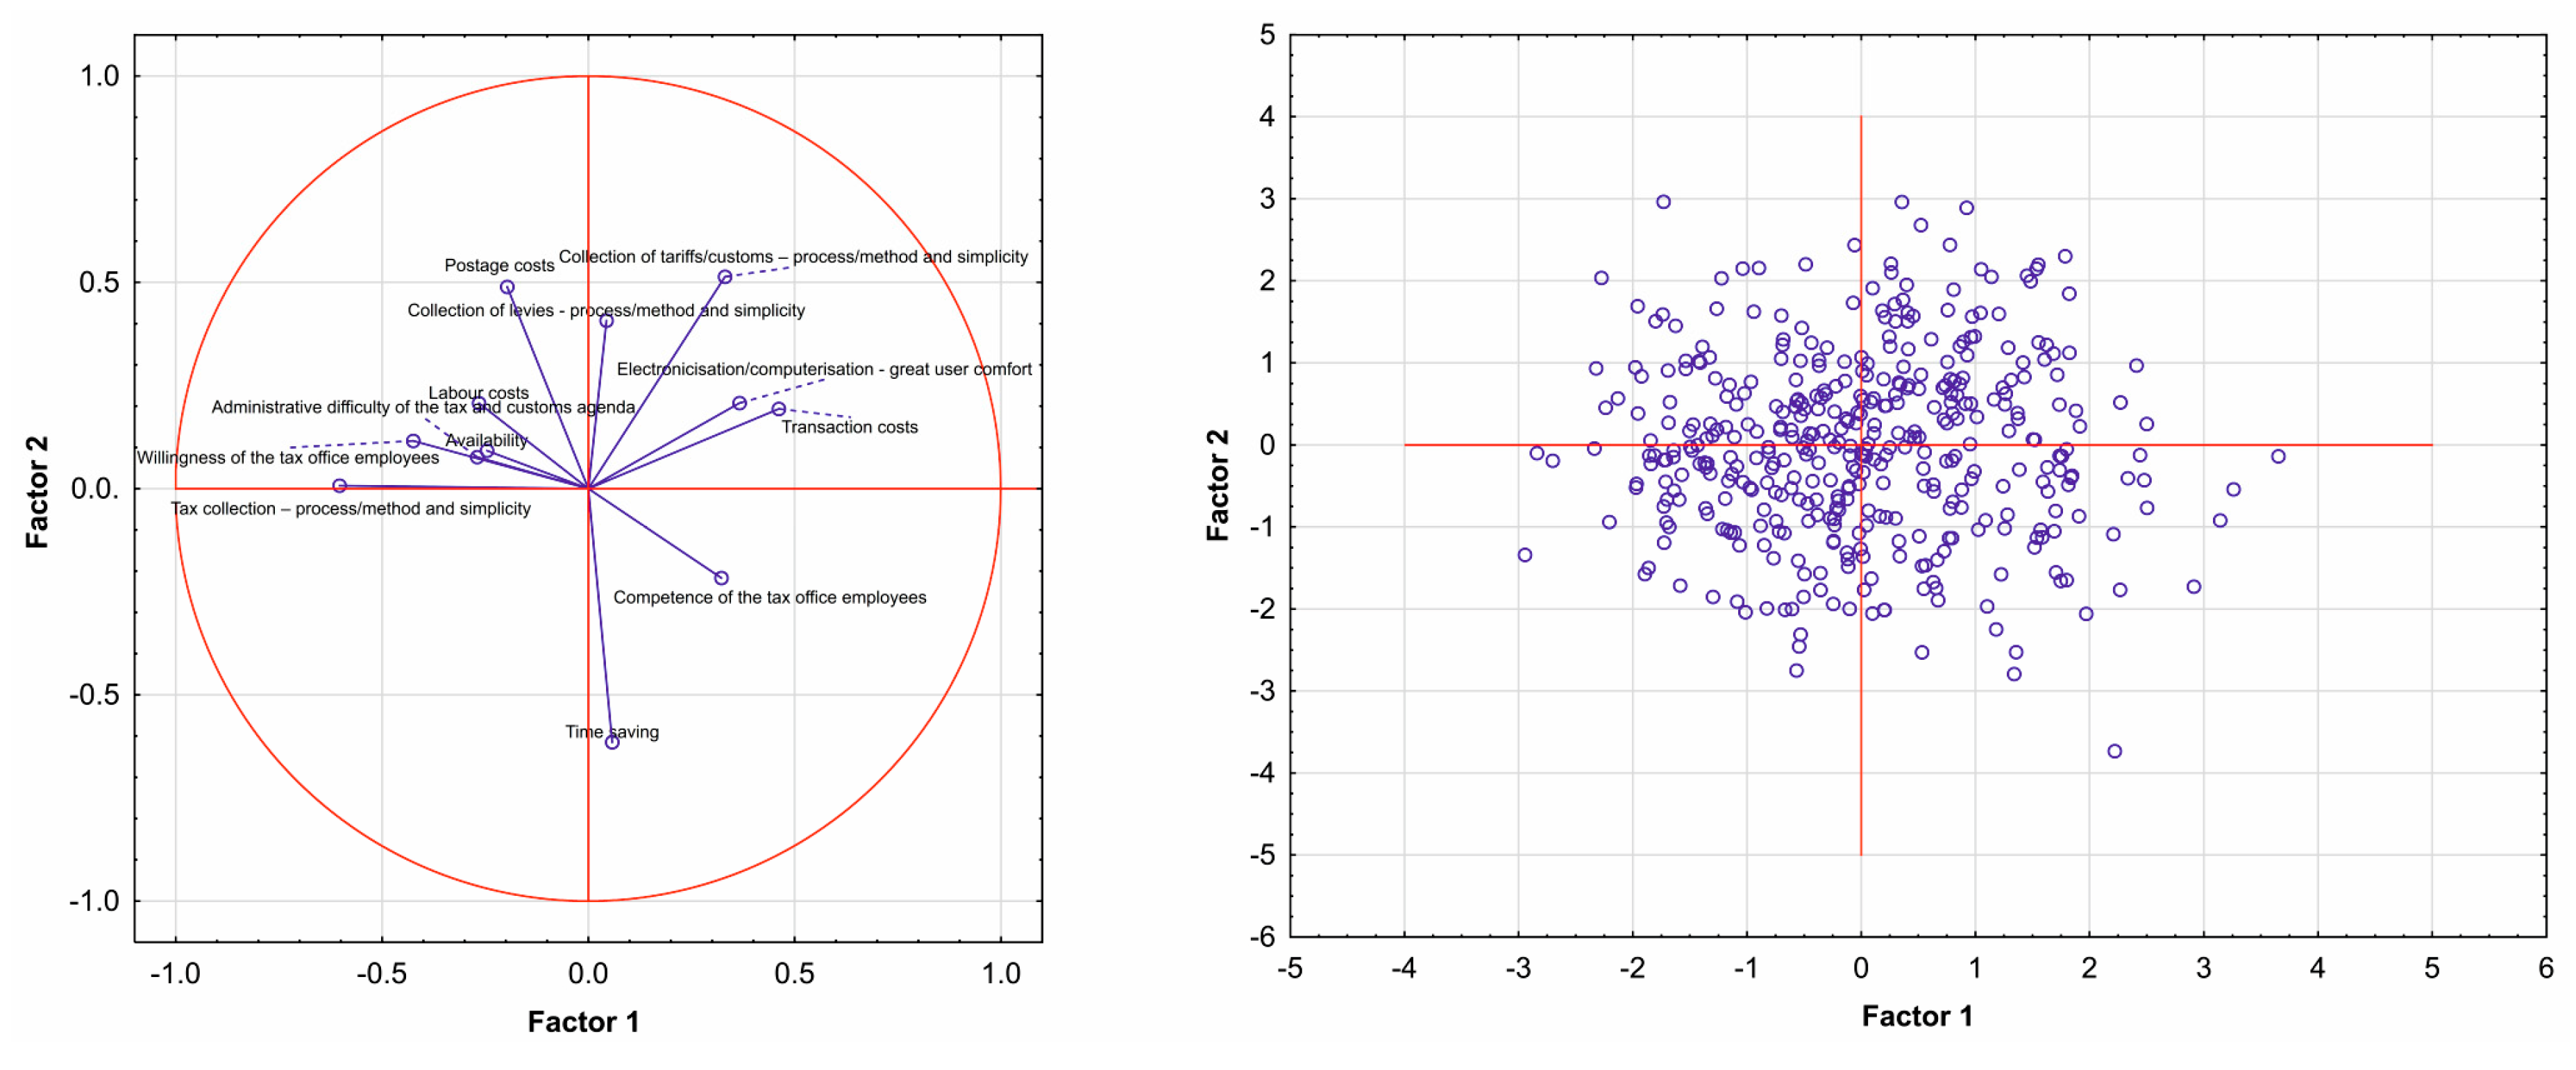
As far as the group “Clerks” and the first and second major components are concerned (
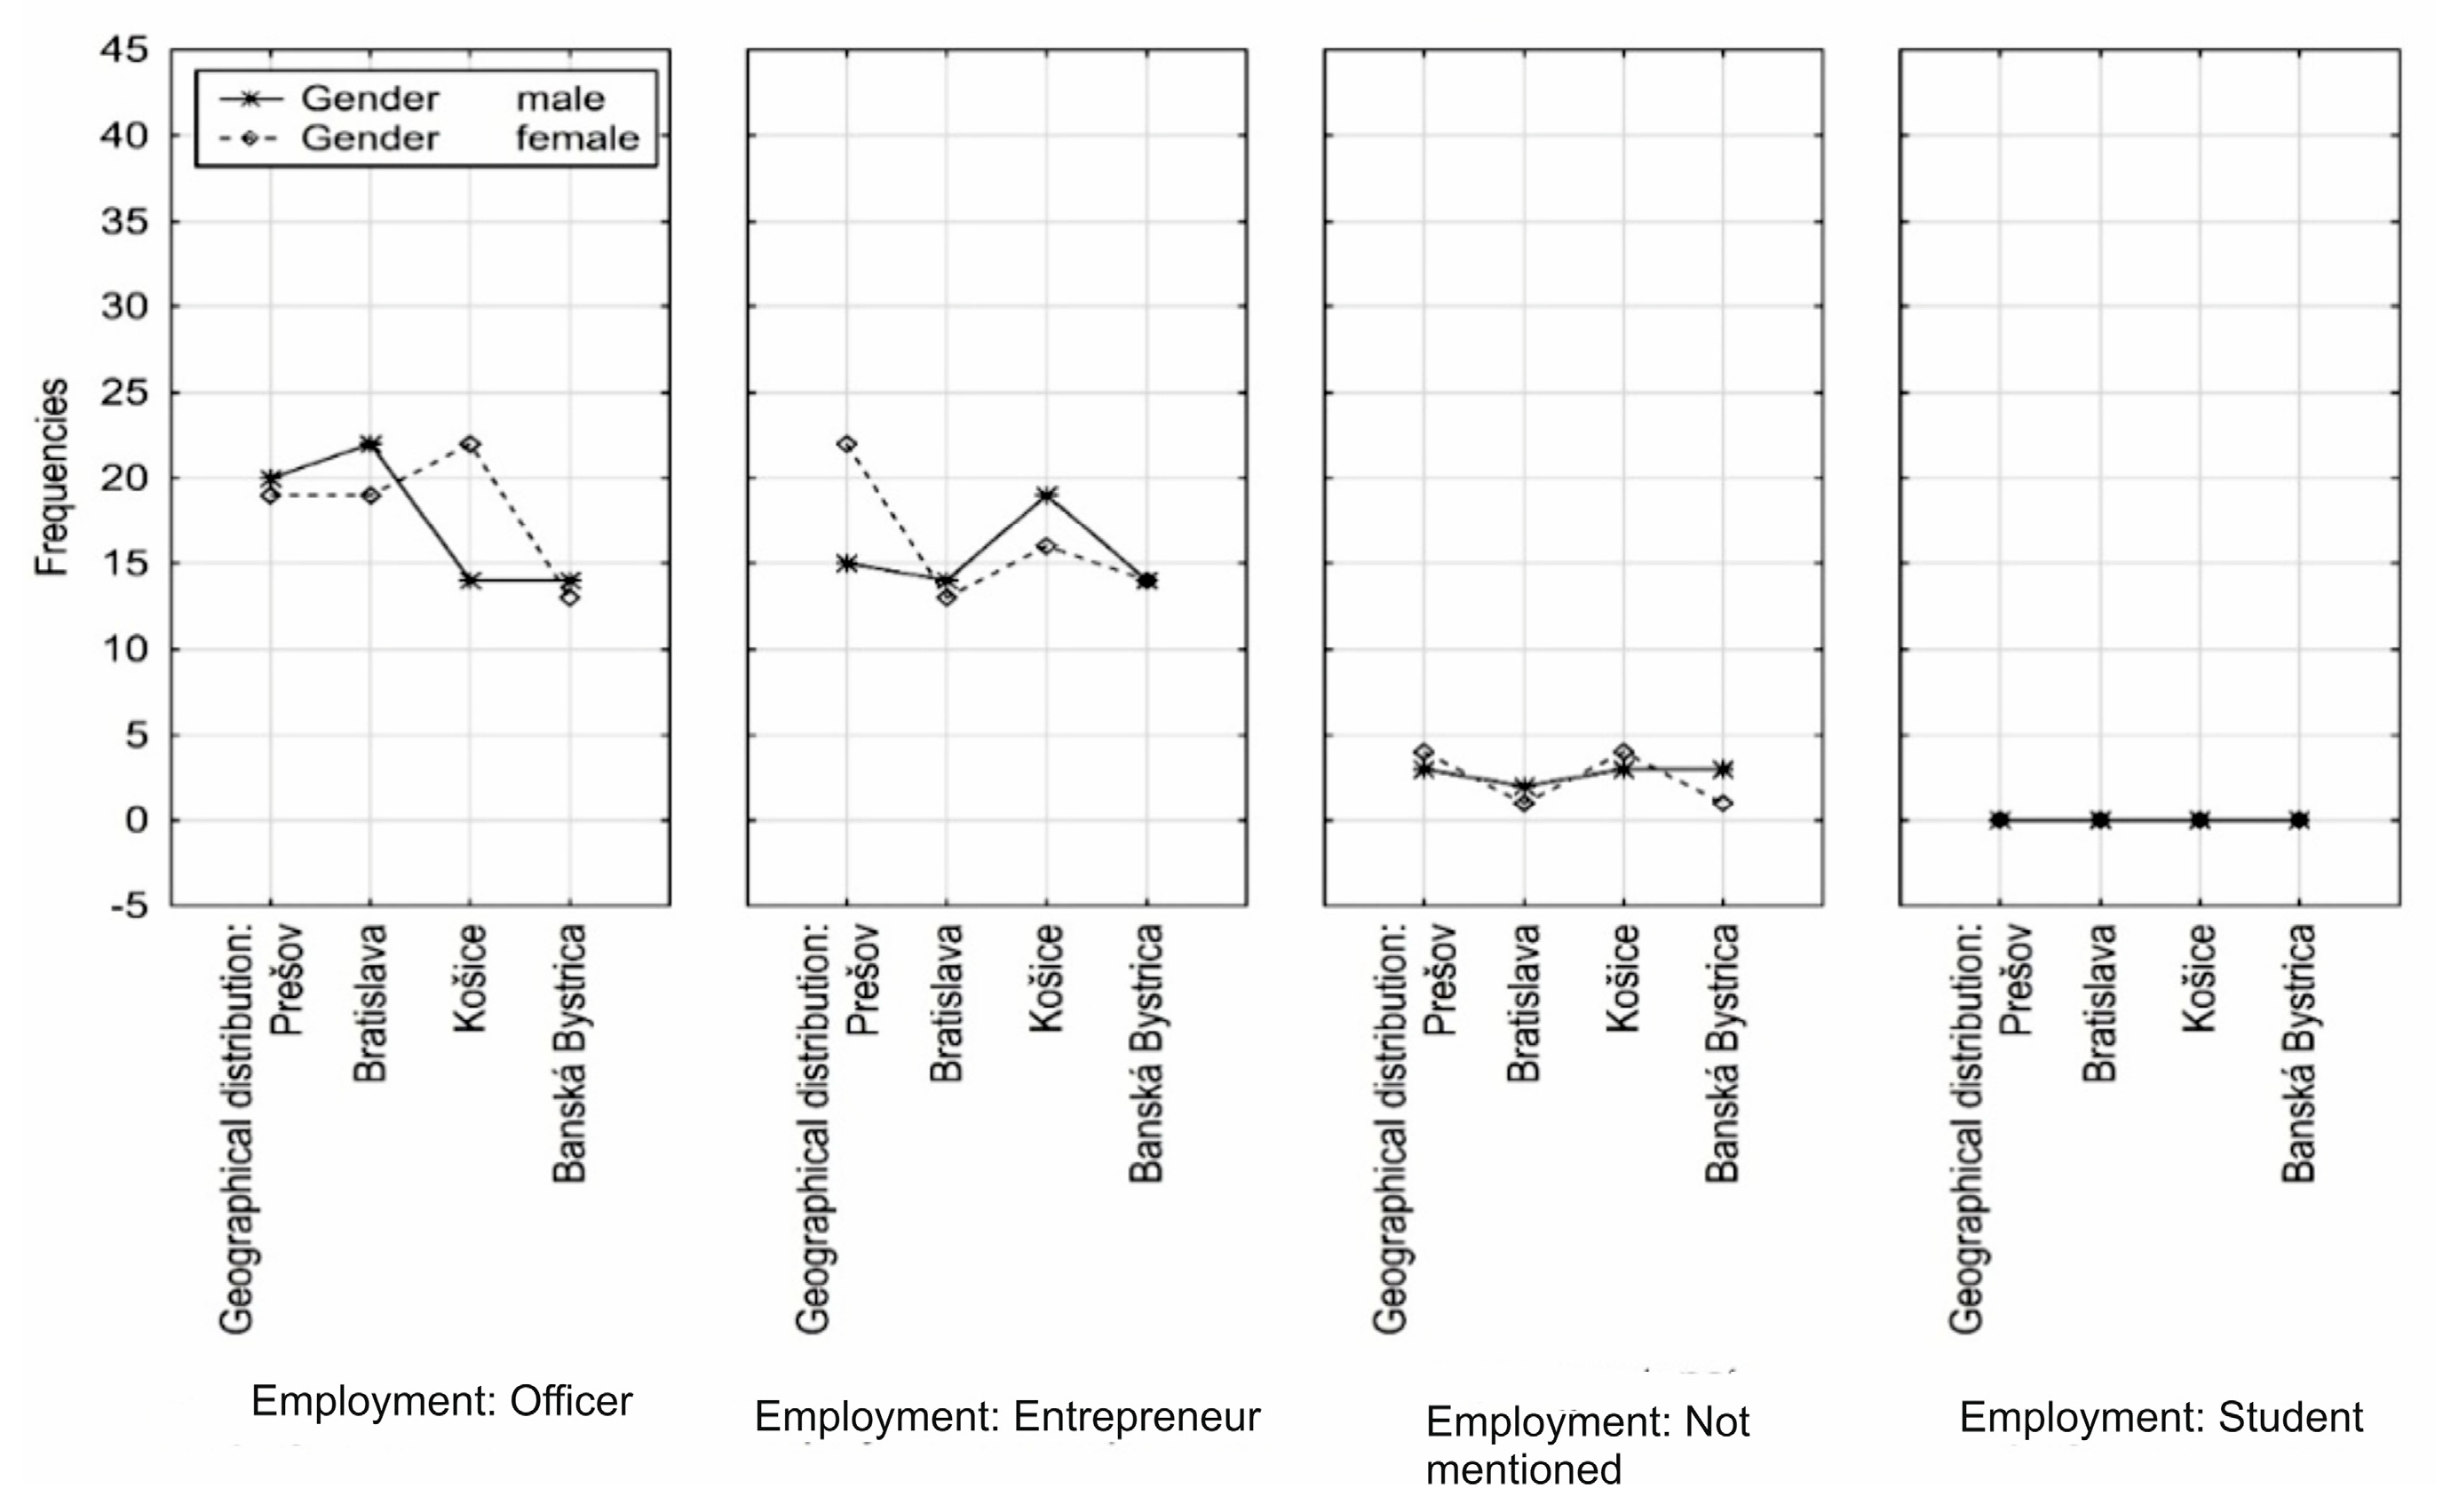
Figure 5), the variables time savings and competence of the tax office employees correlated positively in the first quadrant of the chart. Another positive correlation was found between labor costs and electronization/computerization—great user comfort and between administrative difficulty of the tax and customs agenda and the collection of levies—process/method and simplicity. At the same time, it is necessary to point out the indirect correlation between electronization/computerization and the administrative difficulty of the tax and customs agenda. Even though the item electronization/computerization—great user comfort item was not significant for the group “Clerks”, the indirect correlation indicated that clerks were also of the opinion that if the electronic tax system was simplified, it would minimize administrative difficulties. From the point of view of the importance placed by clerks on the items, the least significant were tax collection—process/method and simplicity, electronic users/computers—great user comfort and postage costs. On the contrary, the most important were willingness of the tax office employees, competence of the tax office employees and administrative difficulty of the tax and customs agenda.
As far as the group “Students” and the first and second major components were concerned (
Figure 6), we found a positive correlation between the items of the transaction cost and electronization/computerization—great user comfort, between the administrative difficulty of the tax and customs agenda, and willingness of the tax office employees. From the point of view of the importance of the items, the students place the greatest importance to the time saving, tax collection—process/method and simplicity and postage costs. Students considered administrative difficulty of the tax and customs agenda and availability to be of the least importance. From these three graphs, it was possible to reduce the differences in the perception of the importance of the research parameters among the three groups surveyed—entrepreneurs, clerks and students.
The basic indicators of the suitability of the use of the factor analysis are KMO statistics and Bartlett’s test of sphericity. Kaiser-Meyer-Olkin’s statistics (KMO) are an index that compares the size of the experimental correlation coefficients to the size of the partial correlation coefficients. If the sum of the squares of the partial correlation coefficients is smaller when compared to the sum of the squared correlation coefficients the KMO will be close to 1. Low numbers of KMO statistics indicate that the factor analysis of the original characters is not suitable because the correlation between the pairs of characters cannot be explained by other characters. According to the value of KMO statistics (0.645) and according to Kaiser’s definition, it could be said that the correlation rate was good and that the choice of the factor analysis was justified (
Table 2). Bartlett’s test of sphericity is a statistical test of the correlation between the original characters. It tests the zero hypothesis: H0: “there is no correlation between the characters”, so the correlation matrix is the unit matrix. The significance of the Bartlett test of sphericity
p = 0.000 was less than the chosen level of significance α = 5%, and thus the study rejects the zero hypothesis. Thus, it could be stated that the factor analysis was suitable for analyzing the data concerning the reform of the tax system.
One of the basic tasks of the factor analysis is the reduction of the original number of characters. The basic premise is to get the right combination of original characters, which would explain the scattering. Then, the authors searched for combinations that were increasingly smaller and smaller. The paper focused on the criterion of its own numbers. The own number criterion—factors that match a number greater than 1 are, according to Keiser, considered statistically significant. On the contrary, factors whose own number is less than 1 are statistically insignificant. Based on
Table 1 and Kaiser’s criterion of statistical significance, it can be said that the study chose five factors whose own number is greater than 1. The cumulative of these five factors explained 50.6409% of the total variance. The first factor represented 14.94909% of the scatter, the second factor 9.57254%, the third factor 9.05482%, the fourth common factor 8.71966% and the fifth common factor 8.34482% of the total scatter.
The first step in interpreting the results of the factor analysis is the factor matrix analysis (
Table 3), which gives us the initial number of factors. The factor matrix contains factor loads for each character and factor, and represents the best linear combination of original characters while including as many characters as possible. The first factor is always the most important because it represents the best linear relationship found in the original characters. The second factor is the second best representation of the linear relationship. However, there is a limitation to it—it must be orthogonal to the first factor. The factor load explains the role of each original character while defining a common factor. It is actually the correlation coefficient between each original character and factor. The factors were extracted using normalized Varimax rotation. This rotation of the factor structure was chosen due to the simplification of the factor structure and due to the high values of the residual correlation matrix of the original features.
From
Table 3, it is clear that the first factor correlated significantly with the item “Administrative difficulty of the tax and customs agenda”. The factor load values reached 75.6493% for competence of the tax office employees and 67.0673% for administrative difficulty of the tax and customs agenda. The analysis of factor 1 shows that the first common factor explained 57.223% of the variability of the competence of the tax office employees and 44.981% of the variability of the administrative difficulty of the tax and customs agenda. The second common factor correlated with the item tax collection—process/method and simplicity of the research tool with the factor load value of 62.0819% representing 38.542% of the variability of this item explained by the second common factor. The third common factor correlates significantly with the item time saving and postage cost. The factor load values were –65.5635 % for time-saving and 64.2661% for postage costs. Based on the analysis of factor 3, it could be stated that the third common factor explained the 42.986% variability of the time saving item and the 41.301% variability of the postage costs. The fourth common factor correlated with the item collection of levies—process/ method and simplicity of the research tool with a factor load value of –56.9445%, representing 32.427% of the explained variability by the second common factor. The fifth common factor correlated with the item collection of tariffs/customs—process/method and simplicity with the load factor of 69.9792%, which represented 48.971% of the explained variability of this item by the second common factor. At the same time, the authors verified the practical importance of the factors.
Based on the above, the study could, therefore, postulate the factors as the main research objective as follows:
Factor 1—Competence and Administrative difficulty;
Factor 2—Tax collection;
Factor 3—Time-saving and Postage costs;
Factor 4—Collection of levies;
Factor 5—Collection of tariffs.
Factor analysis focuses mainly on factor model parameters. Common factor estimates, called factor scores, might be required. The values of the common factors in the selected objects or observations were not only a useful tool for data diagnostics but also, if necessary, important input into further analyses. The factor score is not an estimation of parameters in the common sense because it estimates unobserved values. Estimates of the factor score for a given object can be represented as the coordinates of this object in the R-dimensional space (
Table 4).
After creating the factor model, reliability evaluation was again carried out to determine the model homogeneity using Cronbach’s alpha. The results presented in
Table 5 show that the Cronbach alpha (0.830219) value obtained for the factor model obtained provides evidence for accepting the factor model homogeneity assumption.
In line with the defined partial objectives of the research, the next part of the paper analyzed the opinions of the respondents represented by the factor scores in relation to the five extracted identifiers—factors of the tax system reform using Fisher’s ANOVA (analysis of variance). In the analyses the study considers only significant independent variables at the value of the relevant factor at the chosen level of significance α = 0.05.
The analysis of scattering is a set of induction statistics procedures used to test hypotheses of mean values in a different, often complex configuration of experiments while testing more than two groups. The zero hypothesis, in this case, indicates that the test groups did not statistically and significantly differ in the mean value.
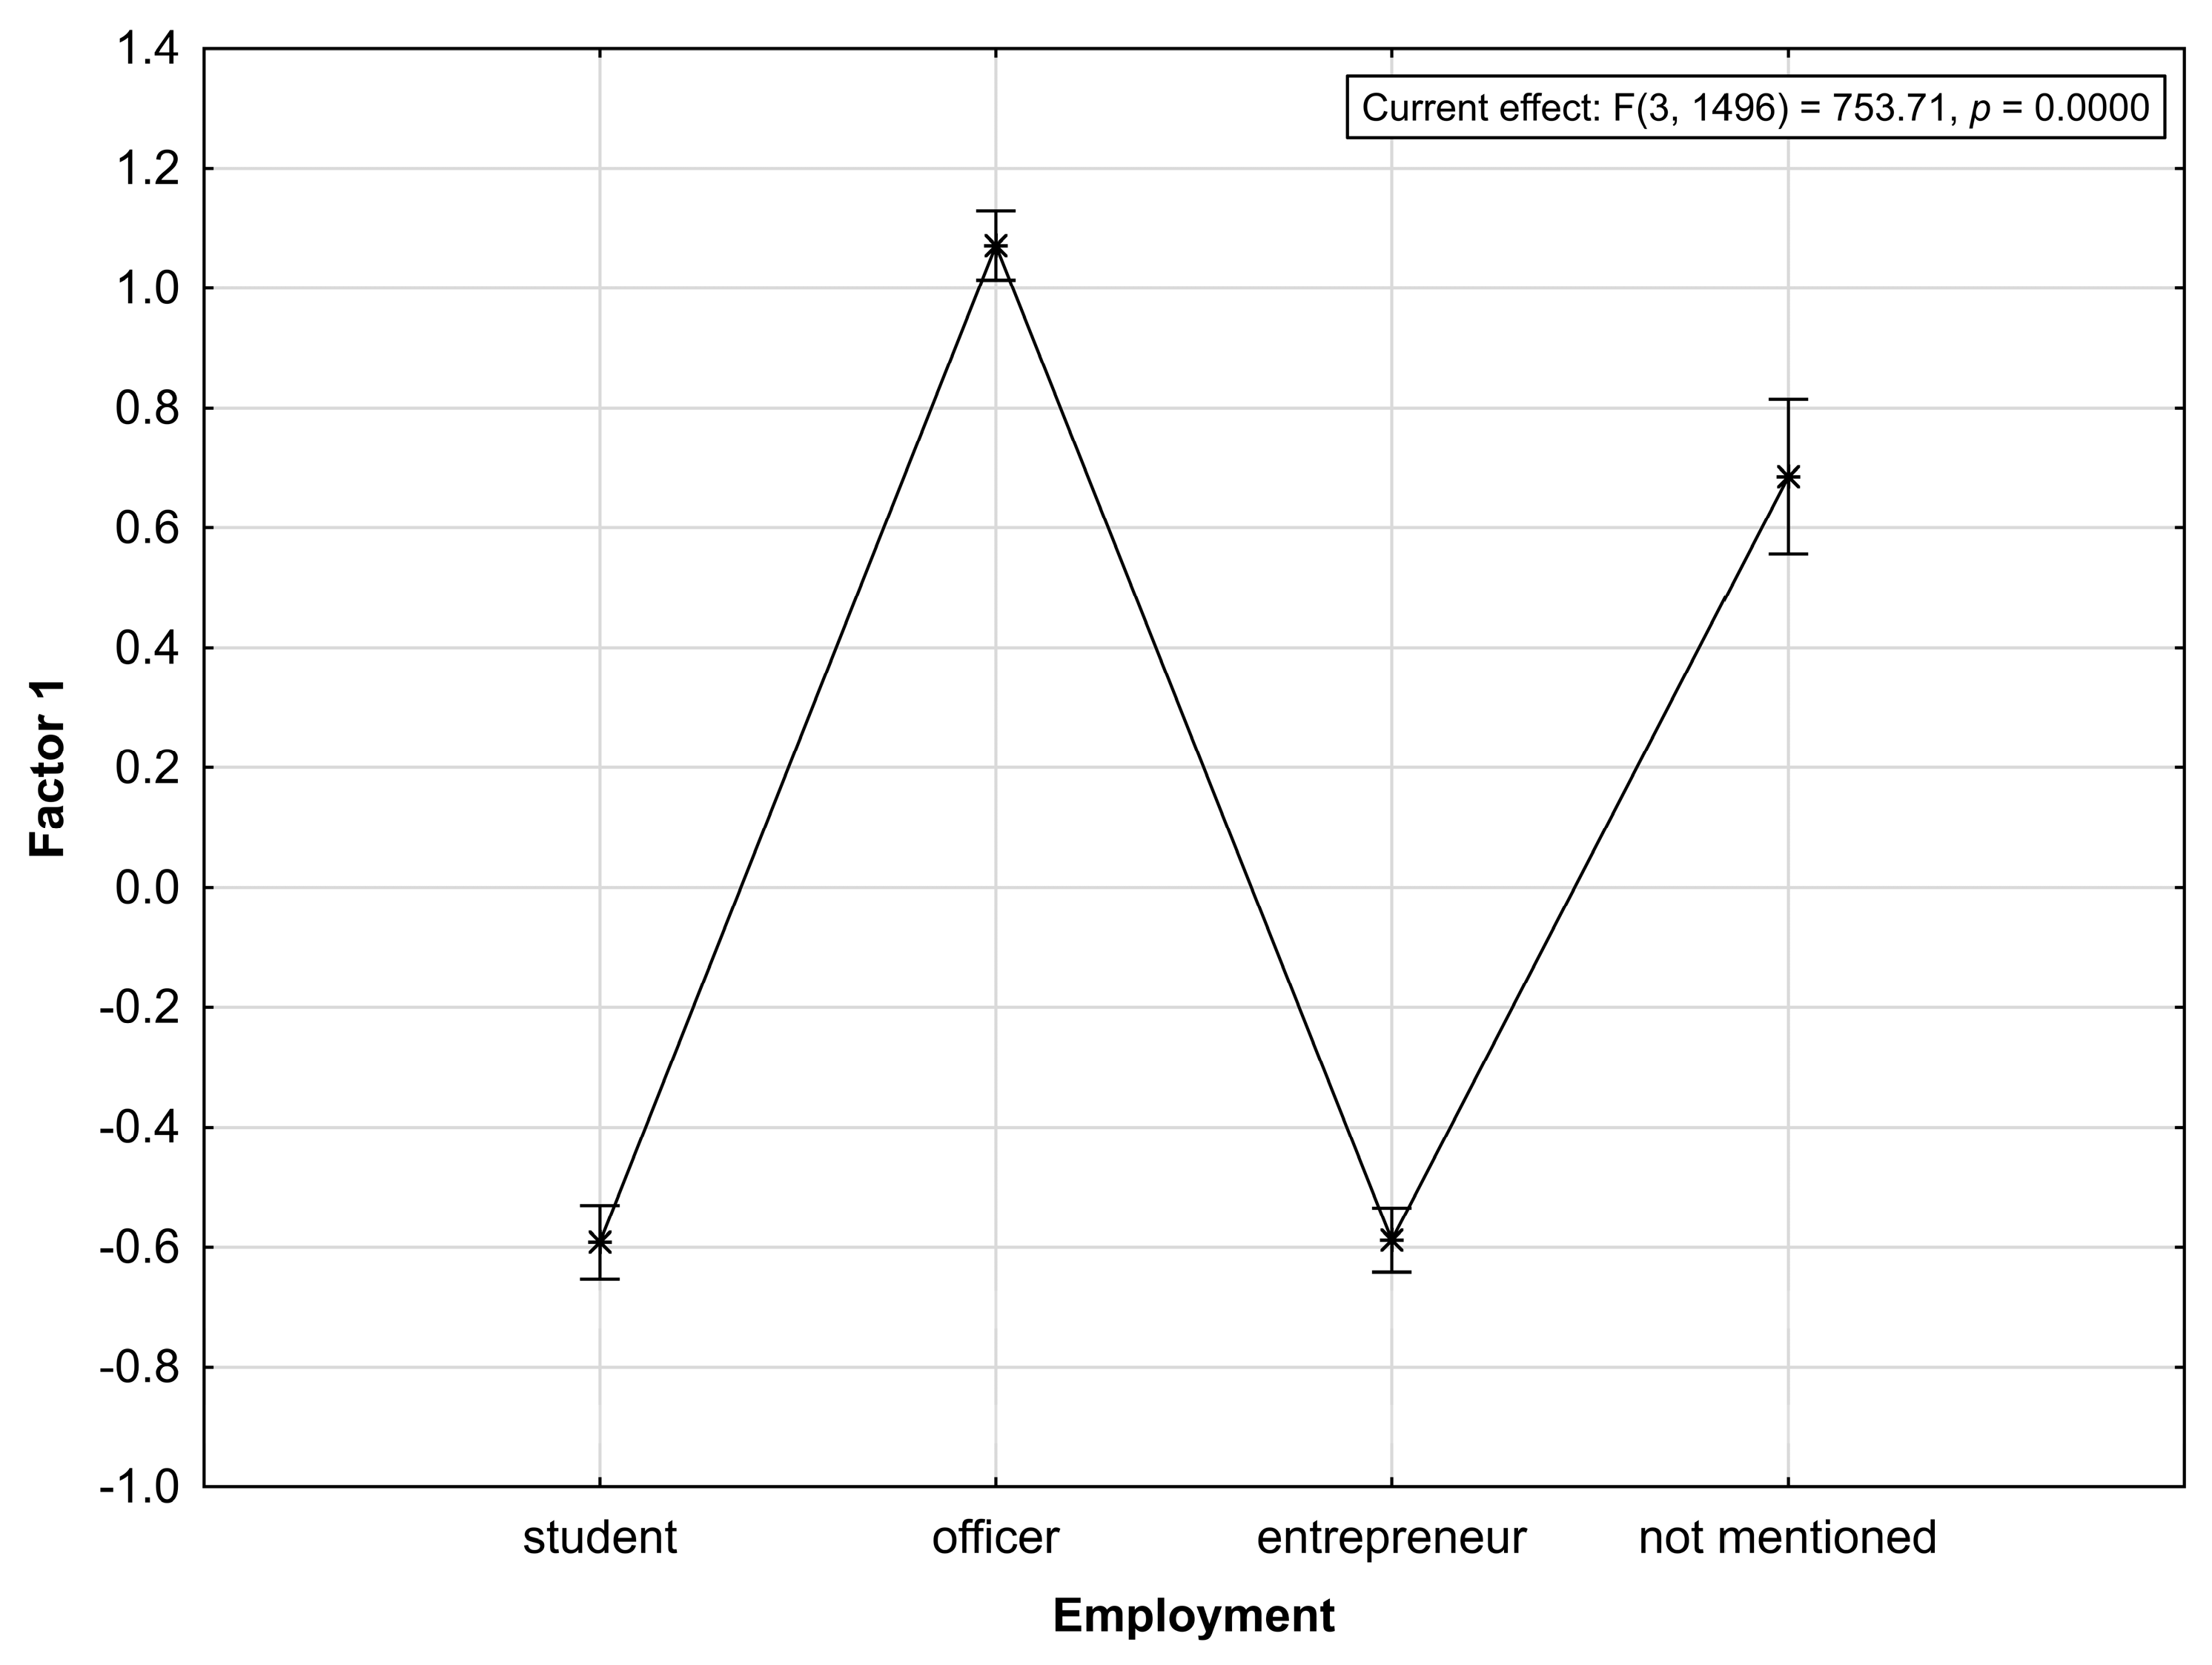
Table 6 shows that the change in the value of Factor 1 (competence and administrative difficulty) had a significant impact on employment at a chosen significance level of 5%. Intercept also had a significant impact, integrating the influence of variables that was not analyzed in the research those were age, gender and geographical distribution. If we considered the factor score to represent either agreement or disagreement with the given factor, the average value of the factor score in the group “entrepreneurs” would be –0.58823 ± 0.05341, for the group “clerks” it would be 1.07095 ± 0.055511 and for the group “students” it would be –0.591651 ± 0.061451. Based on the average score value and
Figure 7, it was possible to conclude that students and entrepreneurs perceive Factor 1 defined as competence and administrative difficulty negatively, while clerks and respondents who had not reported their job as positive. At the same time, based on the Scheffe test, it could be stated that at the selected level of significance of 5%, the mean values of the factor score for students and entrepreneurs could be considered identical (
p = 0.999851) and statistically different from the group “clerks” (
p = 0.00001).
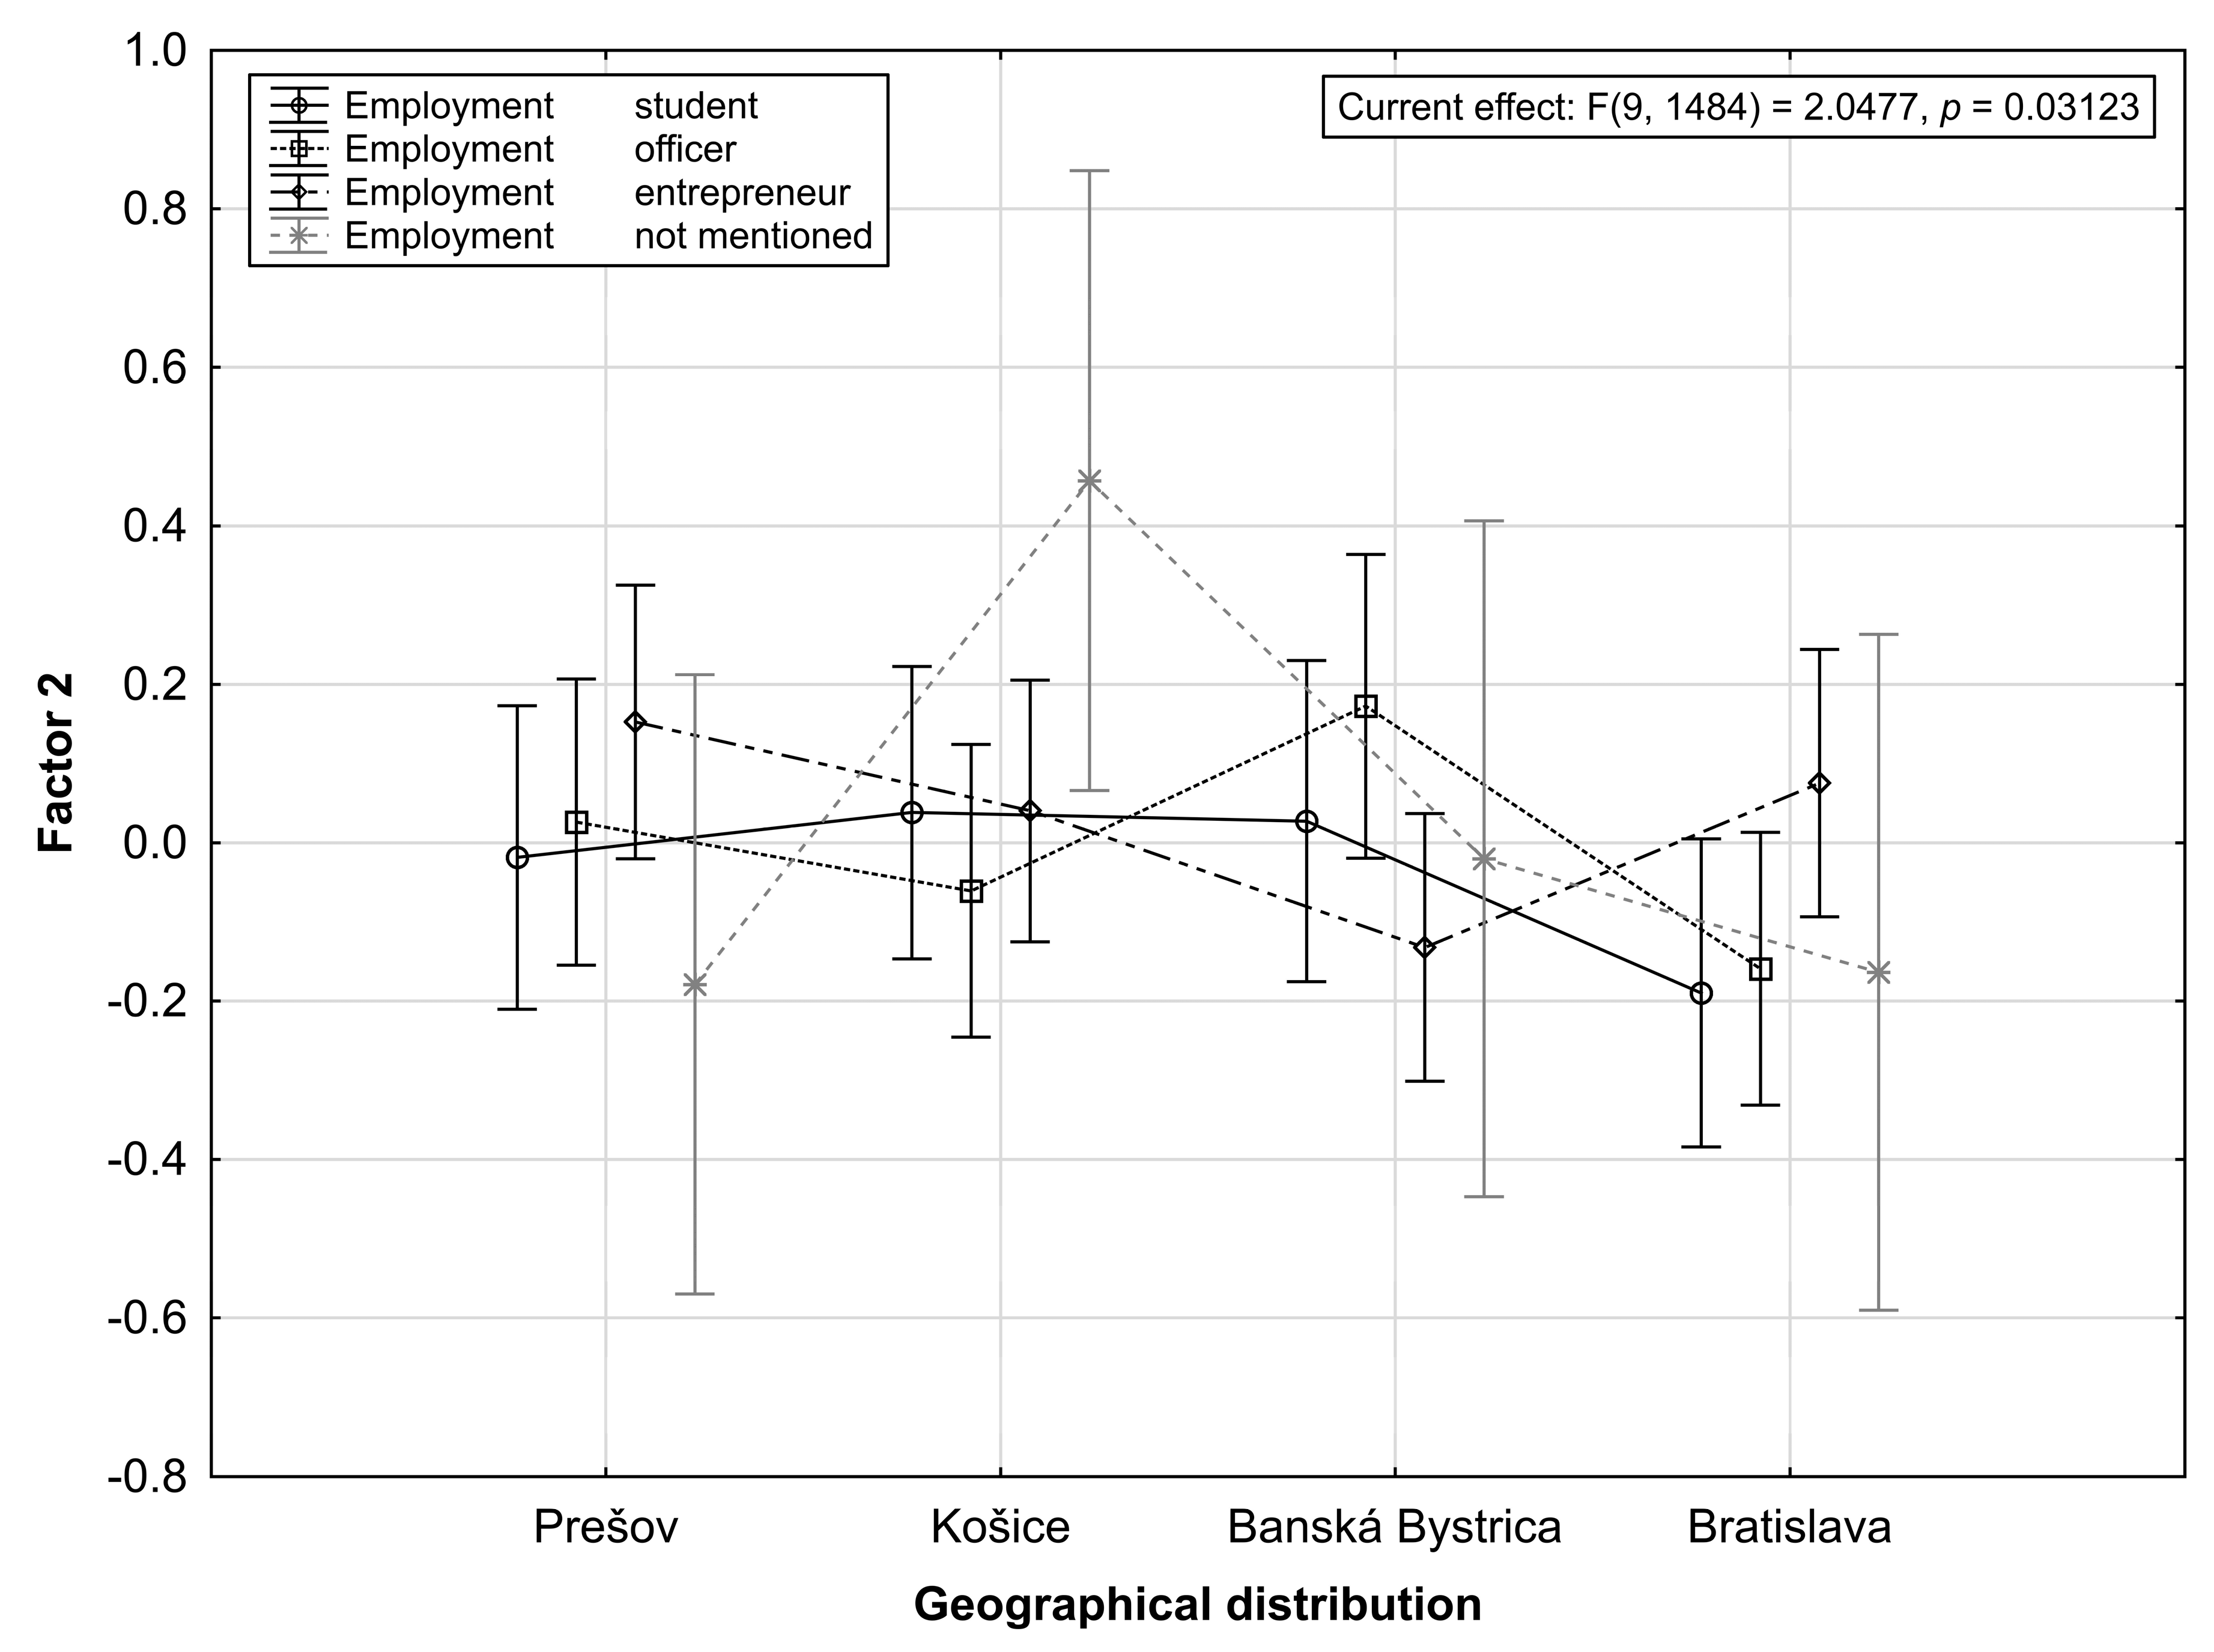
While considering Factor 2 (tax collection), the interaction between geographical distribution and employment (
p = 0.03518) was seen as a significant influence that affected the change in the factor score. The average value of the factor scores for students in Prešov was −0.01858, in Košice 0.03811, in Banská Bystrica 0.02730 and Bratislava −0.18959. Students from Prešov and Bratislava had a negative attitude towards tax collection (Factor 2), with a higher rate for students from Bratislava. Students from Košice and Banská Bystrica were slightly positive in this respect, with the average value in both cases being almost identical. In the group “clerks”, the average value of the factor scores in Prešov was 0.02599, Košice −0.06077, Banská Bystrica 0.17242 and Bratislava −0.15917. The clerks in Banská Bystrica had a positive attitude towards tax collection, while clerks from Bratislava perceived it negatively. The average value of the factor in the case of entrepreneurs from Prešov was 0.15264, from Košice 0.04020, Banská Bystrica −0.13218 and Bratislava 0.07535. From the above average values, tax collection was negatively perceived by entrepreneurs from Banská Bystrica while entrepreneurs from Prešov saw it positively. For more detailed information, please see
Figure 8.
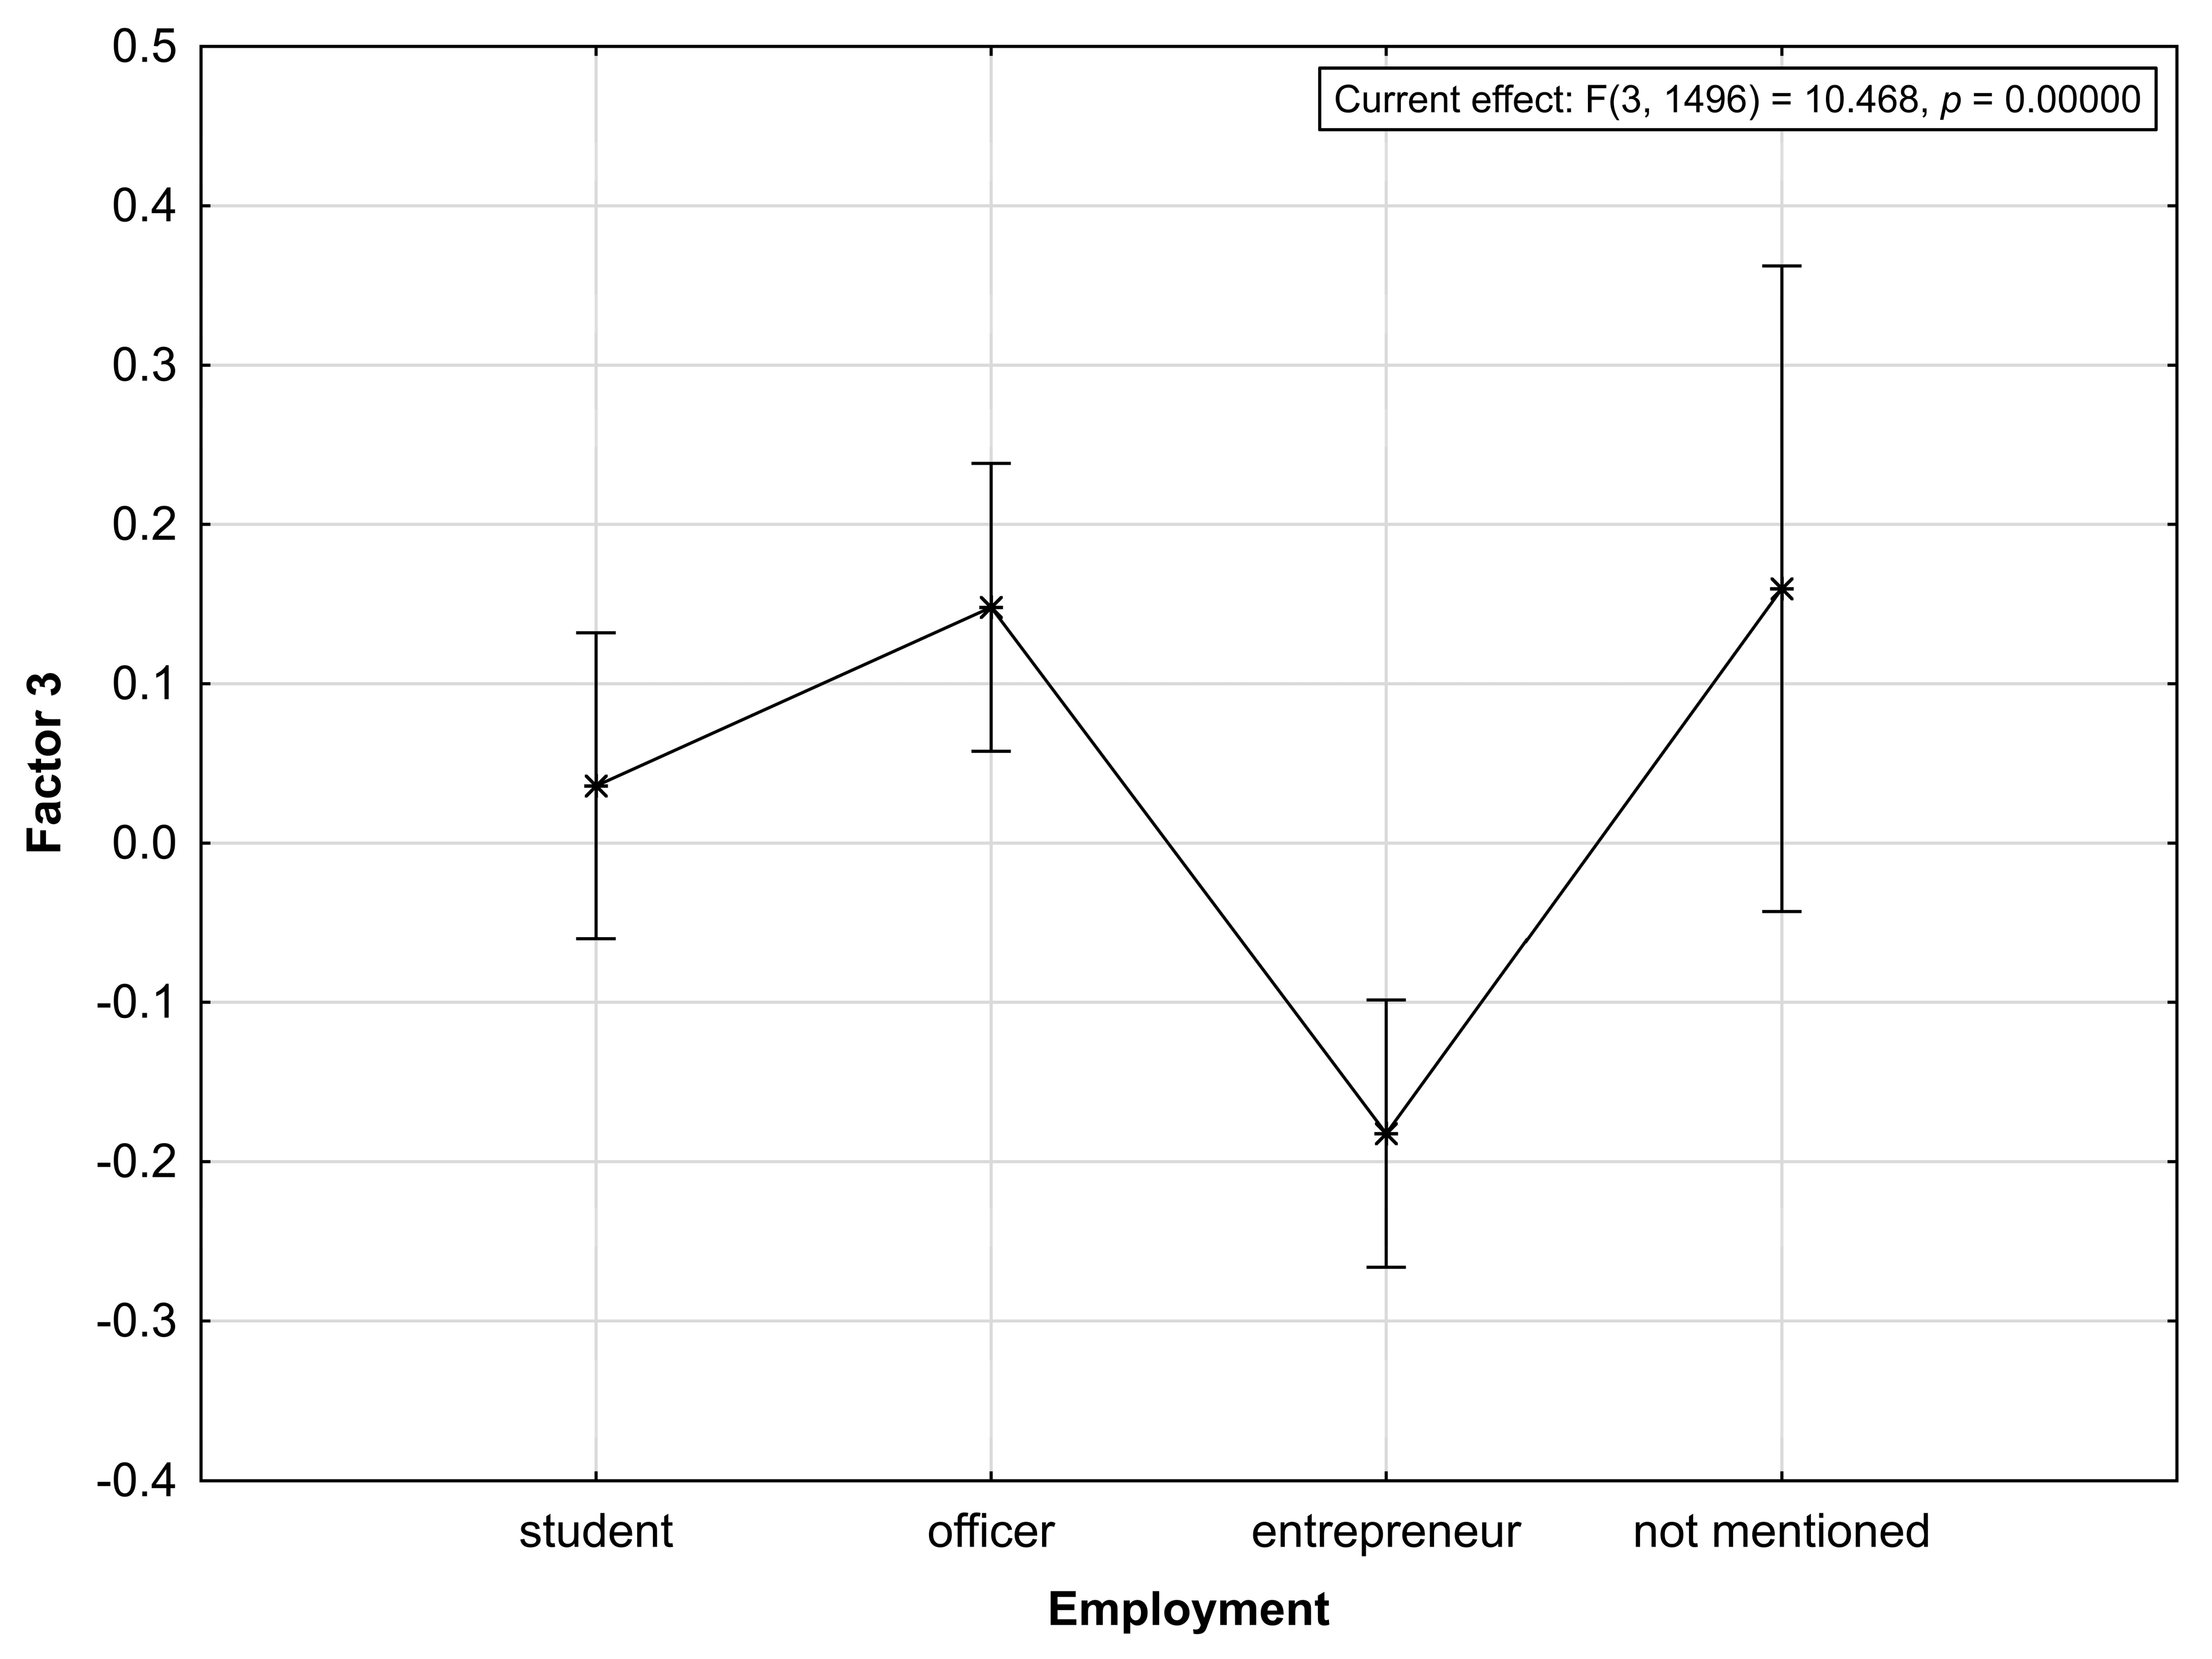
Factor 3 (time-saving and postage costs) was significantly influenced by employment at the chosen significance level of 5%. The average value of the factor score in the group “entrepreneurs” was −0.182388, for the group “clerks” it was 0.147971 and −0.035865 for the group “students”. From the average factor score value and
Figure 9, it could be concluded that Factor 3, defined as time-saving and postage costs, was perceived by entrepreneurs as a negative, whereas clerks, respondents who had not stated their job and students perceived it as a positive.
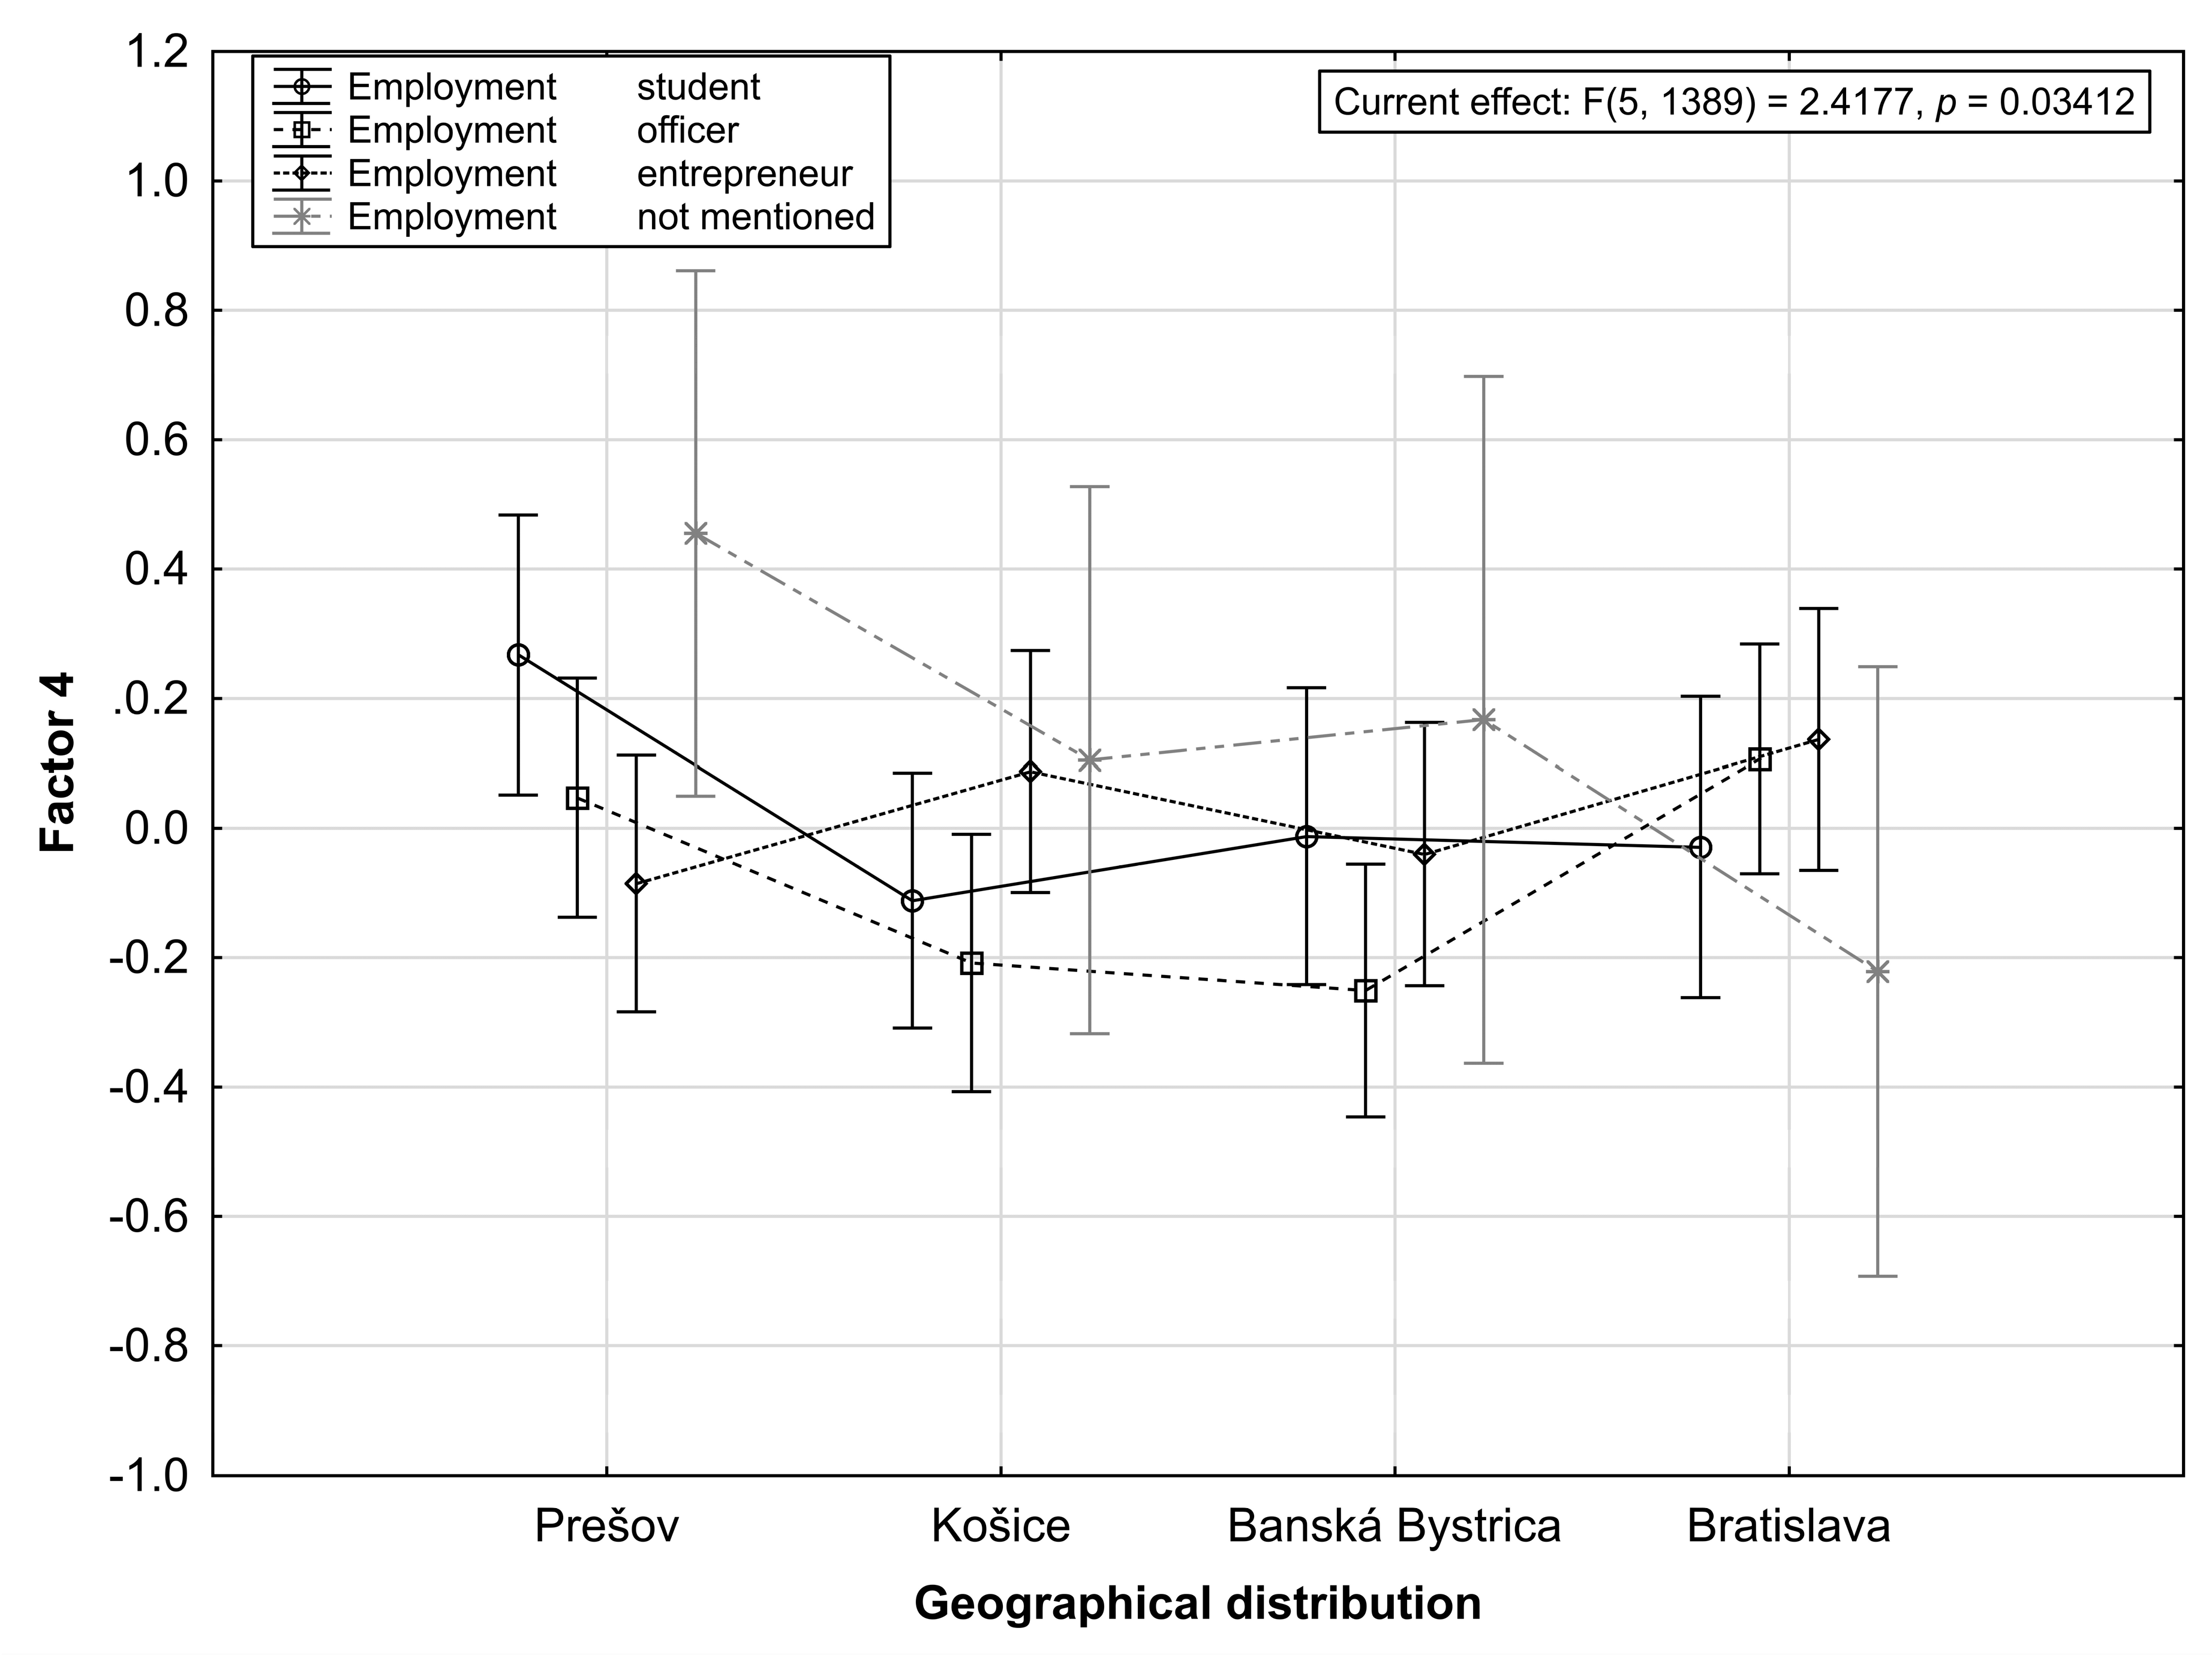
While analyzing Factor 4 (collection of levies) geographical distribution and employment (
p = 0.03412) had a significant effect on the change of factor score. The average values of the factor scores for students were 0.19017 in Prešov, −0.113131 in Košice, 0.04434 in Banská Bystrica and −0.08728 in Bratislava. It follows that students from Košice and Bratislava had a negative attitude towards the collection of levies as Factor 4, with a higher rate for students in Košice. Students from Banská Bystrica and Prešov were slightly positive towards Factor 4, while the average value of the factor scores was significantly higher for Prešov students. In the group “clerks”, the average value of the factor scores in Prešov was 0.02391, Košice −0.16331, Banská Bystrica −0.26136 and Bratislava 0.08506. Clerks from Prešov and Bratislava had a slightly positive attitude towards Factor 4, while in the case of Košice and Banská Bystrica the score revealed a slightly negative attitude of clerks living there. The average factor score for the group “entrepreneurs” from Prešov was −0.04147, from Košice 0.05416, from Banská Bystrica 0.03768 and Bratislava 0.06978. From the above average values, it follows that collection of levies was negatively perceived only by entrepreneurs from Prešov, entrepreneurs from other cities perceived this matter positively. The conclusions are shown in
Figure 10.
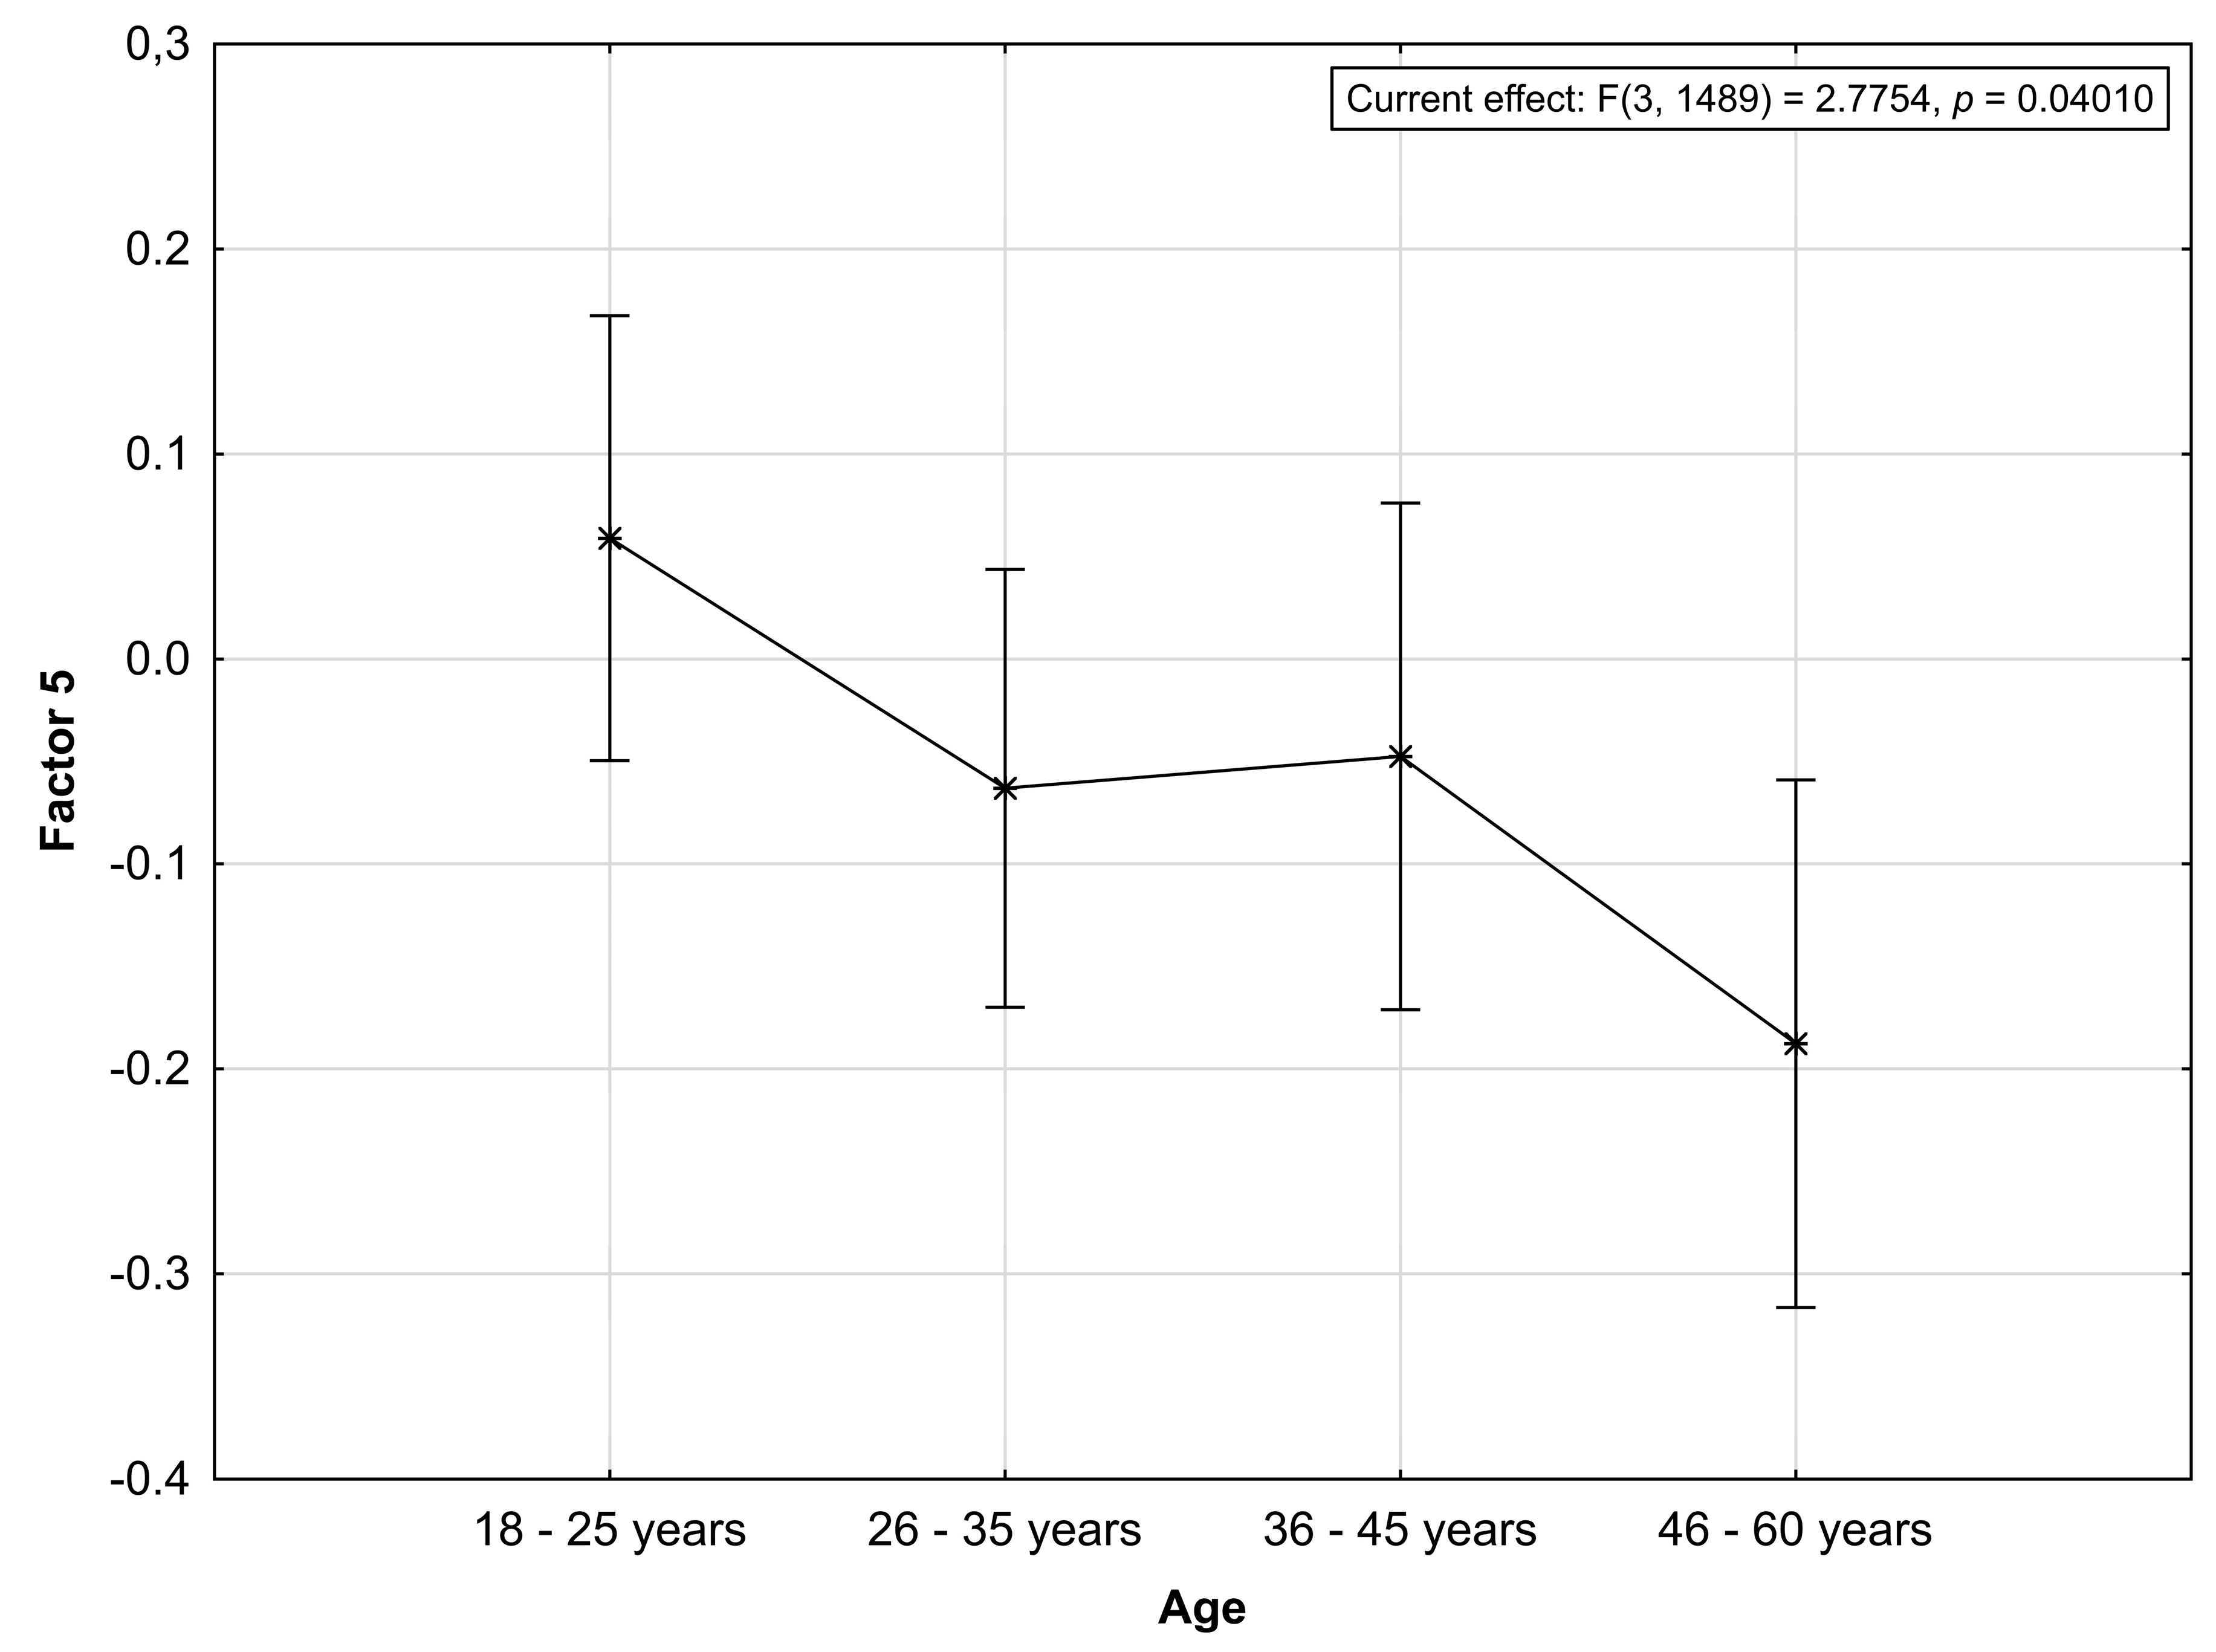
Factor 5 (collection of tariffs) was significantly influenced by age at the chosen significance level of 5%. The average score for 18–25-year-olds was 0.073782, for the 26–35-year-olds was –0.015995, for 36–45-year-olds was 0.030348 and for 46–60-year-olds was −0.133042. From the average score value and
Figure 11, it could be concluded that Factor 5, defined as the collection of tariffs, was perceived by the respondents more negatively when they get older.
The excessive and disproportionate administrative burden can have a real economic impact: It is generally considered to be an irritating and disturbing element in business and is often cited as a priority objective of simplification efforts. The financial administration reform aims to use electronic services to the broadest extent possible as it will decrease the amount of the red tape placed upon tax subjects and streamline the functioning of the financial administration. Electronization aims to introduce such information and communication technologies to secure paperless communication and automated processes first within the financial administration and later in relation to the tax subjects. The reform is based on the vision of the eGovernment from 2013, the aim of which is to achieve citizens’ satisfaction with the public administration by providing services attractively and simply, while increasing its efficiency, competence and reducing the costs of public administration. As of 21 October 2016, the implementation of the national project Electronic Services of Financial Administration—Taxes has been completed. The project met two main goals. The first was to build a new internal financial reporting system for the financial administration, section taxes. This streamlined and partially restructured internal management processes. Full computerization and unification of these processes were necessary steps towards the second objective of the project—more effective communication with the public [
49]. In view of the above, the paper also addresses the perception of the electronization of the services of the financial administration by students, clerks and entrepreneurs. The analysis of responses of respondents in absolute numbers on the Likert scale is outlined in
Table 7.
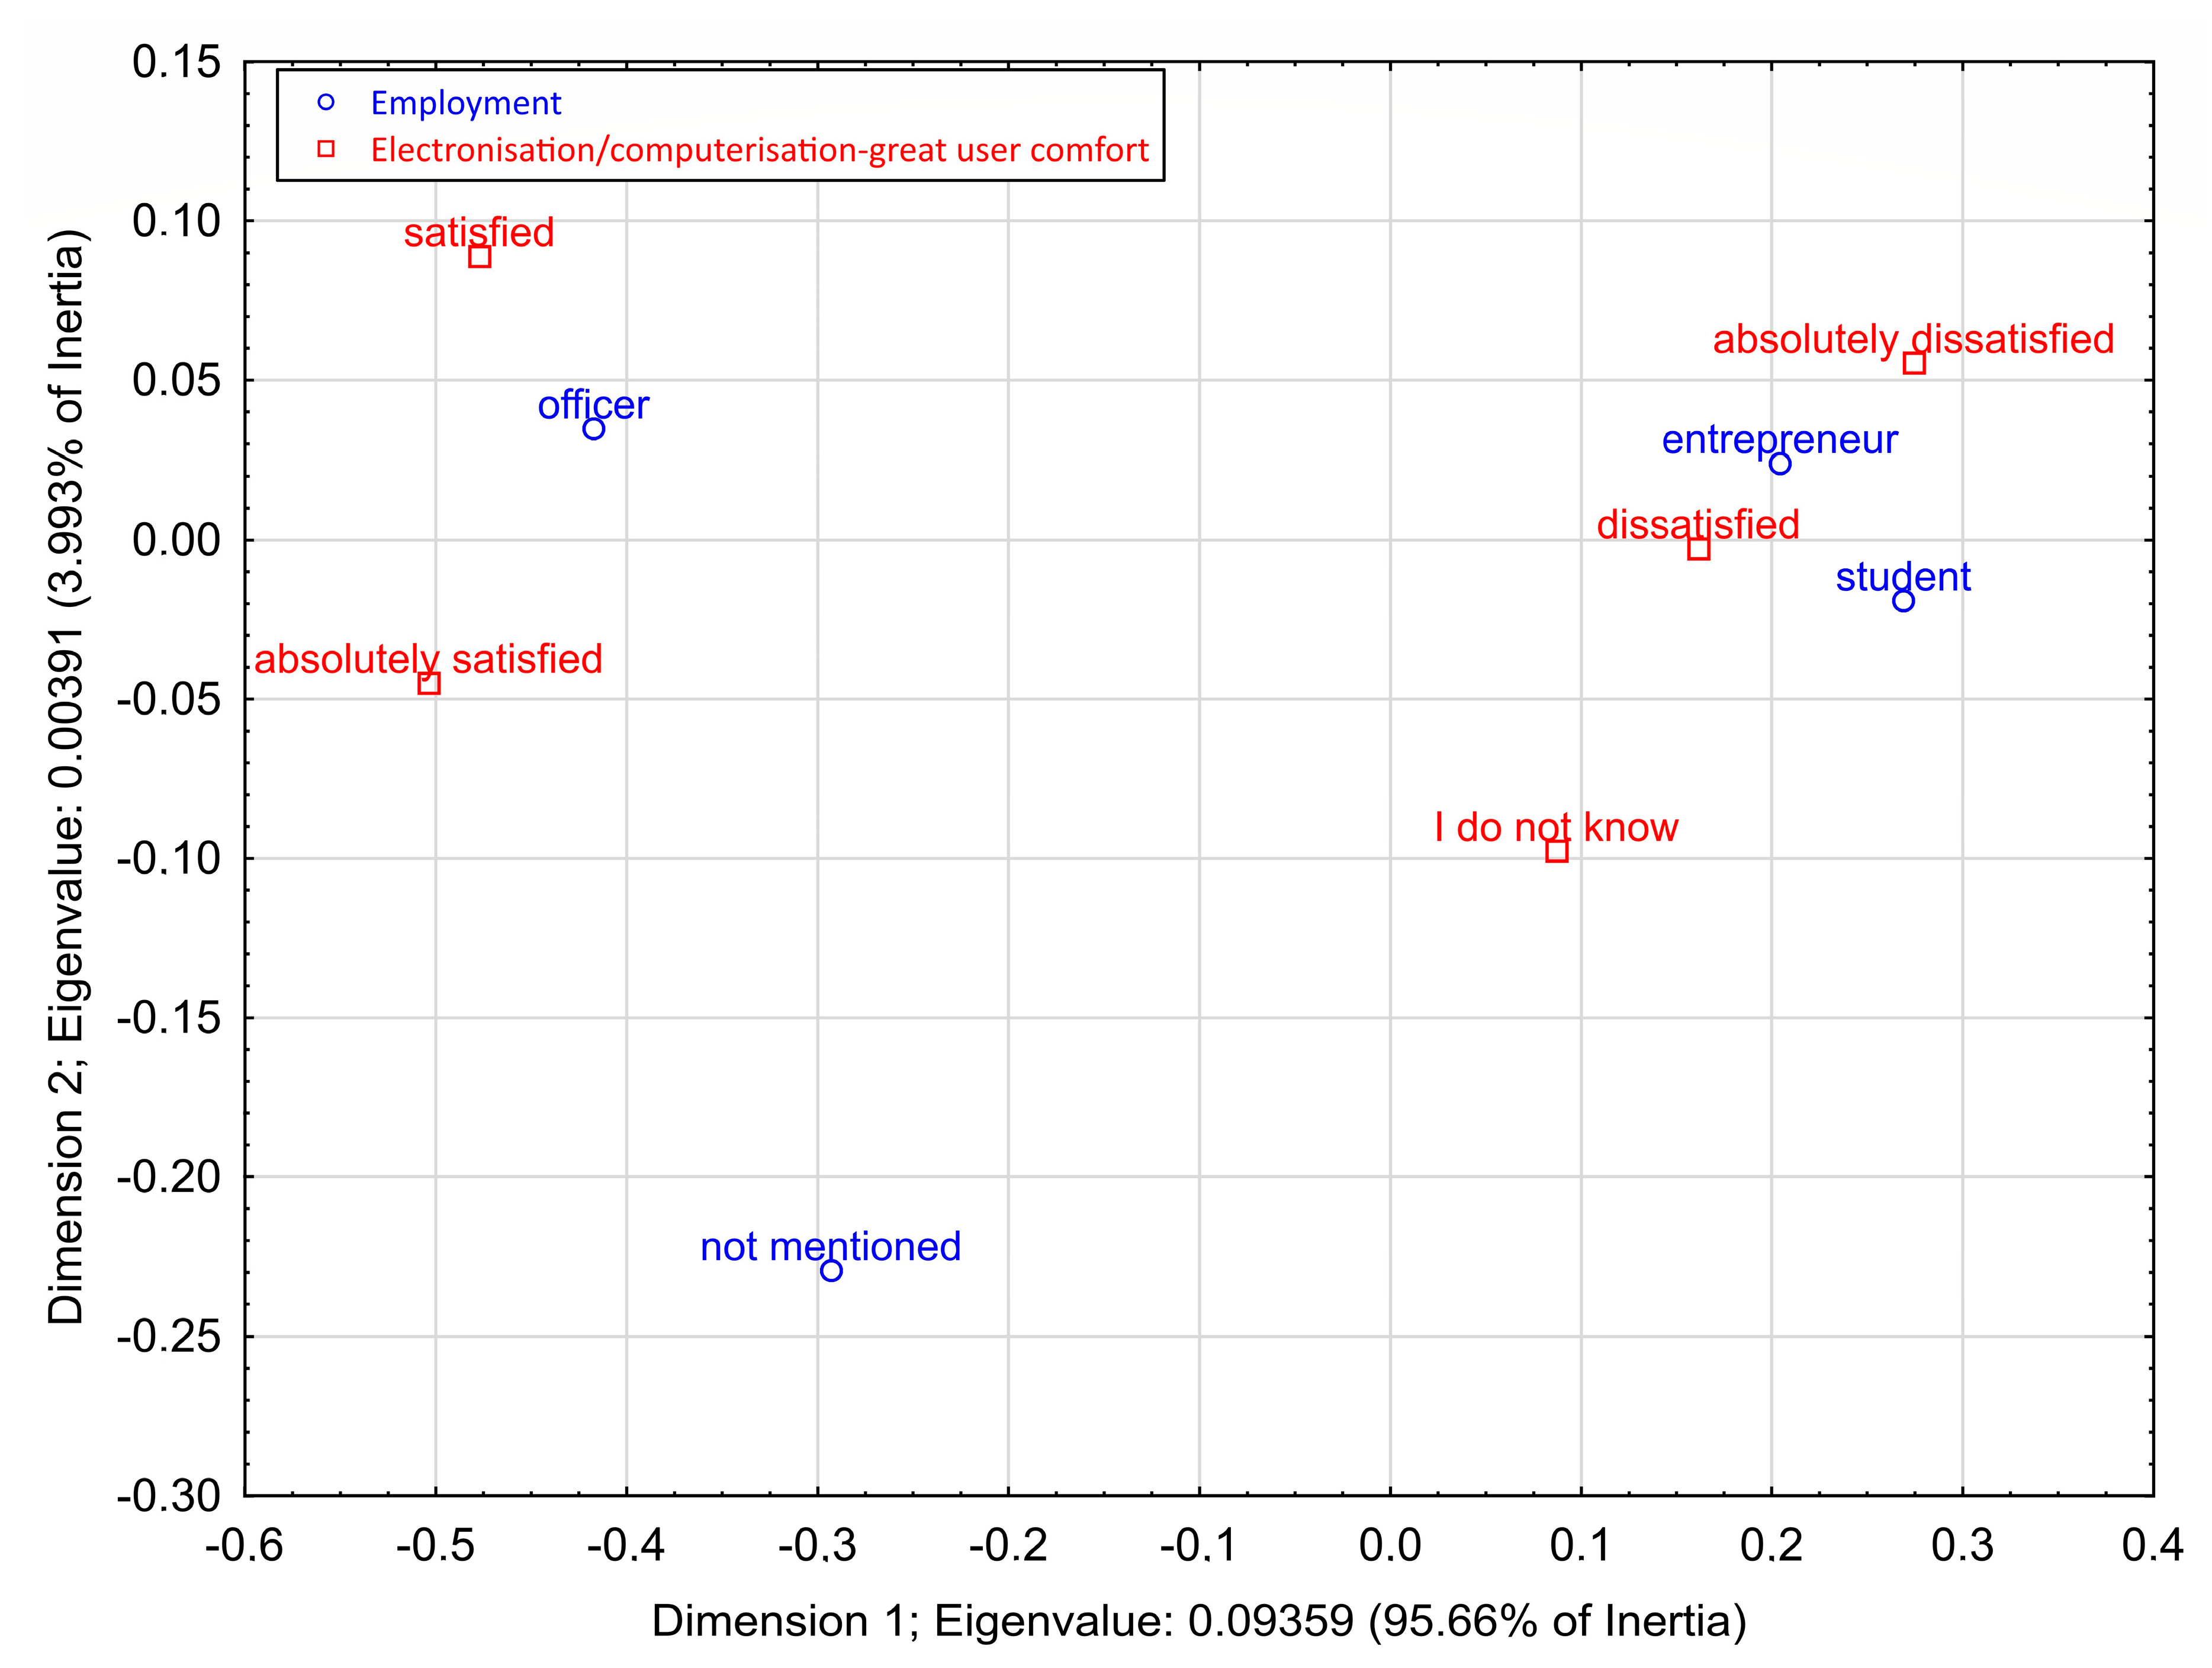
Based on the analysis and using the χ2 test with the value of 146,753 and the degrees of freedom equaling 12, it can be concluded that there was a significant relationship between the respondents’ opinion on electronization/computerization—great user comfort and employment (p = 0.0001) at the chosen significance level of 5%.
From the correspondence map shown in
Figure 12, which represents the relationship between employment and electronization/computerization—great user comfort, it was clear that students and entrepreneurs were strongly inclined to disagree or strongly disagree, and on the contrary, clerks tended to agree or strongly agree with the opinion. Users of electronic financial management services, i.e., entrepreneurs and students, still perceived this system in a negative light. This negative attitude could be attributed to the frequent malfunctions and complexity of the entire electronic system, although it is necessary to say that, because of the previous conclusions, these two groups perceived the process of electronization as very positive.
