Wastewater Reclamation Holds a Key for Water Sustainability in Future Urban Development of Phoenix Metropolitan Area


Abstract
1. Introduction
2. Methodology
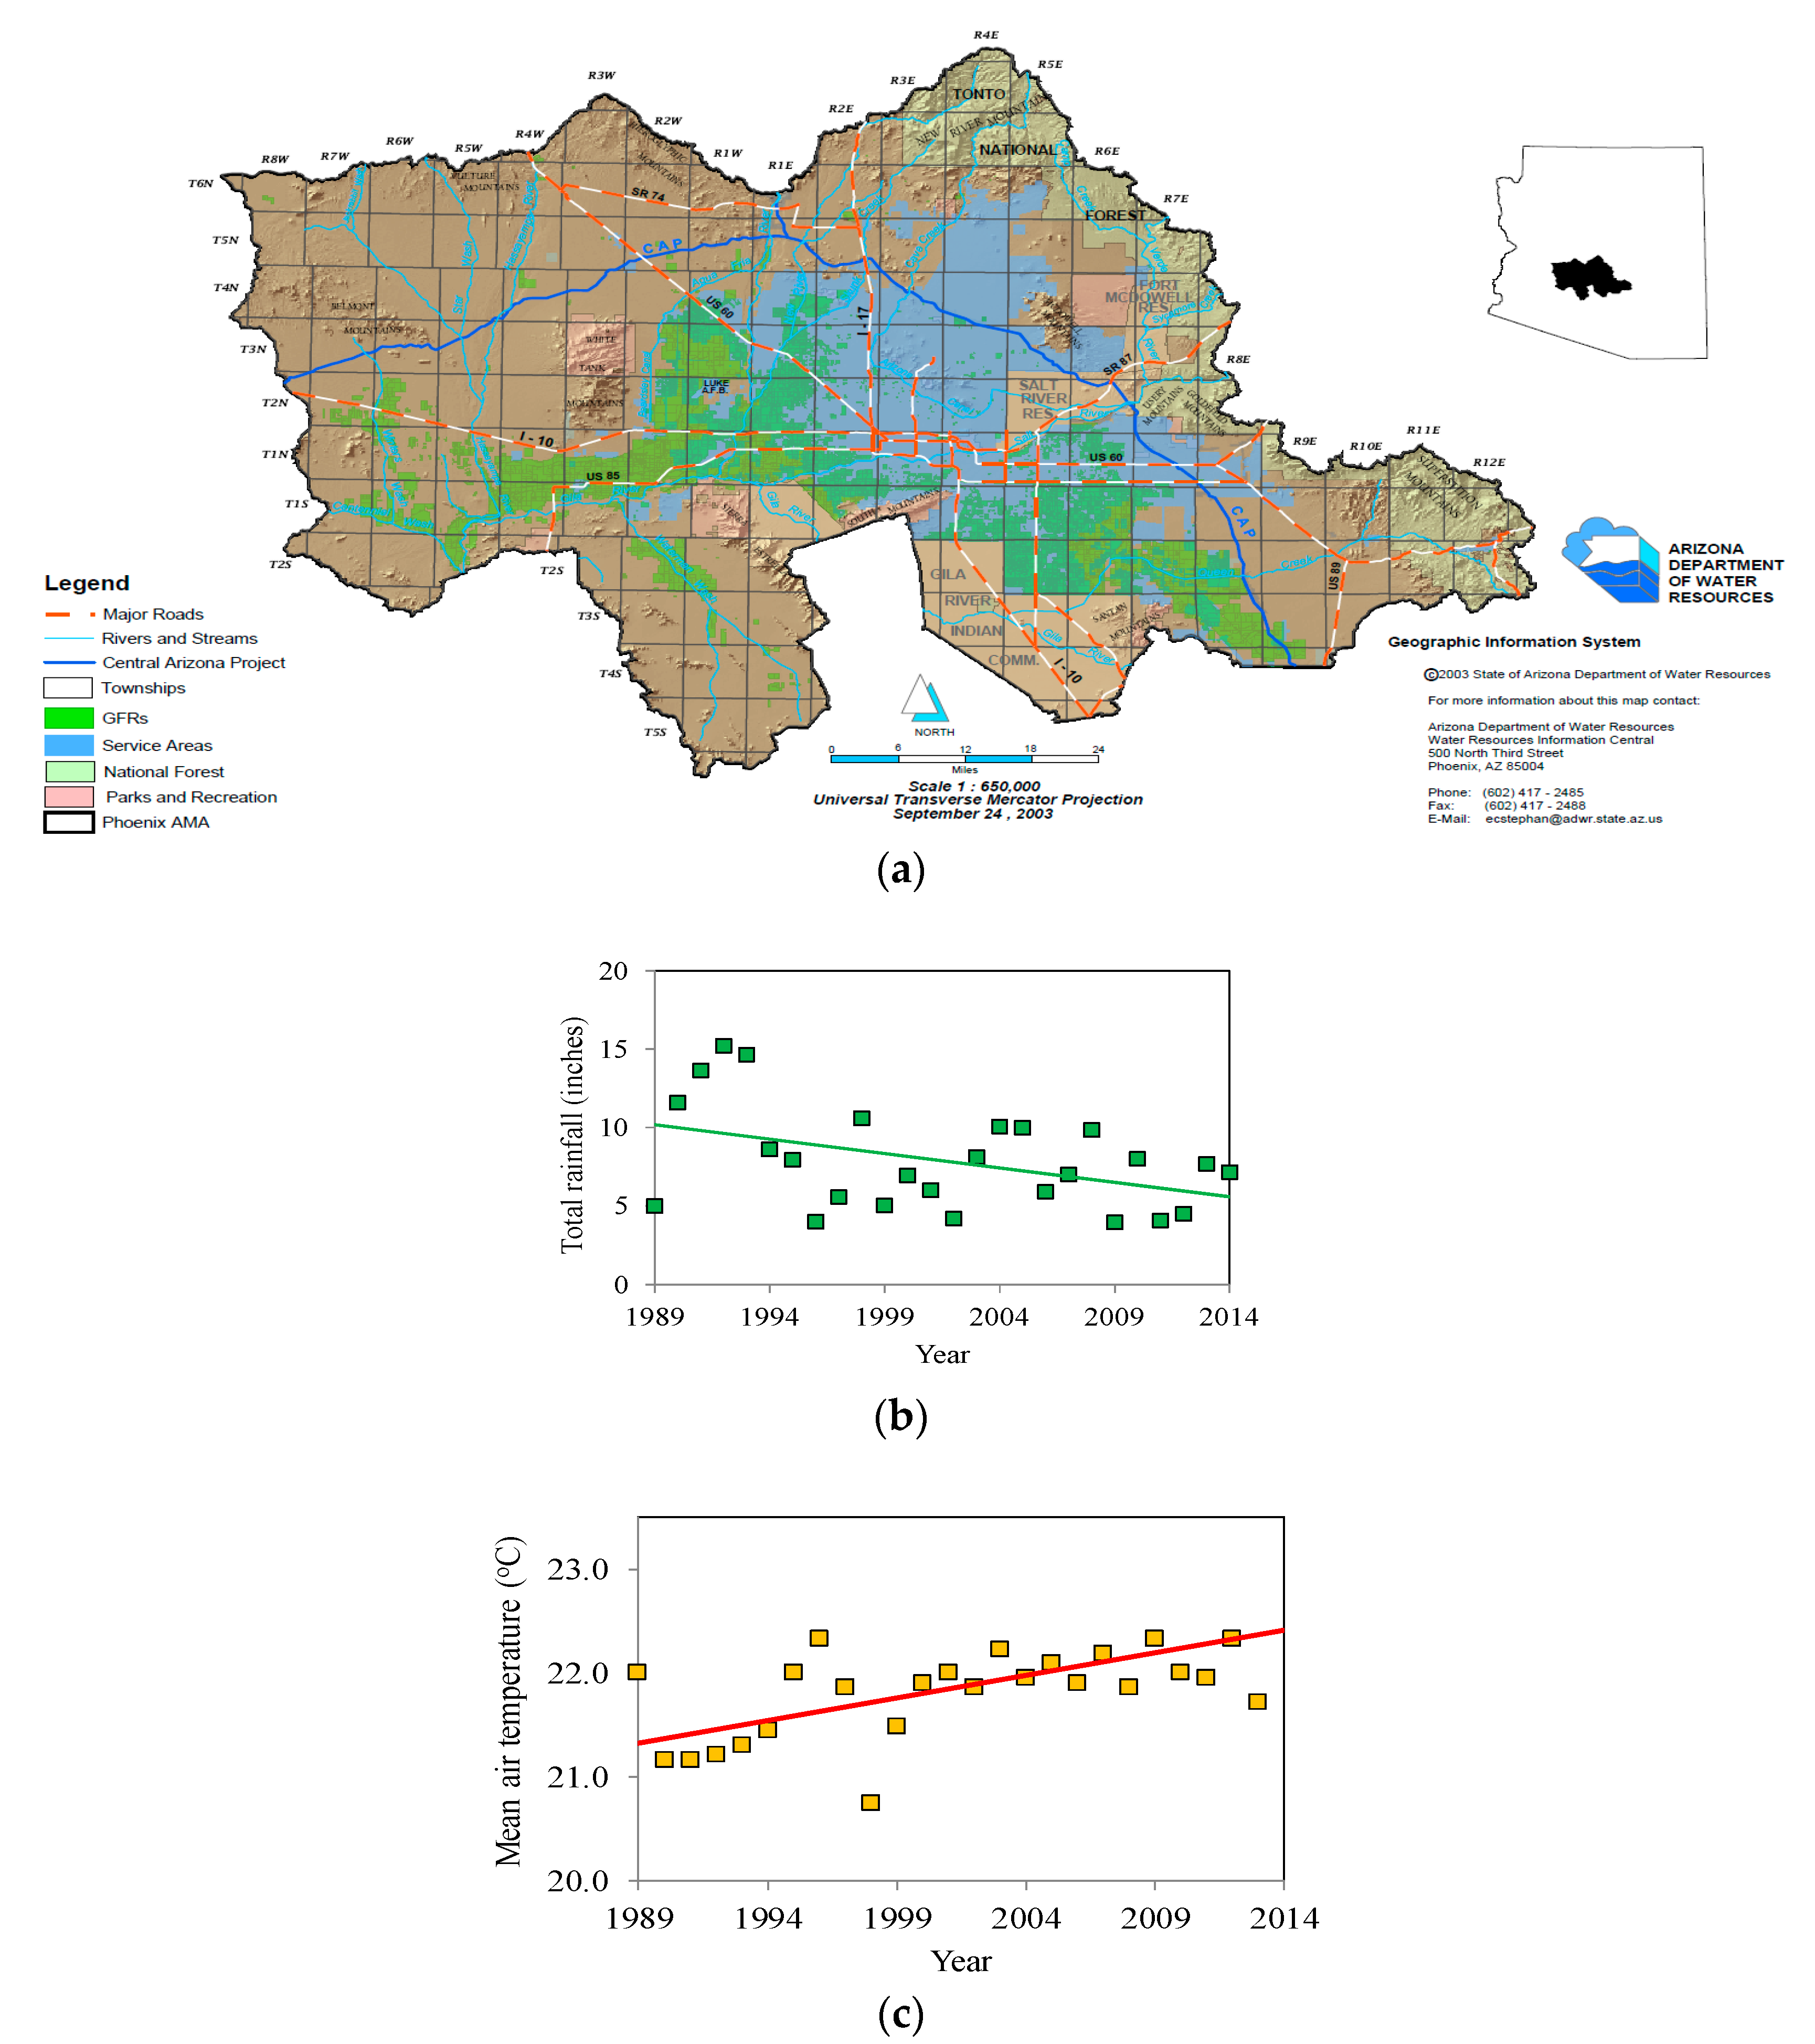
2.1. Study Area
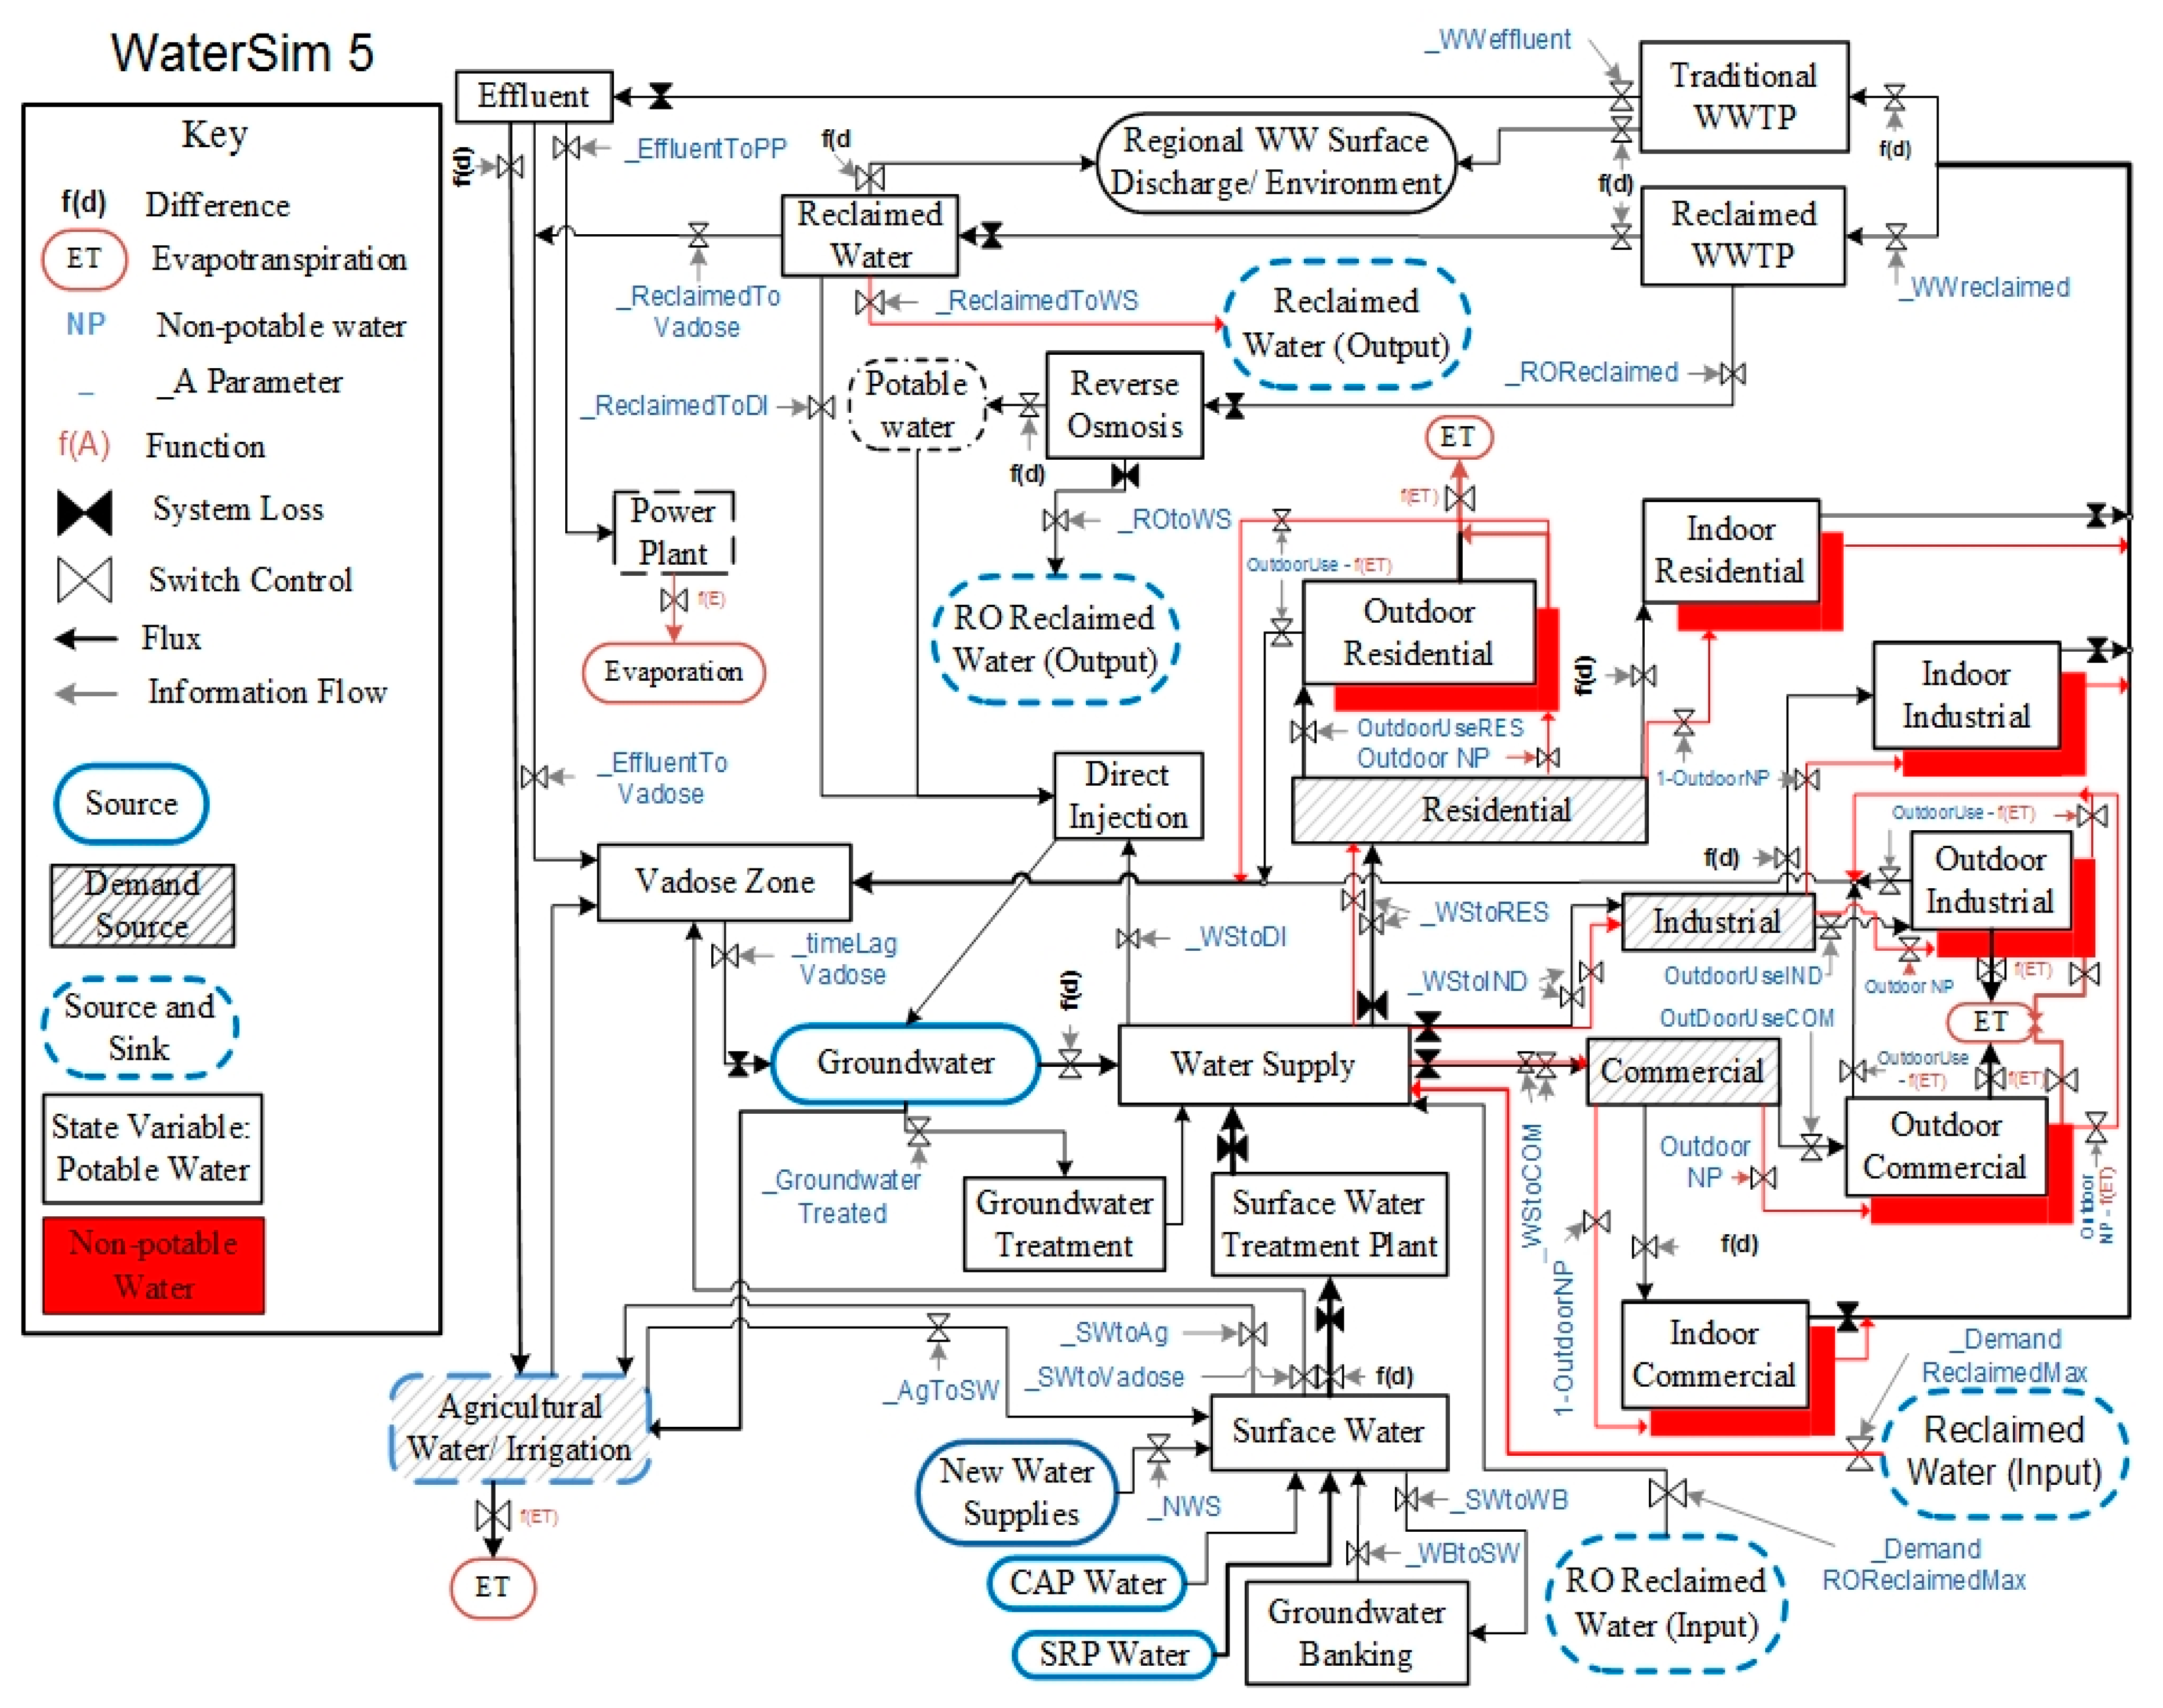
2.2. WaterSim
2.3. Sustainability Indicators
2.4. Scenario Design
3. Results and Discussion
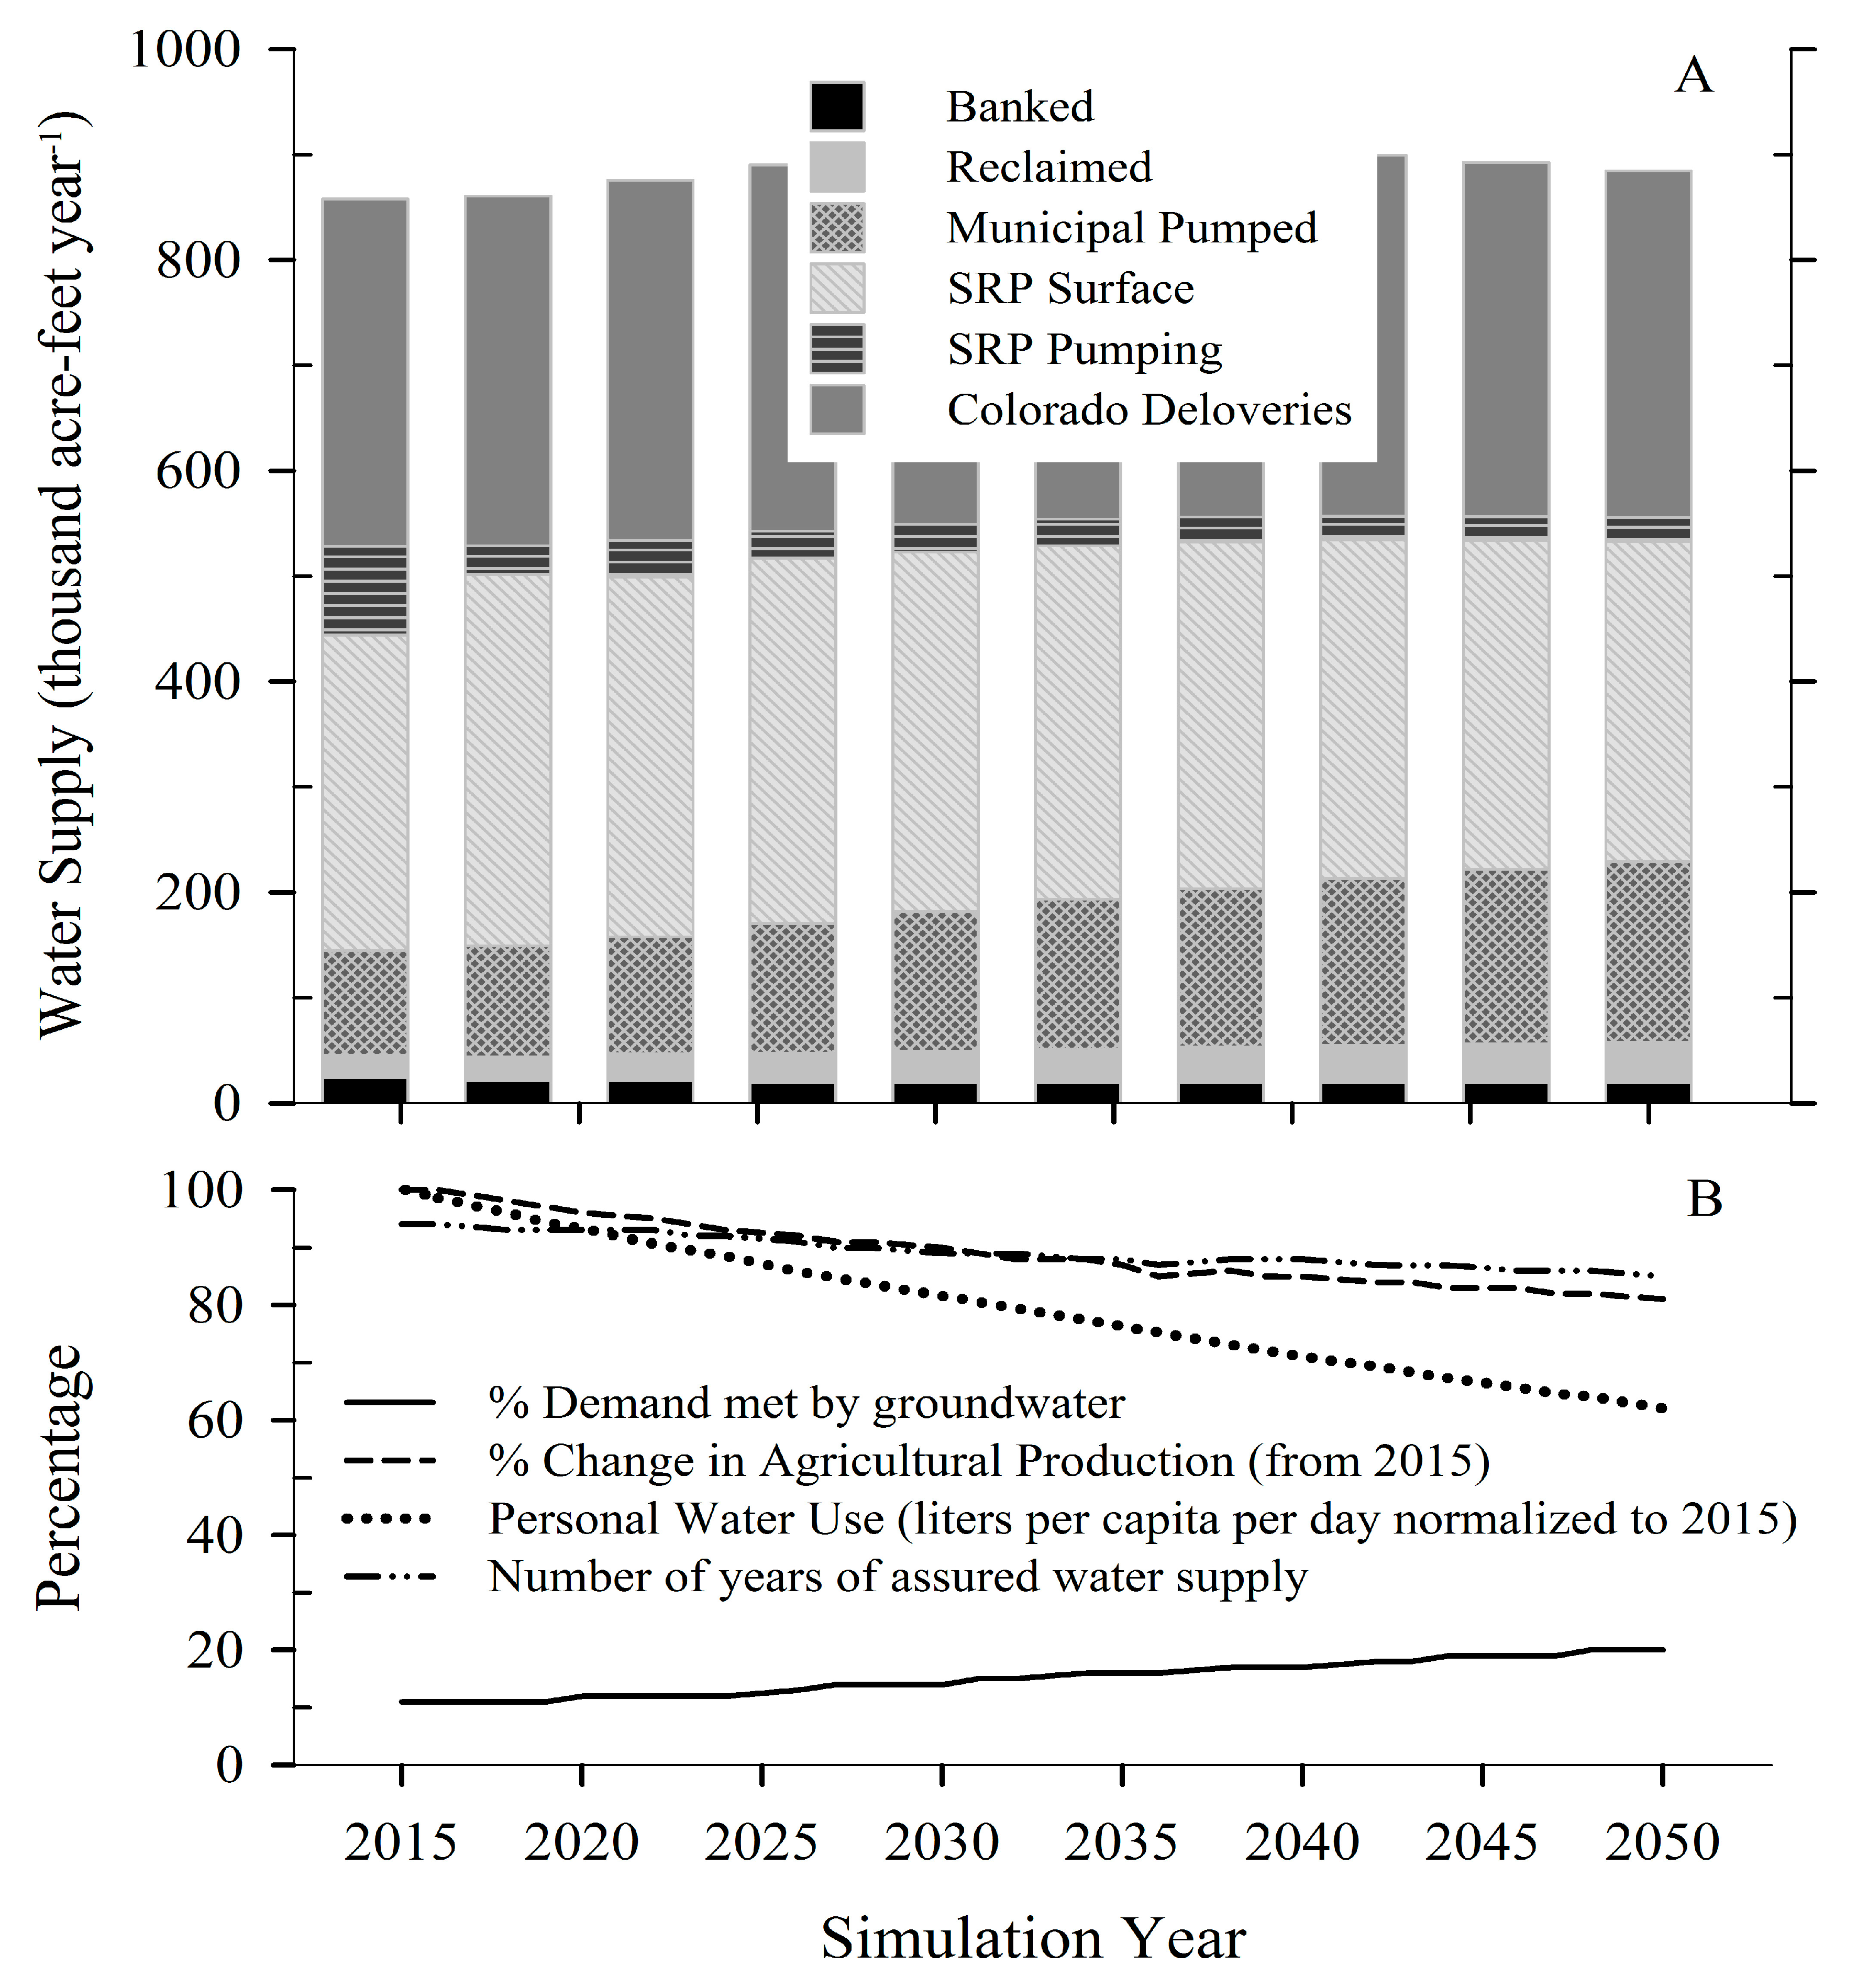
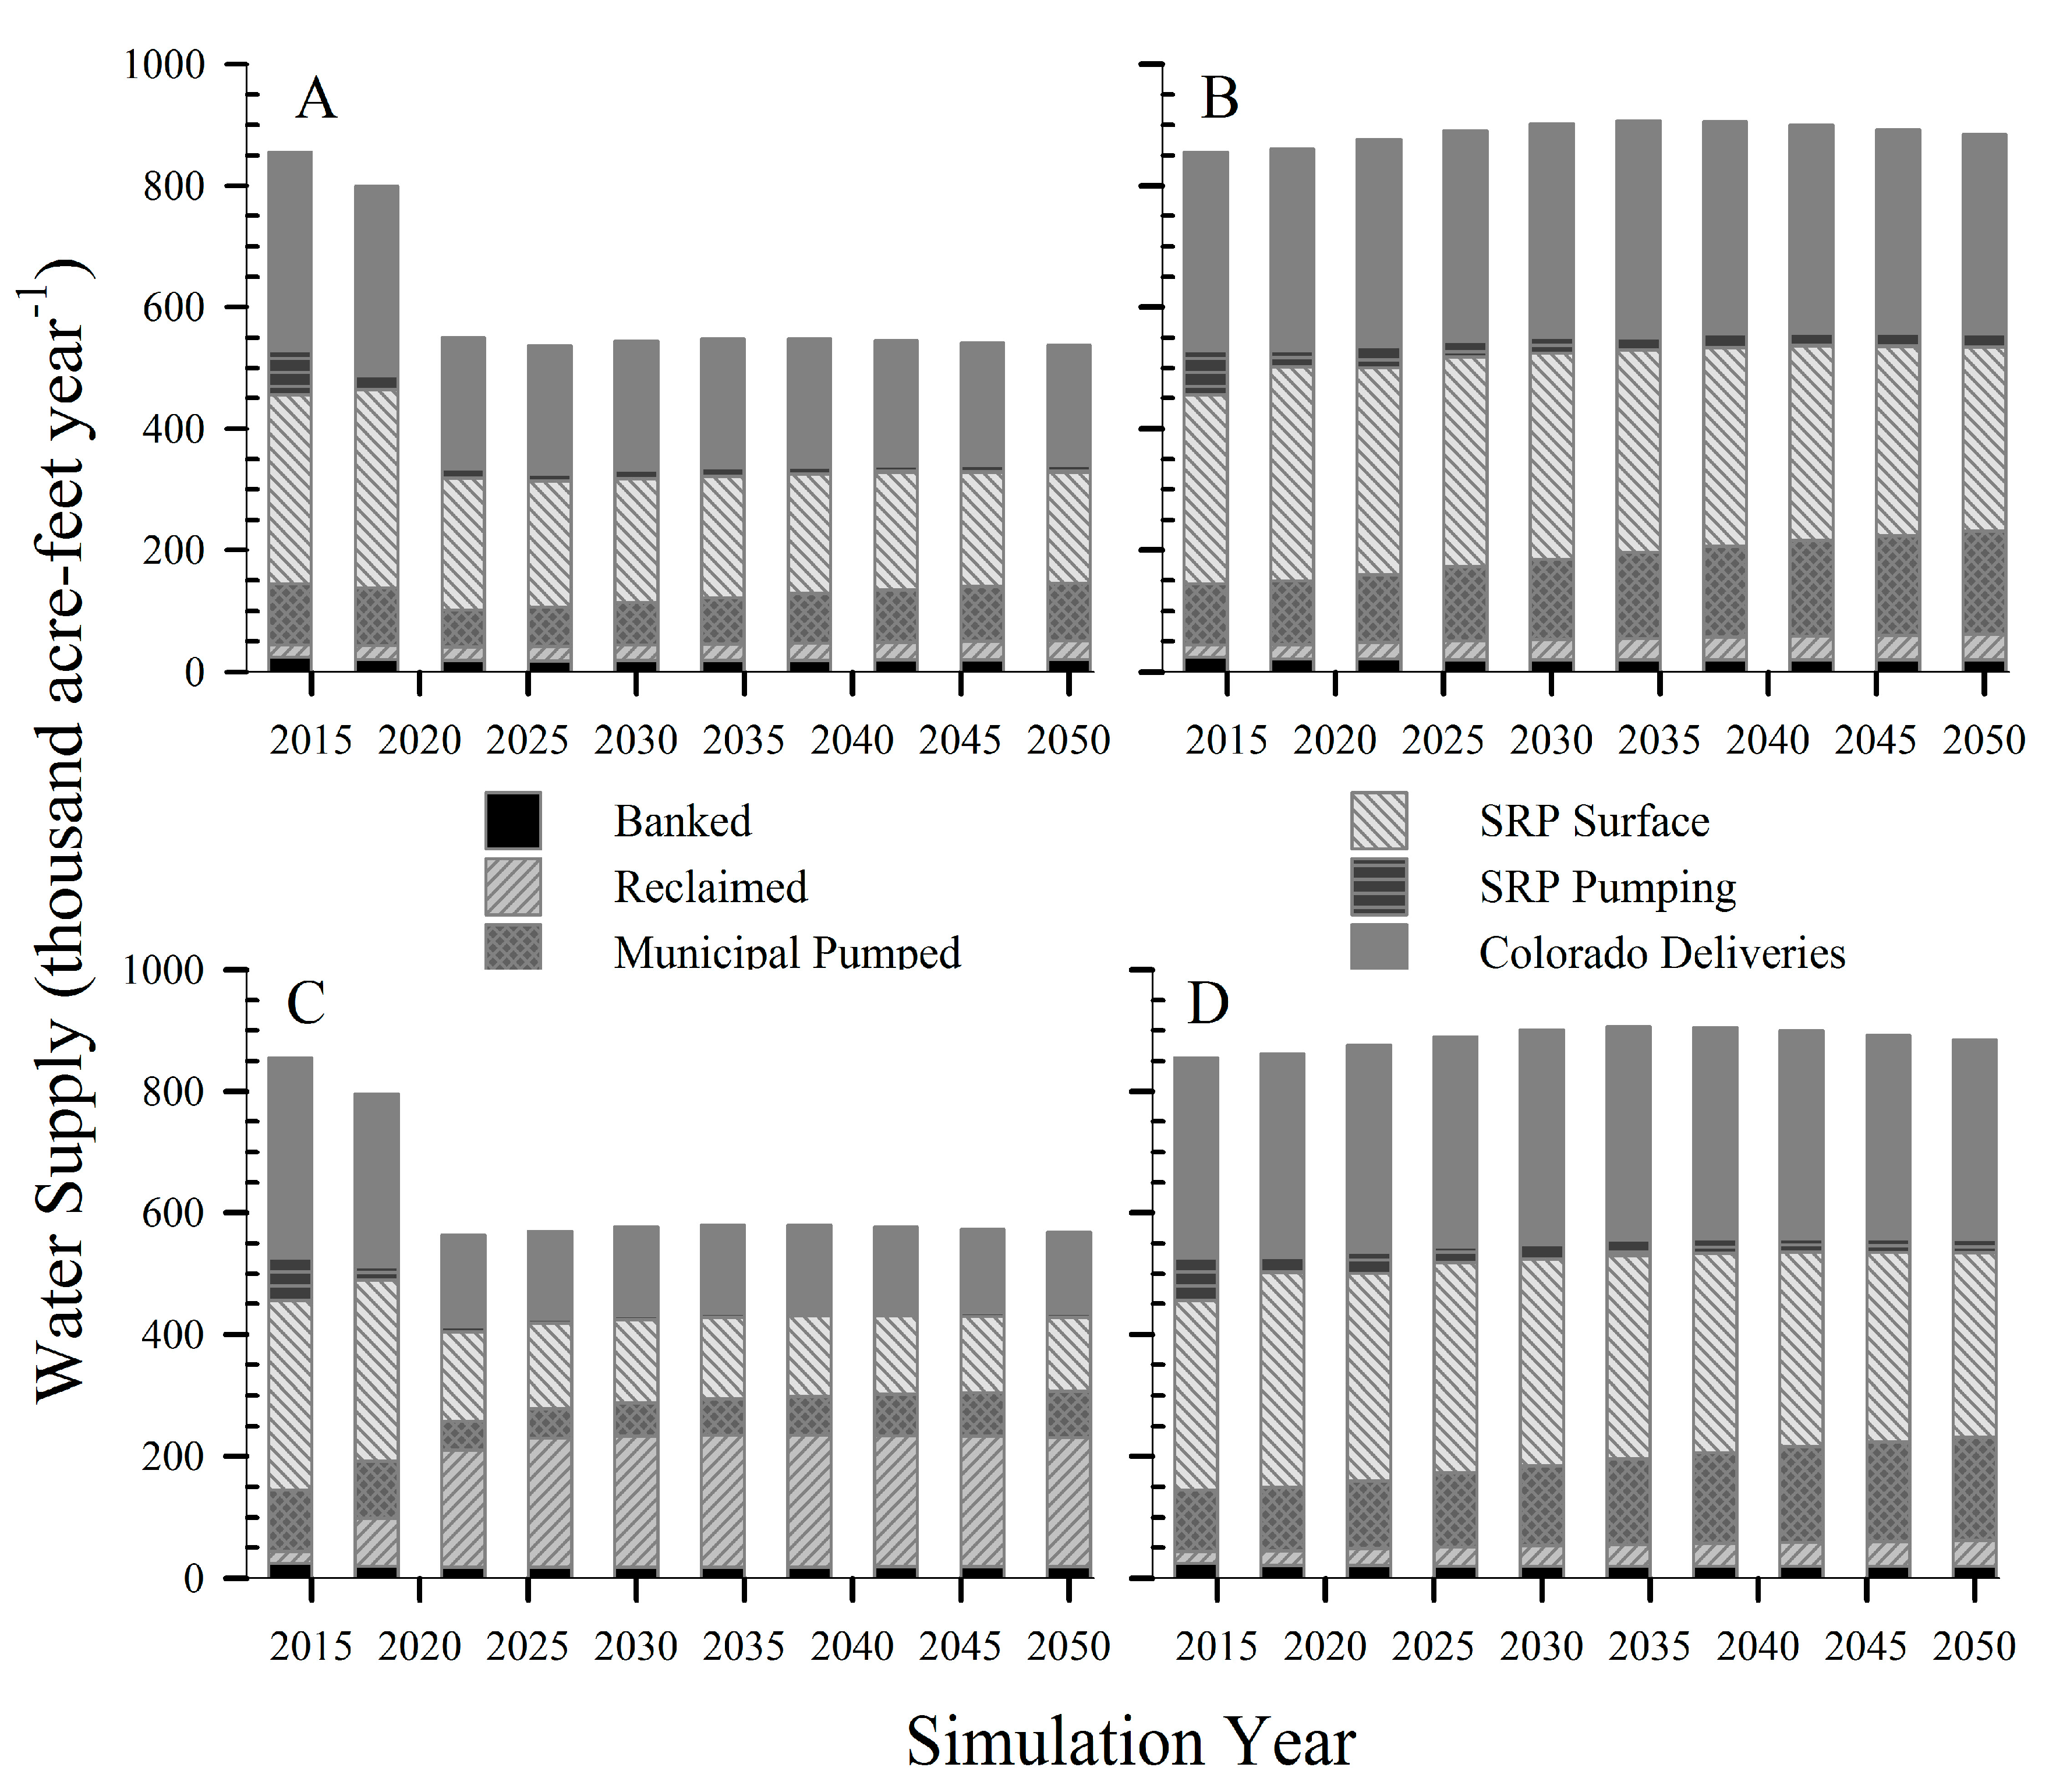
3.1. Impact of Wastewater Reuse
3.2. Impact of Outdoor Water Use
3.3. Impact of Agriculture Water Use
4. Concluding Remarks
Author Contributions
Funding
Conflicts of Interest
References
- Hoekstra, A.Y.; Mekonnen, M.M.; Chapagain, A.K.; Mathews, R.E.; Richter, B.D. Global Monthly Water Scarcity: Blue Water Footprints versus Blue Water Availability. PLoS ONE 2012, 7, e32688. [Google Scholar] [CrossRef] [PubMed]
- Savenije, H.H.G. Water scarcity indicators: The deception of numbers. Phys. Chem. Earth 1999, 25, 199–204. [Google Scholar] [CrossRef]
- Damkjaer, S.; Taylor, R. The measurement of water scarcity: Defining a meaningful indicator. Ambio 2017, 46, 513–531. [Google Scholar] [CrossRef] [PubMed]
- Schewe, J.; Heinke, J.; Gerten, D.; Haddeland, I.; Arnell, N.W.; Clark, D.B.; Dankers, R.; Eisner, S.; Fekete, B.M.; Colon-Gonzalez, F.J.; et al. Multimodel assessment of water scarcity under climate change. Proc. Natl. Acad. Sci. USA 2014, 111, 3245–3250. [Google Scholar] [CrossRef] [PubMed]
- Gober, P.; Kirkwood, C.W.; Balling, R.C.; Ellis, A.W.; Deitrick, S. Water planning under climatic uncertainty in phoenix: Why we need a new paradigm. Ann. Assoc. Am. Geogr. 2010, 100, 356–372. [Google Scholar] [CrossRef]
- Wang, Z.H.; Upreti, R. A scenario analysis of thermal environmental changes induced by urban growth in Colorado River Basin, USA. Landsc. Urban Plan. 2019, 181, 125–138. [Google Scholar] [CrossRef]
- Wang, Z.H.; Zhao, X.; Yang, J.; Song, J. Cooling and energy saving potentials of shade trees and urban lawns in a desert city. Appl. Energy 2016, 161, 437–444. [Google Scholar] [CrossRef]
- Ward, F.A.; Pulido-Velazquez, M. Efficiency, equity, and sustainability in a water quantity-quality optimization model in the Rio Grande basin. Ecol. Econ. 2008, 66, 23–37. [Google Scholar] [CrossRef]
- Bithas, K. The sustainable residential water use: Sustainability, efficiency and social equity. The European experience. Ecol. Econ. 2008, 68, 221–229. [Google Scholar] [CrossRef]
- Oke, T.R. The energetic basis of the urban heat island. Q. J. R. Meteorol. Soc. 1982, 108, 1–24. [Google Scholar] [CrossRef]
- Song, J.; Wang, Z.H. Interfacing urban land-atmosphere through coupled urban canopy and atmospheric models. Bound. Layer Meteorol. 2015, 154, 427–448. [Google Scholar] [CrossRef]
- Song, J.; Wang, Z.H. Diurnal changes in urban boundary layer environment induced by urban greening. Environ. Res. Lett. 2016, 11, 114018. [Google Scholar] [CrossRef]
- Song, J.; Wang, Z.H. Evaluating the impact of built environment characteristics on urban boundary layer dynamics using an advanced stochastic approach. Atmos. Chem. Phys. 2016, 16, 6285–6301. [Google Scholar] [CrossRef]
- Song, J.; Wang, Z.H.; Wang, C. The regional impact of urban heat mitigation strategies on planetary boundary-layer dynamics over a semi-arid city. J. Geophys. Res. Atmos. 2018, 123, 6410–6422. [Google Scholar] [CrossRef]
- Wang, Z.H.; Bou-Zeid, E.; Smith, J.A. A coupled energy transport and hydrological model for urban canopies evaluated using a wireless sensor network. Q. J. R. Meteorol. Soc. 2013, 139, 1643–1657. [Google Scholar] [CrossRef]
- Wang, Z.H. A new perspective of urban-rural differences: The impact of soil water advection. Urban Clim. 2014, 10, 19–34. [Google Scholar] [CrossRef]
- Gober, P.; Brazel, A.; Quay, R.; Myint, S.; Grossman-Clarke, S.; Miller, A.; Rossi, S. Using watered landscapes to manipulate urban heat island effects: How much water will it take to cool Phoenix? J. Am. Plan. Assoc. 2010, 76, 109–121. [Google Scholar] [CrossRef]
- Yang, J.; Wang, Z.H. Optimizing urban irrigation schemes for the trade-off between energy and water consumption. Energy Build. 2015, 107, 335–344. [Google Scholar] [CrossRef]
- Yang, J.; Wang, Z.H. Planning for a sustainable desert city: The potential water buffering capacity of urban green infrastructure. Landsc. Urban Plan. 2017, 167, 339–347. [Google Scholar] [CrossRef]
- U.S. Census Bureau. 2010 Census of Population and Housing; Technical Documentation DPSF/10-4(RV); Economics and Statistics Administration, U.S. Department of Commerce: Suitland, MD, USA, 2011. Available online: https://www.census.gov/prod/cen2010/doc/dpsf.pdf (accessed on 9 January 2019).
- Murray, A.T.; Gober, P.; Anselin, L.; Rey, S.J.; Sampson, D.; Padegimas, P.D.; Liu, Y. Spatial optimization models for water supply allocation. Water Resour. Manag. 2012, 26, 2243–2257. [Google Scholar] [CrossRef]
- Middel, A.; Quay, R.; White, D.D. Water Reuse in Central Arizona; Decision Center for a Desert City Technical Report 13-01; Arizona State University: Tempe, AZ, USA, 2013. [Google Scholar]
- Zhang, W.L.; Wang, C.; Li, Y.; Wang, P.F.; Wang, Q.; Wang, D.W. Seeking Sustainability: Multiobjective Evolutionary Optimization for Urban Wastewater Reuse in China. Environ. Sci. Technol. 2014, 48, 1094–1102. [Google Scholar] [CrossRef] [PubMed]
- Sampson, D.A.; Escobar, V.; Tschudi, M.K.; Lant, T.; Gober, P. A provider-based water planning and management model—WaterSim 4.0-For the Phoenix Metropolitan Area. J. Environ. Manag. 2011, 92, 2596–2610. [Google Scholar] [CrossRef] [PubMed]
- Sampson, D.A.; Quay, R.; White, D.D. Anticipatory modeling for water supply sustainability in Phoenix, Arizona. Environ. Sci. Policy 2016, 55, 36–46. [Google Scholar] [CrossRef]
- Keeler, L.W.; Wiek, A.; White, D.D.; Sampson, D.A. Linking stakeholder survey, scenario analysis, and simulation modeling to explore the long-term impacts of regional water governance regimes. Environ. Sci. Policy 2015, 48, 237–249. [Google Scholar] [CrossRef]
- Gober, P.; Sampson, D.A.; Quay, R.; White, D.D.; Chow, W.T.L. Urban adaptation to mega-drought: Anticipatory water modeling, policy, and planning for the urban Southwest. Sustain. Cities Soc. 2016, 27, 497–504. [Google Scholar] [CrossRef]
- U.S. EPA. Land-Use Scenarios: National-Scale Housing Density Scenarios Consistent with Climate Change Storylines; U.S. Environmental Protection Agency: Washington, DC, USA, 2019.
- Bierwagen, B.G.; Theobald, D.M.; Pyke, C.R.; Choate, A.; Groth, P.; Thomas, J.V.; Morefield, P. National housing and impervious surface scenarios for integrated climate impact assessments. Proc. Natl. Acad. Sci. USA 2010, 107, 20887–20892. [Google Scholar] [CrossRef] [PubMed]
- White, D.D.; Corley, E.A.; White, M.S. Water managers’ perceptions of the science-policy interface in phoenix, Arizona: Implications for an emerging boundary organization. Soc. Nat. Resour. 2008, 21, 230–243. [Google Scholar] [CrossRef]
- White, D.D.; Wutich, A.; Larson, K.L.; Gober, P.; Lant, T.; Senneville, C. Credibility, salience, and legitimacy of boundary objects: Water managers’ assessment of a simulation model in an immersive decision theater. Sci. Public Policy 2010, 37, 219–232. [Google Scholar] [CrossRef]
- Maguire, R.P. Patching the holes in the bucket: Safe yield and the future of water management in Arizona. Ariz. Law Rev. 2007, 49, 361–383. [Google Scholar]
- Gober, P.; White, D.D.; Quay, R.; Sampson, D.A.; Kirkwood, C.W. Socio-hydrology modelling for an uncertain future, with examples from the USA and Canada. Geol. Soc. Lond. Spec. Publ. 2017, 408, 183–199. [Google Scholar] [CrossRef]
- ADWR. AZ’s Groundwater Management Act of 1980; Arizona Department of Water Resources: Phoenix, AZ, USA, 2016. Available online: https://new.azwater.gov/news/articles/2016-18-11 (accessed on 8 March 2018).
- Cook, B.I.; Ault, T.R.; Smerdon, J.E. Unprecedented 21st century drought risk in the American Southwest and Central Plains. Sci. Adv. 2015, 1, e1400082. [Google Scholar] [CrossRef] [PubMed]
- Patz, J.A.; Campbell-Lendrum, D.; Holloway, T.; Foley, J.A. Impact of regional climate change on human health. Nature 2005, 438, 310–317. [Google Scholar] [CrossRef] [PubMed]
- ADOA-EPS. Office of Employment and Population Statistics Maricopa County 2015–2050 Projections; Office of Economic Opportunity, State of Arizona: Phoenix, AZ, USA, 2015. Available online: https://population.az.gov/population-projections (accessed on 8 July 2016).
- Wang, C.; Wang, Z.H. Projecting population growth as a dynamic measure of regional urban warming. Sustain. Cities Soc. 2017, 32, 357–365. [Google Scholar] [CrossRef]
- DeOreo, W.B.; Mayer, P.; Dziegielewski, B.; Kiefer, J. Residential End Uses of Water, Version 2 Executive Report; Water Research Foundation: Denver, CO, USA, 2016; p. 15. [Google Scholar]
- Larson, K.L.; White, D.D.; Gober, P.; Wutich, A. Decision-Making under Uncertainty for Water Sustainability and Urban Climate Change Adaptation. Sustainability 2015, 7, 14761–14784. [Google Scholar] [CrossRef]
- Song, J.; Wang, Z.H. Impacts of mesic and xeric urban vegetation on outdoor thermal comfort and microclimate in Phoenix, AZ. Build. Environ. 2015, 94, 558–568. [Google Scholar] [CrossRef]
- Middel, A.; Hab, K.; Brazel, A.J.; Martin, C.A.; Guhathakurta, S. Impact of urban form and design on mid-afternoon microclimate in Phoenix Local Climate Zones. Landsc. Urban Plan. 2014, 122, 16–28. [Google Scholar] [CrossRef]
- Larson, K.L.; Polsky, C.; Gober, P.; Chang, H.; Shandas, V. Vulnerability of water systems to the effects of climate change and urbanization: A comparison of Phoenix, Arizona and Portland, Oregon (USA). Environ. Manag. 2013, 52, 179–195. [Google Scholar] [CrossRef]
- Quay, R.; Hester, C.; Larson, K.L.; White, D.D. Urban Landscape Water Use Research Evaluation; Water Research Foundation: Denver, CO, USA, 2018; p. 115. [Google Scholar]
- ADWR. Arizona Water Atlas, Volume 8: Active Management Area Planning Area; Arizona Department of Water Resources: Phoenix, AZ, USA, 2010; p. 456.
- Gammage, G.J.; Stigler, M.; Clark-Johnson, S.; Daugherty, D.; Hart, W. Watering the Sun Corridor: Managing Choices in Arizona’s Megapolitan Area; Morrison Institute for Public Policy, Arizona State University: Tempe, AZ, USA, 2011; p. 40. [Google Scholar]
- Gober, P.; Kirkwood, C.W. Vulnerability assessment of climate-induced water shortage in Phoenix. Proc. Natl. Acad. Sci. USA 2010, 107, 21295–21299. [Google Scholar] [CrossRef]
- Auch, R.; Taylor, J.; Acevedo, W. Urban Growth in American Cities: Glimpses of U.S. Urbanization; U.S. Department of the Interior and U.S. Geological Survey: Reston, VA, USA, 2004. Available online: https://pubs.usgs.gov/circ/2004/circ1252/ (accessed on 8 January 2019).
- Bolin, B.; Seetharam, M.; Pompeii, B. Water resources, climate change, and urban vulnerability: A case study of Phoenix, Arizona. Local Environ. 2010, 15, 261–279. [Google Scholar] [CrossRef]


| Scenarios | Desert City (DC) | Green City (GC) | Expanded City into Desert (ECD) | Expanded City into Agriculture (ECA) |
|---|---|---|---|---|
| Emphatic development plan | Maximize water saving to prepare for potential drought | Maximize the cooling effect by urban green infrastructure | Desert-urban conversion by preserving agriculture | Trade-off between agricultural and urban water use |
| Population growth | ADOA-EPS medium projection | ADOA-EPS medium projection | ADOA-EPS high projection | ADOA-EPS high projection |
| Land use change | Xeric and desert landscape | Mesic and oasis landscape | Desert-urban conversion | Agriculture-urban conversion |
| Water sustainability measure | Eliminating outdoor water use for irrigation and pools | Increasing outdoor water use for green spaces | Increasing urban water use proportional to population | Trade-off between urban and agricultural water |
| Impact on UHI | Adapt to effects | Mitigate UHI via water-energy trade-off | Status quo | Status quo |
| Scenarios | DC | GC | ECD | ECA | ||||
|---|---|---|---|---|---|---|---|---|
| Farm water used | 30% | 30% | 30% | 100% | ||||
| Environmental flows | 0% | 0% | 0% | 0% | ||||
| Per capita water use | 100% | 100% | 100% | 100% | ||||
| Outdoor water use | 60% | 120% | 100% | 100% | ||||
| Population growth (relative to that forecasted) | 100% | 100% | 150% | 150% | ||||
| Wastewater reclaimed | 19% | 100% | 19% | 100% | 19% | 100% | 19% | 100% |
| Scenarios | DC | GC | ECD | ECA | ||||
|---|---|---|---|---|---|---|---|---|
| Groundwater | 18% | 14% | 20% | 14% | 24% | 16% | 24% | 16% |
| Agricultural Production | 81% | 81% | 81% | 81% | 81% | 81% | 27% | 11% |
| Personal Water Use (gpcd) | 70 | 70 | 117 | 117 | 116 | 116 | 116 | 116 |
| Years of Adequate Groundwater Supply | 90 | 89 | 85 | 85 | 76 | 81 | 83 | 90 |
© 2019 by the authors. Licensee MDPI, Basel, Switzerland. This article is an open access article distributed under the terms and conditions of the Creative Commons Attribution (CC BY) license (http://creativecommons.org/licenses/by/4.0/).
Share and Cite
Wang, Z.-H.; von Gnechten, R.; Sampson, D.A.; White, D.D. Wastewater Reclamation Holds a Key for Water Sustainability in Future Urban Development of Phoenix Metropolitan Area. Sustainability 2019, 11, 3537. https://doi.org/10.3390/su11133537
Wang Z-H, von Gnechten R, Sampson DA, White DD. Wastewater Reclamation Holds a Key for Water Sustainability in Future Urban Development of Phoenix Metropolitan Area. Sustainability. 2019; 11(13):3537. https://doi.org/10.3390/su11133537
Chicago/Turabian StyleWang, Zhi-Hua, Rachel von Gnechten, David A. Sampson, and Dave D. White. 2019. "Wastewater Reclamation Holds a Key for Water Sustainability in Future Urban Development of Phoenix Metropolitan Area" Sustainability 11, no. 13: 3537. https://doi.org/10.3390/su11133537
APA StyleWang, Z.-H., von Gnechten, R., Sampson, D. A., & White, D. D. (2019). Wastewater Reclamation Holds a Key for Water Sustainability in Future Urban Development of Phoenix Metropolitan Area. Sustainability, 11(13), 3537. https://doi.org/10.3390/su11133537