Smart City: Modeling Key Indicators in Serbia Using IT2FS


Abstract
1. Introduction
2. Conceptualizing Smart City
3. Research Methodology
3.1. Identification of Factors Affecting the Smart Cities Concept
3.2. Operationalizing the Smart City in Serbia
3.3. Fuzzy Hybrid Model
Multi-Criteria Decision Making: A Hybrid Fuzzy MCDM Model Based on Interval Type-2 Fuzzy Sets
4. Results
5. Measures to Implement Priorities
- People—crucial to define the framework of a smart city is to define the meaning of the concept of “community” in a specific environment. Each community has its own identified needs and challenges, and their coexistence and mutual interactions constitute the framework within which the smart city development.
- Processes—if the process identifies the so-called “pain-points”, they present important information about potential constraints in communication channels between city administration and communities.
- Technologies—connections between people and processes, strategic and targeted applied technological solutions can greatly facilitate or even completely eliminate the inefficient and obstructive processes. In smart cities, technology is not the first, but the last step in creating technologically advanced and sustainable communities, based on understanding people and processes that make smart the environment.
- The engagement of citizens in creating and establishing a vision, using social networks, the media, digital technologies (on-line forums, workshops, etc.);
- Wishes should not replace proper project methodology and framework, and it is necessary to set measurable targets and select indicators;
- The lean methodology should have been applied wherever it is possible—especially if it concerns the development of new expansive infrastructure.
- The initiative for establishing a smart sustainable city must have a strong political consensus within the local authorities. The consensus has must be achieved through the selection of a competent leadership of the project, coordination between relevant stakeholders, joint decision-making, management of changes, joint problem overcoming. Responsibility and the ability to make quick decisions is the key to success.
- The set of goals must be clear and must enable the quantification and evaluation of the obtained results which can be easily presented to citizens. It is important to elaborate on the communication strategy of the project.
- The continuous evaluation of the results is essential for proving the value of the transformation process and achieving benefits for citizens. Selection of relevant key indicators considerably determines the quality of the results.
- Implementation of the public-private cooperation model, particularly civil society, universities, and local government, will be a guarantee of success. Planning must facilitate the development of scenarios and strategies of implementing the transformation, identification of the mutual benefits of all, and the economic effects of such cooperation are significant.
- A feasibility study must confirm the feasibility of the project and, more importantly, the long-term sustainability of all components.
- Citizens are significant participants in a smart, sustainable city. They are users of services and they can provide valuable data, ideas, and comments.
6. Conclusions
Author Contributions
Funding
Acknowledgments
Conflicts of Interest
References
- Ahvenniemi, H.; Huovila, A.; Pinto-Seppa, I.; Airaksinen, M. What are the differences between sustainable and smart cities? Cities 2017, 60, 234–245. [Google Scholar] [CrossRef]
- Yigitcanlar, T.; Kamruzzaman, M.; Foth, M.; Sabatini-Marques, J.; Costa, E.; Ioppoloe, G. Can cities become smart without being sustainable? A systematic review of the literature. Sustain. Cities Soc. 2019, 45, 348–365. [Google Scholar] [CrossRef]
- Alkandari, A.; Alnasheet, M.; Alshekhly, I.F.T. Smart Cities: Survey. J. Adv. Comput. Sci. Technol. Res. 2012, 2, 79–90. [Google Scholar]
- Golej, J. Smart growth and sustainable development: New trends in land development. In Proceedings of the International Scientific Conference People, Buildings and Environment, Kroměříž, Czech Republic, 15–17 October 2014; pp. 164–176. [Google Scholar]
- Lopes, I.M.; Oliveira, P. Can a small city be considered a smart city? Procedia Comput. Sci. 2017, 121, 617–624. [Google Scholar] [CrossRef]
- Moser, C.; Wendel, T.; Carabias-Hütter, V. Scientific and Practical Understandings of Smart Cities. In Proceedings of the Conference REAL CORP, Vienna, Austria, 21–23 May 2014; pp. 507–514. [Google Scholar]
- Eremia, M.; Toma, L.; Sanduleac, M. The Smart City Concept in the 21st Century. Procedia Eng. 2017, 181, 12–19. [Google Scholar] [CrossRef]
- Hsi-Peng, L.; Chiao-Shan, C.; Hueiju, Y. Technology roadmap for building a smart city: An exploring study on methodology. Future Gener. Comput. Syst. 2019, 97, 727–742, In Press. [Google Scholar]
- Guedes, A.L.A.; Alvarenga, J.C.; Goulart, M.S.S.; Rodriguez, M.V.R.; Soares, C.A.P. Smart Cities: The Main Drivers for Increasing the Intelligence of Cities. Sustainability 2018, 10, 3121. [Google Scholar] [CrossRef]
- Marsal-Llacuna, M.L.; Segal, M.E. The Intelligenter Method (I) for making “smarter” city projects and plans. Cities 2016, 55, 127–138. [Google Scholar] [CrossRef]
- Monzon, A. Smart Cities Concept and Challenges: Bases for the Assessment of Smart City Projects. Commun. Comput. Inf. Sci. 2015, 579, 17–31. [Google Scholar]
- Apostolopoulos, P.A.; Tsiropoulou, E.E.; Papavassiliou, S. Demand response management in smart grid networks: A two-stage game-theoretic learning-based approach. Mob. Netw. Appl. 2018, 1–14. [Google Scholar] [CrossRef]
- Falconer, G.; Mitchell, S. Smart City Framework: A Systematic Process for Enabling Smart + Connected Communities. Cisco Internet Business Solutions Group (IBSG), 2012. Available online: https://www.cisco.com/c/dam/en_us/about/ac79/docs/ps/motm/Smart-City-Framework.pdf (accessed on 27 June 2019).
- Đukić, A.; Antonić, B. The concept of a smart city as response to climate changes. In Monograph Spatial, Ecological, Energy and Social Aspects of Cities Development and Climate Changes; Institute for Architecture and Urbanism Serbia: Belgrade, Serbia, 2016; pp. 15–32. ISBN 978-86-80329-85-7. (In Serbian) [Google Scholar]
- European Parliament. Mapping Smart Cities in the EU: the Study; Policy Department A: Economic and Scientific Policy; European Parliament: Brussels, Belgium, 2014.
- Wey, W.M.; Hsu, J. New Urbanism and Smart Growth: Toward achieving a smart National Taipei University District. Habitat Int. 2014, 42, 164–174. [Google Scholar] [CrossRef]
- Dameri, R.P.; Cocchia, A. Smart City and Digital City: Twenty Years of Terminology Evolution. In Proceedings of the 10th Conference of the Italian Chapter of AIS (ITAIS), Universita Commercial Luigi Bocooni, Milan, Italy, 14 December 2013; pp. 1–8. [Google Scholar]
- Susantia, R.; Soetomo, S.; Buchori, I.; Brotosunaryo, P.M. Smart Growth, Smart Cities and Density: In Search of The Appropriate Indicator for Residential Density in Indonesia. Procedia Soc. Behav. Sci. 2016, 227, 194–201. [Google Scholar] [CrossRef]
- Mosannenzade, F.; Vettorato, D. Defining smart city: A conceptual framework based on keyword analysis. TeMA J. Land Use Mobil. Environ. 2014, 12, 683–694. [Google Scholar]
- Papa, R.; Galderisi, A.; Vigo Majello, M.C.; Saretta, E. Smart and resilient cities: A systematic approach for developing cross-sectoral strategies in the face of climate change. TeMA J. Land Use Mobil. Environ. 2015, 8, 19–50. [Google Scholar]
- Deakin, M. Smart cities: The state-of-the-art and governance challenge. Triple Helix 2014, 1, 7. [Google Scholar] [CrossRef]
- Li, C.X.; Fong, P.S.W.; Dai, S.; Li, Y. Towards sustainable smart cities: An empirical comparative assessment and development pattern optimization in China. J. Clean. Prod. 2019, 215, 730–743. [Google Scholar] [CrossRef]
- Judevicius, R.; Patasiene, I.; Patisius, M. Digital dimension of smart city: Critical analysis. Procedia-Soc. Behav. Sci. 2014, 156, 146–150. [Google Scholar] [CrossRef]
- Care, S.; Trotta, A.; Care, R.; Rizzello, A. Crowdfunding for the development of smart cities. Bus. Horiz. 2018, 61, 501–509. [Google Scholar] [CrossRef]
- Park, E.; Pobil, A.P.; Kwon, S.J. The Role of Internet of Things (IoT) in Smart Cities: Technology Roadmap-oriented Approaches. Sustainability 2018, 10, 1388. [Google Scholar] [CrossRef]
- Batty, M. Big data, smart cities and city planning. Dialogues Hum. Geogr. 2013, 3, 247–279. [Google Scholar] [CrossRef]
- Schuurman, D.; Baccarne, B.; De Maraz, L.; Mechnat, P. Smart Ideas for Smart Cities: Investigating Crowdsourcing for Generating and Selecting Ideas for ICT Innovation in a City Context. J. Theor. Appl. Electron. Commer. Res. 2012, 7, 49–62. [Google Scholar] [CrossRef]
- Katsinis, G.; Tsiropoulou, E.; Papavassiliou, S. Multicell interference management in device to device underlay cellular networks. Future Internet 2017, 9, 44. [Google Scholar] [CrossRef]
- Chai, B.; Chen, J.; Yang, Z.; Zhang, Y. Demand response management with multiple utility companies: A two-level game approach. IEEE Trans. Smart Grid 2014, 5, 722–731. [Google Scholar] [CrossRef]
- Lima, C.; Kimb, K.J.; Maglioc, P.P. Smart cities with big data: Reference models, challenges and considerations. Cities 2018, 82, 86–99. [Google Scholar] [CrossRef]
- Milošević, M.; Dimić, V. Multi-criteria analysis in ICT implementation for Smart Cities. In Proceedings of the 7th International Scientific Conference Employment, Education and Entrepreneurship, EEE 2018, Belgrade, Serbia, 18–20 October 2018; pp. 83–105. [Google Scholar]
- Barns, S. Smart cities and urban data platforms: Designing interfaces for smart governance. City Cult. Soc. 2018, 12, 5–12. [Google Scholar] [CrossRef]
- Aina, Y.A. Achieving smart sustainable cities with GeoICT support: The Saudi evolving smart cities. Cities 2017, 71, 49–58. [Google Scholar] [CrossRef]
- Desdemoustiera, J.; Crutzena, N.; Giffinger, R. Municipalities’ understanding of the Smart City concept: An exploratory analysis in Belgium. Technol. Forecast. Soc. Chang. 2019, 142, 129–141. [Google Scholar] [CrossRef]
- Yadav, G.; Mangla, S.K.; Luthra, S.; Rai, D.P. Developing a sustainable smart city framework for developing economies: An Indian context. Sustain. Cities Soc. 2019, 47, 101462. [Google Scholar] [CrossRef]
- Giffinger, R.; Fertner, C.; Kramar, H.; Kalasek, R.; Pichler-Milanovic, N.; Meijers, E. Smart Cities—Ranking of European Medium Sized; Centre of Regional Science: Vienna, Austria, 2007. [Google Scholar]
- Giovannella, C.; Dascalu, M.; Scaccia, F. Smart City Analytics: State of the art and future perspectives. Int. Des. Archit. J. 2014, 20, 72–87. [Google Scholar]
- Tahir, Z.; Malek, J.A. Main criteria in the development of smart cities determined using analytical method. J. Malays. Inst. Plan. 2016, 14, 1–14. [Google Scholar] [CrossRef]
- Lombardi, P. New challenges in the evaluation of Smart Cities. Netw. Ind. Q. 2011, 13, 8–10. [Google Scholar]
- Ruhlandt, R.W.S. The governance of smart cities: A systematic literature review. Cities 2018, 81, 1–23. [Google Scholar] [CrossRef]
- Glasmeier, A.; Christopherson, S. Thinking about smart cities. Camb. J. Reg. Econ. Soc. 2015, 8, 3–12. [Google Scholar] [CrossRef]
- Mellouli, S.; Luna-Reyes, L.F.; Zhang, J. Smart government, citizen participation and open data. Inf. Polity 2014, 19, 1–4. [Google Scholar] [CrossRef]
- Adreani, S.; Kalchschmidt, M.; Pinto, R.; Sayegh, A. Reframing technologically enhanced urban scenarios: A design research model towards human centered smart cities. Technol. Forecast. Soc. Chang. 2019, 142, 15–25. [Google Scholar] [CrossRef]
- Ju, J.; Liu, L.; Feng, Y. Citizen-centered big data analysis-driven governance intelligence framework for smart cities. Telecommun. Policy 2018, 42, 881–896. [Google Scholar] [CrossRef]
- Aguilera, U.; Pena, O.; Belmonte, O.; Ilpina, D.L. Citizen-centric data services for smarter cities. Future Gener. Comput. Syst. 2017, 76, 234–247. [Google Scholar] [CrossRef]
- Lee, J.; Lee, H. Developing and validating a citizen-centric typology for smart city services. Gov. Inf. Q. 2014, 31, 93–105. [Google Scholar] [CrossRef]
- Silva, N.B.; Khan, M.; Han, K. Towards sustainable smart cities: A review of trends, architectures, components, and open challenges in smart cities. Sustain. Cities Soc. 2018, 38, 697–713. [Google Scholar] [CrossRef]
- Batty, M.; Axhausen, K.W.; Giannotti, F.; Pozdnoukhov, A.; Bazzani, A.; Wachowicz, M.; Ouzounis, G.; Portugali, Y. Smart cities of the future. Eur. Phys. J. Spec. Top. 2012, 214, 481–518. [Google Scholar] [CrossRef]
- Monfaredzadeh, T.; Krueger, K. Investigating social factor of sustainability in a smart city. Procedia Eng. 2015, 118, 1112–1118. [Google Scholar] [CrossRef]
- Ardito, A.; Ferraris, A.; Petruzzelli, A.M.; Bresciani, S.; Giudicee, M.D. The role of universities in the knowledge management of smart city projects. Technol. Forecast. Soc. Chang. 2019, 142, 312–321. [Google Scholar] [CrossRef]
- Dameri, R.P. Searching for Smart City definition: A comprehensive proposal. Int. J. Comput. Technol. 2013, 11, 2544–2551. [Google Scholar] [CrossRef]
- Anand, P.B.; Navio-Marco, J. Governance and economics of smart cities: Opportunities and challenge. Telecommun. Policy 2018, 42, 795–799. [Google Scholar] [CrossRef]
- Batagan, L. Indicators for economic and social development of future smart cities. J. Appl. Quant. Methods 2011, 6, 27–34. [Google Scholar]
- Okuda, T.; Hirasawa, S.; Matsukuma, N.; Fukumoto, T.; Shimura, A. Smart Mobility for Smart Cities. Hitachi Rev. 2012, 61, 141–146. [Google Scholar]
- Docherty, I.; Marsden, G.; Anable, J. The governance of smart mobility. Transp. Res. Part A 2018, 115, 114–125. [Google Scholar] [CrossRef]
- Aleta, N.B.; Alonso, C.M.; Ruiz, R.M.A. Smart Mobility and Smart Environment in the Spanish cities. Transp. Res. Procedia 2017, 24, 163–170. [Google Scholar] [CrossRef]
- Pinna, F.; Masala, F.; Garau, C. Urban Policies and Mobility Trends in Italian Smart Cities. Sustainability 2017, 9, 494. [Google Scholar] [CrossRef]
- Milošević, D.; Stanojević, A.; Milošević, M. AHP method in the function of logistic in development of smart cities model. In Proceedings of the 6th International Conference: Transport and Logistic Til, Niš, Serbia, 25–26 May 2017; pp. 287–294. [Google Scholar]
- Behrendt, F. Cycling the Smart and Sustainable City: Analyzing EC Policy Documents on Internet of Things, Mobility and Transport, and Smart Cities. Sustainability 2019, 11, 763. [Google Scholar] [CrossRef]
- Cassandras, C.G. Automating mobility in smart cities. Annu. Rev. Control 2017, 44, 1–8. [Google Scholar] [CrossRef]
- Stephanedes, J.Y.; Golias, M.P.E.; Dedes, G.; Douligeris, C.; Mishra, S. Challenges, Risks and Opportunities for Connected Vehicle Services in Smart Cities and Communities. IFAC Pap. 2019, 51, 139–144. [Google Scholar]
- Lin, C.; Zhao, G.; Yu, C.; Wu, Y.J. Smart City Development and Residents’ Well-Being. Sustainability 2019, 11, 676. [Google Scholar] [CrossRef]
- Sofeska, E. Understanding the Livability in a City Through Smart Solutions and Urban Planning Toward Developing Sustainable Livable Future of the City of Skopje. Procedia Environ. Sci. 2017, 37, 442–453. [Google Scholar] [CrossRef]
- Aguaded-Ramirez, E. Smart City and Intercultural Education. Procedia Soc. Behav. Sci. 2017, 237, 326–333. [Google Scholar] [CrossRef]
- Khan, S.; Woo, M.; Nam, K.; Chathoth, P.K. Smart City and Smart Tourism. Sustainability 2017, 9, 2279. [Google Scholar] [CrossRef]
- Bajaj, R.; Sharma, V. Smart Education with artificial intelligence based determination of learning styles. Procedia Comput. Sci. 2018, 132, 834–842. [Google Scholar] [CrossRef]
- Selimi, A.; Milošević, M.; Saračević, M. AHP–TOPSIS Model as a Mathematical Support in the Selection of Project from Aspect of Mobility–Case Study. J. Appl. Math. Comput. 2018, 2, 257–265. [Google Scholar]
- Chen, Y.; Han, D. Water quality monitoring in smart city: A pilot project. Autom. Constr. 2018, 89, 307–316. [Google Scholar] [CrossRef]
- Dostal, Z.; Ladanyi, L. Demands on energy storage for renewable power sources. J. Energy Storage 2018, 18, 250–255. [Google Scholar] [CrossRef]
- Milošević, A.; Milošević, M.; Milošević, D.; Selimi, A. Ahp multi-criteria method for sustainable development in construction. In Proceedings of the 4th International Conference, Contemporary Achievements in Civil Engineering, Subotica, Serbia, 22 April 2016; pp. 929–938. [Google Scholar]
- Milošević, M.; Milošević, D.; Dimić, V.; Stević, D.; Stanojević, A. The analysis of energy efficiency indicators and renewable energy sources for existing buildings. MKOIEE 2017, 5, 205–212. [Google Scholar]
- Milošević, M.; Stanojević, A.; Milošević, A.; Milošević, D. Multi-criteria analysis of energy efficiency by AHP method in planning and architectural design. In Proceedings of the STEPGRAD2016, Banja Luka, Bosnia and Herzegovina, 18 February 2016; pp. 295–302. [Google Scholar]
- Milošević, M.; Milošević, A.; Milošević, D.; Stanojević, A.; Dimić, V. Multicriteria analysis of contemporary materials for energy-efficient buildings. In Proceedings of the SFERA2016, Mostar, Bosnia and Herzegovina, 2 October 2016; pp. 46–51. [Google Scholar]
- Milošević, D.; Milošević, M.; Stanojević, A.; Dimić, V.; Milošević, A. Application of FAHP Method in the Process of Building Construction from the Aspect of Energy Efficiency. In Proceedings of the 4th International Conference Mechanical Engineering in XXI Century, Niš, Serbia, 19–20 April 2018; pp. 271–276. [Google Scholar]
- Batova, E. The distinctive features of “smart” buildings. Procedia Eng. 2015, 111, 103–107. [Google Scholar] [CrossRef]
- O’Dweyer, E.; Pan, I.; Acha, S.; Shah, N. Smart energy systems for sustainable smart cities: Current developments, trends and future directions. Appl. Energy 2019, 237, 581–597. [Google Scholar] [CrossRef]
- Zhang, W.; Liu, F.; Fan, R. Improved thermal comfort modeling for smart buildings: A data analytics study. Electr. Power Energy Syst. 2018, 103, 634–643. [Google Scholar] [CrossRef]
- Pucar, M.; Nenković-Riznić, M.; Petrovic, S.; Brankov, B. The role of architects and urban planners in the formation of the concept and functioning of smart cities. In Proceedings of the 1st International Scientific Conference of Urban Planning (ICUP), Nis, Serbia, 18–19 November 2016; pp. 259–267. [Google Scholar]
- Vasilic, M. Operationalisation of “smart” city concept on the example of Serbia. Sociology 2018, 60, 518–537. (In Serbian) [Google Scholar]
- Lazaroiu, G.C.; Roscia, M.C. Definition methodology for the smart cities model. Energy 2012, 47, 326–332. [Google Scholar] [CrossRef]
- Statistical Office of the Republic of Serbia. Statistical Yearbook of the Republic of Serbia; Republic Institute of Statistics: Belgrade, Serbia, 2018. (In Serbian)
- Government of the Republic of Serbia. National Strategy for Sustainable Development; Government of the Republic of Serbia: Belgrade, Serbia, 2008. (In Serbian)
- Zdravković, A.; Nikolić, D.; Bradić-Martinović, A. Analysis of the Privatization Model in Serbia. In Proceedings of the End of Privatization, Implications for Economic Development and Unemployment in Serbia, Belgrade, Serbia, 4 February 2010; pp. 278–287. (In Serbian). [Google Scholar]
- Ministry of Construction, Transport and Infrastructure. Sustainable and Integrated Urban Development Strategy of Republic of Serbia Until 2030; Ministry of Construction, Transport and Infrastructure: Belgrade, Serbia, 2018; ISBN 978-86-900093-2-9.
- Katic, A.; Stankovic, J.; Malenkovic, N. Smart cities initiative-challenge for Serbia, Proceedings of the IVth International Scientific Conference Climate Change, Economic Development. Environ. People 2015, 2, 66–73. [Google Scholar]
- Hernández-Moreno, S.; De Hoyos-Martínez, J. Indicators of urban sustainability in Mexico. Theor. Empir. Res. Urban Manag. 2010, 7, 46–60. [Google Scholar]
- Science for Environment Policy. In-Depth Report 12: Indicators for Sustainable Cities; European Commission: Brussels, Belgium, 2018. [CrossRef]
- Vasiljević-Blagojević, M.; Marinković, S.; Perčić, K.; Lučić, V. The transition and the problem of brain drain from the perspective of students of a private university. Teach. Upbringing 2016, 65, 197–210. (In Serbian) [Google Scholar]
- Vranić, P.; Vasilevska, L. Hybrid spatialities: Multi-storey extensions of socialist blocks of flats under post-socialist transition in Serbia, the case of Nis. Urban Stud. 2015, 53, 1261–1277. [Google Scholar] [CrossRef]
- Spatial Development Strategy of the Republic of Serbia 2009–2013–2020. Ministry of Environment and Spatial Planning; Republic Agency for Spatial Planning: Belgrade, Serbia, 2009. (In Serbian)
- Dimić, V.; Milošević, M.; Milošević, D.; Stević, D. Adjustable Model of Renewable Energy Projects for Sustainable Development: A Case Study of the Nišava District in Serbia. Sustainability 2018, 10, 775. [Google Scholar] [CrossRef]
- Zadeh, L.A. Fuzzy sets. Inf. Control 1965, 8, 338–353. [Google Scholar] [CrossRef]
- Zadeh, L.A. The concept of a linguistic variable and its application to approximate reasoning. Inf. Sci. 1975, 8, 199–249. [Google Scholar] [CrossRef]
- Mendel, J.M.; John, R.B. Type-2 fuzzy sets made simple. IEEE Trans. Fuzzy Syst. 2002, 10, 117–127. [Google Scholar] [CrossRef]
- Mendel, J.M.; John, R.I.; Liu, F. Interval type-2 fuzzy logic systems made simple. IEEE Trans. Fuzzy Syst. 2006, 14, 808–821. [Google Scholar] [CrossRef]
- Sonera, O.; Celik, E.; Akyuz, E. Application of AHP and VIKOR methods under interval type 2 fuzzy environment in maritime transportation. Ocean Eng. 2017, 129, 107–116. [Google Scholar] [CrossRef]
- Dereli, T.; Baykasoglu, A.; Altun, K.; Durmusoglu, A.; Turksen, I.B. Industrial applications of type-2 fuzzy sets and systems: A concise review. Comput. Ind. 2011, 62, 125–137. [Google Scholar] [CrossRef]
- Dereli, T.; Altun, K. Technology evaluation through the use of interval type-2 fuzzy sets and systems. Comput. Ind. Eng. 2011, 65, 624–633. [Google Scholar] [CrossRef]
- Celik, E.; Gul, M.; Aydin, N.; Gumus, A.T.; Guneri, A.F. A comprehensive review of multi criteria decision making approaches based on interval type-2 fuzzy sets. Knowl.-Based Syst. 2015, 85, 329–341. [Google Scholar] [CrossRef]
- Castillo, O.; Melin, P. A review on the design and optimization of interval type-2 fuzzy controllers. Appl. Soft Comput. 2012, 12, 1267–1278. [Google Scholar] [CrossRef]
- Castillo, O.; Melin, P. Optimization of type-2 fuzzy systems based on bio-inspired methods: A concise review. Inf. Sci. 2012, 205, 1–19. [Google Scholar] [CrossRef]
- Chen, S.M.; Lee, L.W. Fuzzy multiple attributes group decision-making based on the interval type-2 TOPSIS method. Expert Syst. Appl. 2010, 37, 2790–2798. [Google Scholar] [CrossRef]
- Chen, T.Y.; Chang, C.H.; Lu, J.F.R. The extended QUALIFLEX method for multiple criteria decision analysis based on interval type-2 fuzzy sets and applications to medical decision making. Eur. J. Oper. Res. 2013, 226, 615–625. [Google Scholar] [CrossRef]
- Gul, M.; Celik, E.; Gumus, A.T.; Guneri, A.F. Emergency department performance evaluation by an integrated simulation and interval type-2 fuzzy MCDM-based scenario analysis. Eur. J. Oper. Res. 2016, 10, 196–223. [Google Scholar] [CrossRef]
- Saaty, T.L. The Analytic Hierarchy Process; McGraw-Hill: New York, NY, USA, 1980. [Google Scholar]
- Buckley, J.J. Fuzzy hierarchical analysis. Fuzzy Sets Syst. 1985, 17, 233–247. [Google Scholar] [CrossRef]
- Kahraman, C.; Oztaysi, B.; Sari, I.U.; Turanoglu, E. Fuzzy analytic hierarchy process with interval type-2 fuzzy sets. Knowl.-Based Syst. 2014, 59, 48–57. [Google Scholar] [CrossRef]
- Abdullah, L.; Najib, L. A new type-2 fuzzy set of linguistic variables for the fuzzy analytic hierarchy process. Expert Syst. Appl. 2014, 41, 3297–3305. [Google Scholar] [CrossRef]
- Kuo, M.S.; Liang, G.S. A soft computing method of performance evaluation with MCDM based on interval-valued fuzzy numbers. Appl. Soft Comput. 2012, 12, 476–485. [Google Scholar] [CrossRef]
- Ghorabaee, M.K. Developing an MCDM method for robot selection with interval type-2 fuzzy sets. Robot. Comput.-Integr. Manuf. 2016, 37, 221–232. [Google Scholar] [CrossRef]
- Dinçer, H.; Yüksel, S.; Korsakienė, R.; Raišienė, A.G.; Bilan, Y. IT2 Hybrid Decision-Making Approach to Performance Measurement of Internationalized Firms in the Baltic States. Sustainability 2019, 11, 296. [Google Scholar] [CrossRef]


| Governance (G) | Citizens (C) | Environment (O) |
| Strategies and perspectives of smart city development (G1) | Active participation in the local community (C1) | Sustainable land planning and management (O1) |
| Citizen participation in decision making (G2) | Raising civic awareness (C2) | Environmental pollution control and protection (O2) |
| Accessibility of services and e-government (G3) | The high degree of qualification and education (C3) | Efficient use of water (O3) |
| Management transparency and use of open-data (G4) | Affinity to lifelong learning and e-learning (C4) | Use of renewable energy sources (O4) |
| Creativity, flexibility, and open-mindedness (C5) | Energy efficient buildings construction (O5) | |
| Social and ethnic diversity (C6) | Management and protection of natural resources (O6) | |
| Natural attractiveness of landscapes (O7) | ||
| Mobility (M) | Economy (E) | Livability (L) |
| Integration of ICT infrastructure (M1) | Self-employment fostering and entrepreneurship (E1) | Individual safety (L1) |
| The innovative transport system, non-motorized vehicles (M2) | Innovations and strategic investment (E2) | Good and affordable housing conditions (L2) |
| Local and international accessibility (M3) | Economic opportunities (E3) | Utilities and infrastructure equipment (L3) |
| Productivity (E4) | Health services (L4) | |
| Transformation capacity and market flexibility (E5) | Education and training (L5) | |
| Economy promotion and market competitiveness (E6) | Social integration and recreation (L6) | |
| E-business, e-commerce (E7) | Culture and tourism (L7) | |
| Integration with national, international market (E8) |
| Governance | Citizens | Environment |
| The non-existence of strategies for smart city development | Limited participation in the local community | No sustainable management for brownfield issue |
| Absence of the possibility to launch civic initiatives/non-participation of citizens in local decision-making | Undeveloped awareness | Limited implementation of measures of environment protection/lack of wastewater treatment system/pollution caused by motor traffic and industry |
| Partial development of open data | Medium degree of qualification, education/highly educated people emigration | Inability to control water consumption in old objects |
| Partial transparency in urban management | No motivation for life-long learning | Poor implementation of RES |
| Creativity, flexibility, and open-mindedness of people | The non-existence of high-energy buildings/application of energy efficiency measures limited to only new facilities | |
| High social diversity/low ethnic diversity | The problem of wild landfills | |
| Natural attractiveness | ||
| Mobility | Economy | Livability |
| Insufficiently developed ICT infrastructure | Low degree of entrepreneurship | Insecurity and violence |
| Urban unpredictable cycling routes/favoring motor vehicles | Insufficient investment in new technologies | Inadequate living/housing conditions due to poverty |
| Good local and international accessibility | Economic inequality unemployment/uneven development of the economy by regions | Good development of utilities and infrastructure equipment |
| Undeveloped manufacturing sector | Good development of health services | |
| No market flexibility | No programs for the education of existentially endangered persons | |
| Lack of market competitiveness | Limited social integration | |
| Poor development of e-business | High potentials in tourism and culture/low promotion of them |
| Linguistic Variables | Trapezoidal Interval Fuzzy Scales | |
|---|---|---|
| Equally important (EI) | Upper T1FS (1,1,1,1,1,1) | Lower T1FS (1,1,1,1,0.9,0.9) |
| Intermediate value (IV1) | (1,3/2,5/2,3,1,1) | (5/4,3/2,5/2,11/4,0.9,0.9) |
| Moderately—More important (MMI) | (2,5/2,7/2,4,1,1) | (9/4,5/2,7/2,15/4,0.9,0.9) |
| Intermediate value (IV2) | (3,7/2,9/2,5,1,1) | (13/4,7/2,9/2,19/4,0.9,0.9) |
| Strongly—More important (SMI) | (4,9/2,11/2,6,1,1) | (17/4,9/2,11/2,23/4,0.9,0.9) |
| Intermediate value (IV3) | (5,11/2,13/2,7,1,1) | (21/4,11/2,13/2,27/4,0.9,0.9) |
| Very strongly—More important (VSMI) | (6,13/2,15/2,8,1,1) | (25/4,13/2,15/2,31/4,0.9,0.9) |
| Intermediate value (IV4) | (7,15/2,17/2,9,1,1) | (29/4,15/2,17/2,35/4,0.9,0.9) |
| Extremely—More important (EMI) | (9,9,9,9,1,1) | (9,9,9,9,0.9,0.9) |
| G | C | E | L | M | O | |
|---|---|---|---|---|---|---|
| G | ||||||
| C | ||||||
| E | ||||||
| L | ||||||
| M | ||||||
| O |
| G1 | G2 | G3 | G4 | |
|---|---|---|---|---|
| G1 | ||||
| G2 | ||||
| G3 | ||||
| G4 |
| C1 | C2 | C3 | C4 | C5 | C6 | |
|---|---|---|---|---|---|---|
| C1 | ||||||
| C2 | ||||||
| C3 | ||||||
| C4 | ||||||
| C5 | ||||||
| C6 |
| E1 | E2 | E3 | E4 | E5 | E6 | E7 | E8 | |
|---|---|---|---|---|---|---|---|---|
| E1 | ||||||||
| E2 | ||||||||
| E3 | ||||||||
| E4 | ||||||||
| E5 | ||||||||
| E6 | ||||||||
| E7 | 1/ | |||||||
| E8 | 1/ |
| L1 | L2 | L3 | L4 | L5 | L6 | L7 | |
|---|---|---|---|---|---|---|---|
| L1 | |||||||
| L2 | |||||||
| L3 | |||||||
| L4 | |||||||
| L5 | |||||||
| L6 | 1/ | ||||||
| L7 | 1/ |
| M1 | M2 | M3 | |
|---|---|---|---|
| M1 | |||
| M2 | |||
| M3 |
| O1 | O2 | O3 | O4 | O5 | O6 | O7 | |
|---|---|---|---|---|---|---|---|
| O1 | |||||||
| O2 | |||||||
| O3 | |||||||
| O4 | |||||||
| O5 | |||||||
| O6 | 1/ | ||||||
| O7 | 1/ | 1/ |
| Upper Trapeze | Lower Trapeze | Weight | |
|---|---|---|---|
| Smart City | WC | ||
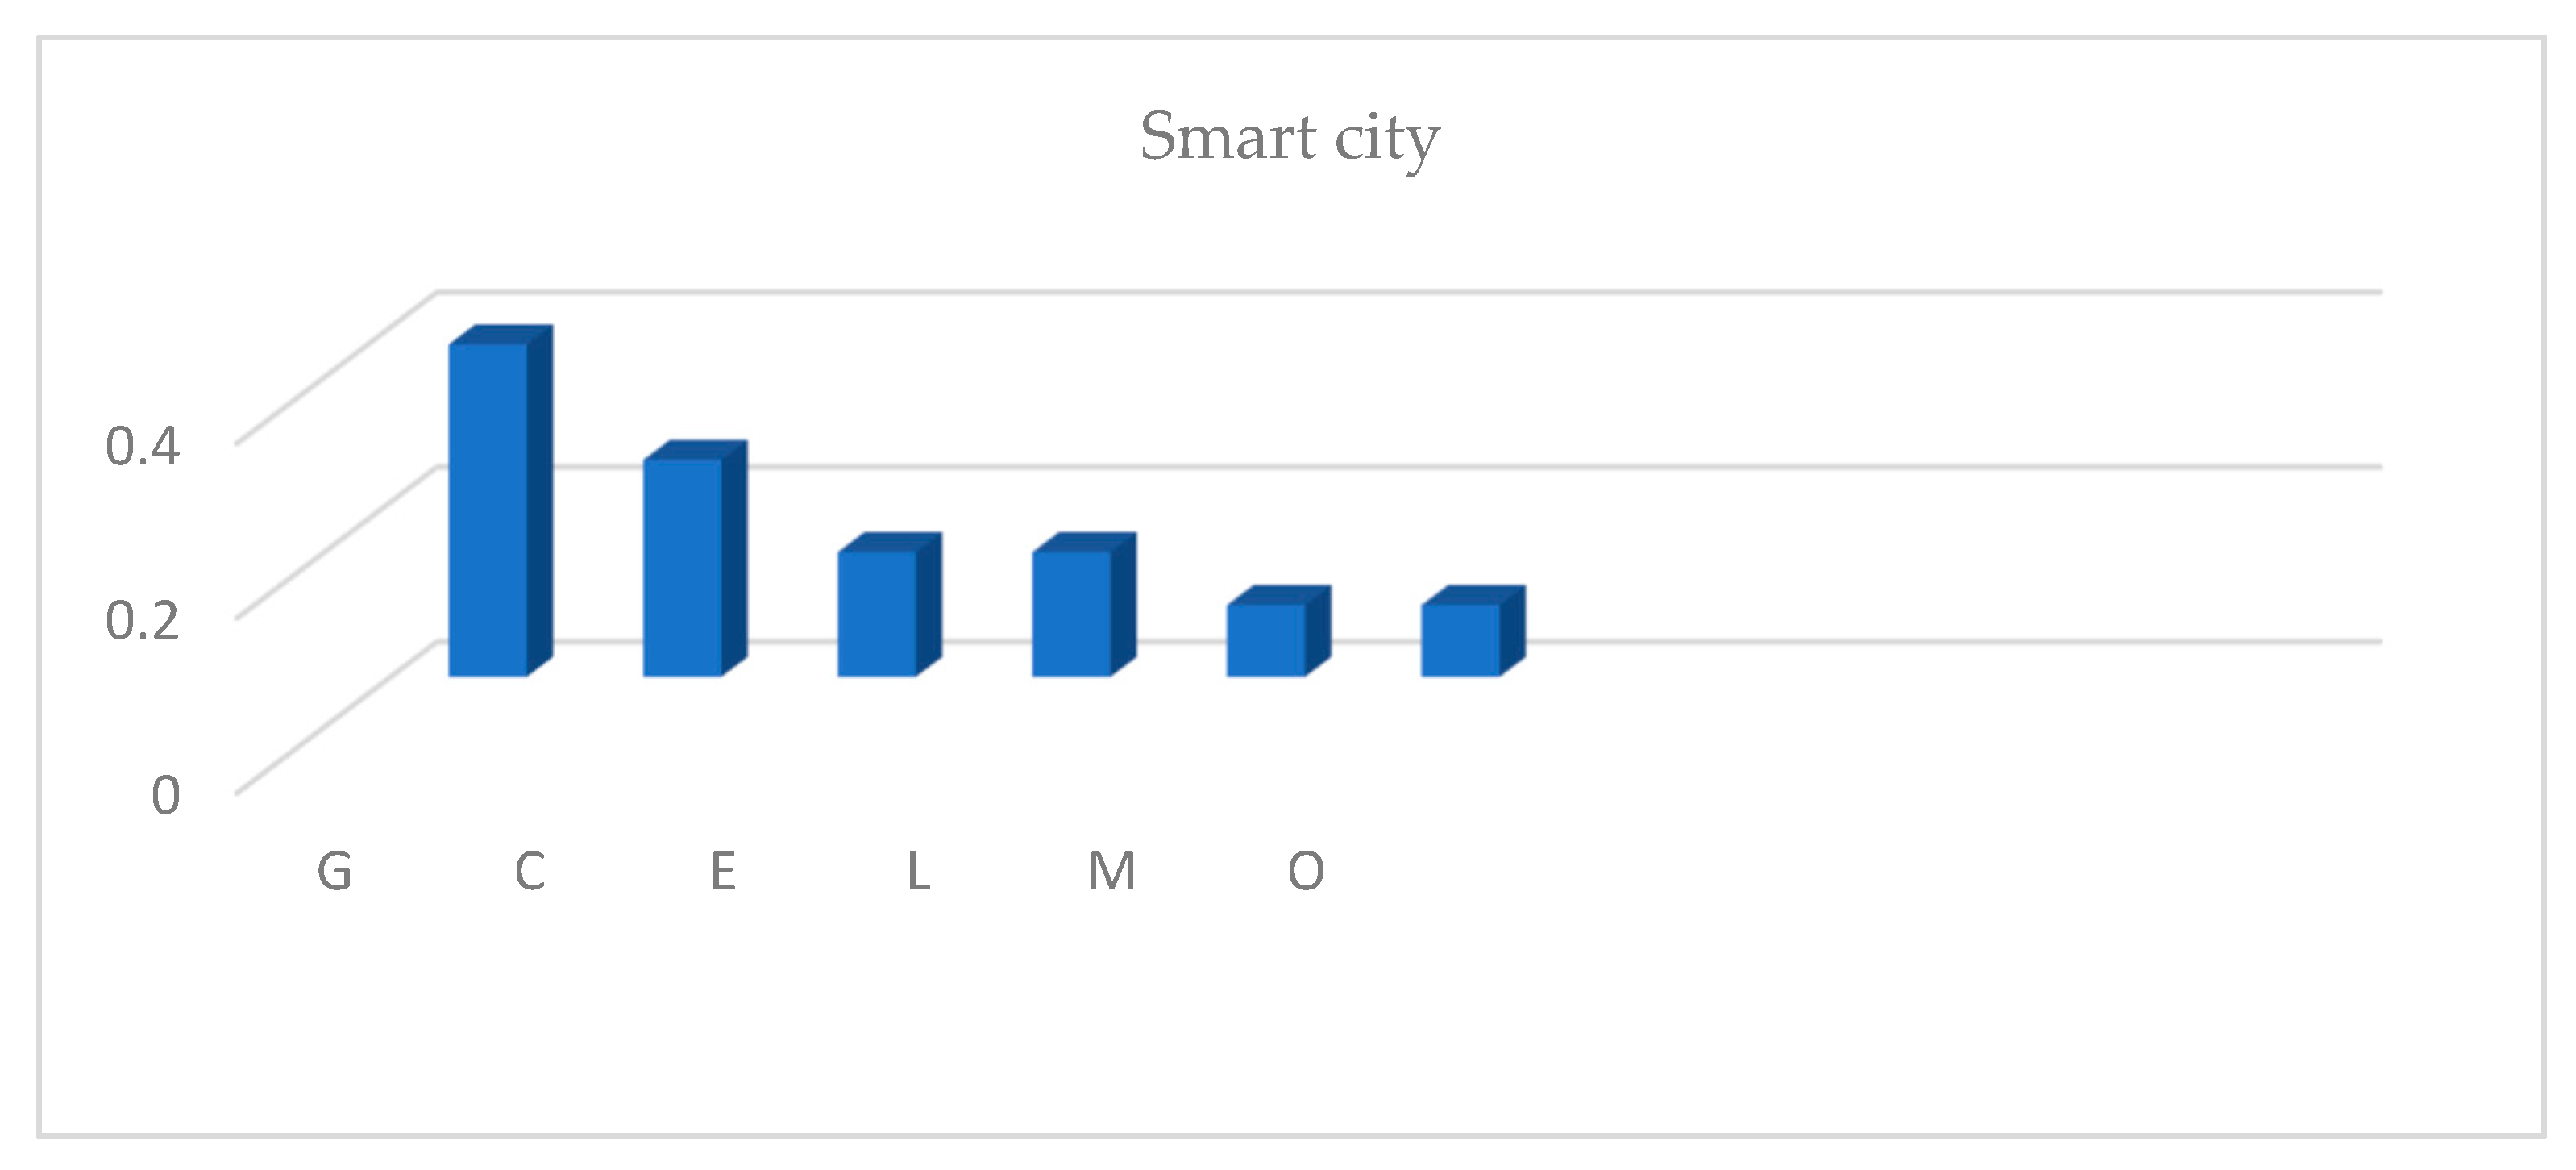
| G | (0.1892,0.2675,0.4815,0.6481,1,1) | (0.2268,0.2675,0.4815,0.5569,0.9,0,9) | 0.380552 |
| C | (0.1092,0.1618,0.3176,0.455,1,1) | (0.1343,0.1618,0.3176,0.3778,0.9,0,9) | 0.248436 |
| E | (0.06882,0.09676,0.1795,0.2554,1,1) | (0.08222,0.09676,0.1795,0.2124,0.9,0,9) | 0.142998 |
| L | (0.06882,0.09676,0.1795,0.2554,1,1) | (0.08222,0.09676,0.1795,0.2124,0.9,0,9) | 0.142998 |
| M | (0.04382,0.05647,0.1003,0.147,1,1) | (0.04974,0.05647,0.1003,0.1200,0.9,0,9) | 0.082384 |
| O | (0.04382,0.05647,0.1003,0.147,1,1) | (0.04974,0.05647,0.1003,0.1200,0.9,0,9) | 0.082384 |
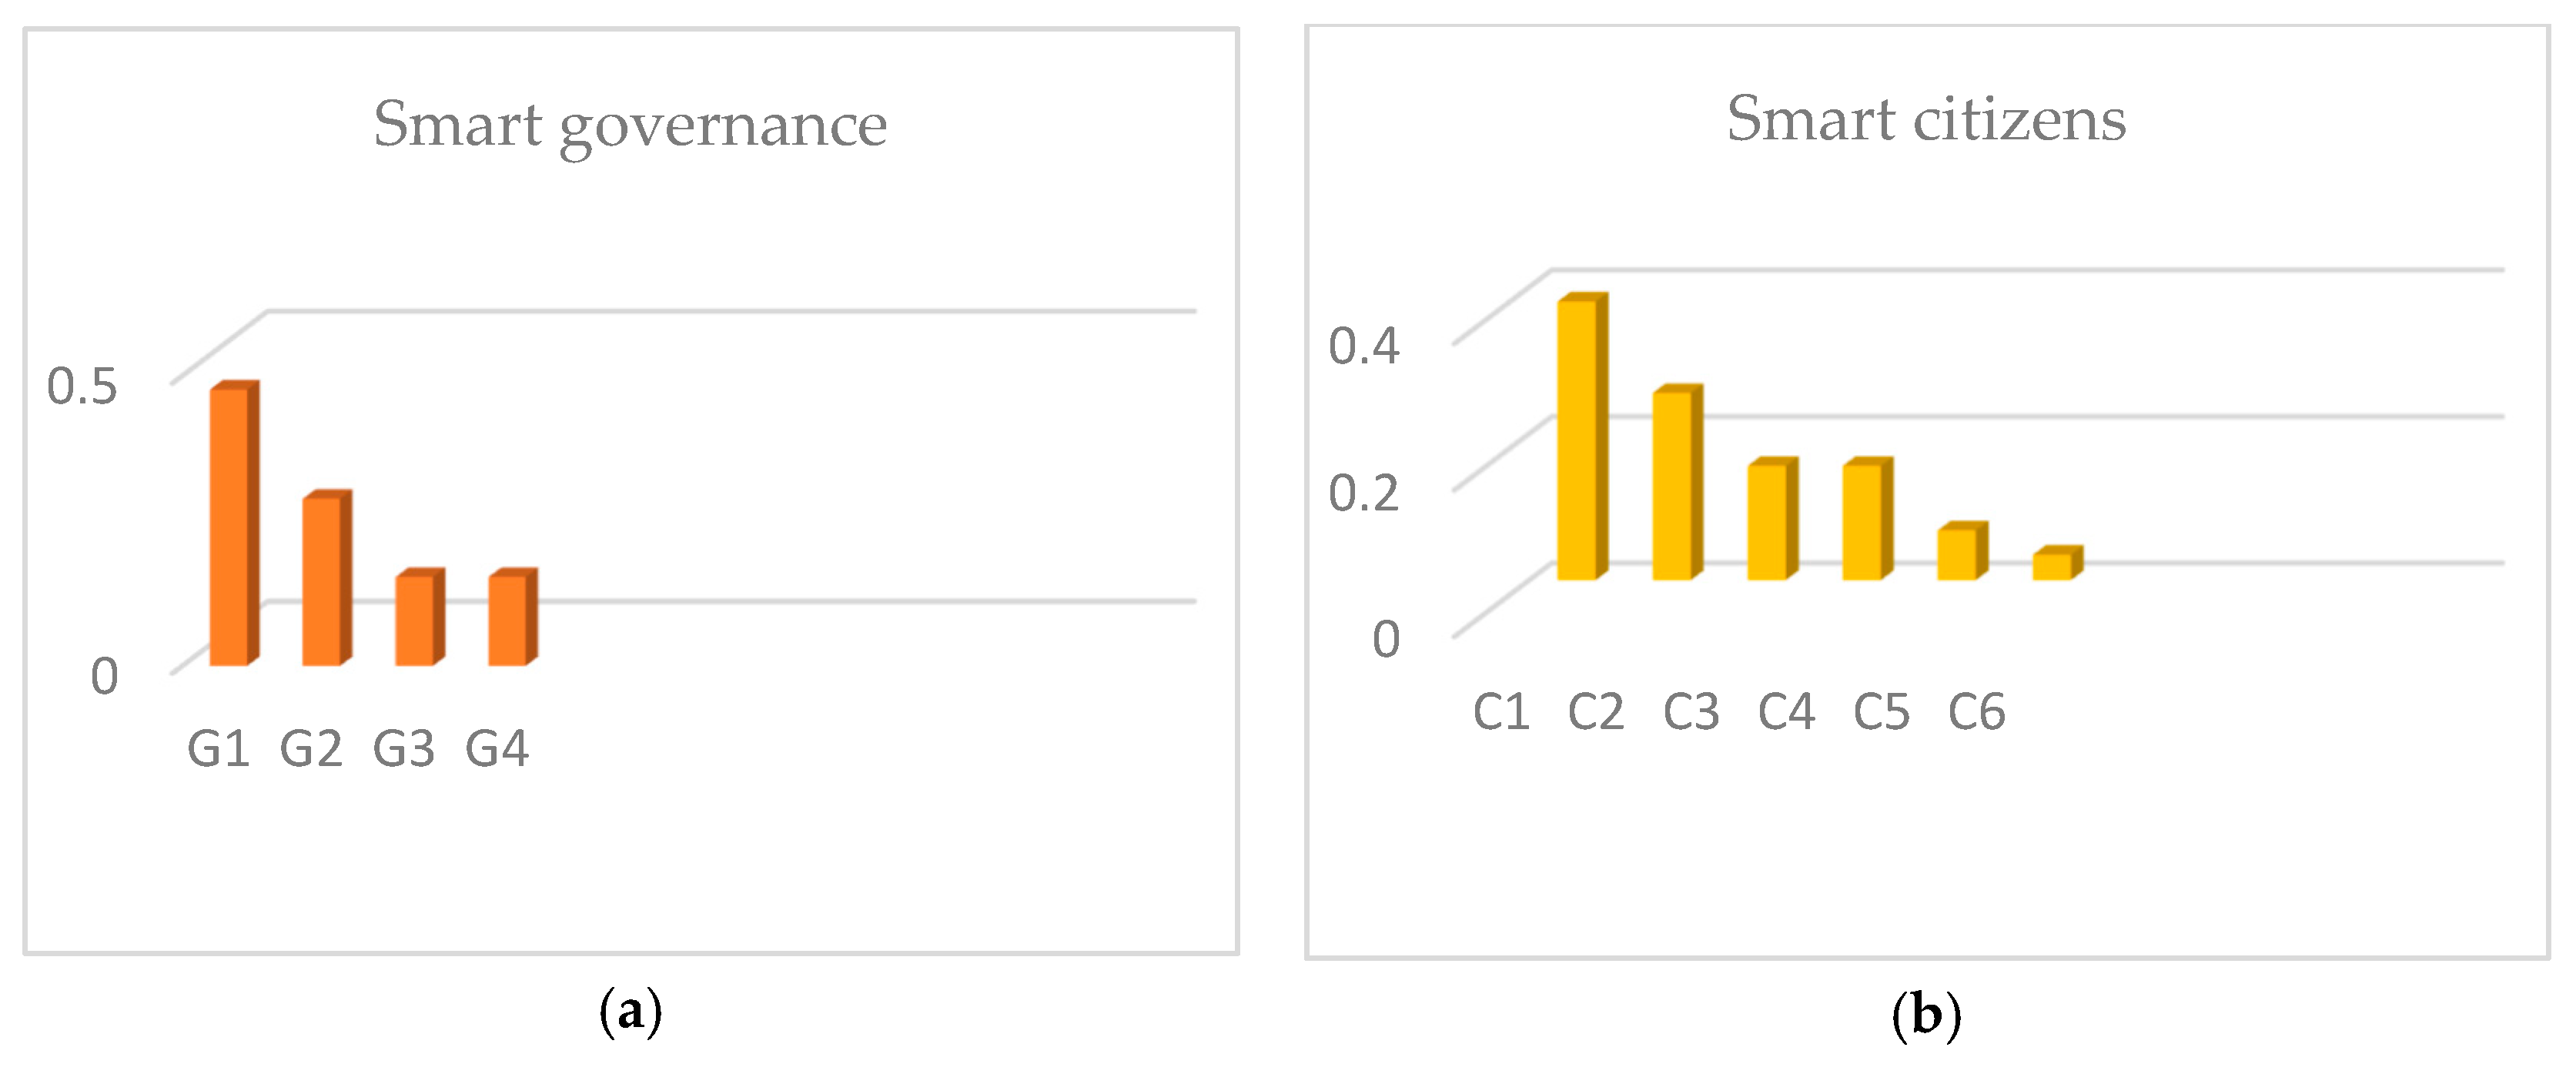
| Smart Governance | WSC | ||
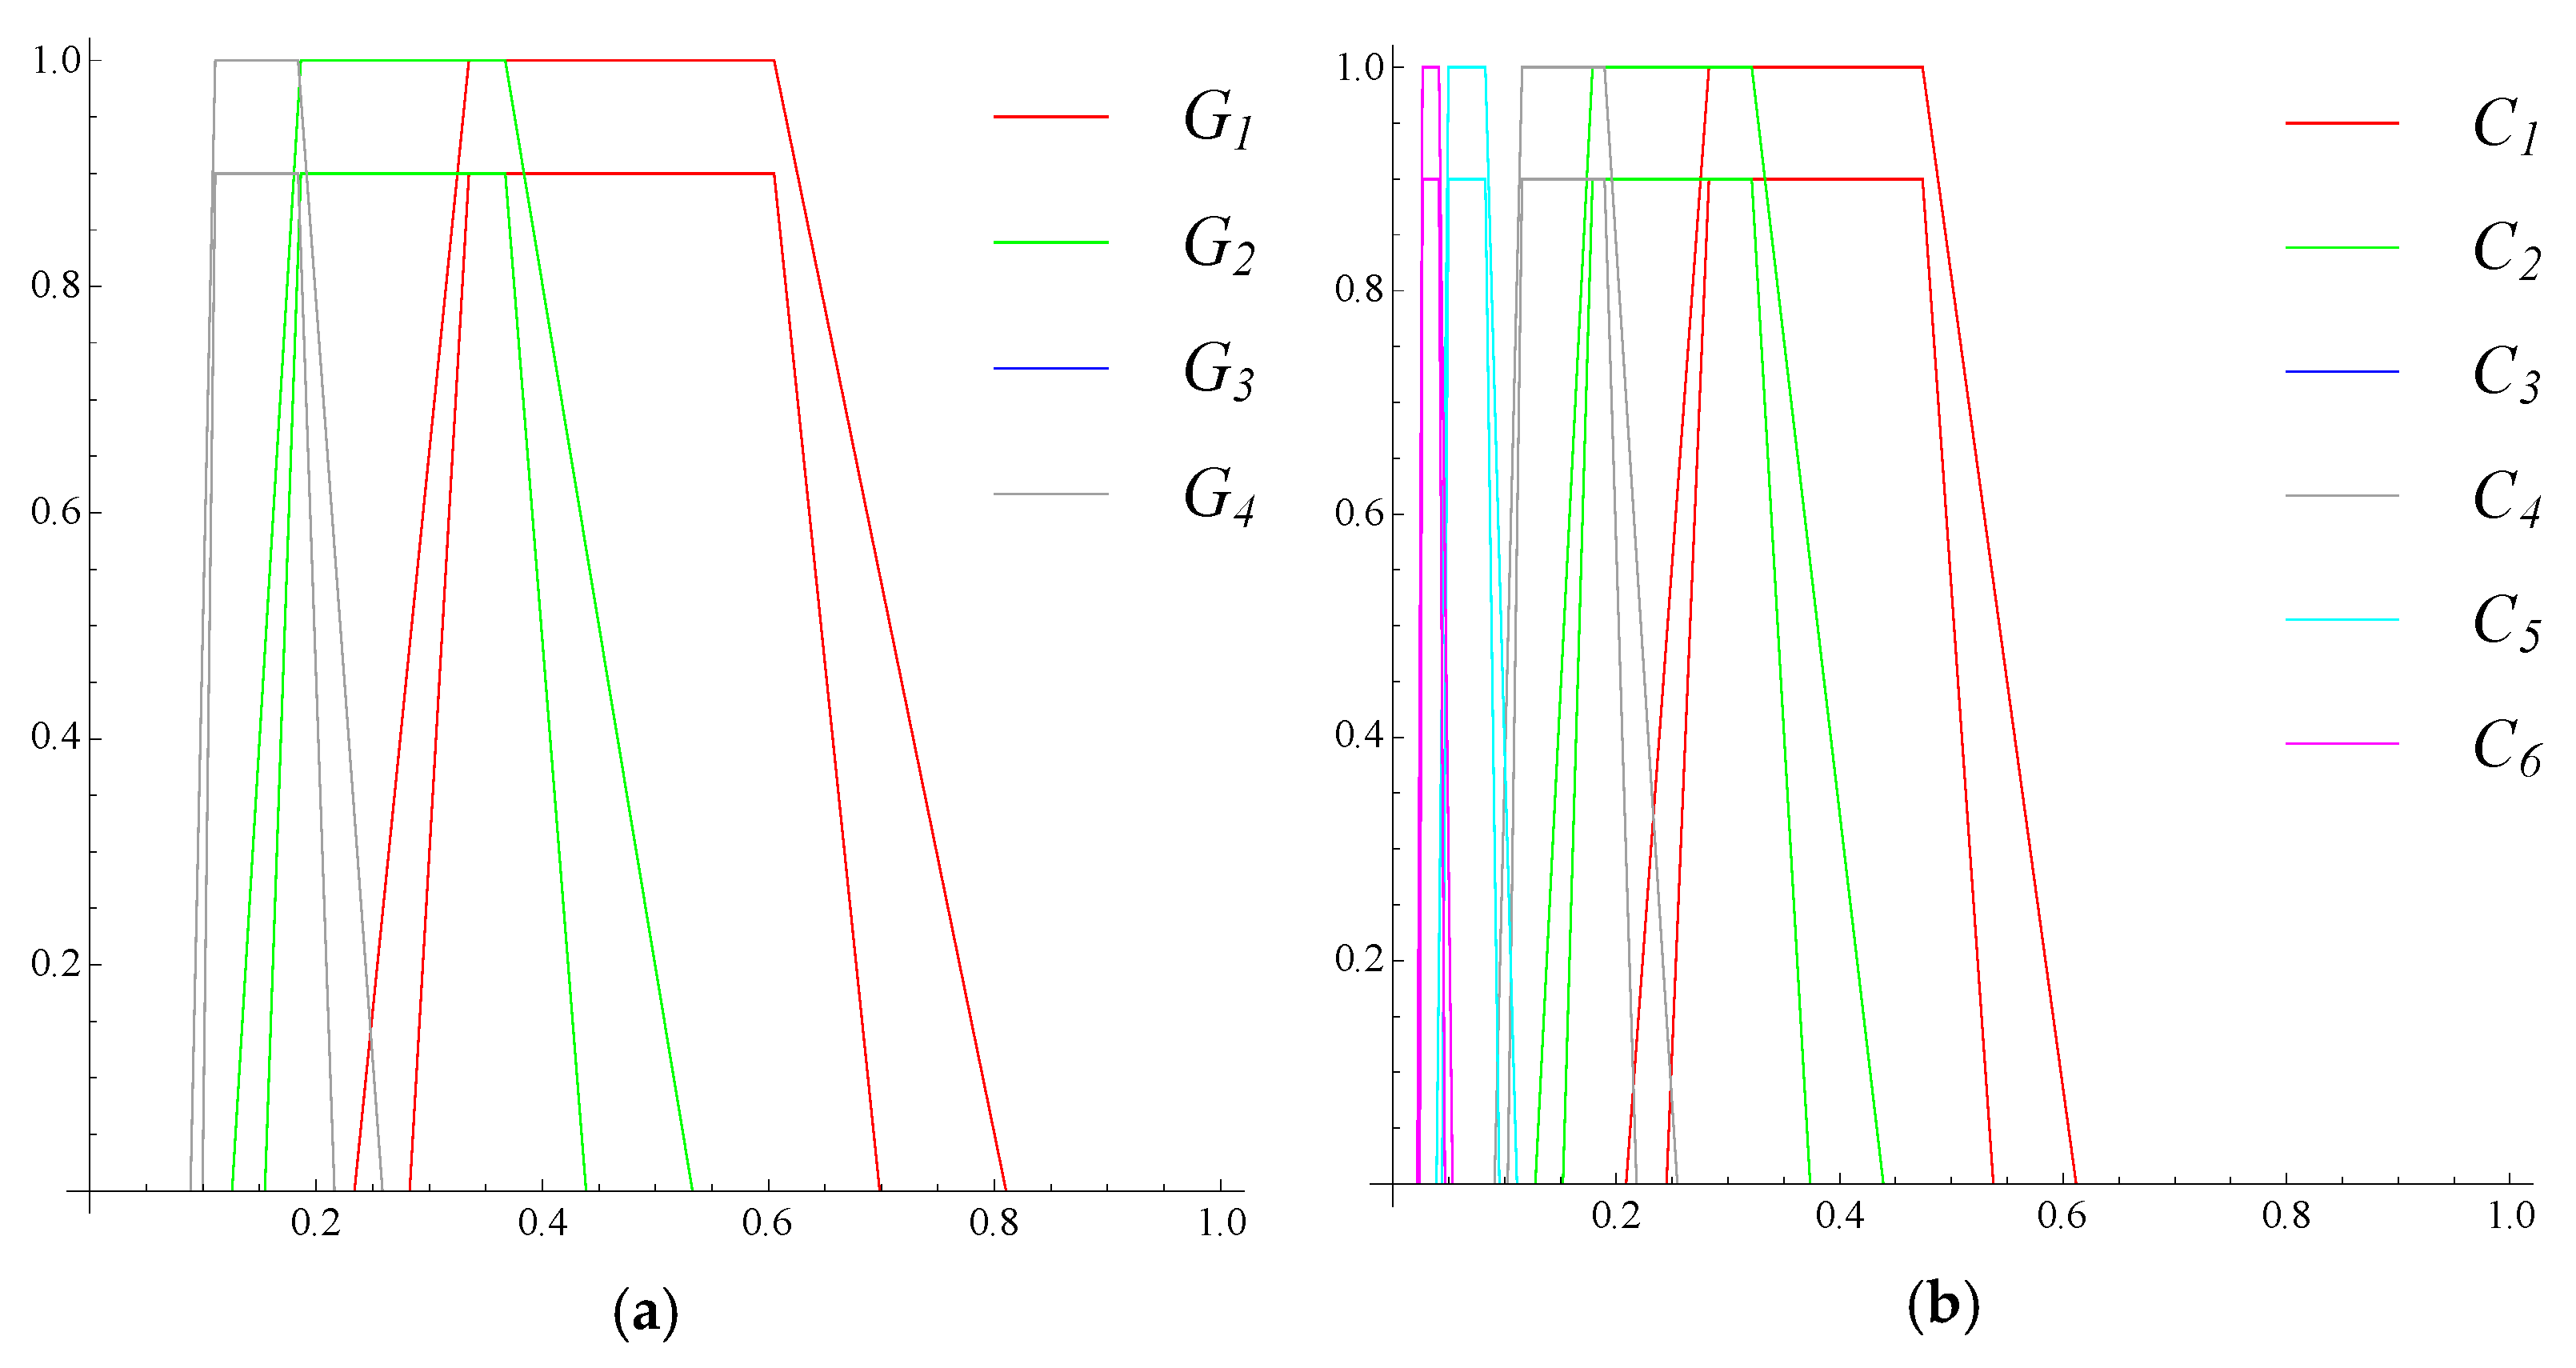
| G1 | (0.2339,0.3353,0.6052,0.8102,1,1) | (0.2828,0.3353,0.6052,0.6984,0.9,0,9) | 0.476575 |
| G2 | (0.1256,0.1866,0.3675,0.5331,1,1) | (0.1548,0.1866,0.3675,0.439,0.9,0,9) | 0.288254 |
| G3 | (0.08886,0.111,0.184,0.2588,1,1) | (0.09953,0.111,0.184,0.2162,0.9,0,9) | 0.153315 |
| G4 | (0.08886,0.111,0.184,0.2588,1,1) | (0.09953,0.111,0.184,0.2162,0.9,0,9) | 0.153315 |
| Smart Citizens | WSC | ||
| C1 | (0.2088,0.283,0.4742,0.6116,1,1) | (0.2449,0.283,0.4742,0.5376,0.9,0,9) | 0.38026 |
| C2 | (0.1275,0.1787,0.3211,0.4390,1,1) | (0.1522,0.1787,0.3211,0.3735,0.9,0,9) | 0.255274 |
| C3 | (0.09120,0.1158,0.1894,0.2546,1,1) | (0.1029,0.1158,0.1894,0.2180,0.9,0,9) | 0.155862 |
| C4 | (0.09120,0.1158,0.1894,0.2546,1,1) | (0.1029,0.1158,0.1894,0.2180,0.9,0,9) | 0.155862 |
| C5 | (0.03914,0.04993,0.08271,0.1112,1,1) | (0.04426,0.04993,0.08271,0.0953,0.9,0,9) | 0.0677521 |
| C6 | (0.02179,0.02672,0.04131,0.05358,1,1) | (0.02414,0.02672,0.04131,0.04679,0.9,0,9) | 0.0344498 |
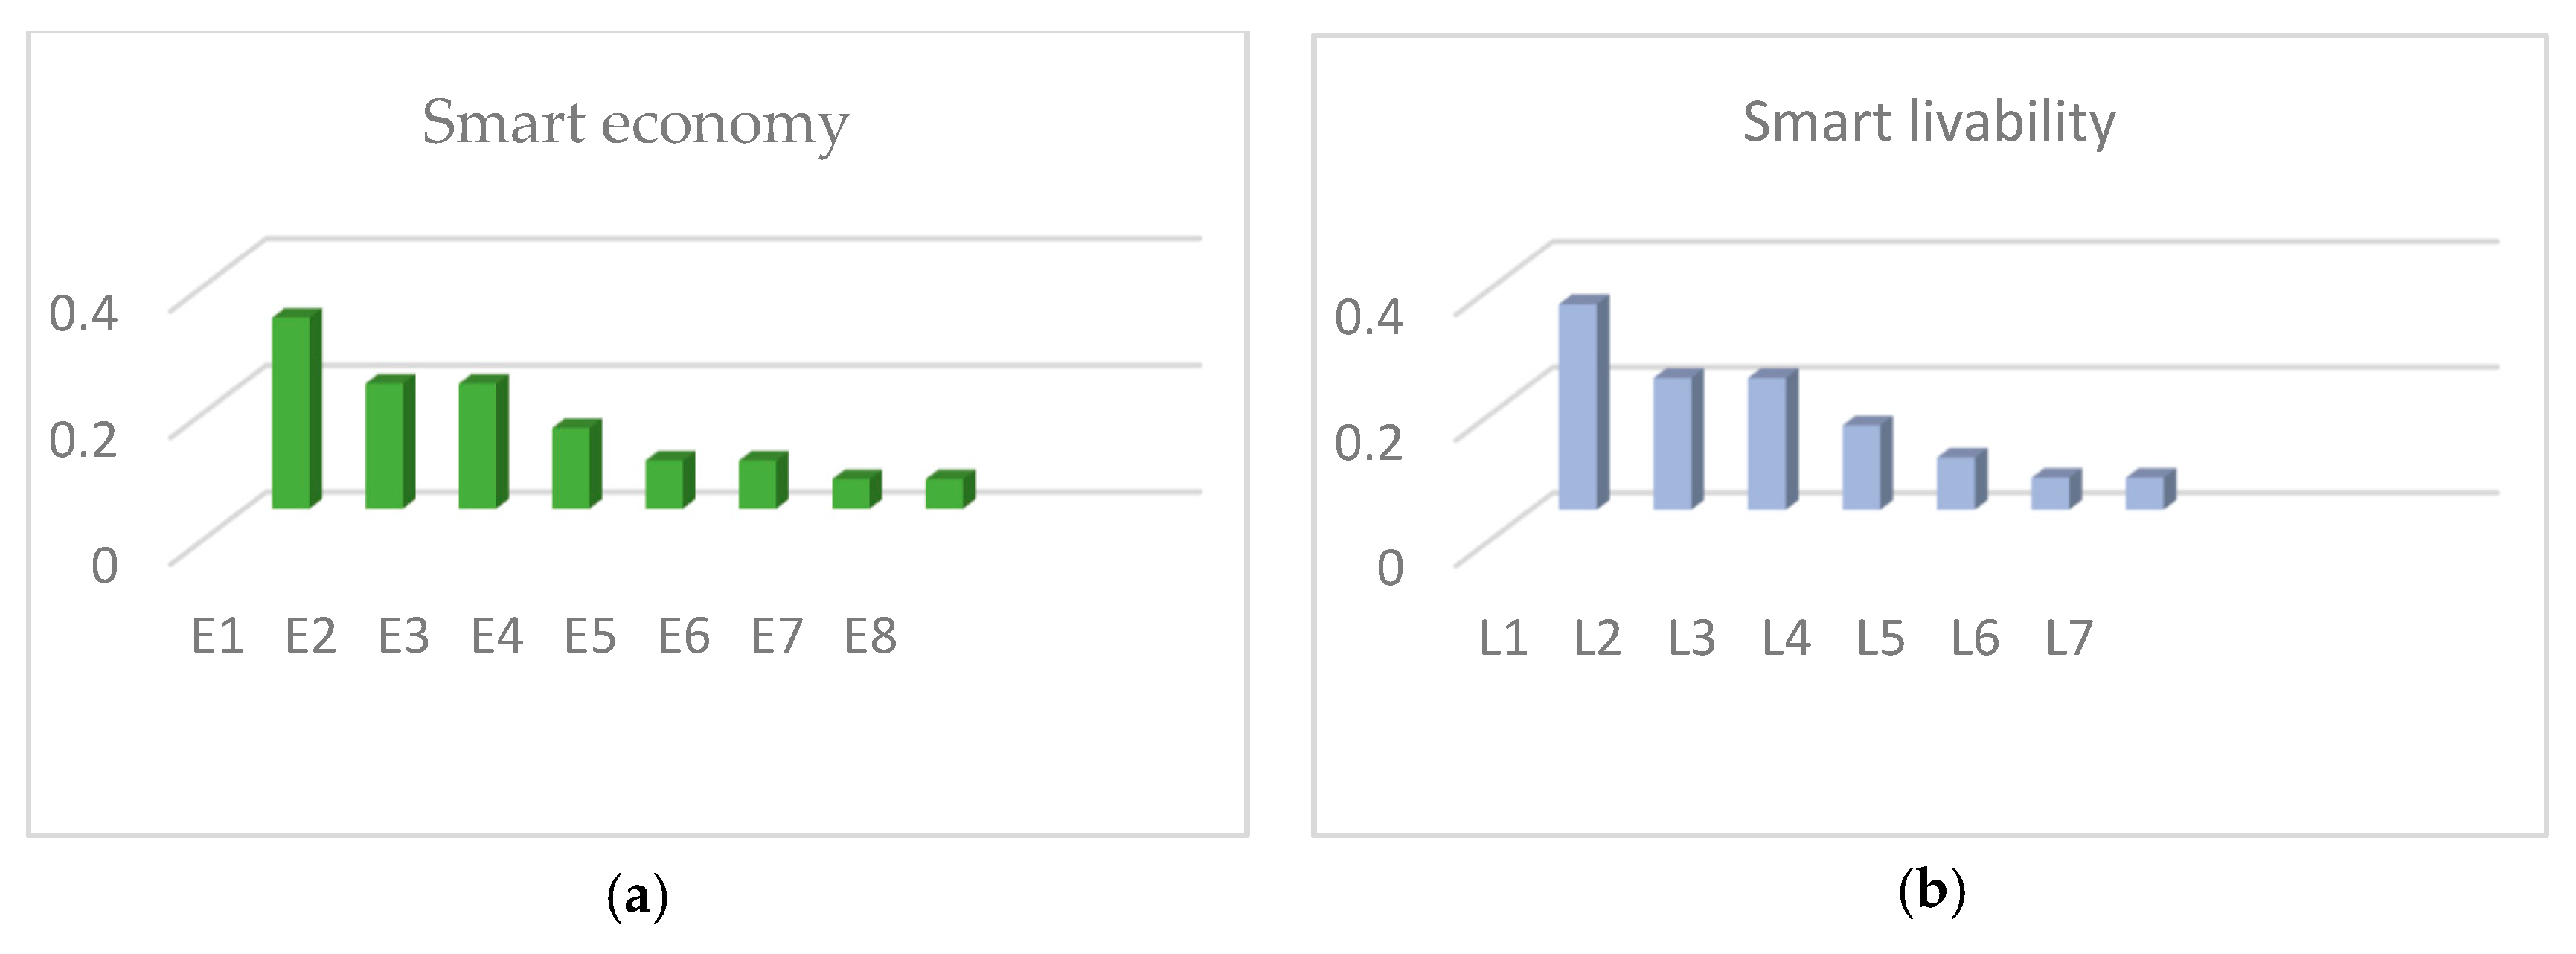
| Smart Economy | WSC | ||
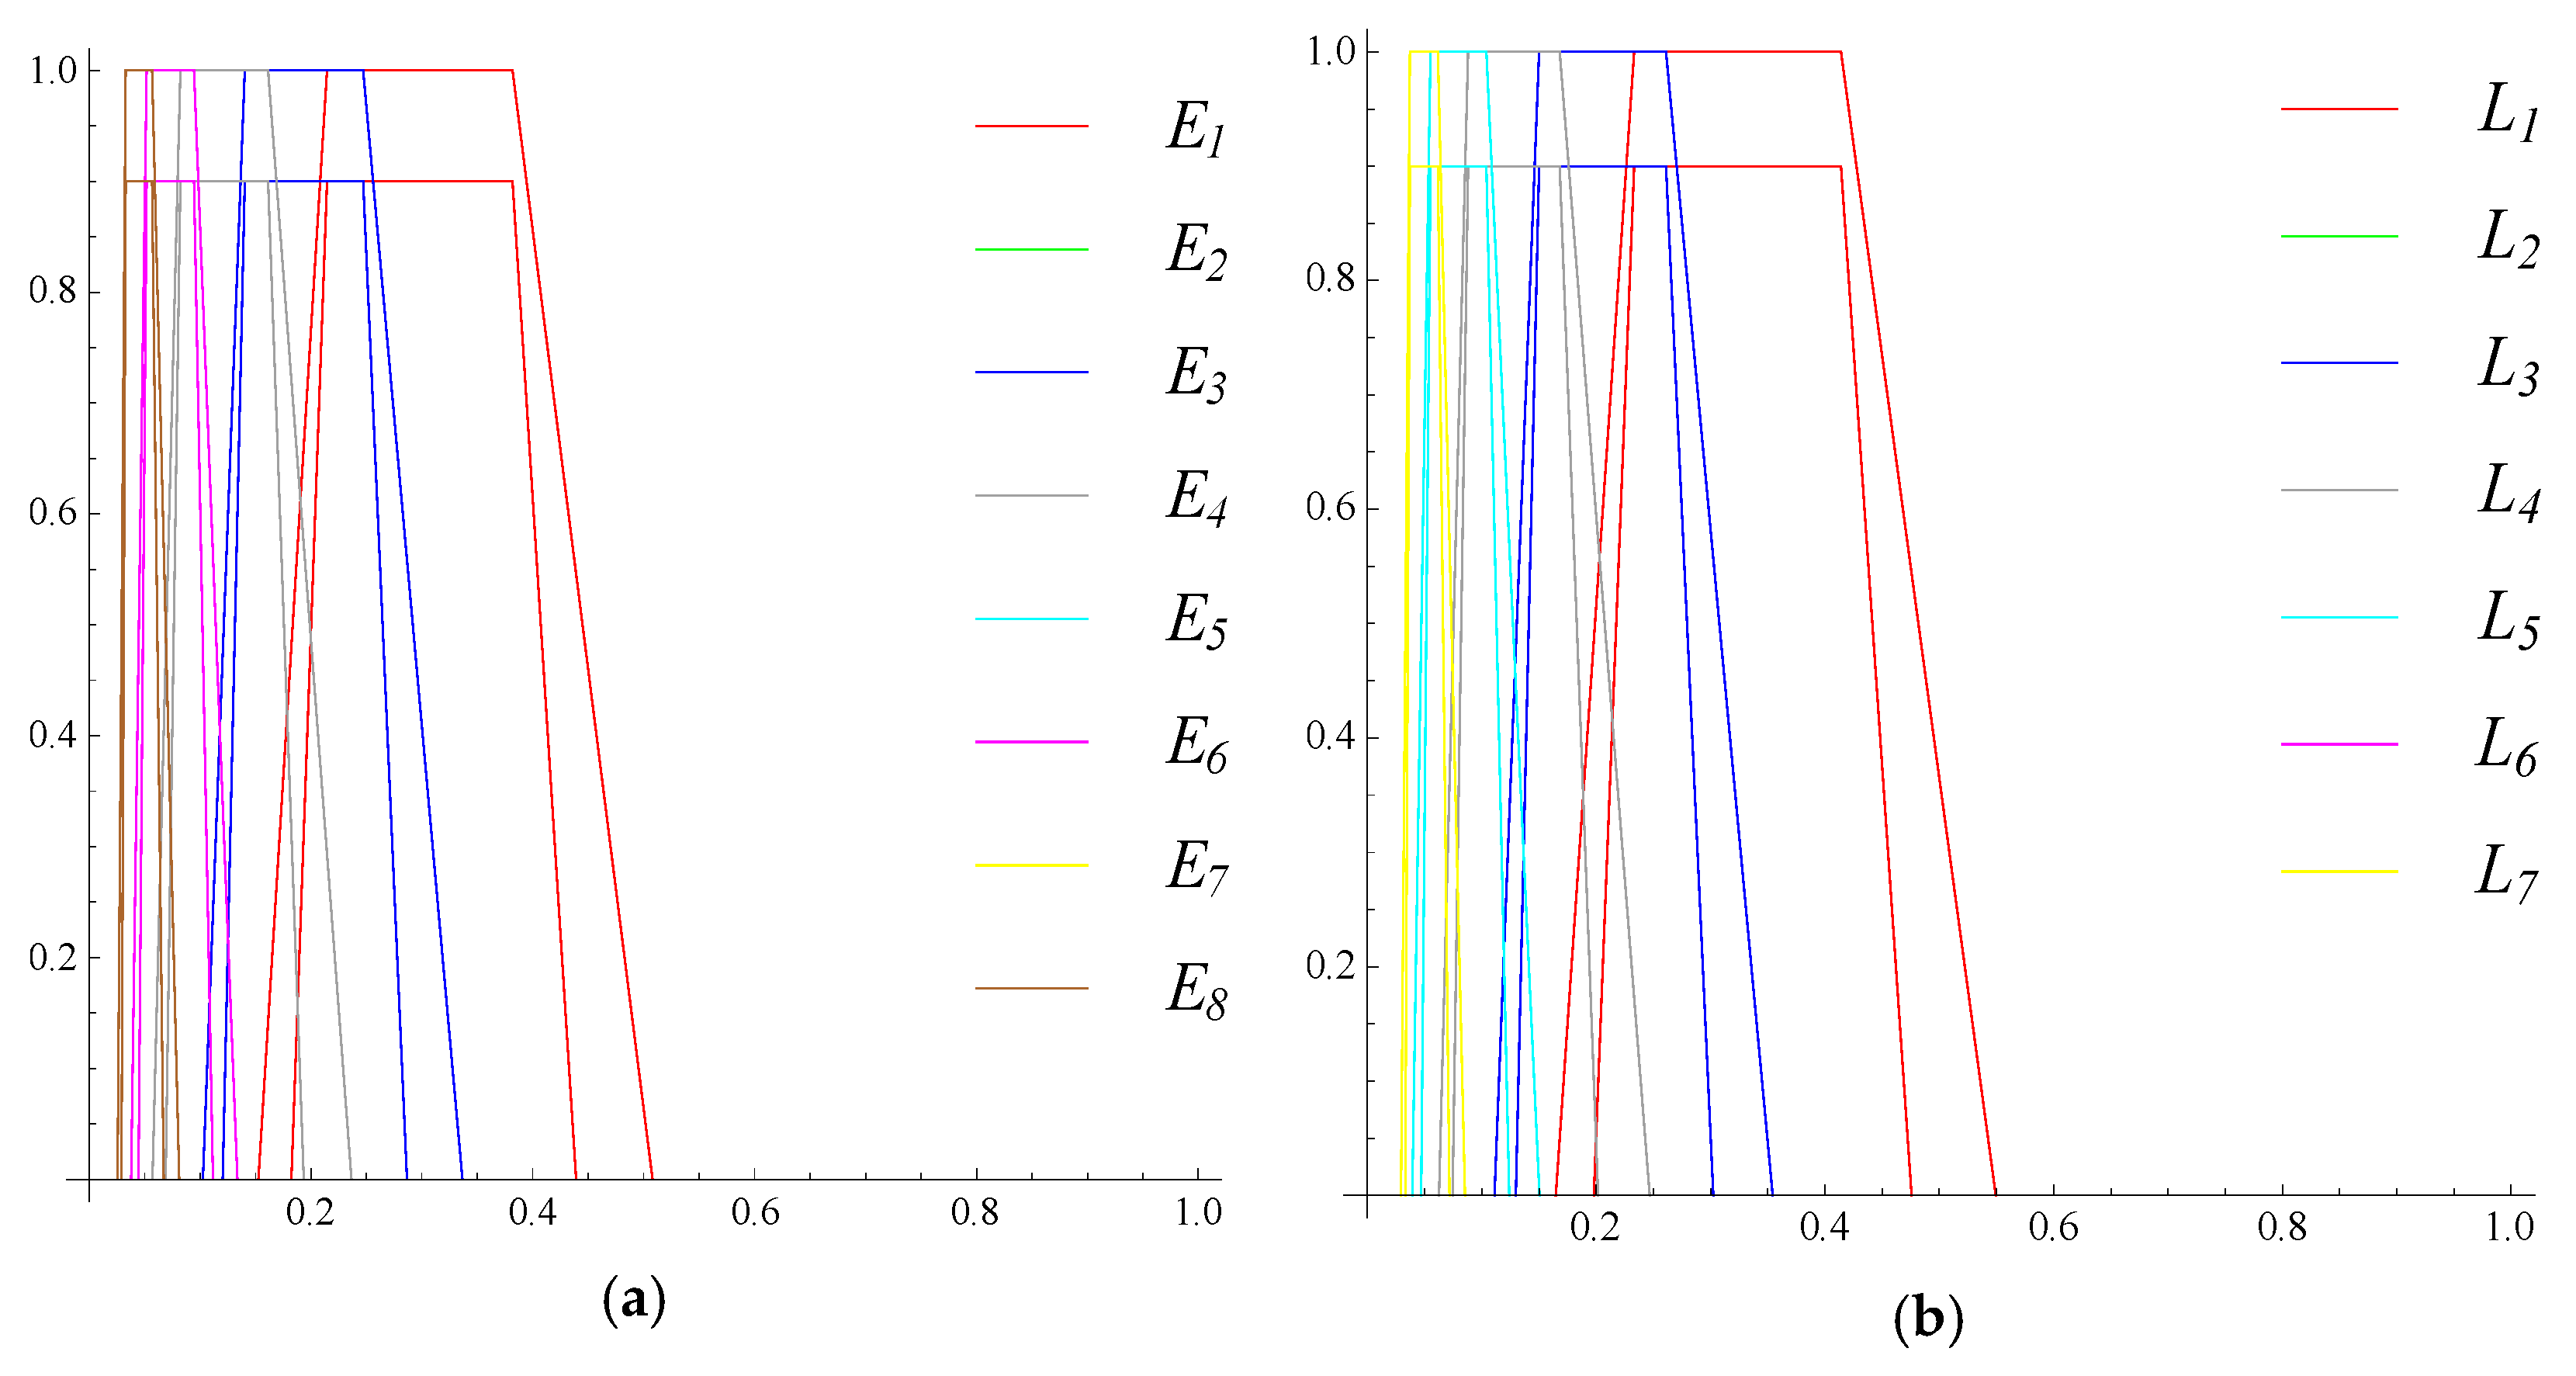
| E1 | (0.1523,0.2146,0.3815,0.5080,1,1) | (0.1824,0.2146,0.3815,0.4391,0.9,0,9) | 0.301873 |
| E2 | (0.1024,0.1401,0.2470,0.3365,1,1) | (0.1205,0.1401,0.2470,0.2867,0.9,0,9) | 0.197718 |
| E3 | (0.1024,0.1401,0.2470,0.3365,1,1) | (0.1205,0.1401,0.2470,0.2867,0.9,0,9) | 0.197718 |
| E4 | (0.05703,0.08217,0.1612,0.2367,1,1) | (0.06893,0.08217,0.1612,0.1936,0.9,0,9) | 0.127358 |
| E5 | (0.03783,0.05192,0.09455,0.1338,1,1) | (0.04456,0.05192,0.09455,0.1115,0.9,0,9) | 0.0757648 |
| E6 | (0.03783,0.05192,0.09455,0.1338,1,1) | (0.04456,0.05192,0.09455,0.1115,0.9,0,9) | 0.0757648 |
| E7 | (0.02563,0.0327,0.05679,0.08127,1,1) | (0.02897,0.0327,0.05679,0.06717,0.9,0,9) | 0.0466518 |
| E8 | (0.02563,0.0327,0.05679,0.08127,1,1) | (0.02897,0.0327,0.05679,0.06717,0.9,0,9) | 0.0466518 |
| Smart Livability | WSC | ||
| L1 | (0.1648,0.2332,0.4139,0.5494,1,1) | (0.1979,0.2332,0.4139,0.4758,0.9,0,9) | 0.327224 |
| L2 | (0.1109,0.1502,0.2610,0.3542,1,1) | (0.1298,0.1502,0.2610,0.3023,0.9,0,9) | 0.209866 |
| L3 | (0.1109,0.1502,0.2610,0.3542,1,1) | (0.1298,0.1502,0.2610,0.3023,0.9,0,9) | 0.209866 |
| L4 | (0.06276,0.08784,0.1682,0.2469,1,1) | (0.07460,0.08784,0.1682,0.2018,0.9,0,9) | 0.134078 |
| L5 | (0.03926,0.0550,0.1041,0.1505,1,1) | (0.04678,0.0550,0.1041,0.1241,0.9,0,9) | 0.0829211 |
| L6 | (0.02944,0.0370,0.06164,0.08513,1,1) | (0.03305,0.0370,0.06164,0.07177,0.9,0,9) | 0.050878 |
| L7 | (0.02944,0.0370,0.06164,0.08513,1,1) | (0.03305,0.0370,0.06164,0.07177,0.9,0,9) | 0.050878 |
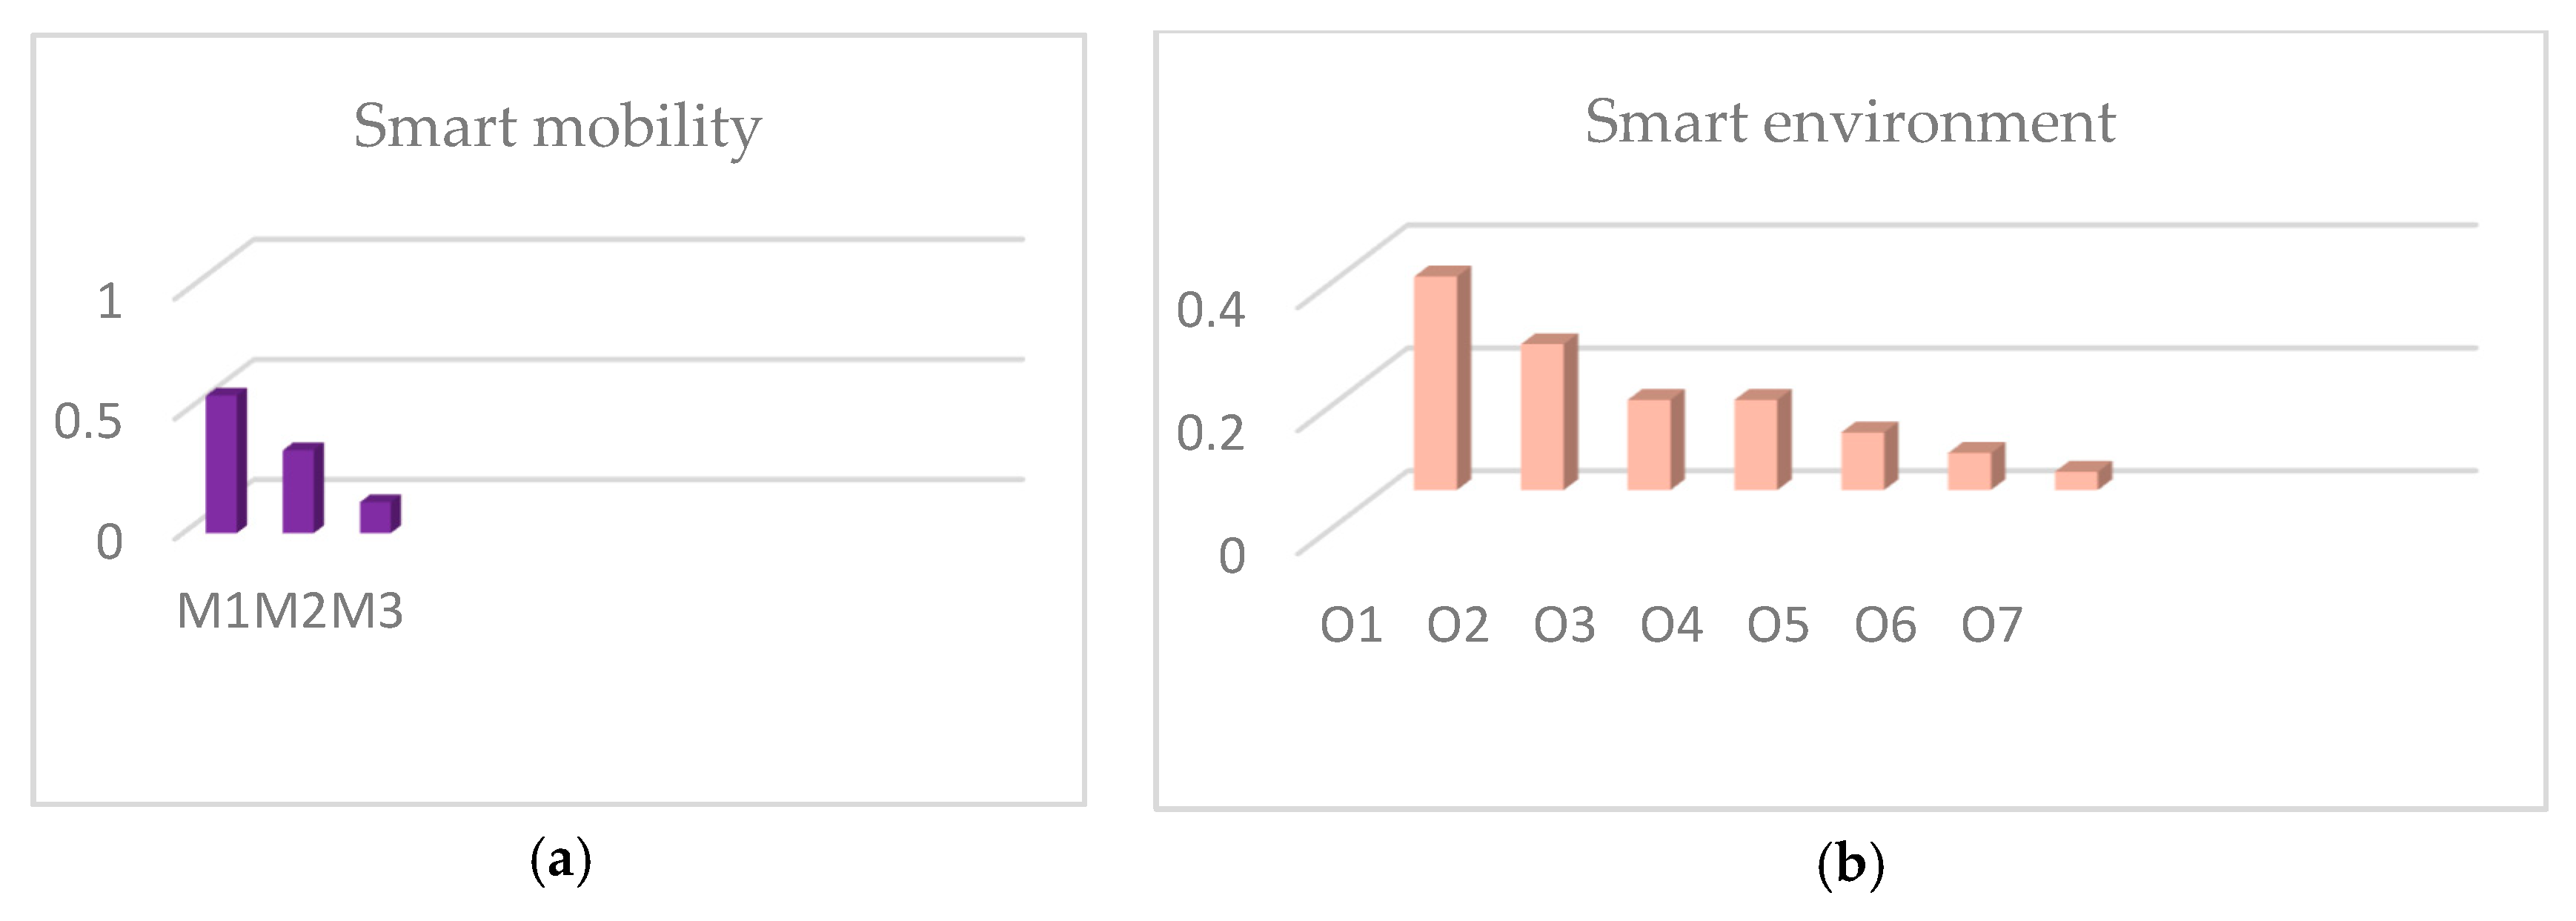
| Smart Mobility | WSC | ||
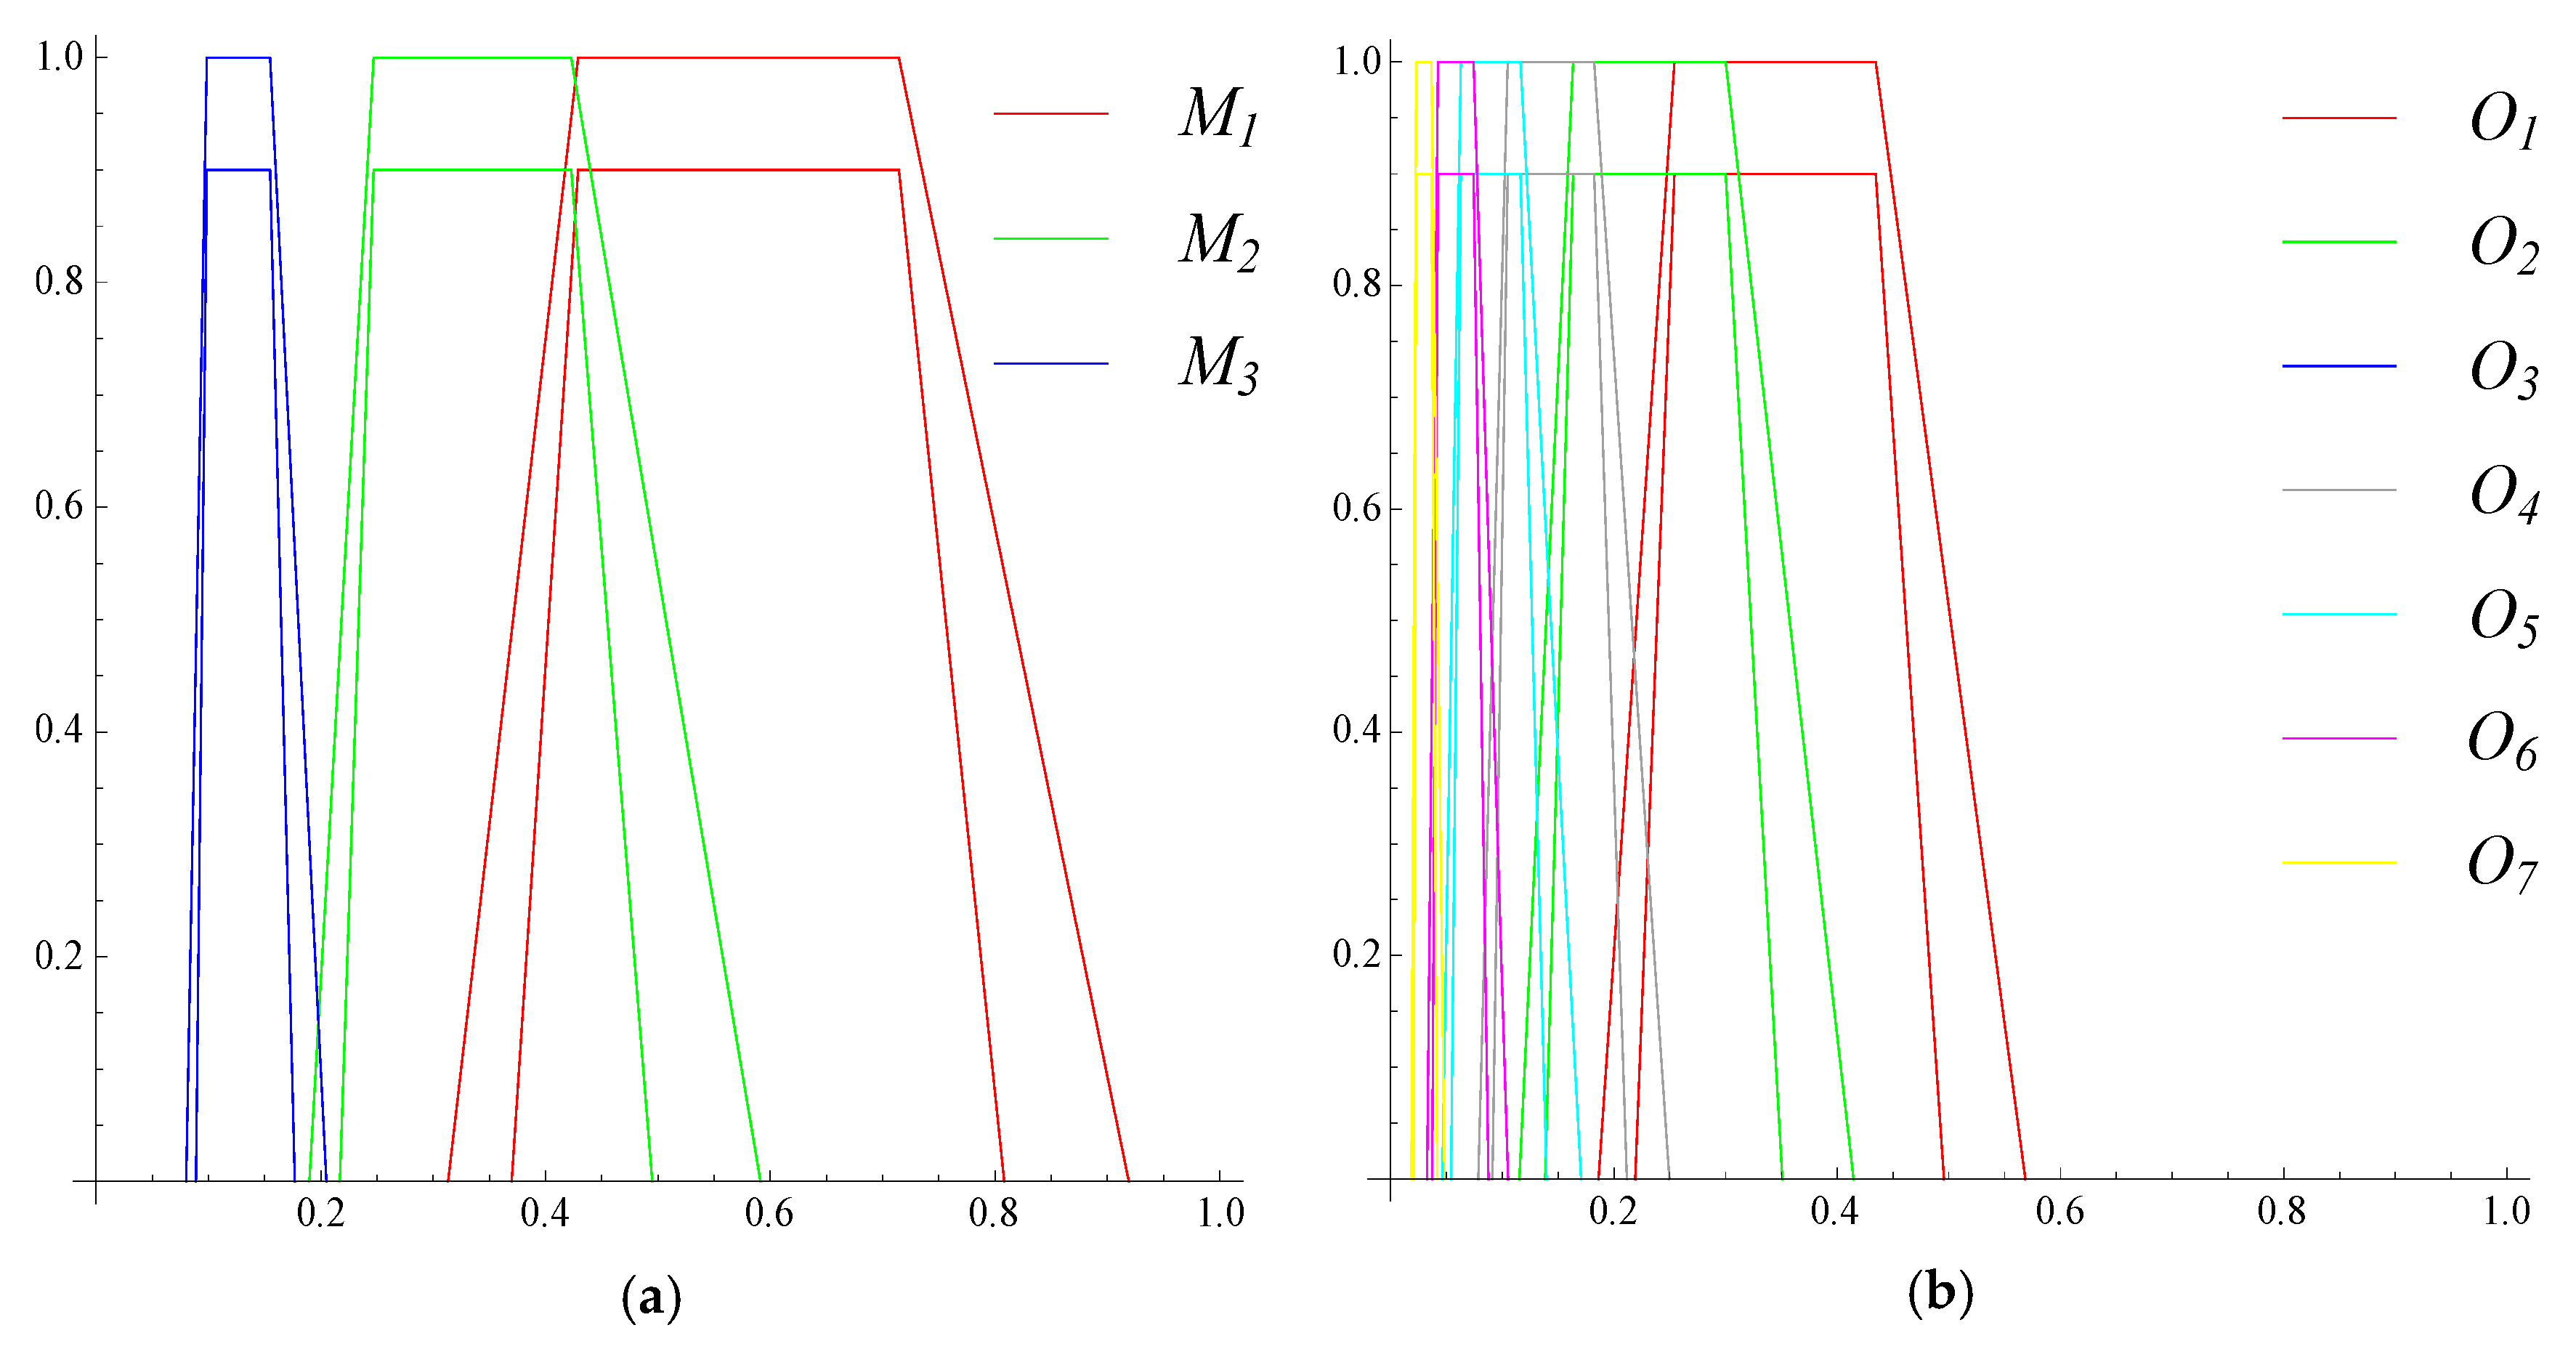
| M1 | (0.3132,0.4288,0.7142,0.9187,1,1) | (0.3699,0.4288,0.7142,0.8082,0.9,0,9) | 0.572792 |
| M2 | (0.1897,0.2467,0.4228,0.591,1,1) | (0.2168,0.2467,0.4228,0.4949,0.9,0,9) | 0.345648 |
| M3 | (0.08001,0.09844,0.1547,0.205,1,1) | (0.08878,0.09844,0.1547,0.1768,0.9,0,9) | 0.128952 |
| Smart Environment | WSC | ||
| O1 | (0.1859,0.2542,0.4344,0.5685,1,1) | (0.2189,0.2542,0.4344,0.4957,0.9,0,9) | 0.347233 |
| O2 | (0.1150,0.1633,0.3001,0.4144,1,1) | (0.1382,0.1633,0.3001,0.3508,0.9,0,9) | 0.237389 |
| O3 | (0.07815,0.1047,0.1819,0.2493,1,1) | (0.09089,0.1047,0.1819,0.2115,0.9,0,9) | 0.146826 |
| O4 | (0.07815,0.1047,0.1819,0.2493,1,1) | (0.09089,0.1047,0.1819,0.2115,0.9,0,9) | 0.146826 |
| O5 | (0.04614,0.06271,0.116,0.1703,1,1) | (0.05396,0.06271,0.116,0.1395,0.9,0,9) | 0.0938462 |
| O6 | (0.03235,0.04214,0.07402,0.1048,1,1) | (0.03695,0.04214,0.07402,0.08728,0.9,0,9) | 0.0602656 |
| O7 | (0.01820,0.0226,0.03617,0.04790,1,1) | (0.02032,0.0226,0.03617,0.04137,0.9,0,9) | 0.0299542 |
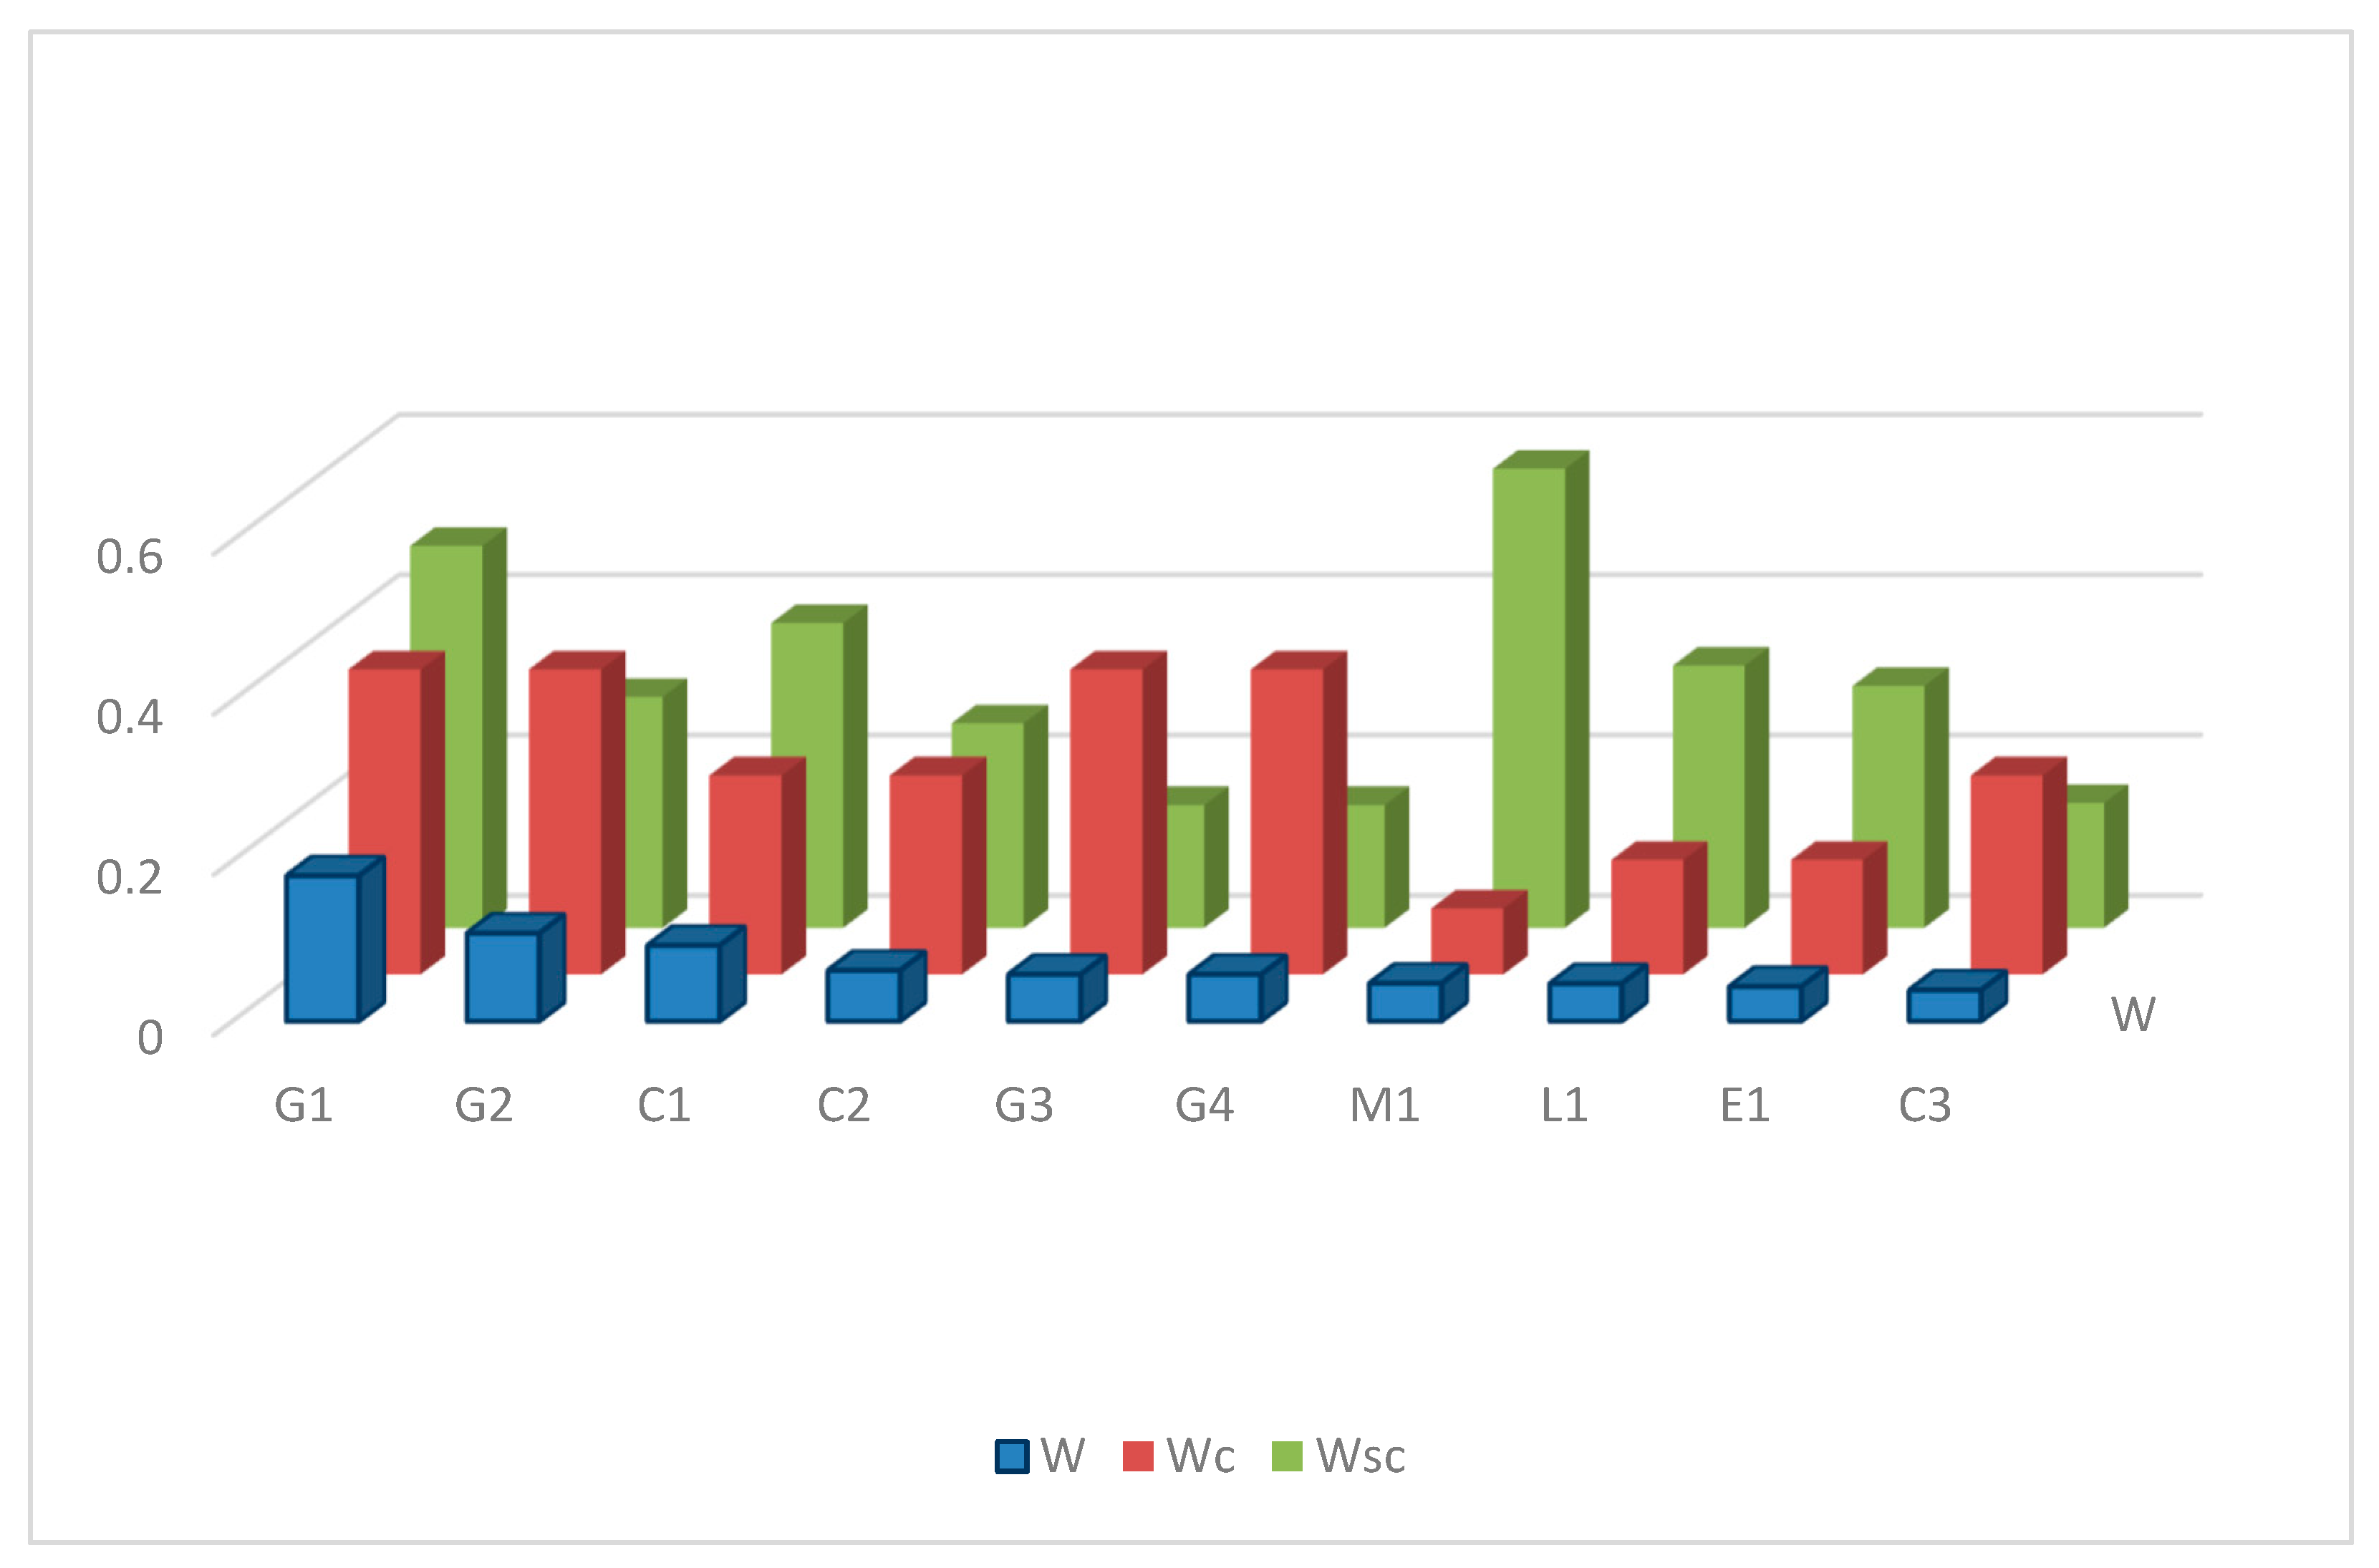
| Sub-Criteria | WC | WSC | WC*WSC |
|---|---|---|---|
| Strategies and perspectives for smart city development G1 | 0.3806 | 0.4766 | 0.1814 |
| Citizens active participation in decision making G2 | 0.3806 | 0.2883 | 0.1097 |
| Involvement of citizens in the community C1 | 0.2484 | 0.3803 | 0.0945 |
| Raising civic awareness C2 | 0.2484 | 0.2553 | 0.0634 |
| Accessibility of services and e-government G3 | 0.3806 | 0.1533 | 0.0583 |
| Management transparency and use of open-data G4 | 0.3806 | 0.1533 | 0.0583 |
| Integration of ICT infrastructure M1 | 0.0824 | 0.5728 | 0.0472 |
| Strengthening individual citizen safety L1 | 0.1430 | 0.3272 | 0.0468 |
| Self-employment fostering and entrepreneurship E1 | 0.1430 | 0.3019 | 0.0432 |
| A degree of citizens qualification and education C3 | 0.2484 | 0.1559 | 0.0387 |
| Affinity to life-long and e-learning C4 | 0.2484 | 0.1559 | 0.0387 |
| Affordable housing and good housing condition L2 | 0.1430 | 0.2099 | 0.0300 |
| Utilities and infrastructure equipment L3 | 0.1430 | 0.2099 | 0.0300 |
| Sustainable urban planning and management O1 | 0.0824 | 0.3472 | 0.0286 |
| Innovative transport systems with non-motorized vehicles M2 | 0.0824 | 0.3456 | 0.0285 |
| Innovations and strategic investment E2 | 0.1430 | 0.1977 | 0.0283 |
| Economic opportunities for citizensE3 | 0.1430 | 0.1977 | 0.0283 |
| Pollution control and environment protection O2 | 0.0824 | 0.2374 | 0.0196 |
| Accessibility to healthcare services L4 | 0.1430 | 0.1341 | 0.0192 |
| Productivity in economy E4 | 0.1430 | 0.1274 | 0.0182 |
| Creativity, flexibility, and open-mindedness C5 | 0.2484 | 0.0678 | 0.0168 |
| Efficient water use O3 | 0.0824 | 0.1468 | 0.0121 |
| Use of renewable energy sources O4 | 0.0824 | 0.1468 | 0.0121 |
| Opportunities for education and training L5 | 0.1430 | 0.0829 | 0.0119 |
| Transformation capacity and market flexibility E5 | 0.1430 | 0.0758 | 0.0108 |
| Economy promotion and market competitiveness E6 | 0.1430 | 0.0758 | 0.0108 |
| Good local and international accessibility to city M3 | 0.0824 | 0.1290 | 0.0106 |
| The social and ethnic diversity of citizens C6 | 0.2484 | 0.0344 | 0.0086 |
| Energy efficiency buildings construction O5 | 0.0824 | 0.0938 | 0.0077 |
| Social integration and recreation L6 | 0.1430 | 0.0509 | 0.0073 |
| Development of culture and tourism L7 | 0.1430 | 0.0509 | 0.0073 |
| Economy promotion and competitiveness E6 | 0.1430 | 0.0467 | 0.0067 |
| Development of e-business and e-commerce E7 | 0.1430 | 0.0467 | 0.0067 |
| Management and protection of natural resources O6 | 0.0824 | 0.0603 | 0.0050 |
| Nature attractiveness of landscapes O7 | 0.0824 | 0.0300 | 0.0025 |
© 2019 by the authors. Licensee MDPI, Basel, Switzerland. This article is an open access article distributed under the terms and conditions of the Creative Commons Attribution (CC BY) license (http://creativecommons.org/licenses/by/4.0/).
Share and Cite
Milošević, M.R.; Milošević, D.M.; Stević, D.M.; Stanojević, A.D. Smart City: Modeling Key Indicators in Serbia Using IT2FS. Sustainability 2019, 11, 3536. https://doi.org/10.3390/su11133536
Milošević MR, Milošević DM, Stević DM, Stanojević AD. Smart City: Modeling Key Indicators in Serbia Using IT2FS. Sustainability. 2019; 11(13):3536. https://doi.org/10.3390/su11133536
Chicago/Turabian StyleMilošević, Mimica R., Dušan M. Milošević, Dragan M. Stević, and Ana D. Stanojević. 2019. "Smart City: Modeling Key Indicators in Serbia Using IT2FS" Sustainability 11, no. 13: 3536. https://doi.org/10.3390/su11133536
APA StyleMilošević, M. R., Milošević, D. M., Stević, D. M., & Stanojević, A. D. (2019). Smart City: Modeling Key Indicators in Serbia Using IT2FS. Sustainability, 11(13), 3536. https://doi.org/10.3390/su11133536