Abstract
As concerns about environmental quality, social equity, and economic efficiency are increasing, efforts on improving the sustainability of public transportation are being made all over the world. This study aims to propose a transit route network design problem that considers modal and spatial equities. The equities are accommodated by using two indexes that can simultaneously reflect mobility and accessibility. A decision-making process for designing a transit route network consists of the selection of the target line, selection of the target node, the determination of an alternative line, and the implementation of a procedure for setting frequency. The model is configured through bi-level modeling based on an iterative process to calculate the modal split and the traffic and transit assignments with changes in the transit route network. While the frequency of each line is determined by a genetic algorithm in the upper model, the modal split and traffic and transit assignments are implemented in the lower model. This transit route network design model and the associated algorithms are applied to a sample network. As a result, an improved solution with equity and the lower total cost is identified based on a comparison with the existing transit route network.
1. Introduction
As the concept of sustainable public transport becomes a new paradigm, many research projects and practical initiatives have developed and suggested a reasonable set of sustainability criteria. Though the criteria vary with the objectives of the projects or initiatives, they can be classified into three subgroups, i.e., economic, social, and environmental ones [1,2,3,4]. The economic criteria include traffic congestion, accident damages, and operator and consumer costs, and the environmental criteria consist of air pollution, hydrologic loss, and energy consumption. The social criteria, whose attention is less focused, include inequity, human health, and community interaction [5].
The role of public transportation is currently focused on relieving traffic congestion and enabling faster movement. Drivers and public transportation passengers are experiencing reductions in the time and cost required for travel due to improvements in the services provided by public transportation. However, these services cause a serious spatial imbalance to travelers who do not have access to them. Furthermore, the purposes of current public transport services have been expanded to include faster movement and a relief from traffic congestion. Good examples of this are high-speed rail service and median bus lanes in metropolitan areas. Paradoxically, high-speed public transportation services are deepening the spatial imbalance of communities even further.
Equity criteria should be applied to assess and improve transit networks to solve these problems. In this study, horizontal criteria are used to divide equity into modal equity and spatial equity. As a result, we propose a transit route network design problem that considers modal and spatial equities. In addition, we propose a heuristic transit route network decision-making process with sequential procedures consisting of the selection of the target line, selection of the target node, the determination of an alternative line, and a procedure for setting the frequency of each line.
The range of the equity analysis is the travel time between zones (origin and destination) of each mode. Modes are divided into passenger car and transit, and the travel time of each mode indicates the total travel time from the origin to the destination. The spatial range of this study is comprised of an urban network in which transit service is provided. We use Mandl’s network as an example because it is used frequently in public transport network design problems [6].
2. Literature Review
2.1. Equity in Public Transportation
It was Kain’s research that initiated the discussion of equity in transportation [7]. The concepts that inadequate transportation must be numbered among the disadvantages of the poor, and that improved mobility, particularly concerning access to jobs, could increase their self-sufficiency were discussed extensively in the mid-1960s. Equity in the transportation area, i.e., horizontal equity and vertical equity, has been presented as an indicator of “spatial equity” in many studies of the spatial distribution of transportation facilities and services. Spatial equity is associated with the right to mobility and the provision of identical conditions for citizens living in all parts of a certain region. In addition, some researchers considered the “longitudinal equity” associated with the comparison of conditions between the past and the present for each citizen and for social groups. In addition, “modal equity” has been described in some studies. This type of equity is associated with inter-modal differences or gaps between access by transit and automobile for the same zone or differences of access between different zones for the same mode [8,9,10,11,12,13]. We considered both spatial equity and modal equity in this study.
In the road network design problem related to road construction or expansion and the imposition of congestion tolls, equity among regions has been considered since the 1990s [14,15,16,17,18,19,20,21,22,23]. However, to the best of our knowledge, there are very few applications to this transit network design problem [24,25]. In the field of designing road networks and transit networks, the goal is commonly to minimize the costs incurred by the users and operators. Various advanced research efforts have been conducted to measure the equity indexes related to travel time and the spatial distribution in the studies of road network construction and extension. If we continue to construct or extend roads only on the basis of the cost efficiency of user and operator, the spatial bias phenomenon of large population areas and the bias of traffic demand will occur continuously.
2.2. Indexes for Public Transportation
Duthie et al. presented the considerations for equity in transportation planning. Their study indicates directions that transportation policy must take to ensure equity. The analysis of the spatial distribution of traffic, precise prediction of current/future origins and destinations (ODs), and analysis of the network level are necessary when taking equity into account in transportation planning [26].
Lee suggested the index, degree of competiveness (), for indicating the mobility of public transportation [27]. is the comparison index between car and transit travel times, and it shows how transit service can compete with cars for each origin–destination trip. This index can be used as an indicator of the level of overall public transport service for a given network. In Lee et al.’s additional study, they compared five cities in Korea [28]. Ferguson et al., through the minimization of the difference between bus transit time and passenger car and public transport transit times, tried to improve the equity of the public bus transport service. The term “accessibility” in this study referred to a comprehensive indicator of transit times between regions for passenger cars and public transport, the number of transit lines, and the frequency of the public transport vehicles [29].
Currie presented the accessibility index of public transport, which they called the “Supply index.” This index is computed by the ratio of the frequency of public transport to the catchment (buffer) area of each census zone [30]. Delbosc and Currie extended Currie’s study by suggesting the use of a “public transport index” [31]. The public transport index was intended to assess a public transportation service macroscopically by evaluating the index based on the ratio of the supply index to the population. In addition, many other indexes have been used to assess public transportation networks [32,33,34,35,36,37,38].
In the fields of urban planning and geography, many studies have used indexing for the assessment of the current state of public transportation. However, depending on the focus on the current state of indexing, few studies have included the design issues for the network improvement. Camporeale et al. suggested a transport route planning methodology to achieve equitable accessibility [25], and Jianjun et al. suggested an equity-based timetable optimization problem based on the waiting time of users [39]. Even if the approach to the problem is to improve the design of the network, the results will be limited because the approach does not take into account the actual traffic situation or the variable demand.
3. Model Specifications
3.1. Model Framework
The transit route network design model of this study is organized based on the route network decision-making process considering equity and bi-level modeling. A route network decision-making process considering equity is performed with line candidate constraints, and the frequency-setting problem is implemented with bi-level modeling. The objective function of the upper model is constructed in the form of minimizing the total cost of users and operators with line candidate constraints, while, in the lower model, the modal split of passenger car/transit and the traffic and transit assignments are based on the variable frequency-setting situation in the upper model. A binary logit model was used to perform the modal split, and traffic and transit assignments were implemented based on user equilibrium using the convex combination and transit assignment models developed by Spiess and Florian, respectively [40,41]. Excluding the frequency constraints of the upper level problem, the other constraints were determined using the route network decision-making process. Figure 1 shows the proposed model framework.
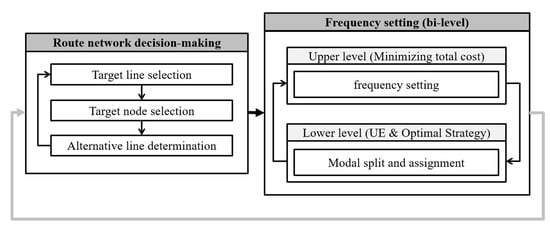
Figure 1.
Proposed model framework.
3.2. Application of Equity Indexes
The determination of the route network procedure in this study has the purposes of maximizing modal equity and spatial equity, as well as improving the transit network. Modal equity is when the extent of the difference between transit travel time and cars’ travel time is negligible due to the improvement of the transit network. Spatial equity is the extent to which the difference of modal equity among regions is negligible by giving a priority of transit network improvement to the regions that have lower modal equity. The equity indexes are formulated as follows:
where represents a modal equity of the whole network and represents a modal equity of zone , and these values of each zone are compared to assess the spatial equity of the transit network. The term is the travel time by car from to , and is the travel time by transit from to . In this study, travel time by car is calculated based on the user equilibrium state, and travel time by transit consists of in-vehicle time, access/egress time, and waiting time. The travel time of each link is calculated by the Bureau of Public Roads (BPR) function, and the traffic assignments of transit users are implemented by the optimal strategy. Details are explained in the Section 3.4.
3.3. Route Network Decision-Making Process
We present the decision methodology of route network determination with target line (line to alter) selection, target node (node to improve modal equity) selection, and alternative line generation and determination procedures. A route network consists of the combination of lines, and a line is a sequence of transit nodes. As the size of the network is increased, the more difficult it becomes to calculate the solution, because the number of line candidates increases geometrically. Therefore, in this study, we used simplified heuristic algorithms based on the indicator of modal and spatial equity. The target line is selected by the total of the entire network (), and the target node is selected by of the origin (). These indexes are justified in the following section. Alternative line candidates are generated with minimum paths via the target line between all of the nodes, and the length, circuity, and redundancy of the lines are checked. Summary and considerations of each procedure are shown in Table 1.

Table 1.
Route network decision-making procedure and considerations.
In the target line selection procedure, per unit length is used to assess the modal equity of existing lines. By removing transit lines one-by-one, change per unit length is calculated; the one with the least equity impact is selected as the “target line,” and that line is deleted. If the transit line cannot be altered (a railroad, for example), this line cannot be selected as the target line. Figure 2a shows the flowchart of the target line selection. Nodes are compared by with the line combination without a target line. This index indicates the modal equity of each origin, and, if this index is higher than the other node, that node has lower spatial equity than the other nodes. The node with the highest is set to "target node." The target node is the region where the alternative line should improve modal equity. When the target node in the transit network is improved, the maximum decreases, and spatial equity increases. Figure 2b shows the flowchart of the target node selection.
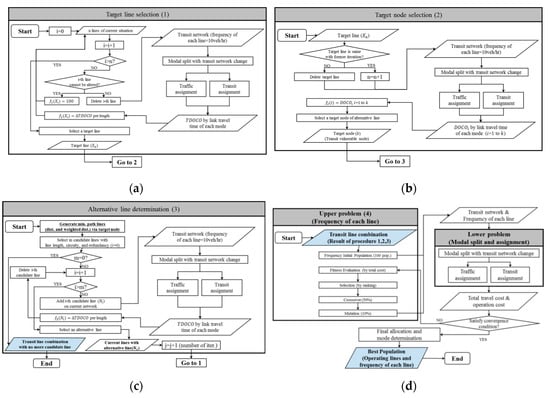
Figure 2.
Flowchart of the model procedure used in this study. (a) Target line selection procedure; (b) target node selection procedure; (c) alternative line determination procedure; (d) frequency setting, modal split and car/transit assignment procedures.
Figure 2c shows the flowchart of the alternative line determination. After selecting the target node, generating candidate lines via the target node has the advantage of reflecting the effects of improving the vulnerable node. In this study, minimum paths are generated via the target node by distance weighted to the volume from all nodes to all nodes. Among the candidate lines with satisfying line length, circuity, and redundancy conditions, the line of the highest improvement is “alternative line.” Line length, circuity, and redundancy are compared to reduce operational inefficiencies.
Figure 3a shows examples of the minimum path via the target node. With an actual minimum path via the target node, additional weighted minimum paths are generated in this figure. A calculation of the minimum path is implemented by the shortest path algorithm [42], which is widely used in various areas. In this study, this algorithm is applied by determining the minimum path from all origins to the target node and from the target node to all destinations.
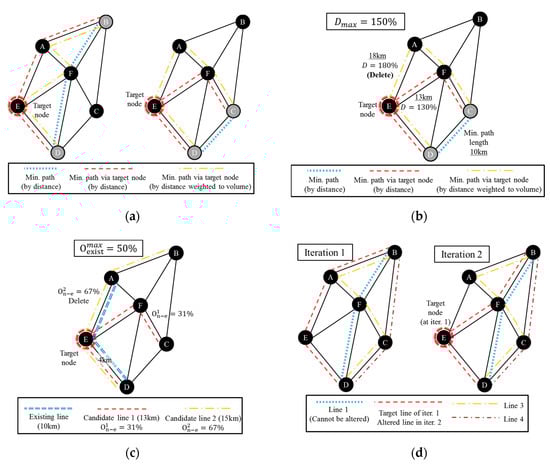
Figure 3.
(a) Minimum path via target node; (b) checking circuity; (c) checking redundancy; and (d) alternative line.
The generated candidate lines are compared to minimum and maximum line length, minimum path, and existing lines. If the candidate lines do not satisfy the constraint condition of length, they are deleted. The remaining lines are compared to the minimum path between each node by circuity. In this study, circuity is the ratio of the length of the minimum path via the target node to the minimum path between each of the nodes. If the circuity is greater than the defined value, that line is deleted from the alternative line. After that, if the redundancy of the alternative line with existing lines is greater than the defined value, that line is deleted from the alternative line candidate. In this study, the redundancy is defined as the ratio of the redundant length to the existing lines of total line length. Figure 3b shows that line via D–E–A–F–C was deleted from the candidate line because the value of circuity was greater than the maximum value. Figure 3c shows the redundancy test procedure by illustration with a simple example. Candidate line 1 had a 31% redundancy with the existing line. The maximum redundancy in this illustration is 50%, and, because the redundancy of this line does not exceed the maximum value, it was not deleted. However, candidate line 2 had a redundancy that exceeded 50%, so it was deleted in this procedure.
Candidate lines via the target node that satisfy the required length, circuity, and redundancy are candidates of alternative lines that alter the target line. These candidate lines are added one by one to the configuration of the existing line repetitively. The candidate line that has the maximum improvement of per unit length is the new alternative line of iteration . The new line enhances the directness and mobility of the vulnerable target node and maximizes the improvement of per unit length. The procedure for selecting the target line of iteration, is implemented with this line configuration. The altered line in the right figure of Figure 3d is the alternative line because it maximized the improvement of per unit length in iteration 1 and maximized the improvement of one of the existing lines in iteration 2.
From this new transit network, the procedures for the selection of the target line, the target node, and a new alternative line are repeated. If the target line of iteration is the same as the new line of iteration , an infinite loop may occur. In this case, the target line is not deleted, and the procedures for selecting a target node and determining a new alternative line (without deleting the existing line) are implemented. These iterative procedures are repeated until the candidate line is no longer generated in response to the redundancy constraint with existing lines (50%, for example) because many lines exist by continuous iterations.
3.4. Frequency Setting by Bi-Level Modeling
The procedure of frequency setting shown in Figure 2d is to find the optimal transit lines and frequency of each line to satisfy the efficiency of the user and operator’s total cost. In the frequency setting procedure, with the upper level of bi-level modeling, a genetic algorithm (GA) was used to determine the optimal solution. The range of each gene (fleet number per hour per line) varies from 1 to the maximum possible fleet number in lines that cannot be changed and from 1 to two times the maximum number in altered lines. If the value of the gene exceeds the maximum fleet number, that line is not operated [43,44,45,46,47,48]. Here, fleet numbers per hour, such as 11 and 23, were excluded to facilitate the speed and effectiveness of the calculations and to enhance the efficiency of the actual operation.
The upper level problem is the procedure of setting the frequency to determine the optimal transit routes and the frequency of each line to satisfy the interests of the users and the operator’s total cost. The candidate lines are restricted by equity constraints, which were discussed in the previous section.
The objective function of upper level model is to minimize the total cost, i.e., the combination of the users’ cost and the operator’s cost as shown in (3):
The users’ cost is the total cost in terms of the time that people should spend to use the passenger car and the transit. The total time of transit includes access/egress time, waiting time, transfer time, stopping time at stations or bus stops, and in-vehicle time. The total time of each mode is calculated on the basis of each link by the volume and the link travel time. Total time cost is calculated by multiplying total time by the value per unit of time.
where and are the time cost of a car and the transit of link , respectively; is the value of time; is the volume of link ; and is the travel time of link with volume .
The operator’s cost can be determined by the formula in Equation (5) [49]. The cost is determined by the length of the line, the number of stops, frequency, fleet capacity, and maximum speed.
where is the length of line , is the number of stops on line , is the frequency of line , is the fleet capacity of line , and is the maximum speed on line .
Depending on the improvement or change of the transit network, the travel time between the zones will change, and changes occur in the choice of mode between a passenger car and the transit system. As a result, cars’ travel times on the roads change when the volume of traffic changes, and the transit travel time also changes. This iterative calculation procedure reflected the travelers’ actual choices of mode and path and provided inputs for the model. As a result, the objective function value of the upper level problem is the result of the calculation of the lower level model, and the fitness function of the upper level model is calculated by these results. In this study, the modal split was implemented by the logit model based on the travel behavior of individuals. The probability of selecting mode m is calculated as follows:
where is the probability of selecting mode , is the utility of mode , is the utility of mode , and is the number of modes.
Utility is calculated based on the travel time and cost as shown in Equation (7):
where is the utility of mode between origin and destination , is the total travel time, is the total travel cost of mode between and , is a dummy variable with other factors (comfort, safety, etc.) is a constant, and and are parameters.
In this study, the same coefficient values are applied into parameters between the modes, and different values are applied to the dummy variable for each mode cited by the Feasibility Manual of Korea [50]. As a result, the volume of each mode is equal to the total volume multiplied by the probability of mode selection.
The objective function and constraints based on the user equilibrium state of car assignment are as follows: [40]
where is the volume using path from the origin to the destination, is the volume of cars from the origin to the destination, and is 1 if path from the origin to the destination includes link —otherwise, it is .
Car assignment applies the linear approximation method, also known as the Frank–Wolfe method. In the first iteration, a set of shortest paths is calculated based on link time, which is free flow travel time. The first iteration is an all-or-nothing assignment in which all the demand is assigned to the shortest paths. After that, the travel time of each link is compared, and link flows are updated to minimize travel time under the volume-delay curves. At each iteration, a measure of the difference between the current flows and the equilibrium flows can easily be estimated. These iterations stop when the total travel time is significantly not different from the total travel time on the shortest paths [51].
This study uses the transit assignment model according to optimal strategy suggested by Spiess and Florian [41], one of the multipath assignment models for transit assignment of public transportation. The objective function and constraints in the optimal strategy model are as follows:
where is link set, is node set, is link set outbound node , is link set inbound node , is transit volume from node , is transit volume of link , is transit time of link , is frequency of link , and is waiting time of node [41].
The optimal strategy is defined as a set of paths for passengers to reach destinations. The number and the type of strategies are determined by the information which a passenger get during the trip. Figure 4 shows a case of strategies a passenger moving from node A to B can choose.
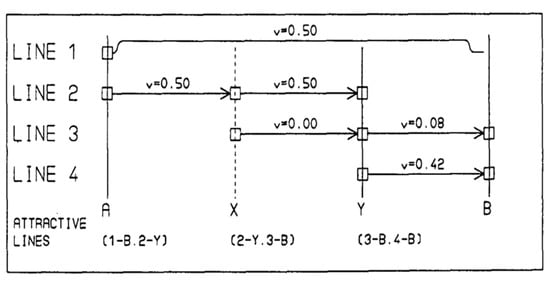
Figure 4.
Illustration of optimal strategy. Source: Spiess, H., and Florian, M. (1989).
Spiess and Florian considered the strategy as follows. If a passenger knows which lines to be served next while waiting at a node, they can take the line arriving faster; if line 1 was taken, then they can get off at node B; if line 2 was taken, then they can get off at node Y and transfer to line 3 or 4. Spiess and Florian assumed that a passenger can get the only information during the trip while waiting for a node of that line which is served next. All trips are generated by the strategy minimizing passenger’s travel time. This strategy is feasible if the route defined by the strategy does not include a cycle, and the optimal strategy minimizes traveler’s travel time. All trips are made according to the strategy. A trip is carried out according to the following procedures once a strategy is established as the previous case.
Step 0: Set origin node to NODE.
Step 1: Board vehicle which arrives first among the vehicles of the set of attractive lines at NODE.
Step 2: Alight at predetermined node according to the optimal strategy.
Step 3: If not yet at destination, set current node to NODE move to Step 1. Otherwise the trip is completed.
4. Numerical Example
4.1. Basic Unit Input
The example network of this study is Mandl’s network. The total traffic flow per hour, road network, and transit network were set and analyzed. This network consists of 15 nodes and 44 links, and one railroad line and three bus lines were operated. The one railroad line cannot be altered, but the other lines can be altered to other alternative lines. From this network, we implemented the route network decision-making and frequency-setting procedures. The speeds of the lines were 40 km/hr for the railroad and 30 km/hr for buses. However, the bus lines are often operated slower than 30 km/hr because of traffic congestion. The and of the Bureau of Public Roads (BPR) function are 1.5 and 4, respectively. The coefficients of the utility function of the modal split are cited by the feasibility study manual of Korea [50]. Both the access and egress lengths of transit users are 200 m, and the walking speed is 4 km/hr. Therefore, the access and egress times totaled six minutes. When the candidate lines were generated, the circuity and redundancy were 150% and 70%, respectively, and the minimum and maximum lengths were 10 and 30 km, respectively.
4.2. Transit Route Network Decision-Making
The transit line determination procedure consists of assessing the existing network and selecting the target line, selecting the target node, and determining the alternative line. In this numerical example, 26 candidate lines were determined by 34 iterations. Table 2 shows the target nodes, , and , of each iteration.
Table 2.
Target Node, and by iterations.
Figure 5 and Table 3 show the existing route network and the route network after the route network decision-making process. In this line-determination algorithm, nodes 105, 109, and 112, which are far from the central district of the network, were selected as target nodes, and alternative lines passed through these nodes. At the same time, because of the higher level of service of rail transit, lines redundant to the rail line were not alternated. In the early stage of iterations, lines passing through the suburb area to maximize both modal and spatial equities were generated and altered. After that, in the last stage of iterations, lines that were not redundant to other lines were generated and altered.
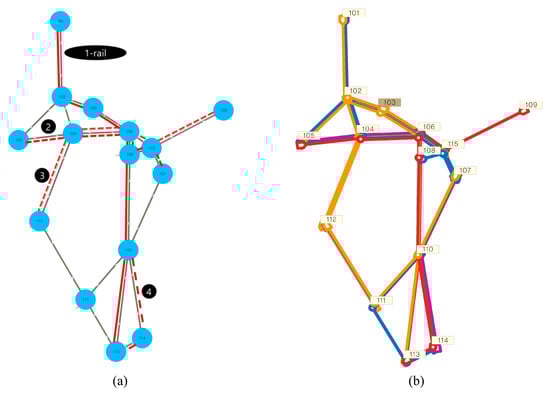
Figure 5.
(a) Existing route network; (b) route network after the procedure to determine the transit line.
Table 3.
Final line configuration and frequency of each line.
4.3. Frequency Setting
The candidate lines, which were determined in the earlier procedures, were selected by equity criteria. Therefore, many lines were generated in the suburb area, and operating all these lines is not efficient. However, in this line configuration, there are many lines that have direct connection between the suburbs and the central area. This procedure consists of frequency setting with the line configuration of former procedures. This procedure is based on the total cost of the user and operator, and the decision variable is the frequency of each candidate line. The procedure for determining the candidate line is to maximize the equity, and this frequency setting procedure is to minimize the cost and maximize the efficiency.
In this sample network, 100 populations were generated. The crossover and mutation probabilities of each gene were 50% and 10%, respectively. Figure 6a shows the direction of the optimal solution. The figure shows that the feasible area moves in the direction of the lower right. This means that the optimal solution is the situation in which the reduction of the users’ cost is no longer greater than the increase in the cost of operation, similar to the law of diminishing returns. Figure 6b shows the convergence of the objective function (total cost). A stepwise convergence occurred with iteration. Eleven of the 26 lines were not operated because of low efficiency.
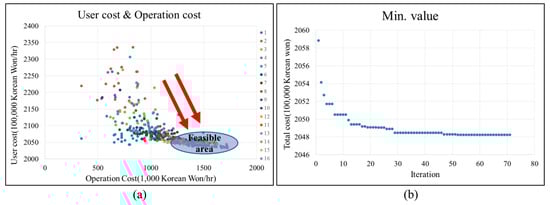
Figure 6.
(a) Finding the direction of the genetic algorithm; (b) convergence of the objective function.
5. Discussion
In this study, line candidates were generated by an iterative procedure of target line selection, target node selection, and alternative line determination. Many candidate lines pass through the regions where spatial equity was worse than it was in other regions in the line candidates by the route network design procedure to improve the equity of corresponding regions. This situation results in an inefficiency of operation because this route network design procedure considered only the equity criteria. Therefore, in the frequency setting procedure, total cost, i.e., users’ cost plus the operator’s cost, is minimized by a genetic algorithm. This final transit route network considers equity and cost effectiveness simultaneously.
Table 4 shows the results of the comparison of the existing network and the improved network. As mentioned earlier, the decrease in the users’ cost was greater than the increase in the operation cost in the improved network. In this example, significant cost savings were achieved by improving the transit route network. Operator cost in this study does not include depreciation of fixed assets, so the operator cost in this study might be lower than actual situation. However, it is important to note that the optimal solution is the situation in which the reduction of the users’ cost is no longer greater than the increase in the cost of operation. The modal split of transit increases with network improvement. In addition, the mode share of transit increased from 19.7 to 27.7% in this sample network. Similar to the results of the cost and modal split, the modal equity of the whole network () and the spatial equity () were improved when the network was improved.
Table 4.
Comparison between existing and improved solutions.
The transit route network in this study considered the modal and spatial equities by and . indicates the modal equity of the given network, and indicates the spatial equity by the maximum value of modal equity of regions. These indexes can be applied to assess and improve given transit networks.
This model can be modified easily in response to changes in practical problems. For example, population and trip distribution, budgetary constraints, and development of new areas and road network are practical issues in reality. This route network design model is divided into three procedures, not counting the frequency setting. As such, each procedure of this model can be moved or skipped within practical constraints. If one network does not need to change the existing transit routes, the first procedure of the route network design can be skipped. In addition, constraints and assumptions can be relaxed with practical situations.
6. Conclusions and Future Research
To enhance the sustainability of public transportation, the transit network should be designed to consider social equity as well as economic efficiency and environmental quality. In this study, a transit route network design problem that considers modal and spatial equities was proposed. Equities were considered by and which can reflect mobility and accessibility simultaneously. In addition, a heuristic transit route network decision-making process was implemented with sequential procedures, i.e., target line selection, target node selection, and alternative line determination. In addition, a frequency-setting procedure was implemented.
The model was configured via bi-level modeling based on an iterative process in order to calculate the modal split and traffic/transit assignment with transit route network changes. The frequency of each line was determined by a genetic algorithm based on the transit route network and took the level of modal and spatial equities in the upper model into account. However, in the lower model, modal split and traffic and transit assignments were implemented. In the transit route network decision process, route deletion and region selection via alternative routes with equity criteria, as well as the generation and determination of alternative route procedures were implemented sequentially. This transit route network design model and algorithms were applied on a sample Mandl’s network. As a result, an improved solution with equity and lower total cost was identified in comparison to the existing transit route network.
There are some expected contributions in this study. First, “equity” indexes were proposed to assess the mobility and accessibility by modified s. Second, an iterative transit route network decision-making methodology to maximize equity was proposed. Third, a genetic algorithm to determine the frequency of each line was improved with a practical frequency constraint, modal split, and assignment with variable demand. The transit route network design model that considers the modal and spatial equities from this research proposed a heuristic algorithm to solve a problem that is usually difficult to solve using a mathematical model. There is a great significance for the actual network. It is possible to evaluate the equity of the actual network and propose strategies to improve its operation.
Additional studies are required to expand the findings of this research. First, in the course of the assessment and alteration, a study of the standardization and indexation process of various indicators should be conducted. In the transit route network decision-making process, modified algorithms can be applied. More lines and nodes can be simultaneous targets, stochastic determination procedures of lines and nodes can be applied, and redundancy and circuity rates can be changed.
In addition, the objective function can be modified according to the purpose of studies or policies. The objective function of this study was to minimize total cost, but maximizing the equity also can be an objective function. Equity can be applied by horizontal criteria, vertical criteria, or both. Furthermore, a multi-objective function of equity and efficiency (cost) can be applied with the Pareto frontier. In addition, it would be meaningful if the transit route network model of this study were applied to another network. Previous researchers have provided solutions for the actual network, but unrealistic solutions, such as completely modifying the entire transit route network, exist. By targeting several routes that require an improvement of equity, it is possible to reflect the methodology of this study and improve the entire transit network with equity considerations.
Author Contributions
The authors confirm contribution to the paper as follows. Study conception and design: M.K. and S.-Y.K.; data collection: M.K.; analysis and interpretation of results: M.K. and D.-K.K.; draft manuscript preparation: M.K., S.-Y.K. and D.-K.K.; supervision, D.-K.K. All authors reviewed the results and approved the final version of the manuscript.
Funding
This work was financially supported by the Seoul R&D Program (PS160010) through the Research and Development for Regional Industry.
Conflicts of Interest
The authors declare no conflict of interest.
References
- Johnston, R.A. Indicators for Sustainable Transportation Planning. Transp. Res. Rec. J. Transp. Res. Board 2008, 2067, 146–154. [Google Scholar] [CrossRef]
- López, E.; Monzón, A. Integration of Sustainability Issues in Strategic Transportation Planning: A Multi-criteria Model for the Assessment of Transport Infrastructure Plans. Comput. Civ. Infrastruct. Eng. 2010, 25, 440–451. [Google Scholar] [CrossRef]
- Manaugh, K.; Badami, M.G.; El-Geneidy, A.M. Integrating social equity into urban transportation planning: A critical evaluation of equity objectives and measures in transportation plans in North America. Transp. Policy 2015, 37, 167–176. [Google Scholar] [CrossRef]
- Hahn, J.-S.; Kho, S.-Y.; Choi, K.; Kim, D.-K. Sustainability Evaluation of Rapid Routes for Buses with a Network DEA Model. Int. J. Sustain. Transp. 2017, 5, 659–669. [Google Scholar] [CrossRef]
- Litman, T.; Burwell, D. Issues in sustainable transportation. Int. J. Glob. Environ. Issues 2006, 6, 331. [Google Scholar] [CrossRef]
- Mandl, C.E. Evaluation and optimization of urban public transportation networks. Eur. J. Oper. Res. 1980, 5, 396–404. [Google Scholar] [CrossRef]
- Kain, J.F.; Meyer, J.R. Transportation and Poverty. Public Interest 1970, 18, 75–87. [Google Scholar]
- Hodge, D.C. Fiscal Equity in Urban Mass Transit Systems: A Geographic Analysis. Ann. Assoc. Am. Geogr. 1988, 78, 288–306. [Google Scholar] [CrossRef]
- Viegas, J.M. Making urban road pricing acceptable and effective: searching for quality and equity in urban mobility. Transp. Policy 2001, 8, 289–294. [Google Scholar] [CrossRef]
- Levinson, D. Equity Effects of Road Pricing: A Review. Transp. Rev. 2010, 30, 33–57. [Google Scholar] [CrossRef]
- Golub, A.; Martens, K. Using principles of justice to assess the modal equity of regional transportation plans. J. Transp. Geogr. 2014, 41, 10–20. [Google Scholar] [CrossRef]
- Weinstein, A.; Sciara, G.-C. Unraveling Equity in Hot Lane Planning a View from Practice. J. Plan. Educ. Res. 2006, 26, 174–184. [Google Scholar] [CrossRef]
- Mollanejad, M.; Zhang, L. Incorporating spatial equity into interurban road network design. J. Transp. Geogr. 2014, 39, 156–164. [Google Scholar] [CrossRef]
- Antunes, A.; Seco, Á.; Pinto, N. An Accessibility-Maximization Approach to Road Network Planning. Comput. Civ. Infrastruct. Eng. 2003, 18, 224–240. [Google Scholar] [CrossRef]
- Chen, A.; Yang, C. Stochastic Transportation Network Design Problem with Spatial Equity Constraint. Transp. Res. Rec. J. Transp. Res. Board 2004, 1882, 97–104. [Google Scholar] [CrossRef]
- Duthie, J.; Waller, S. Incorporating Environmental Justice Measures into Equilibrium-Based Network Design. Transp. Res. Rec. 2008, 2089, 58–65. [Google Scholar] [CrossRef]
- Feng, C.; Wu, J. Using Multi-Objective Fuzzy De Novo Programming and GIS in Highway Network Investment Planning. J. East. Asia Soc. Transp. Stud. 1999, 3, 81–90. [Google Scholar]
- Feng, C.-M.; Wu, J.Y.-J. Highway Investment Planning Model for Equity Issues. J. Urban Plan. Dev. 2003, 129, 161–176. [Google Scholar] [CrossRef]
- Meng, Q.; Yang, H. Benefit distribution and equity in road network design. Transp. Res. Part B: Methodol. 2002, 36, 19–35. [Google Scholar] [CrossRef]
- Santos, B.F.; Antunes, A.; Miller, E.J. Integrating Equity Objectives in a Road Network Design Model. Transp. Res. Rec. J. Transp. Res. Board 2008, 2089, 35–42. [Google Scholar] [CrossRef]
- Yang, H.; Bell, M.G.H. Models and Algorithms for Road Network Design: A Review and Some New Developments. Transp. Rev. 1998, 18, 257–278. [Google Scholar] [CrossRef]
- Caggiani, L.; Camporeale, R.; Ottomanelli, M. Facing equity in transportation Network Design Problem: A flexible constraints based model. Transp. Policy 2017, 55, 9–17. [Google Scholar] [CrossRef]
- Caggiani, L.; Camporeale, R.; Binetti, M.; Ottomanelli, M. A road network design model considering horizontal and vertical equity: Evidences from an empirical study. Case Stud. Transp. Policy 2017, 5, 392–399. [Google Scholar] [CrossRef]
- Camporeale, R.; Caggiani, L.; Ottomanelli, M. Modeling horizontal and vertical equity in the public transport design problem: A case study. Transp. Res. Part A Policy Pract. 2018. (In Press) [CrossRef]
- Camporeale, R.; Caggiani, L.; Fonzone, A.; Ottomanelli, M. Quantifying the Impacts of Horizontal and Vertical Equity in Transit Route Planning. Transp. Plan. Technol. 2017, 40, 28–44. [Google Scholar] [CrossRef]
- Duthie, J.; CervenKa, K.; Waller, S. Environmental Justice Analysis: Challenges for Metropolitan Transportation Planning. Transp. Res. Rec. 2008, 2013, 8–12. [Google Scholar] [CrossRef]
- Lee, Y.-J. Comparative Measures for Transit Network Performance Analysis. J. Transp. Res. Forum 2008, 47, 149–170. [Google Scholar] [CrossRef][Green Version]
- Lee, Y.-J.; Choi, J.; Yu, J.; Choi, K. Geographical Applications of Performance Measures for Transit Network Directness. J. Public Transp. 2015, 18, 89–110. [Google Scholar] [CrossRef]
- Ferguson, E.M.; Duthie, J.; Unnikrishnan, A.; Waller, S.T. Incorporating equity into the transit frequency-setting problem. Transp. Res. Part A: Policy Pr. 2012, 46, 190–199. [Google Scholar] [CrossRef]
- Currie, G. Quantifying spatial gaps in public transport supply based on social needs. J. Transp. Geogr. 2010, 18, 31–41. [Google Scholar] [CrossRef]
- Delbosc, A.; Currie, G. Using Lorenz curves to assess public transport equity. J. Transp. Geogr. 2011, 19, 1252–1259. [Google Scholar] [CrossRef]
- Mishra, S.; Welch, T.F.; Jha, M.K. Performance indicators for public transit connectivity in multi-modal transportation networks. Transp. Res. Part A: Policy Pr. 2012, 46, 1066–1085. [Google Scholar] [CrossRef]
- Park, J.-S.; Gang, S.-C. A Model for Evaluating the Connectivity of Multimodal Transit Networks. J. Korean Soc. Transp. 2010, 28, 85–98. [Google Scholar]
- Ryus, P.; Connor, M.; Corbett, S.; Rodenstein, A.; Wargelin, L.; Ferreira, L.; Nakanishi, Y.; Blume, K. A Guidebook for Developing a Transit Performance-Measurement System, TCRP Report 88; Transportation Research Board: Washington, DC, USA, 2003. [Google Scholar]
- Welch, T.F. Equity in transport: The distribution of transit access and connectivity among affordable housing units. Transp. Policy 2013, 30, 283–293. [Google Scholar] [CrossRef]
- Welch, T.F.; Mishra, S. A measure of equity for public transit connectivity. J. Transp. Geogr. 2013, 33, 29–41. [Google Scholar] [CrossRef]
- Karner, A. Assessing public transit service equity using route-level accessibility measures and public data. J. Transp. Geogr. 2018, 67, 24–32. [Google Scholar] [CrossRef]
- Ben-Elia, E.; Benenson, I. A spatially-explicit method for analyzing the equity of transit commuters’ accessibility. Transp. Res. Part A: Policy Pr. 2019, 120, 31–42. [Google Scholar] [CrossRef]
- Wu, J.; Liu, M.; Sun, H.; Li, T.; Gao, Z.; Wang, D.Z.W. Equity-based timetable synchronization optimization in urban subway network. Transp. Res. Part C: Emerg. Technol. 2015, 51, 1–18. [Google Scholar] [CrossRef]
- Sheffi, Y. Urban Transportation Networks; Prentice-Hall, INC.: Englewood Cliffs, NJ, USA, 1985. [Google Scholar]
- Spiess, H.; Florian, M. Optimal strategies: A new assignment model for transit networks. Transp. Res. Part B: Methodol. 1989, 23, 83–102. [Google Scholar] [CrossRef]
- Dijkstra, E.W. A note on two problems in connexion with graphs. Numer. Math. 1959, 1, 269–271. [Google Scholar] [CrossRef]
- Pattnaik, S.B.; Mohan, S.; Tom, V.M. Urban Bus Transit Route Network Design Using Genetic Algorithm. J. Transp. Eng. 1998, 124, 368–375. [Google Scholar] [CrossRef]
- Bielli, M.; Caramia, M.; Carotenuto, P. Genetic algorithms in bus network optimization. Transp. Res. Part C: Emerg. Technol. 2002, 10, 19–34. [Google Scholar] [CrossRef]
- Tom, V.M.; Mohan, S. Transit Route Network Design Using Frequency Coded Genetic Algorithm. J. Transp. Eng. 2003, 129, 186–195. [Google Scholar] [CrossRef]
- Ngamchai, S.; Lovell, D.J. Optimal Time Transfer in Bus Transit Route Network Design Using a Genetic Algorithm. J. Transp. Eng. 2003, 129, 510–521. [Google Scholar] [CrossRef]
- Szeto, W.; Wu, Y. A simultaneous bus route design and frequency setting problem for Tin Shui Wai, Hong Kong. Eur. J. Oper. Res. 2011, 209, 141–155. [Google Scholar] [CrossRef]
- Arbex, R.O.; Da Cunha, C.B. Efficient transit network design and frequencies setting multi-objective optimization by alternating objective genetic algorithm. Transp. Res. Part B: Methodol. 2015, 81, 355–376. [Google Scholar] [CrossRef]
- Kim, H.-S.; Kim, D.-K.; Kho, S.-Y.; Lee, Y.-G. Integrated Decision Model of Mode, Line, and Frequency for a New Transit Line to Improve the Performance of the Transportation Network. KSCE J. Civ. Eng. 2016, 20, 393–400. [Google Scholar] [CrossRef]
- Kim, G.S.; Woo, J.W.; Lee, S.H.; Kim, J.Y.; Yang, I.S.; Yu, J.K.; Kim, S.H.; Kim, K.M.; Baek, S.H. Feasibility Manual of Korea; Korea Development Institute: Seoul, Korea, 2008. [Google Scholar]
- INRO. EMME Prompt Manual Release 3.3; INRO Consultants INC.: Montreal, QC, Canada, 2010. [Google Scholar]
© 2019 by the authors. Licensee MDPI, Basel, Switzerland. This article is an open access article distributed under the terms and conditions of the Creative Commons Attribution (CC BY) license (http://creativecommons.org/licenses/by/4.0/).