Article

Life Cycle Assessment of Seabass (Dicentrarchus labrax) Produced in Offshore Fish Farms: Variability and Multiple Regression Analysis

by
Benjamín García García
1,*,
Caridad Rosique Jiménez
2,
Felipe Aguado-Giménez
3 and
José García García
1
1
IMIDA, Calle Mayor s/n, 30150 Alberca de las Torres, Murcia, Spain
2
Campus de Espinardo, Edificio C, Universidad de Murcia, 30100 Espinardo, Murcia, Spain
3
IMIDA, Estación de Acuicultura Marina, Puerto de San Pedro del Pinatar, 30740 San Pedro del Pinatar, Murcia, Spain
*
Author to whom correspondence should be addressed.
Sustainability 2019, 11(13), 3523; https://doi.org/10.3390/su11133523
Submission received: 4 June 2019 / Revised: 20 June 2019 / Accepted: 23 June 2019 / Published: 27 June 2019
(This article belongs to the Section Sustainable Agriculture)

Abstract

:
Equations were developed through multiple regression analysis (MRA) to explain the variability of potential environmental impacts (PEIs) estimated by life cycle assessment (LCA). The case studied refers to the production of seabass in basic offshore fish farms. Contribution analysis showed that the components of the system which most influence the potential environmental impacts are the feed (54% of the overall impact) and the fuel consumed by vessels operating in the farm (23%). Feed and fuel varied widely from one fish farm to another due to different factors, such as the efficiency of the feeding system used in each of them, or the distance from the harbor to the farm. Therefore, a number of scenarios (13) were simulated with different values of both factors and the results of the PEI were fitted by MRA to the model: PEI = a + b × Feed + c × Fuel. For all the PEIs, the regression coefficients were significant (p < 0.05) and R2 was 1. These equations allow us to estimate simply and quickly very different scenarios that reflect the reality of different farms at the present time, but also future scenarios based on the implementation of technologies that will decrease both feed and fuel consumption.

1. Introduction

Life cycle assessment (LCA) is a scientific method of environmental assessment that aims to quantitatively analyze the environmental burden of products, from resource extraction and energy generation, through the production chain up to disposal [1]. LCA has been applied in intensive fish aquaculture systems both in land-based tanks [2,3,4,5,6,7] and sea cages [3,5,8,9,10]. In general, these studies concluded that feed is the system component that most contributes to potential environmental impacts in fish farms, except eutrophication [2,5,7,8,9,10,11]. However, the raw material used to manufacture the feed has a greater impact than the manufacturing process itself [7,8,12]. Eutrophication, for its part, is mainly due to emissions of N and P due to the metabolism of the feed [2,3,4,8,9,13], and is mainly local.
In fish cage production, the amount of feed provided to produce a unit of biomass (FCR) varies between species and among the different aquaculture systems used [8,14]. Even within one species and system, it may vary from fish farm to fish farm, which is why, when a sensitivity analysis is carried out [1], it is usually applied in relation to this system component, with one or two alternative scenarios proposed [8,11,15]. The fuel consumed by vessels operating in Mediterranean offshore fish farms is also considered a component of the system with great repercussion on impacts [8]. These two components, feed and fuel, can vary widely from one fish farm to another due to various factors, such as the feeding efficiency of each system, or the distance from the harbor to the fish farm. Therefore, both are responsible for a great part of the variability in the results of an LCA.
Multiple regression analysis (MRA) is a useful technique for developing predictive equations that estimate a dependent variable based on two or more independent variables. MRA, for instance, has been used in aquaculture to explain metabolic variables, such as oxygen consumption [16,17] or the production of ammonia [18]; crop factors, such as growth and feeding rates [19,20,21,22,23,24]; or loss of feed by mastication of seabream on fish farms [25]. MRA has also been very useful for the development of econometric equations in different aquaculture systems [26,27,28]. In these studies: (1) A fish farm model is established with the information available; (2) economic-financial analysis is performed, determining the most relevant production cost and assessing viability indexes (net present value) and profitability (initial rate of return); (3) in a sensitivity analysis, different scenarios are simulated according to the sale price of the product and the production costs that have the greatest impact on the viability/profitability indexes; and (4) the data thus estimated are fitted to an MRA model to obtain the econometric equations.
Similarly, the variability of estimated impacts in an LCA on fish aquaculture could be explained by equations developed by the MRA. In this context, a seabass (Dicentrarchus labrax) offshore fish farm may represent an interesting case study. Total aquaculture production of seabass in Europe and the rest of the Mediterranean area in 2016 was 176,956 t [29]. The fish are farmed in 19 countries, the main producers being Turkey (40.9%), Greece (26.0%), and Spain (13.2%). Production in Spain in the last decade (2008–2017) has risen from 9840 t to 20,447 t with an annual growth rate of 1308 t·year−1. In Spain, the ongrowing of seabass, as well as of seabream, is mainly carried out in offshore cages [29]. Production along the coast of the region of Murcia (SE Spain) represents 30% of the Spanish total. The installations are all very similar, with slight variations from one farm to another, both in terms of the type of cage and the mooring system used, as well as the process of production [8].
The objectives of this study were to: (1) Define a basic offshore fish farm (BOFF) for the production of seabass in the Spanish Mediterranean; (2) perform a life cycle assessment (LCA) to identify the components of the system that contribute most to potential environmental impacts (PEIs); (3) estimate the PEIs for different scenarios based on the components of the system identified by the LCA; and (4) fit the estimated data to a multiple regression model to obtain the equation that explains the variability of the PEIs.

2. Materials and Methods

LCA is a methodology, normalized by the standard UNE-ISO [1,30], which seeks to identify, quantify, and characterize different potential environmental impacts associated with each stage of the life cycle of a product. It is a useful environmental tool for establishing alternative solutions aimed at reducing potential impacts and the search for sustainable development. The method consists of four interrelated phases: The definition of the goal and scope; life cycle inventory analysis; impact analysis; and interpretation of the results.

2.1. Description of the System

The characteristics of the basic offshore fish farm (BOFF) would be similar to those defined for a previous study on the production of seabream [8], with some differences related to the specifics of seabass production. We assumed that farming facilities are located about 5 km from the harbor, at a depth of 40 m, being exposed to heavy storms where the predominant winds come from the NE and SW. Also, 80% of the waves would have a significant height (Hs) of 0.4 to 1.2 m, assuming a very low probability (<0.1%) that there were waves with a Hs higher than 10 m. Simulations for the LCA were made for a production of 1000 t·year−1 of seabass of a typical commercial size (500 g). Ongrowing would begin with fingerlings of 15 g in weight, which had previously been raised in tanks on shore, in installations (including pumping water and injecting oxygen) that may be far from the offshore cages. The feed conversion ratio was assumed to be 1.5 for this nursing phase. Transport from the nursery facilities to ongrowing cages would be by lorry and boat. On the offshore fish farm the 15 g fingerlings would be raised in cages of a 20 m diameter, reaching the commercial size after 20 months. The installation would have 22 cages, each of which would produce about 90 t. The fish would be fed commercial feed, using cannons from vessels traveling from to cage to cage. It was assumed that the BOFF does not have a centralized feed distribution system or automatic distribution control.

2.2. Goal and Scope

The goal of the LCA was to characterize the potential environmental impacts of a BOFF for the production of seabass, and to identify the components of the system that contribute most to them. After the main hotspots were identified, the raw materials and processes that will probably minimize the impact were selected. The results therefore are mainly destined not only for fish aquaculture companies, but also manufacturers of feed and infrastructures, as well as for public administrations with responsibilities for the environment.
The different subsystems that can be established for the LCA of fish production (Figure 1) are based on the value chain of a product [8]. These subsystems are: (1) Production, which includes the phases of hatchery (larval culture) and pre-ongrowing to obtain fingerlings, and ongrowing of the same to reach commercial size; (2) marketing, which includes classification and packaging, distribution and sale, and consumption; and (3) manufacture of the feed for the production phase. This study deals with subsystem (1) and (3): Production and manufacture of animal feed. However, in subsystem (1), the hatchery phase could not be included because the necessary information was not available.
The production of juveniles and their ongrowing to reach a commercial size occur in different facilities that are normally geographically distant and, in general, are carried out by different companies. Therefore, two functional units were established as 1 kg of juveniles already located in the ongrowing fish farm, considering this the first product-system, and 1 ton of seabass of commercial size at the fish farm gate. This LCA was based on a methodological attributional approach and can be regarded as a “cradle to fish farm-gate” assessment. As the production of seabass was treated as a monofunctional system, no allocation procedure was applied.
System boundaries include inputs and outputs that were grouped into the following components and subcomponents (Figure 1): (1) Fingerlings, for which the feed is evaluated (raw materials and manufacturing process), growth (emission of N and P due to the metabolism of the feed, electricity, oxygen supply, and transportation from the pre-ongrowing plant to the offshore fish farm; (2) installation, which includes the cages (floating ring and net) and mooring system; (3) feed, which includes raw materials and their manufacture; (4) growth, which also gives rise to emissions of N and P; and (5) fuel consumed by vessels operating in the fish farm and their emissions into the atmosphere.
The LCA was performed with SimaPro 8.4 software [31], and CML-baseline [32] was the method used for the environmental characterization (see Section 2.4). This software integrates the Ecoinvent 3.4 and Agri-footprint 4.0 databases that were used for the background data. The latter was only used for the raw materials used in the production of feed. Most of the data were obtained from Ecoinvent, due to the quality of the data it provides and because it has been used in many LCAs for aquaculture products [33]. The data that were unavailable in this database were taken from the specialist literature (see Section 2.3). In the feed production stage (subsystem 3), mass allocation of environmental burdens between co-products was used [7,8,12,34,35]. The contribution analysis was used to identify the hotspots related with PEIs. A sensitivity analysis was used to estimate the PEI values for different scenarios, which were based on the components of the system identified by the contribution analysis as having the greatest effect on the PEIs. The data obtained were fitted by multiple regression analysis to obtain equations that explained the variability of the PEIs.

2.3. Data Collection and Life Cycle Inventory

The foreground data were collected from confidential surveys and visits to relevant companies located mainly on the coast of the province of Murcia (autonomous community of the region of Murcia, SE Spain). We visited suppliers of infrastructures for this type of facility and feed manufactures and also used information available from the Fisheries and Aquaculture Service of the Region of Murcia, and data obtained from the specialized literature [8,25,36,37,38,39,40].

2.3.1. Pre-Ongrowing

The fingerlings are produced in facilities on land with pumped seawater and injected oxygen. The evaluated subsystem runs from when the fingerlings are 0.5 g in weight until they reach 15 g.

2.3.1.1. Fingerlings Feed

The feed at this stage of the production cycle is characterized by being rich in fish meal (49%) in order to meet the high nutritional requirements of juveniles. A standard feed for this phase was formulated based on the information available from commercial companies, as well as confidential information provided by the same (Table 1).
Agri-footprint 4.0 (mass allocation) was used for the background data of raw materials, except fishmeal and fish oil [41], amino acids [42], and monocalcium phosphate (Ecoinvent 3.4). The premix minerals and vitamins are not available in the databases, for which reason they have not been considered since they were only present at 1%.
Data for the raw materials include the farming processes, fishing when applicable, transformation, and transport. In the case of raw materials of American origin, trans-oceanic transport was included. The feed manufacturing process was been taken into account [7] and transport from the manufacturer in central Spain to the facilities on the coast (500 km).

2.3.1.2. Electricity and Oxygen

To estimate the electric energy consumed in the pumping of water to the culture tanks, as well as the oxygen supplied, the following were taken into consideration: Oxygen saturation in the tank water input is 100% (OSI); the water is oversaturated to 180% by injection of oxygen (OOS); oxygen saturation at the tank water output is 50% (OSO). Under these conditions, the specific water flow (SWF) and the oxygen supply (OS) were estimated from the specific oxygen consumption (SOC) model for seabass fingerlings [38] and as a function of body weight (BW):
SOC (mg O2·kg−1 h−1) = 1.77 × BW − 0.608,
SWF (L·kg−1·s−1) = (OOS − OSO)/SOC,
OS (mg O2·L−1) = OOS − OSI.
To estimate the electricity consumption, the following formula [44] was used:
Q (kw·h) = 0.0098 × D × H × WF/R.
  • D: density of the liquid (kg·L−1), in this case seawater (1.027 kg·L−1).
  • H: Manometric height (m). A value of 10 m was considered.
  • R: Pump performance, which can vary between 0.65 and 0.75. A value of 0.7 was assumed.
  • WF: Water flow (L·s−1).
The different parameters were estimated for different body weights of the fingerlings, and from these the average value of the whole pre-ongrowing period was calculated (Table 2). The OS and Q values were multiplied by the culture time, thus obtaining the values of oxygen supply (OS) and electric energy for the production of 1 kg of fingerlings. The data of the oxygen production and electricity unitary processes were obtained from Ecoinvent.

2.3.2.3. Emissions of N and P

Growth represents the particulate (feces) and dissolved (excretion) emissions of N and P due to the metabolism of the feed (Table 3). Gross metabolic waste production was estimated using a nutritional approach based on the following equation: C = G + E + F, where C is the % in dry matter of N or P in the ingested food, G is the quantity of nutrients retained for growth, E are losses through excretion, and F are losses through feces [45,46,47,48,49,50,51]. The apparent digestibility coefficients used (Table 1) are those calculated for commercial feed seabass juveniles [43].

2.3.2.4. Transport

Fingerlings were provided by several companies located in different parts of the Spanish coast. Transportation of juveniles to the fish farms was by truck and boat (Table 3). Data from recent years provided by the Fisheries and Aquaculture Service in the Region of Murcia (2016 and 2017) shows that 66% of transport was by boat and 34% by truck.
When estimating the environmental impacts associated with the transport of fingerlings, it is not their biomass that must be considered, but the weight of the volume of sea water that contains them. The density of fingerlings (DF), whose average weight is 15 g, in the transport is 50 kg·m−3. Therefore, the transport weight (TW) in relation to the functional unit (1 kg of fingerlings), and taking into account the density of seawater (1.025 kg·L−1), was calculated as: TW = (1/DF) × 1.025 = 20.5 kg.
The distance between pre-ongrowing facilities and the basic offshore fish farm harbor was estimated at 260 km (driving time of 4 h). Similarly, the estimated distance travelled by the transport ship was 279 km in 19 h.
The liquid oxygen used in transportation was calculated in both cases (truck and boat) from the oxygen consumption equation for fingerlings of seabass [38] and transport time.

2.3.2. Facilities

The type of offshore installation used for the ongrowing of seabass is the same as that for gilthead seabream, as described in an earlier work [8]. Three subcomponents were analyzed: Floating ring, net, and mooring of the entire installation. However, as the production cycle of seabass is a little longer (20 months) than that of seabream (18 months), the impact of the different elements is also slightly higher. The data are shown in Table 4. The data concerning the unitary process (extraction of raw materials, processing, manufacturing, and transportation) are from Ecoinvent.

2.3.3. Feed

A standard feed was formulated for ongrowing (Table 1) based on the information available from fish feed producers, as well as confidential information from some of them. The FCR of 1.9 is based on the information gathered in confidential surveys.

2.3.4. Growth

Particulate (feces) and dissolved (excretion) emissions of N and P due to the metabolism of food were estimated in the same way as for the production of fingerlings (Section 2.3.2.3).

2.3.5. Fuel

The BOFF has four vessels: One inflatable boat (200 hp engine), one monohull boat (400 hp), one catamaran (2 × 100 hp), and another catamaran (2 × 310 hp). From the annual consumption provided by the companies, it was estimated that the fuel consumption for the production of 1 t of seabass (functional unit) is 511.3 kg of diesel and 1.4 kg of lubricant. We also estimated the emissions of the fuel consumed by vessels using fishing vessel emission factors [52].

2.4. Evaluation of the Impact of the Life Cycle

Inventory data were classified in order to characterize the potential environmental impacts through the software SimaPro 8.4. [31]. The methodology used was CML-IA baseline [32], a mid-point methodology that has been used in numerous LCAs for aquaculture products [3,7,8,9,10,11,53,54]. The impact categories used in this study were: Abiotic depletion (AD), abiotic depletion fossil fuels (ADFF), global warming (GW), ozone layer depletion (OLD), human toxicity (HT), fresh water aquatic ecotoxicity (FWAE), marine aquatic ecotoxicity (MAE), terrestrial ecotoxicity (TE), photochemical oxidation (PO), acidification (A), and eutrophication (E).

2.5. Interpretation of the Results

2.5.1. Uncertainty Analysis

A Monte Carlo uncertainty analysis, available in the SimaPro software [31], was applied. This performs a number of simulations of the calculation of each of the impact categories and estimated statistics (average, standard deviation, coefficient of variation, confidence intervals, and standard error of the mean). The simulations were generated on the basis of the uncertainty (geometric standard deviation) of the data of the unit processes contained in the Ecoinvent database (background data). In this way, there were 1000 simulations with a 95% confidence interval.

2.5.2. Contribution Analysis

The contribution analysis calculates the contribution of different factors (components of the system or unit processes) to each of the impact categories as a percentage. Global contribution is also calculated as the sum of the contributions of each component of the system to all impact categories divided by the number of impact categories [8].

2.5.3. Sensitivity Analysis and Multiple Regression

In order to explain the variability of the impact categories, equations were developed based on those components of the system that are most significant in terms of their contribution to impacts. For this, the sensitivity analysis was used to simulate a sufficient number of scenarios that allow the results to be fitted by means of multiple regression analysis (MRA) to the model:
PEI = a + b × SC1 + c × SC2 +...+ nSCn,
where PEI are the potential environmental impacts, SC the system components, and a, b, c, n, are coefficients determined by MRA.

3. Results

3.1. Uncertainty Analysis

The uncertainty analysis shows the reliability of the model for evaluating the potential environmental impacts of the basic offshore fish farm (Table 5). The total number of data (foreground and background data) were 11,968 (97% from Ecoinvent) of which 71% had uncertainty data. The Monte Carlo analysis evaluated 1000 scenarios with a confidence level of 95%. The coefficients of variation (%)—and consequently the confidence intervals—were generally low, especially for E (0.34%), GW (2.13%), A (3.19%), TE (3.43%), and PO (4.28%). Only OLD had a relatively high value (34.83%), which was also registered in the LCA of the offshore production of seabream [8] and which is due to the uncertainty data (Ecoinvent) of this potential environmental impact.

3.2. Contribution Analysis

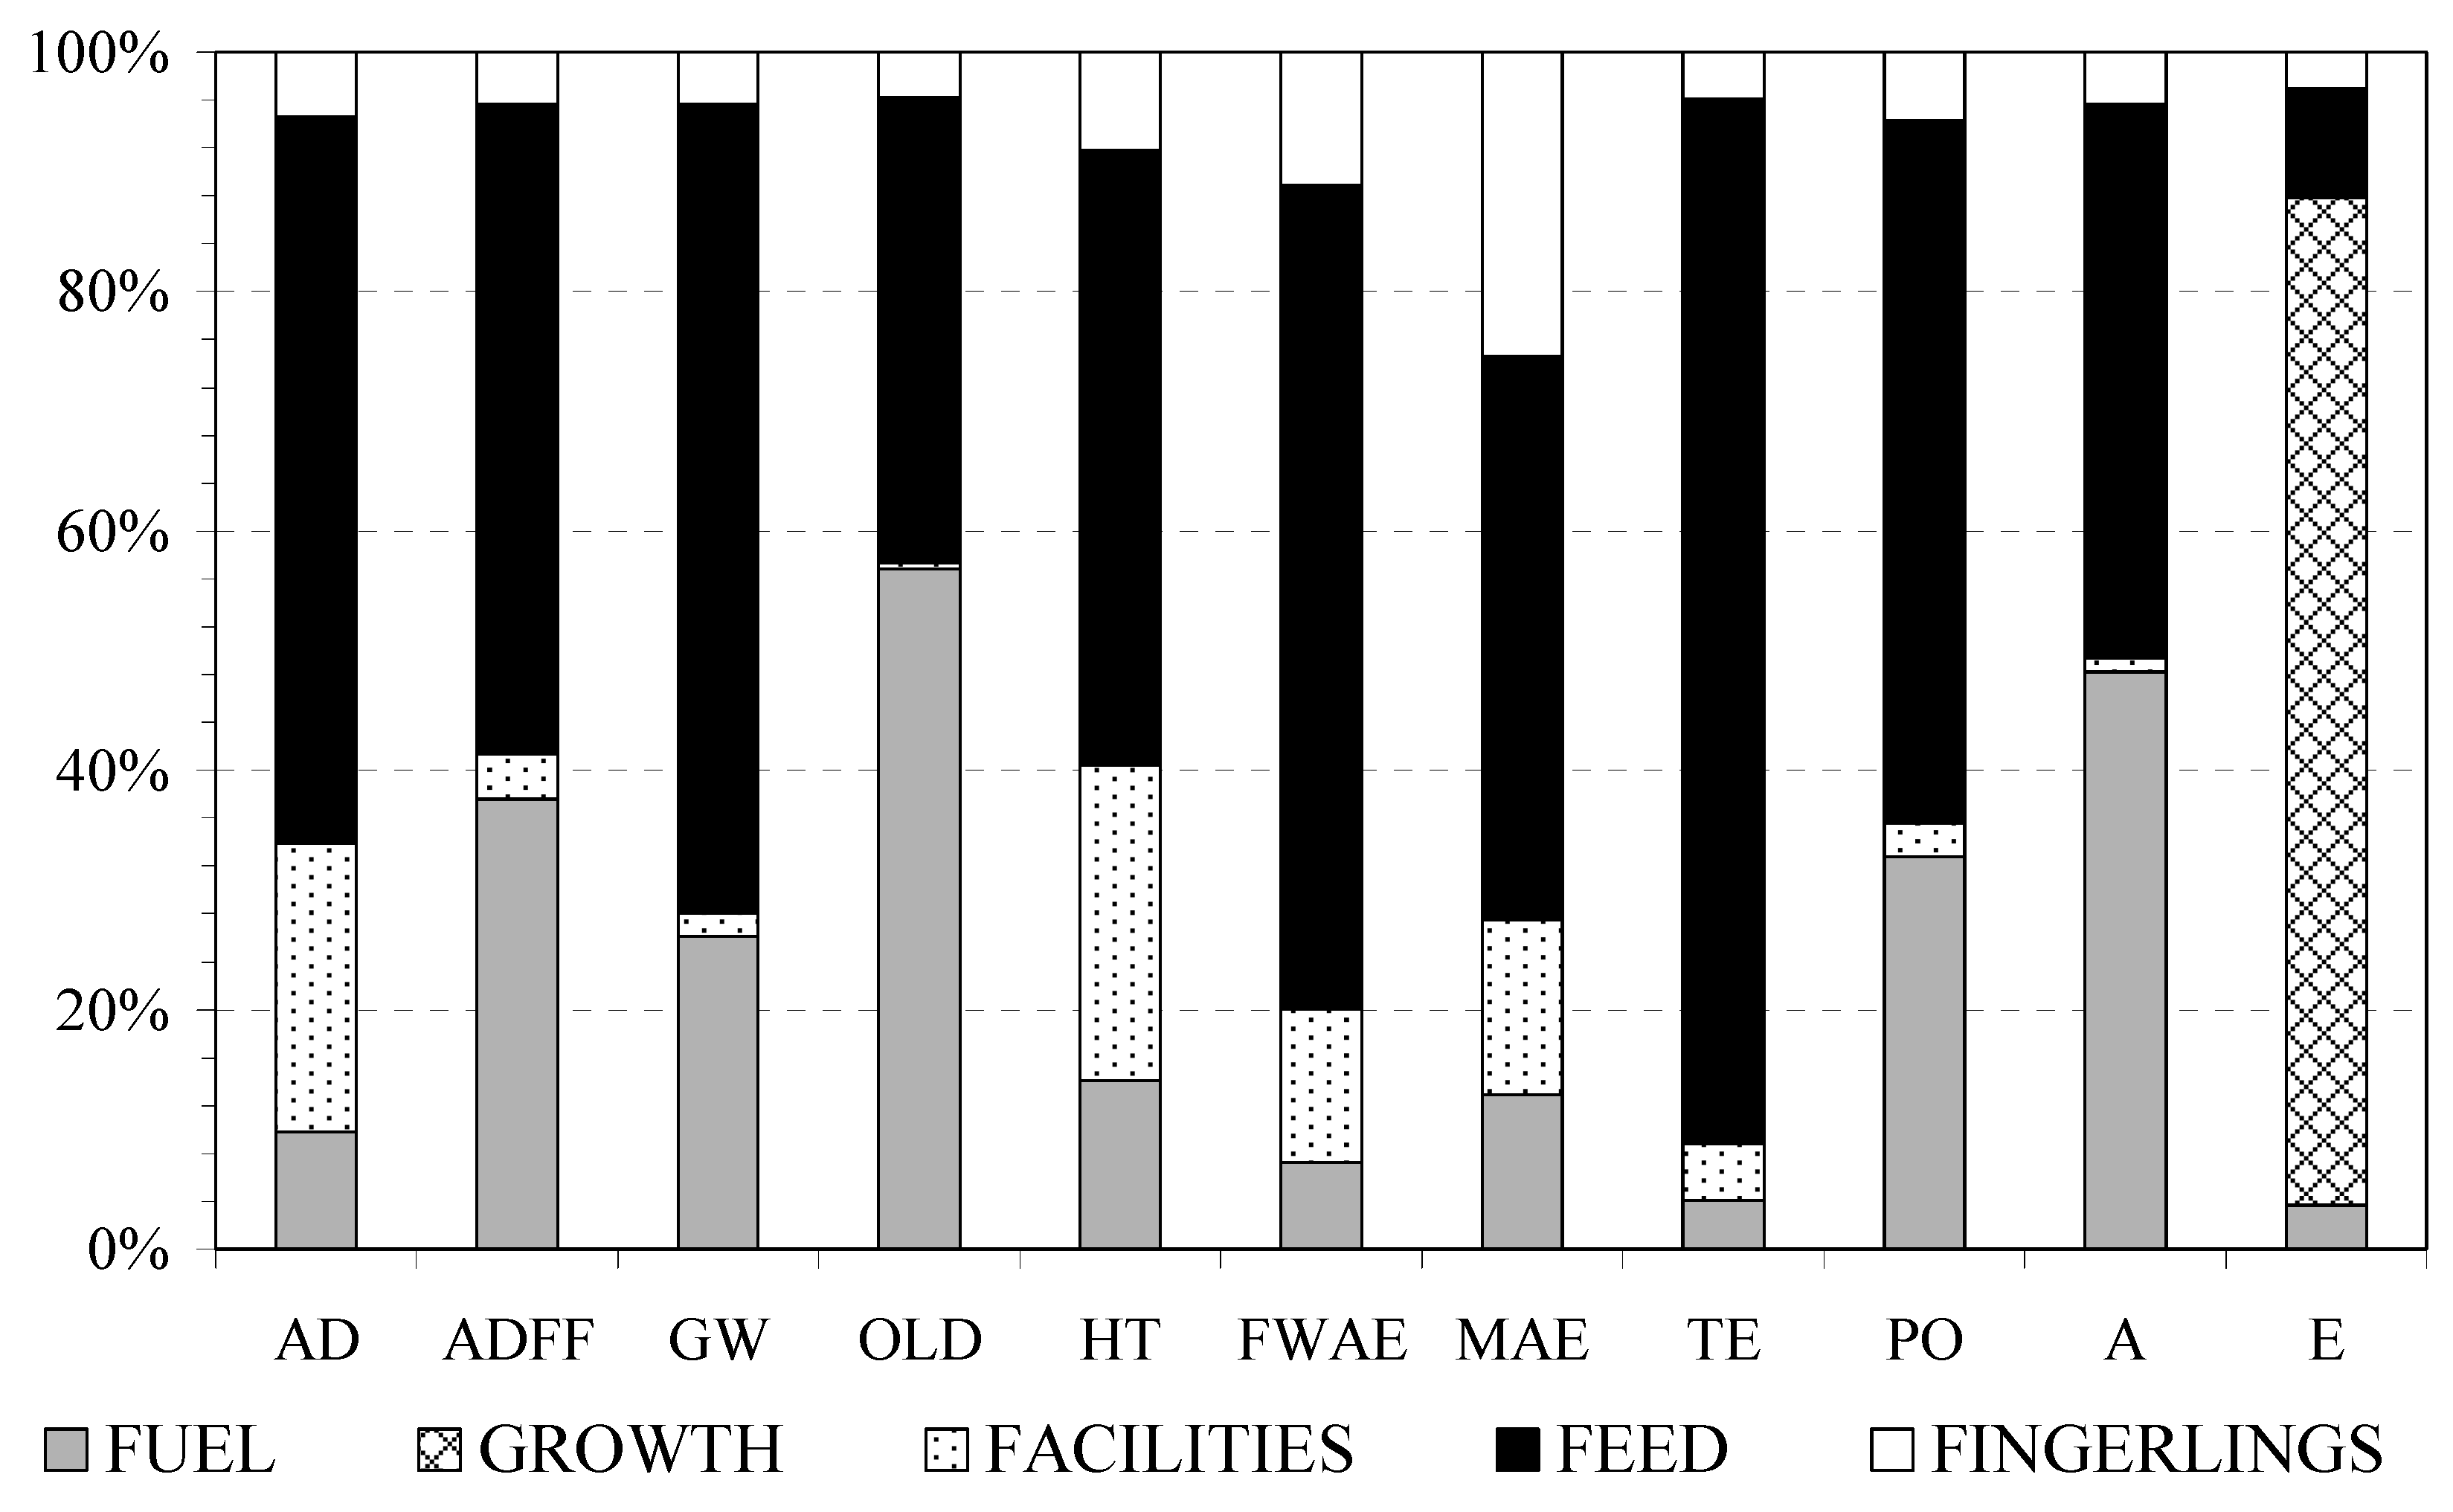
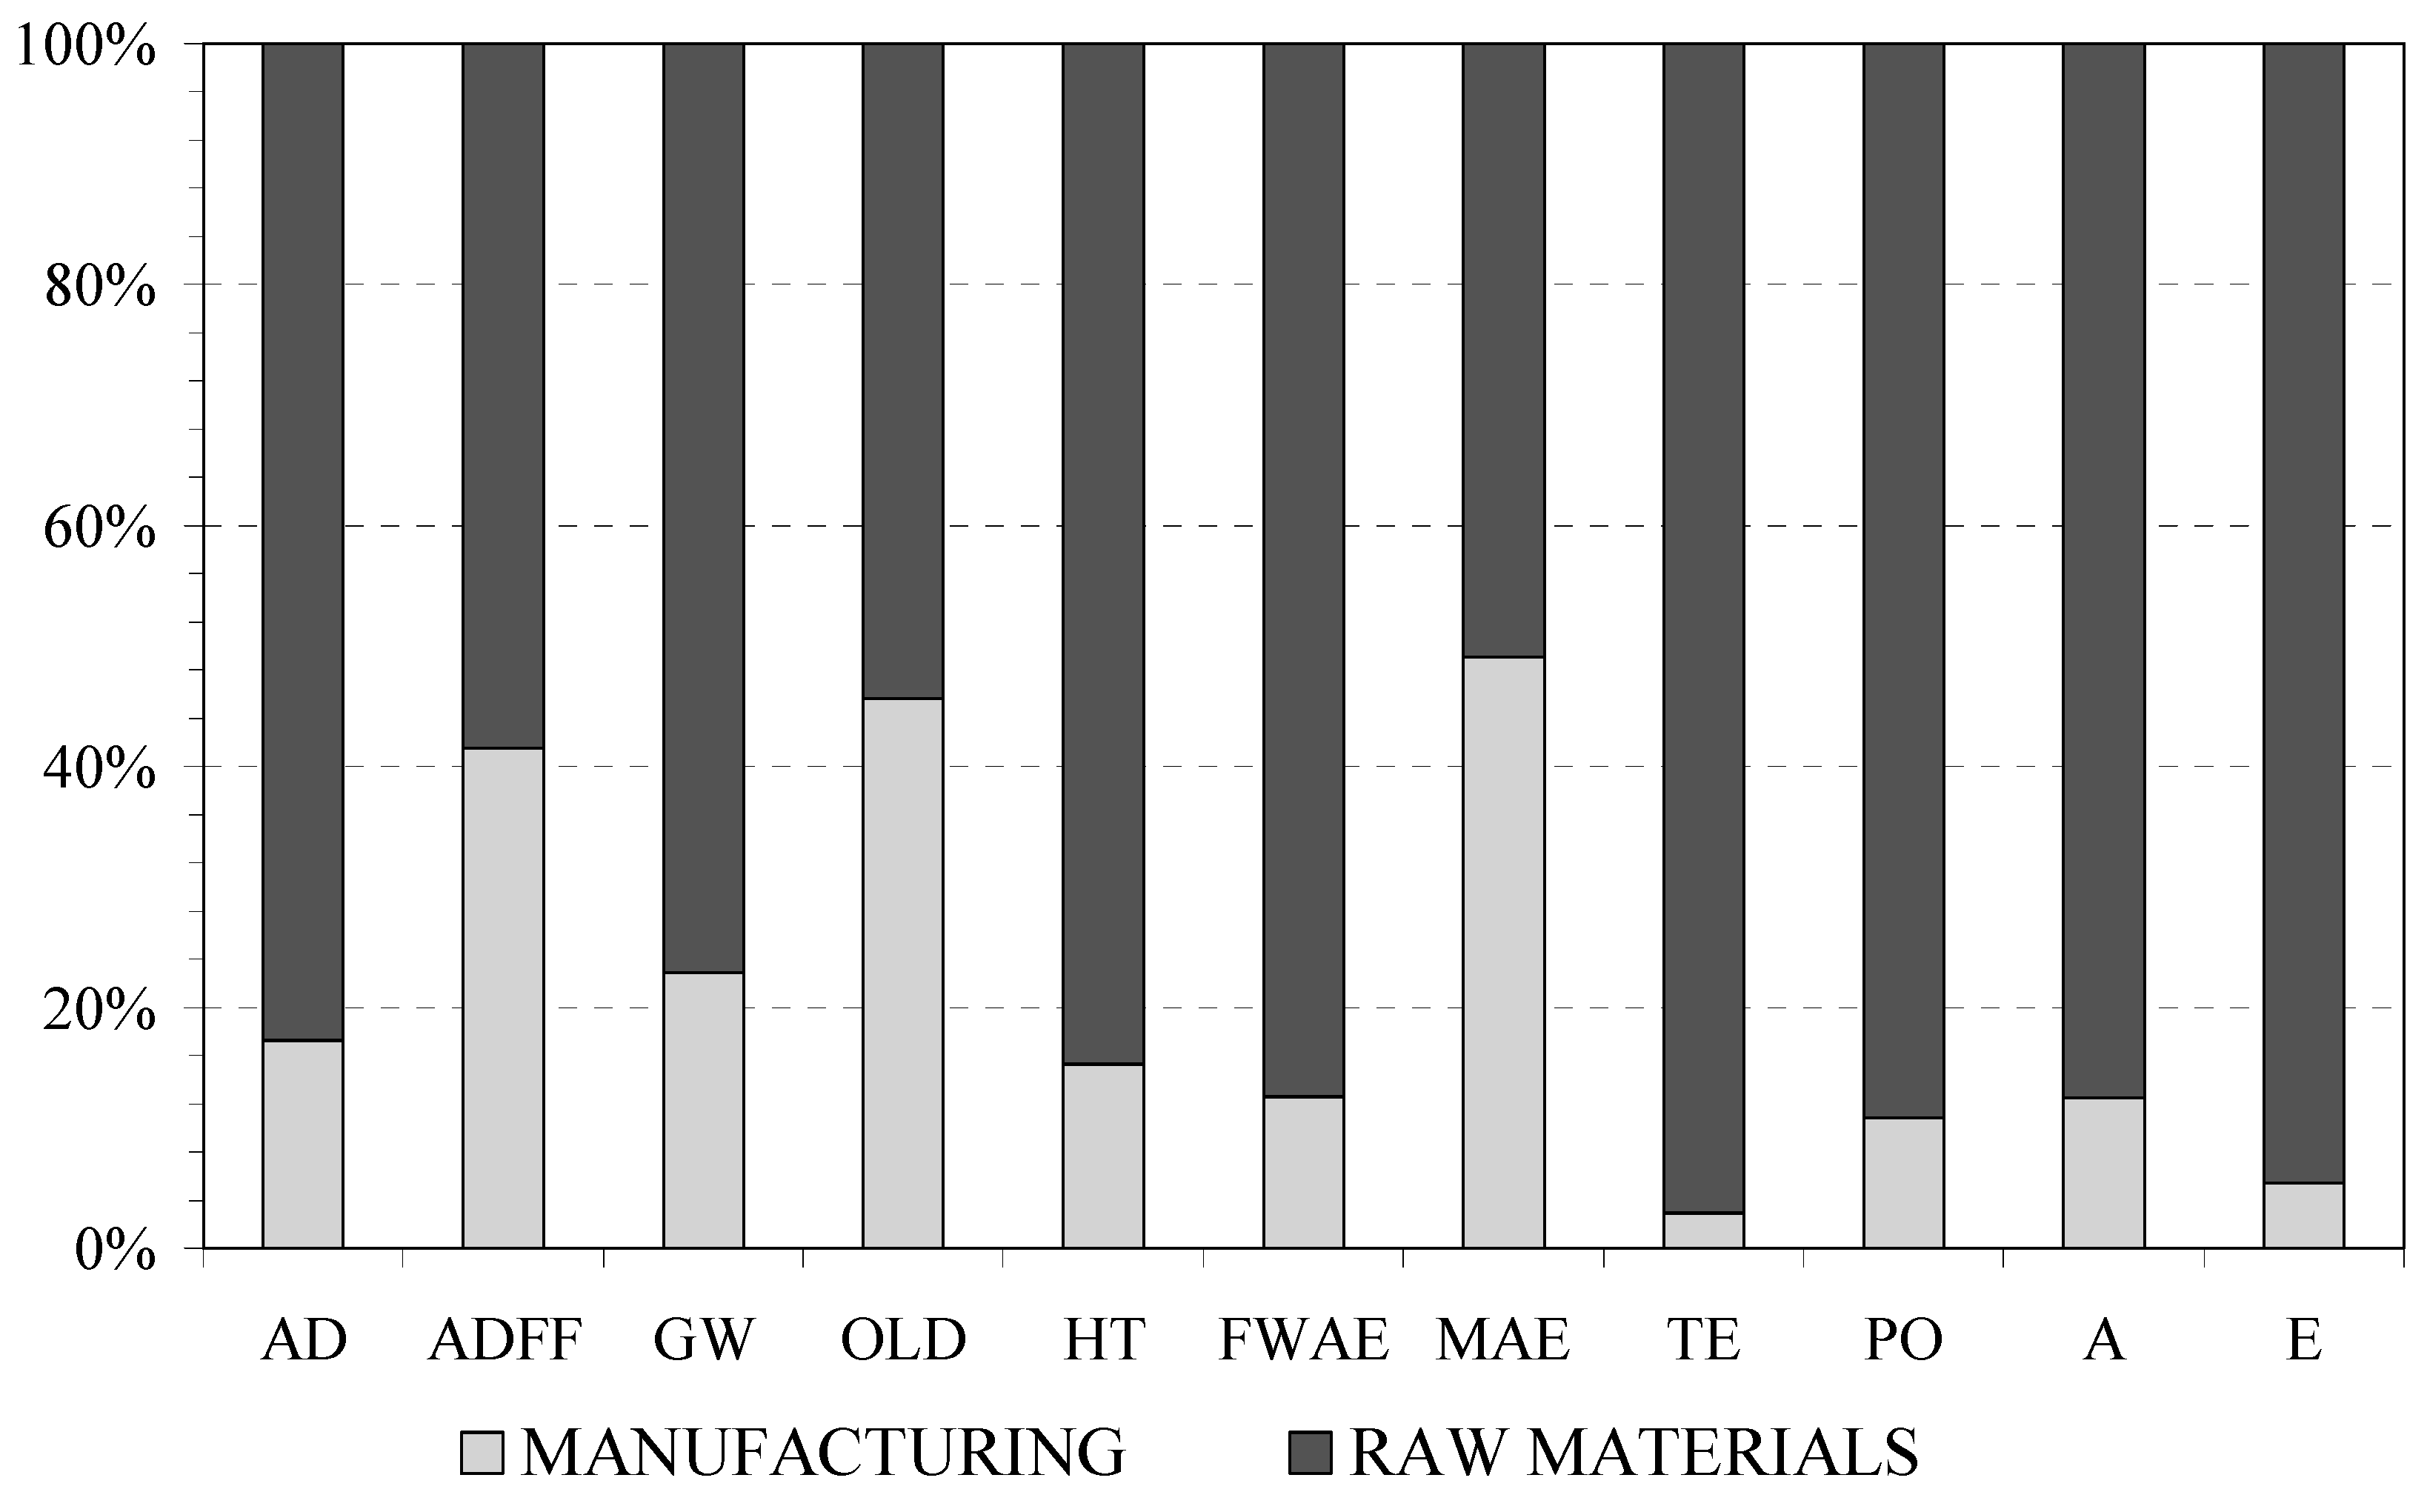
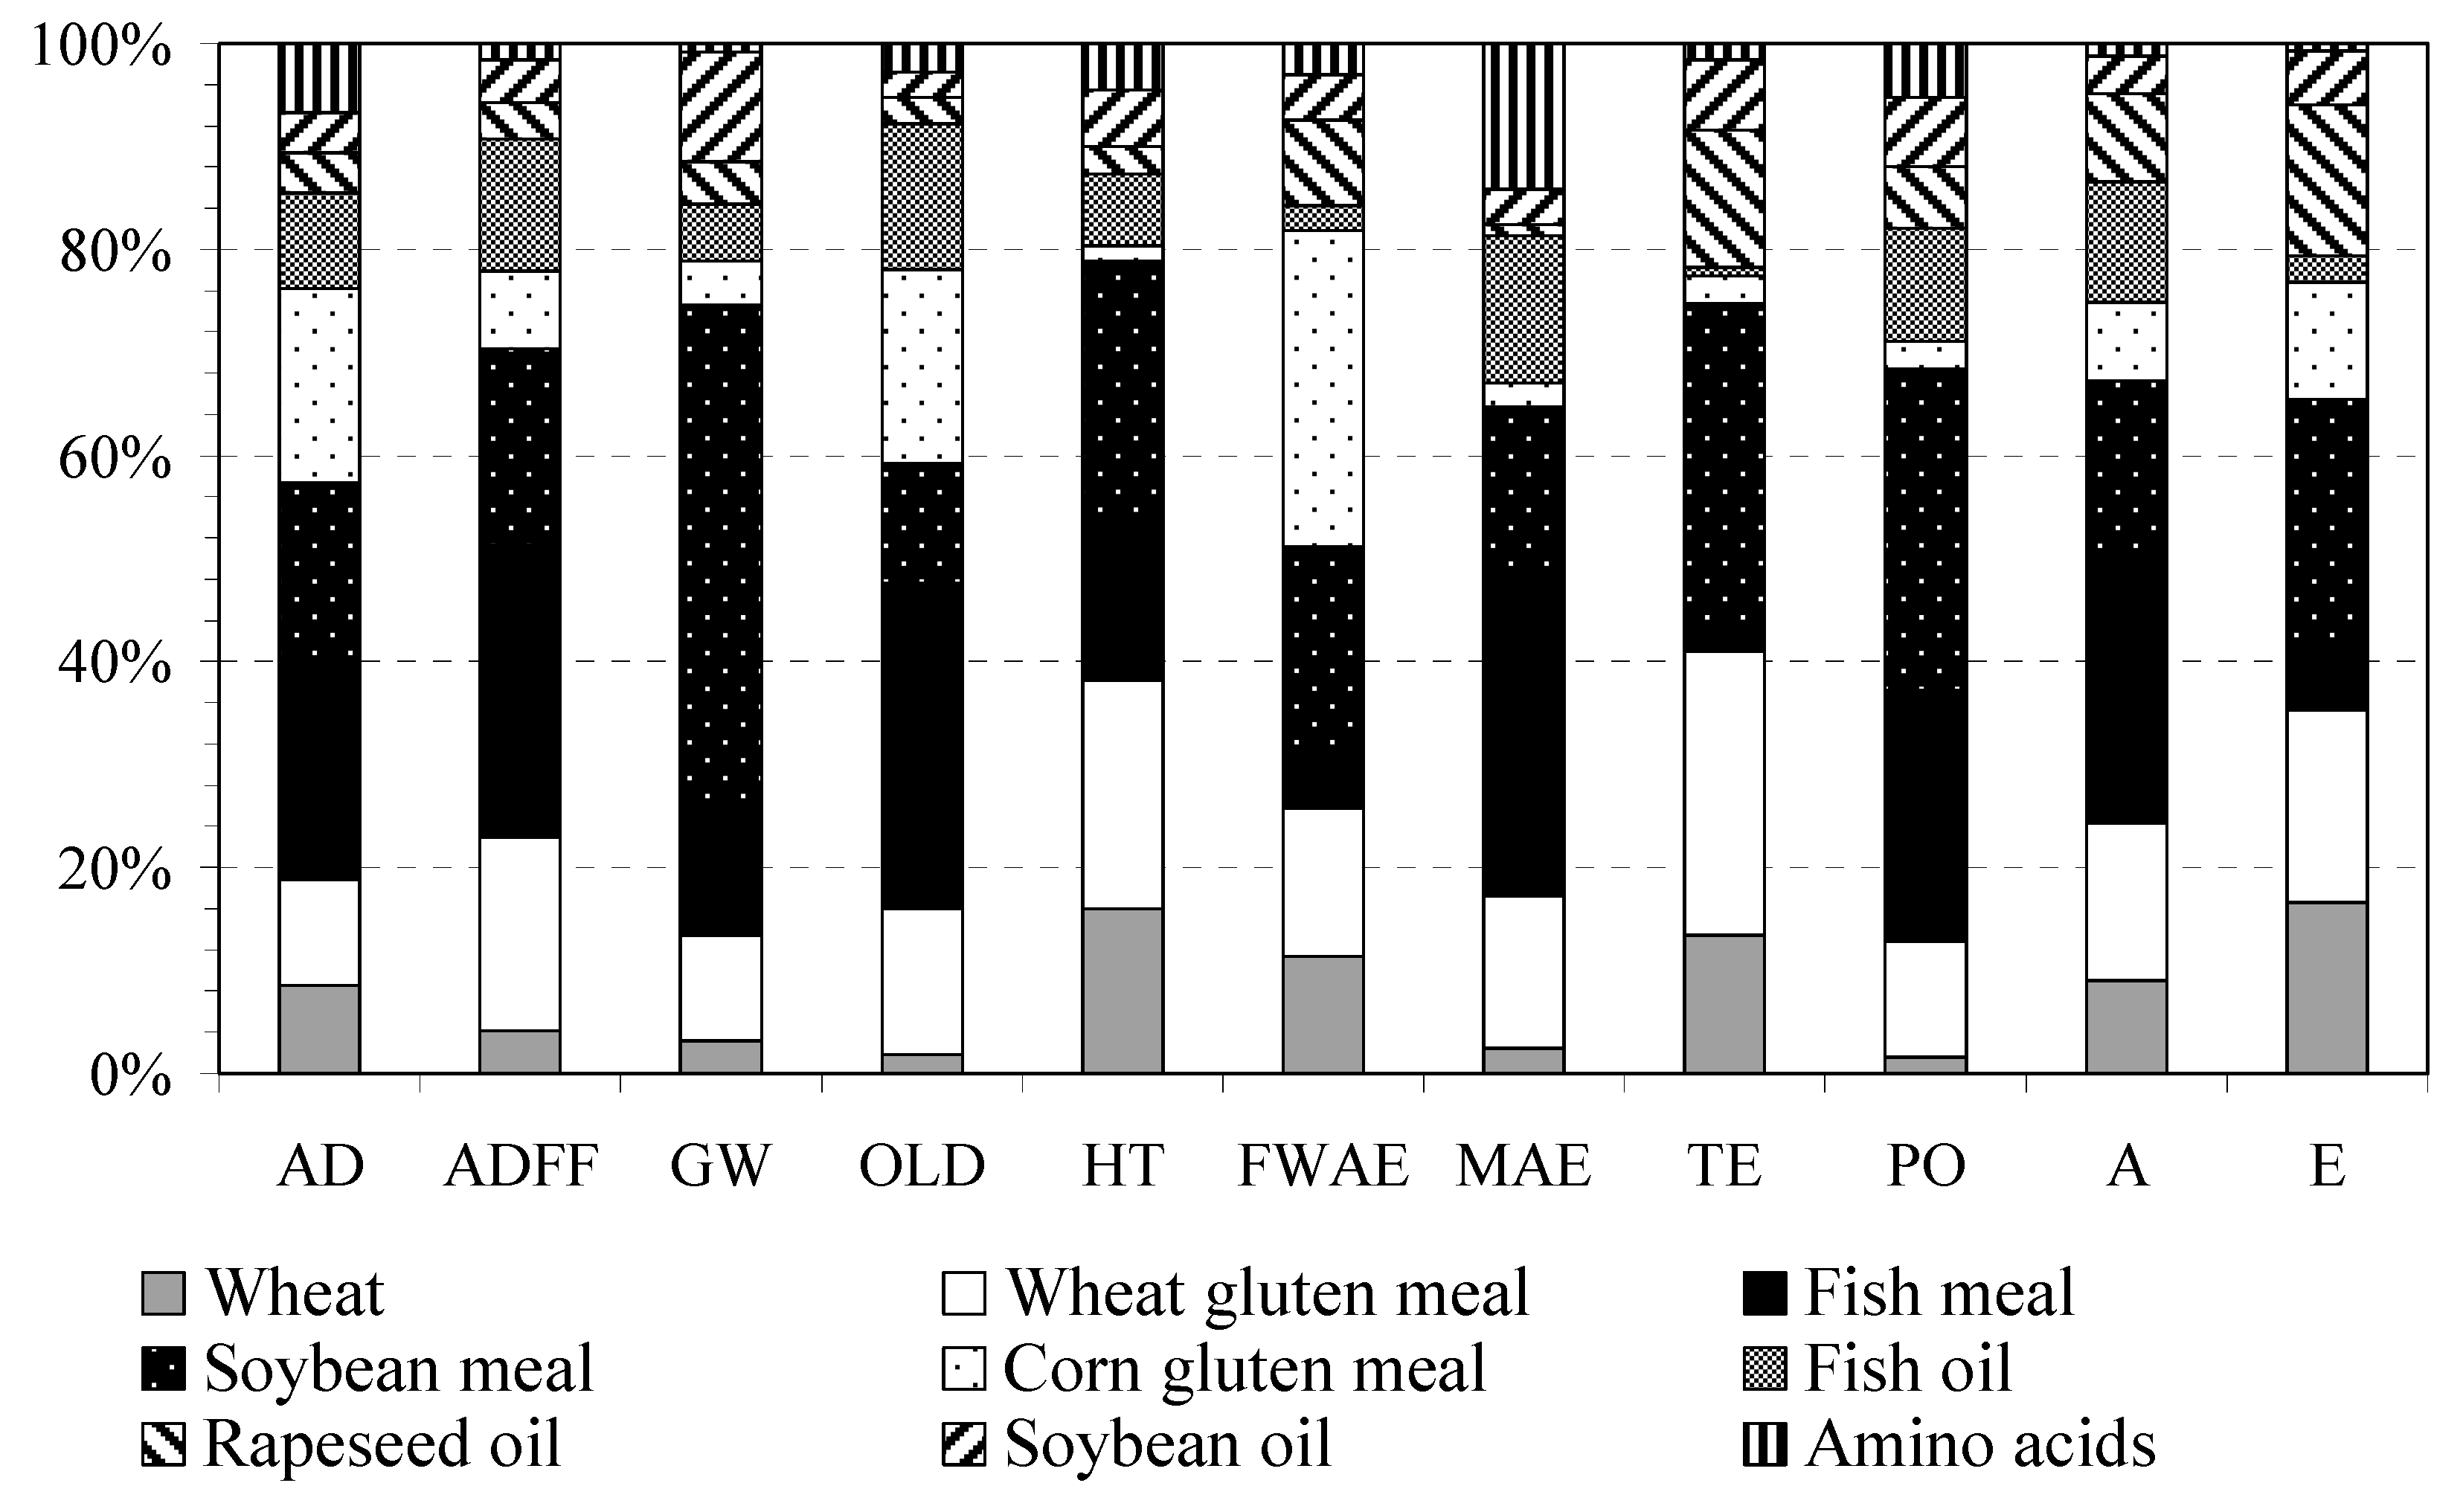
Feed was the component of the system that made the greatest overall contribution to environmental impacts (Figure 2), accounting for 54%. Of this, the raw materials represent 79% (Figure 3) and manufacturing 21%. Of the raw materials (Figure 4), those making the greatest contribution were soybean meal (23%), fish meal (18%), and wheat gluten (16%). The fuel consumed by the vessels of the farm also made a significant overall contribution of 23%. The overall contribution of the installation (8%), growth (8%), and juveniles (7%) was relatively low. However, the following should be highlighted:
The installation contributes 27% to HT primarily because of the metallic elements of the mooring; and there is also a significant contribution to AD (21%).
Growth only contributes to E, but it alone represents 84% of this impact.
Fingerlings contribute significantly to MAE (23%). This value is due to the electrical energy needed for pumping water primarily, but also to the electricity consumed in the production of liquid oxygen.
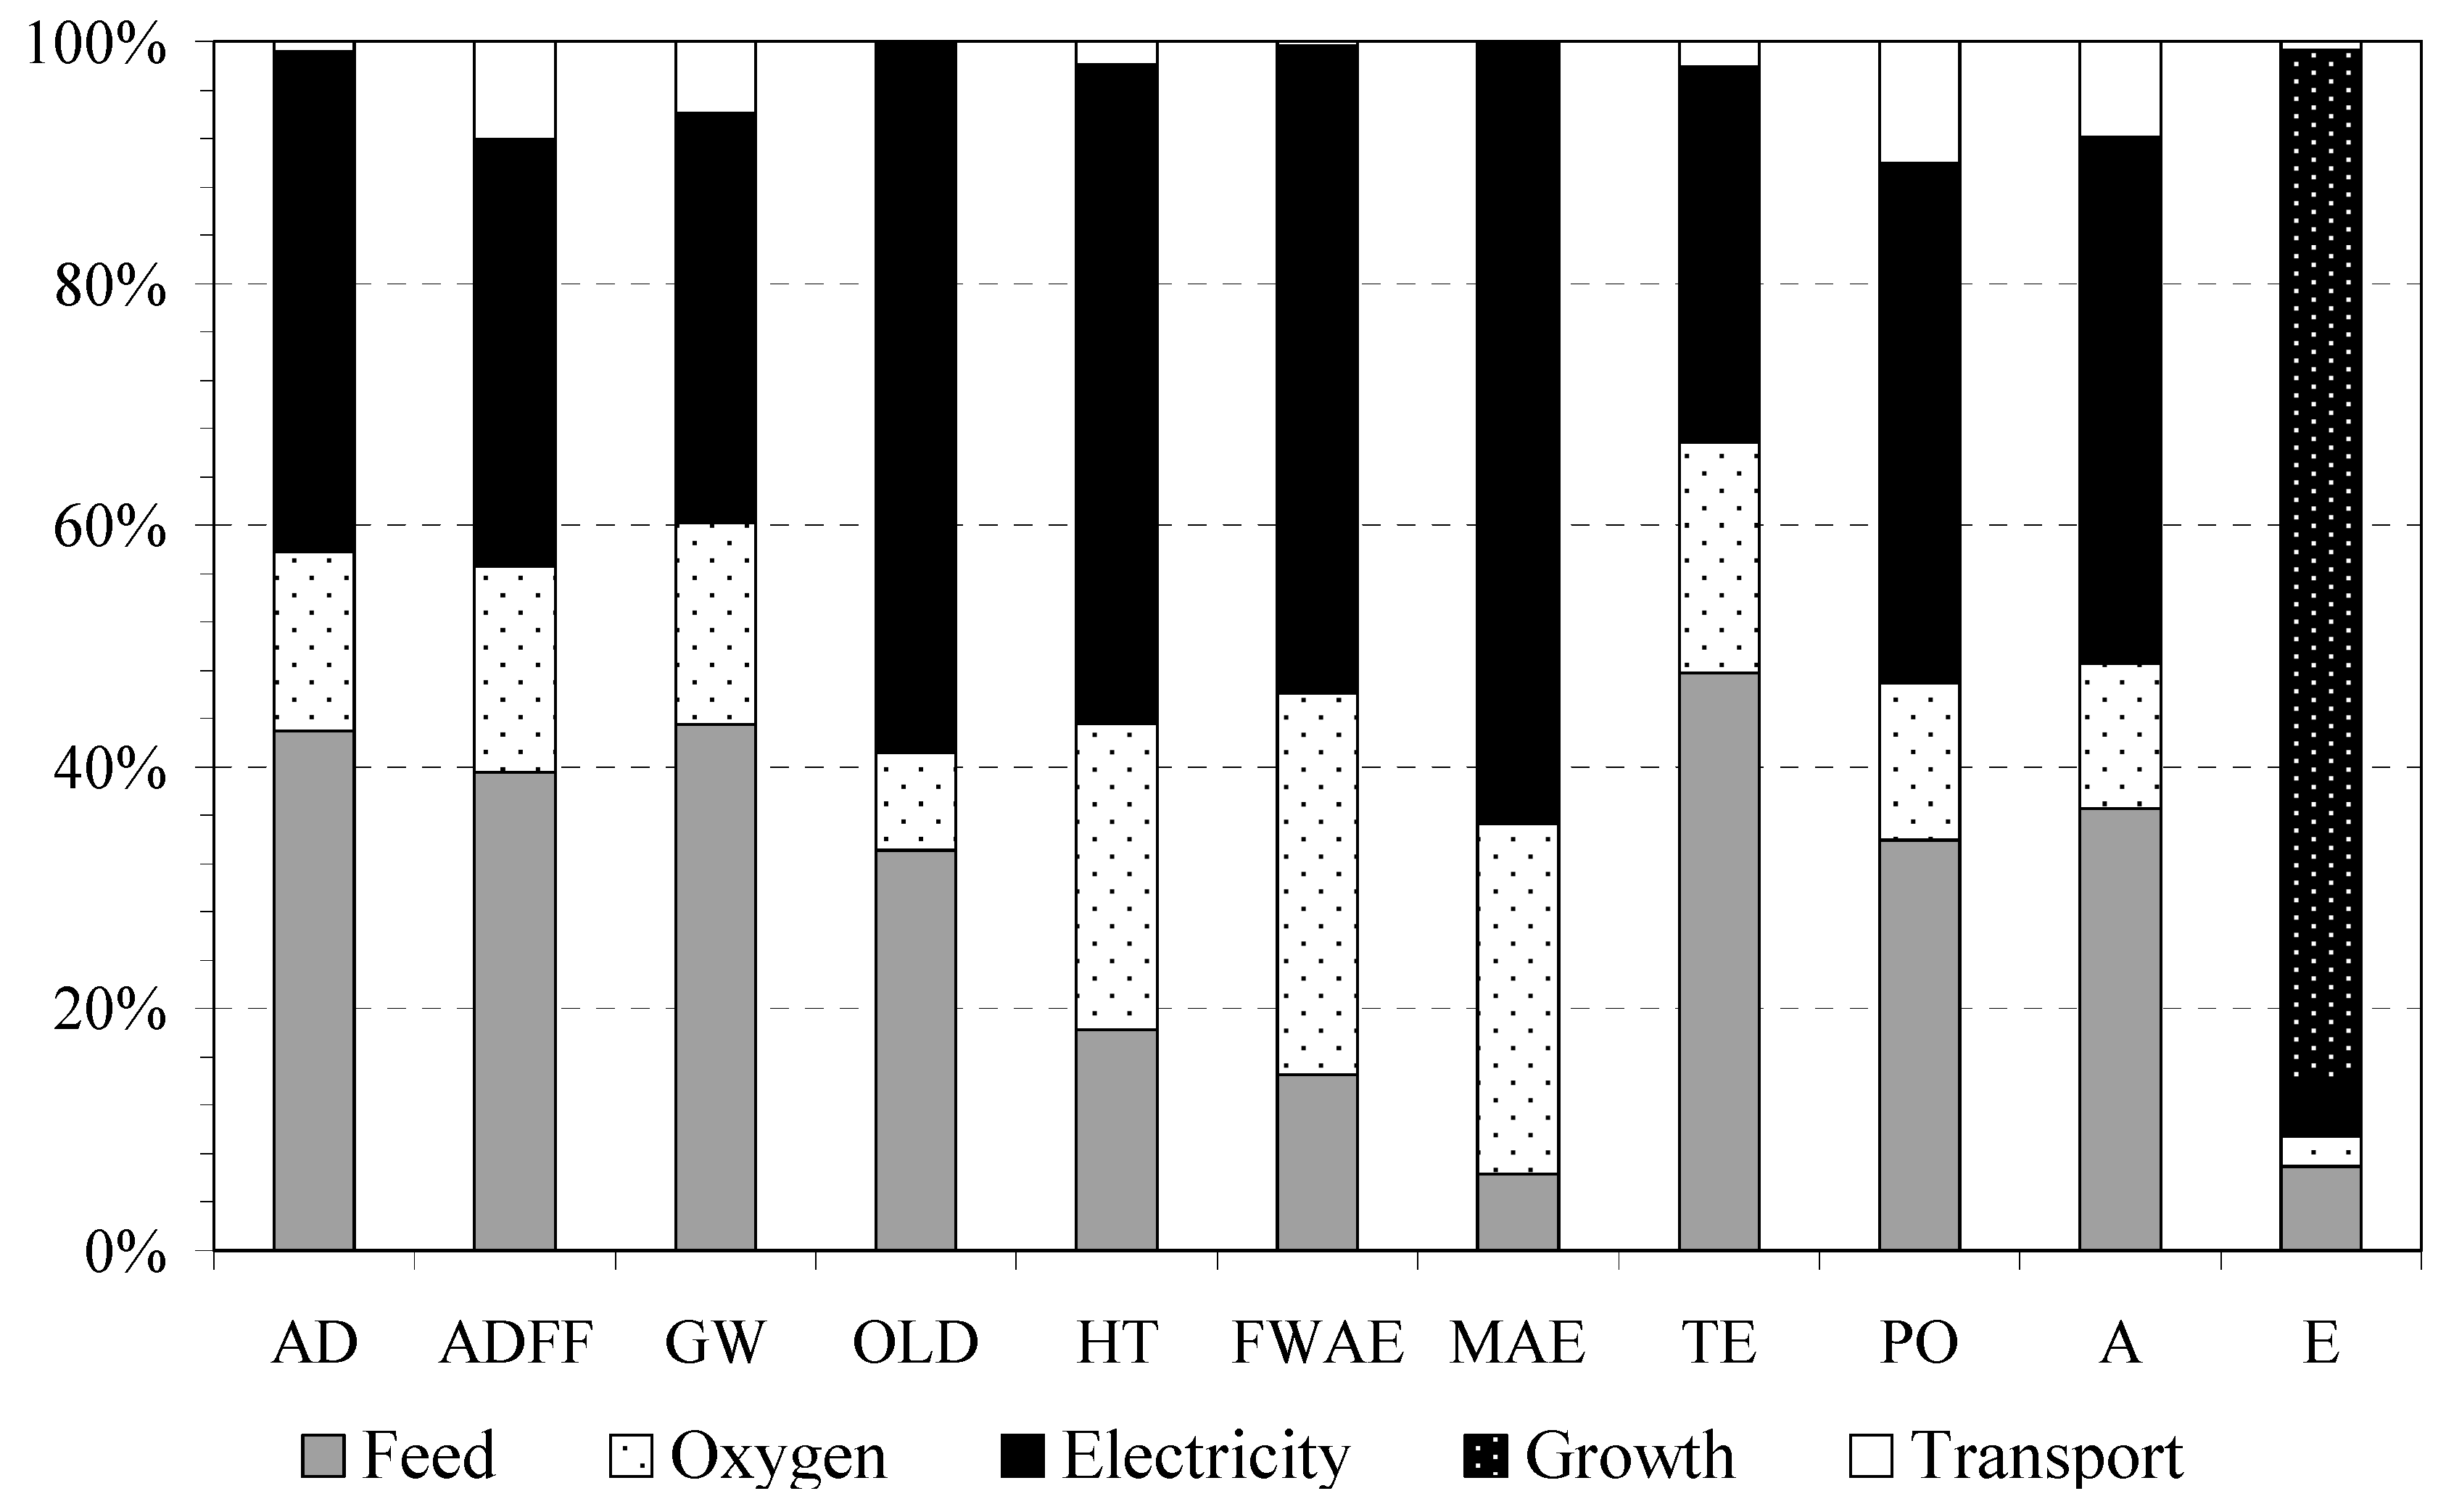
Of the components constituting the pre-ongrowing system (Figure 5), electricity contributes most to environmental impacts (42%), followed by feed (29%) and oxygen (17%). Growth only affects eutrophication, although it is the most responsible factor in this impact (85%).
AD: Mainly due to feed (61%), to which raw material makes a large contribution (31%). The most relevant unit processes in raw materials are agricultural machinery and means of transport (trucks and boats). The installation also has a high value (24%), which is mainly due to the metallic materials used.
ADFF: Boat fuel (38%), and the energy consumed (oil, gas, electricity) in all the processes involved in the production of fish feed (54%), manufacturing (22%), and obtaining the raw materials (30%), transformation, and transport, make a significant contribution.
GW is due to ship fuel (26%) and feed (68%). About the feed, raw materials (51%), especially soybean meal (25%), are of particular relevance. Fish meal, however, represents only 6%.
OLD is mainly due to the energy consumed in all the processes. In this respect, vessel fuel (57%) and feed (39%) should me mentioned: Within the term feed, the process of manufacturing (16%) and among the raw materials, the fuel consumed by the fishing vessels to ultimately produce fish meal and fish oil (8%). However, soybean (for meal and oil) only represents 2%.
HT is due to boat fuel (14%); facilities (26%), especially the metallic elements; and feed (51%); in the latter, raw materials (38%), especially wheat for meal and gluten (11%); and soybean meal and soybean oil (12%).
FWAE is due to feed (69%), mainly raw materials (58%), corn gluten meal (18%), and soybean meal (12%).
MAE is due to the feed (47%) and fingerlings (25%). In both cases, the factor most responsible for MAE is the consumption of electrical energy in the unit processes (47%), particularly the manufacture of feed (22%) and, during pre-ongrowing, pumping water to the tanks (22%) and the manufacture of liquid oxygen (9%).
TE is due to raw materials (87%) of vegetable origin, mainly the agricultural production of soybean (33%) to obtain soybean meal and soybean oil; the wheat for meal and wheat gluten (23%); and rapeseed (11%) for oil.
PO is mainly due to vessel fuel (33%) and feed (59%), especially the fuel consumed in the various operations related to obtaining the raw materials for the feed (fishing or agriculture, energy, and transport of fish and soybean meal and oils).
A: Feed contributes (46%) and fuel (48%), similar to PO.
E is primarily due to emissions of N and P resulting from the metabolism of the fish farm feed, so that the environmental problem is purely local.

3.3. Sensitivity Analysis and Development of Equations

3.3.1. Selection of Independent Variables

The two components that contribute most to overall impacts are feed (54%) and diesel (23%), which, together, account for 77%. These two components vary from one farm to another due to factors, such as the feed distribution system, and in each case, the efficiency of the operation, and the distance between the port and the fish farm. Fingerlings and the offshore installation make a low contribution to the impacts, so they can be considered as constants.
Growth also makes a low contribution, but only affects eutrophication. On the other hand, it is well documented that the greatest local impact of fish farming is due to organic wastes from feed, both from the feed provided and not ingested and by the metabolism of the fish, either in particulate or dissolved form [55,56,57,58]. Hence, specific models for its evaluation have been developed [51,59]. For this reason, eutrophication is not used as a dependent variable, nor growth as an independent variable.
Therefore, the equations to explain the different environmental impacts, except eutrophication, were developed taking into account independent variables, such as feed and vessel fuel.

3.3.2. Multiple Regression Analysis

The first step was to analyze the type of relationship between the independent and dependent variables. To do this, the values of feed (F) and diesel (D) used in the basic farm (1.9 t and 511 kg, respectively) were the core values of the range of variation of the independent variables. For each category of impact, five scenarios from D were analyzed (256, 383, 511, 639, and 767 kg) and a feed value of 1.9 t and for a value of 511 kg, five scenarios from D (1.5, 1.7, 1.9, 2.1., 2.3 t). Data were fitted to a linear equation: PEI = a + b × SC, where PEI is the potential environmental impact and SC is the system component (F or D). In all cases, R2 values were equal to 1, and, consequently, the relationship can be explained by a linear equation, while logarithmic, exponential, potential, and polynomial relations were discarded.
Four more scenarios were considered at the extremes of the two ranges to ensure the independence of the variables (Figure 6). The figure shows the scenarios of feed (F) and diesel (D) evaluated. The potential environmental impacts data were fitted to the following multiple regression model: PEI = a + b × F + c × D.
In all cases (Table 6), the coefficients of the independent variables (b and c) were significantly different from 0 (p < 0.001); the adjusted determination coefficient (R2adj) was 1; and the ANOVA showed the high significance of the equations (p < 0.0001):
AD = 5.38E-04+ 5.82E-04 × F + 3.50E-07 × D,
ADFF = 5.92E+03+ 2.08E+04 × F + 5.34E+01 × D,
GW = 4.53E+02 + 2.60E+03 × F + 3.74E+00 × D,
OLD = 2.61E-05 + 1.27E-04 × F + 6.87E-07 × D,
HT = 2.87E+02 + 2.25E+02 × F + 2.30E-01 × D,
FWAE = 1.24E+02 + 1.87E+02 × F + 7.37E-02 × D,
MAE = 4.05E+05 + 2.50E+05 × F + 2.56E+02 × D,
TE = 1.03E+00 + 5.50E+00 × F + 9.56E-04 × D,
PO = 1.09E-01 + 3.94E-01 × F + 8.17E-04 × D,
A = 2.41E+00 + 1.08E+01 × F + 4.18E-02 × D.

4. Discussion

4.1. System Components

4.1.1. Fingerlings

In the pre-ongrowing subsystem for fingerling production, the subcomponent of the system which has greatest environmental impact overall is electric power (42%), which is significantly higher than the contribution of feed (29%). This coincides with the conclusions of other authors that, in land tank fish farming, high energy requirements make the greatest contributions to impacts, such as GW or A [5]. This energy consumption in seabass pre-ongrowing is due to the pumping of water and the production of liquid oxygen for injection into the sea water, which has also been reported in other LCAs [2].
The overall contribution of the pre-ongrowing subsystem to commercial seabass production is low (7%). However, the contribution to MAE is significant (23%), and is mainly due to the consumption of electric energy.

4.1.2. Facilities

Infrastructure and equipment are usually not taken into account in LCAs since it is considered that their long depreciation periods have no significant influence on the potential environmental impacts associated with the production of fish [3,7]. Indeed, the contribution values recorded were small in relation to other components of the system, such as energy or feed, in both systems of fish farming: On land [2,3,5] and in cages at sea [3,5,8,10].
In this work, the impact of the facilities was also low in those impact categories that have frequently been used in the works of other authors, such as GW (1.87%), A (1.16%), and E (0.12%), and, consequently, their importance is considered minimal. However, the contribution to other impact categories which have not been used in previous studies is significant. This is the case of AD (24%), which was also featured in the offshore ongrowing of seabream [8]. However, it is also the case of some categories of toxicity, especially HT, whose contribution is 26%, or MAE (15%) and FWAE (13%). The high values of HT are mainly due to the metallic elements used in the mooring of the facility, such as thimbles, shackles, and distribution plates, which have a useful life of about 5 years [8]. Therefore, at least in offshore plants where mooring is a key element, it seems appropriate not to ignore this component of the system in the LCA.

4.1.3. Feed

Feed is the component of the system which makes the biggest contribution to most of the environmental impacts, except eutrophication. This result is in line with that recorded by other authors for other species of fish [7,8,10,11], as well as for seabass [2,5,10]. Also, and as seen with other fish species [7,8], the raw materials contribute most to the impacts (72%), while the fish feed manufacturing process is less relevant (19%).
Amongst the raw materials which contribute most to the overall impact are soybean meal (23%) and fish meal (18%), as recorded for other species [7,8]. However, the contribution of these raw materials to the impacts differs. In GW, soybean meal contributes 25% while fish meal only contributes 6%. In OLD, fishing in Peru to obtain fish meal and fish oils contributes 8%, while soybean production contributes only 2% and wheat 0.6%. However, TE is due primarily to raw materials of vegetable origin, especially the agricultural production of soybean (33%) and wheat (23%).
Several authors argue that the formulation of feed, in terms of the use of one raw material or another, is an important factor in reducing the environmental impacts associated with the production of fish [4,8,10,11,12,34]. In this sense, an alternative feed (rich in corn gluten and soybean meal and with very little fish meal) to the standard feed currently used for seabream (rich in fish meal and soybean meal) led to a decrease of 18% for AD, 21% for GW, 14% for OLD, and 15% for PO [8]. The same study concluded that a balance should be found between environmental impacts, the yields associated with the feed (growth, survival, and feed conversion rate), and the cost of production.

4.1.4. Growth

There is a direct relationship between the emissions of N registered for different species and the FCR [8], from 28.4 kg N (functional unit, 1 t of fish produced) for an FCR of 1.2 [3] to 119.3 kg N for an FCR of 2.0 [8]. In this work, in which the FCR was 1.9, the estimated emission of N (105.27 kg N) is situated near the upper value of this range. The values of N (105.27 kg N) and P (17.21 kg P) estimated in this work are similar to those recorded by other authors for seabass with similar conversion rates (1.8 [5]; 1.8 and 2.1 [2]), and which vary between 101.7 and 111.6 kg N and 15.0 and 18.1 kg P. Growth affects only E but is mainly responsible for this impact, with a value of 84%. Similar values, of between 80% and 93%, have been reported for different species and different systems of cultivation [3,5,8,10].
Indeed, the biggest local impact of fish farming is due to organic wastes from feed, both as a result of the non-ingested feed and the actual metabolism of fish, either in dissolved or particulate form [49,51,55,56,57,58,60,61,62]. In the Mediterranean Sea, it has been seen that the dissolved waste from fish farms, despite being quantitatively much more than the particulate wastes [45,46,49], are potentially less alarming since they are quickly dispersed by local currents [63,64,65]. Therefore, efforts in relation to the study of the local environmental impact have focused in the seabed and benthic communities [57,66,67,68].

4.1.5. Fuel

Fuel is the second component of the system that contributes most to the global impact, and its impact is very significant in OLD (57%), A (48%), ADFF (38%), PO (33%), and GW (26%). This makes it one of the main hotspots of offshore systems [8], and it should not be underestimated in the LCA of these fish production systems.
In cage systems in areas sheltered from storms and close to the coast, boat fuel is not usually taken into account [5,9]. Such cages are usually distributed in two rows on either side of a central gangway that facilitates routine operations, such as cage revision, removal of dead fish, feeding, etc. Also, the distribution of feed tends to be centralized and automated. Therefore, there is no need for powerful boats, nor great expenditure on fuel to access installations and for the various operations, including the distribution of feed. Thus, for example, in the farming of Atlantic salmon in marine net-pens, fuel consumption to produce 1 ton of fish was 28 L of diesel and 36.3 L of gasoline; and in a marine floating bag, 11.6 L of diesel [3]. Offshore fish farms, on the other hand, require powerful boats and the consumption of fuel is very relevant (605 L of diesel per ton of live-weight fish produced), although this can be reduced significantly by incorporating centralized feed distribution systems in the farm [8].

4.2. Sensitivity Analysis

4.2.1. Variability of the Independent Variables: Feed and Diesel

In the farm production of both seabass and seabream [8], the two components of the system that contribute most are feed and fuel. All such farms are very similar along the Mediterranean coast of Spain, both in terms of the installation and the production process. However, both the feed and the consumption of fuel vary considerably from one farm to another. They are, therefore, two powerful factors in terms of the variability of environmental impacts.
The value of FCR (1.9) in this study is similar to that used by other authors in the farming of seabass: 1.8 [5] and 1.88 [10] in cages, and 1.8 and 2.1 [2] in tanks. These values, however, contrast with those reported for salmon and trout, where values vary between 1.1 and 1.4 [3,5,9,34]. The efficiency of feed distribution plays an important role in these differences. In Mediterranean seabass and seabream fish farms, the feed is distributed manually and/or by canon, and is supplied only once or twice a day. In these conditions, it is assumed that a proportion is not captured and digested by the fish, so feeding efficiency is low [2,8,10]. The amount of uneaten supplied feed is between 5% and 15% [8,69]. In salmonids, feed loss has fallen from 20%–30% [70] to 3% [62] due to the development of specific feed supply protocols (pellet size, speed and frequency of distribution, etc.) integrated into centralized, automated systems that control the distribution of the feed.
It is estimated that the cost of feed in the aquaculture of seabream and seabass is around 45% to 50% of the total costs of production [8,71,72]. It is also known that the main environmental impact of fish farming derives from the organic contributions in the form of feces and uneaten supplied feed [73] because of shortcomings in the feeding process. Therefore, any improvement in the feeding process will result not only in decreased costs, but also in the reduction of organic inputs to the environment, and the competitiveness and sustainability of the sector.
Producers are aware of all this and would like to incorporate the necessary technology to reduce feed losses. However, implementation is costly and presents serious technical difficulties offshore, so it may be a slow process. However, there are some farms which have platforms or feed silo boats for the mechanized distribution of feed, but the control systems are still not widely used. On the other hand, the basic farm described here is 5 km from the port, but, obviously, there are farms that are closer and others that are more distant. In Murcia (SE Spain), for example, the farms tend to be between 4 and 7.5 km from the shore. This is an important factor in the daily consumption of boat diesel. Moreover, in basic farms, vessels travel from cage to cage to supply the animal feed, which means high fuel consumption although this can be reduced with centralized and mechanized systems of food distribution.

4.2.2. The Explanatory Equations of the Variability of the Impacts

The coefficients of the independent variables (feed and diesel) in the MRA were significantly different from 0 for all the impact categories. This indicates that both diesel and feed significantly influence the value of all the impacts. Data fitting (R2)—close to 1 in all cases—and the statistical significance of the equations (ANOVA, p < 0.01) demonstrate their usefulness.
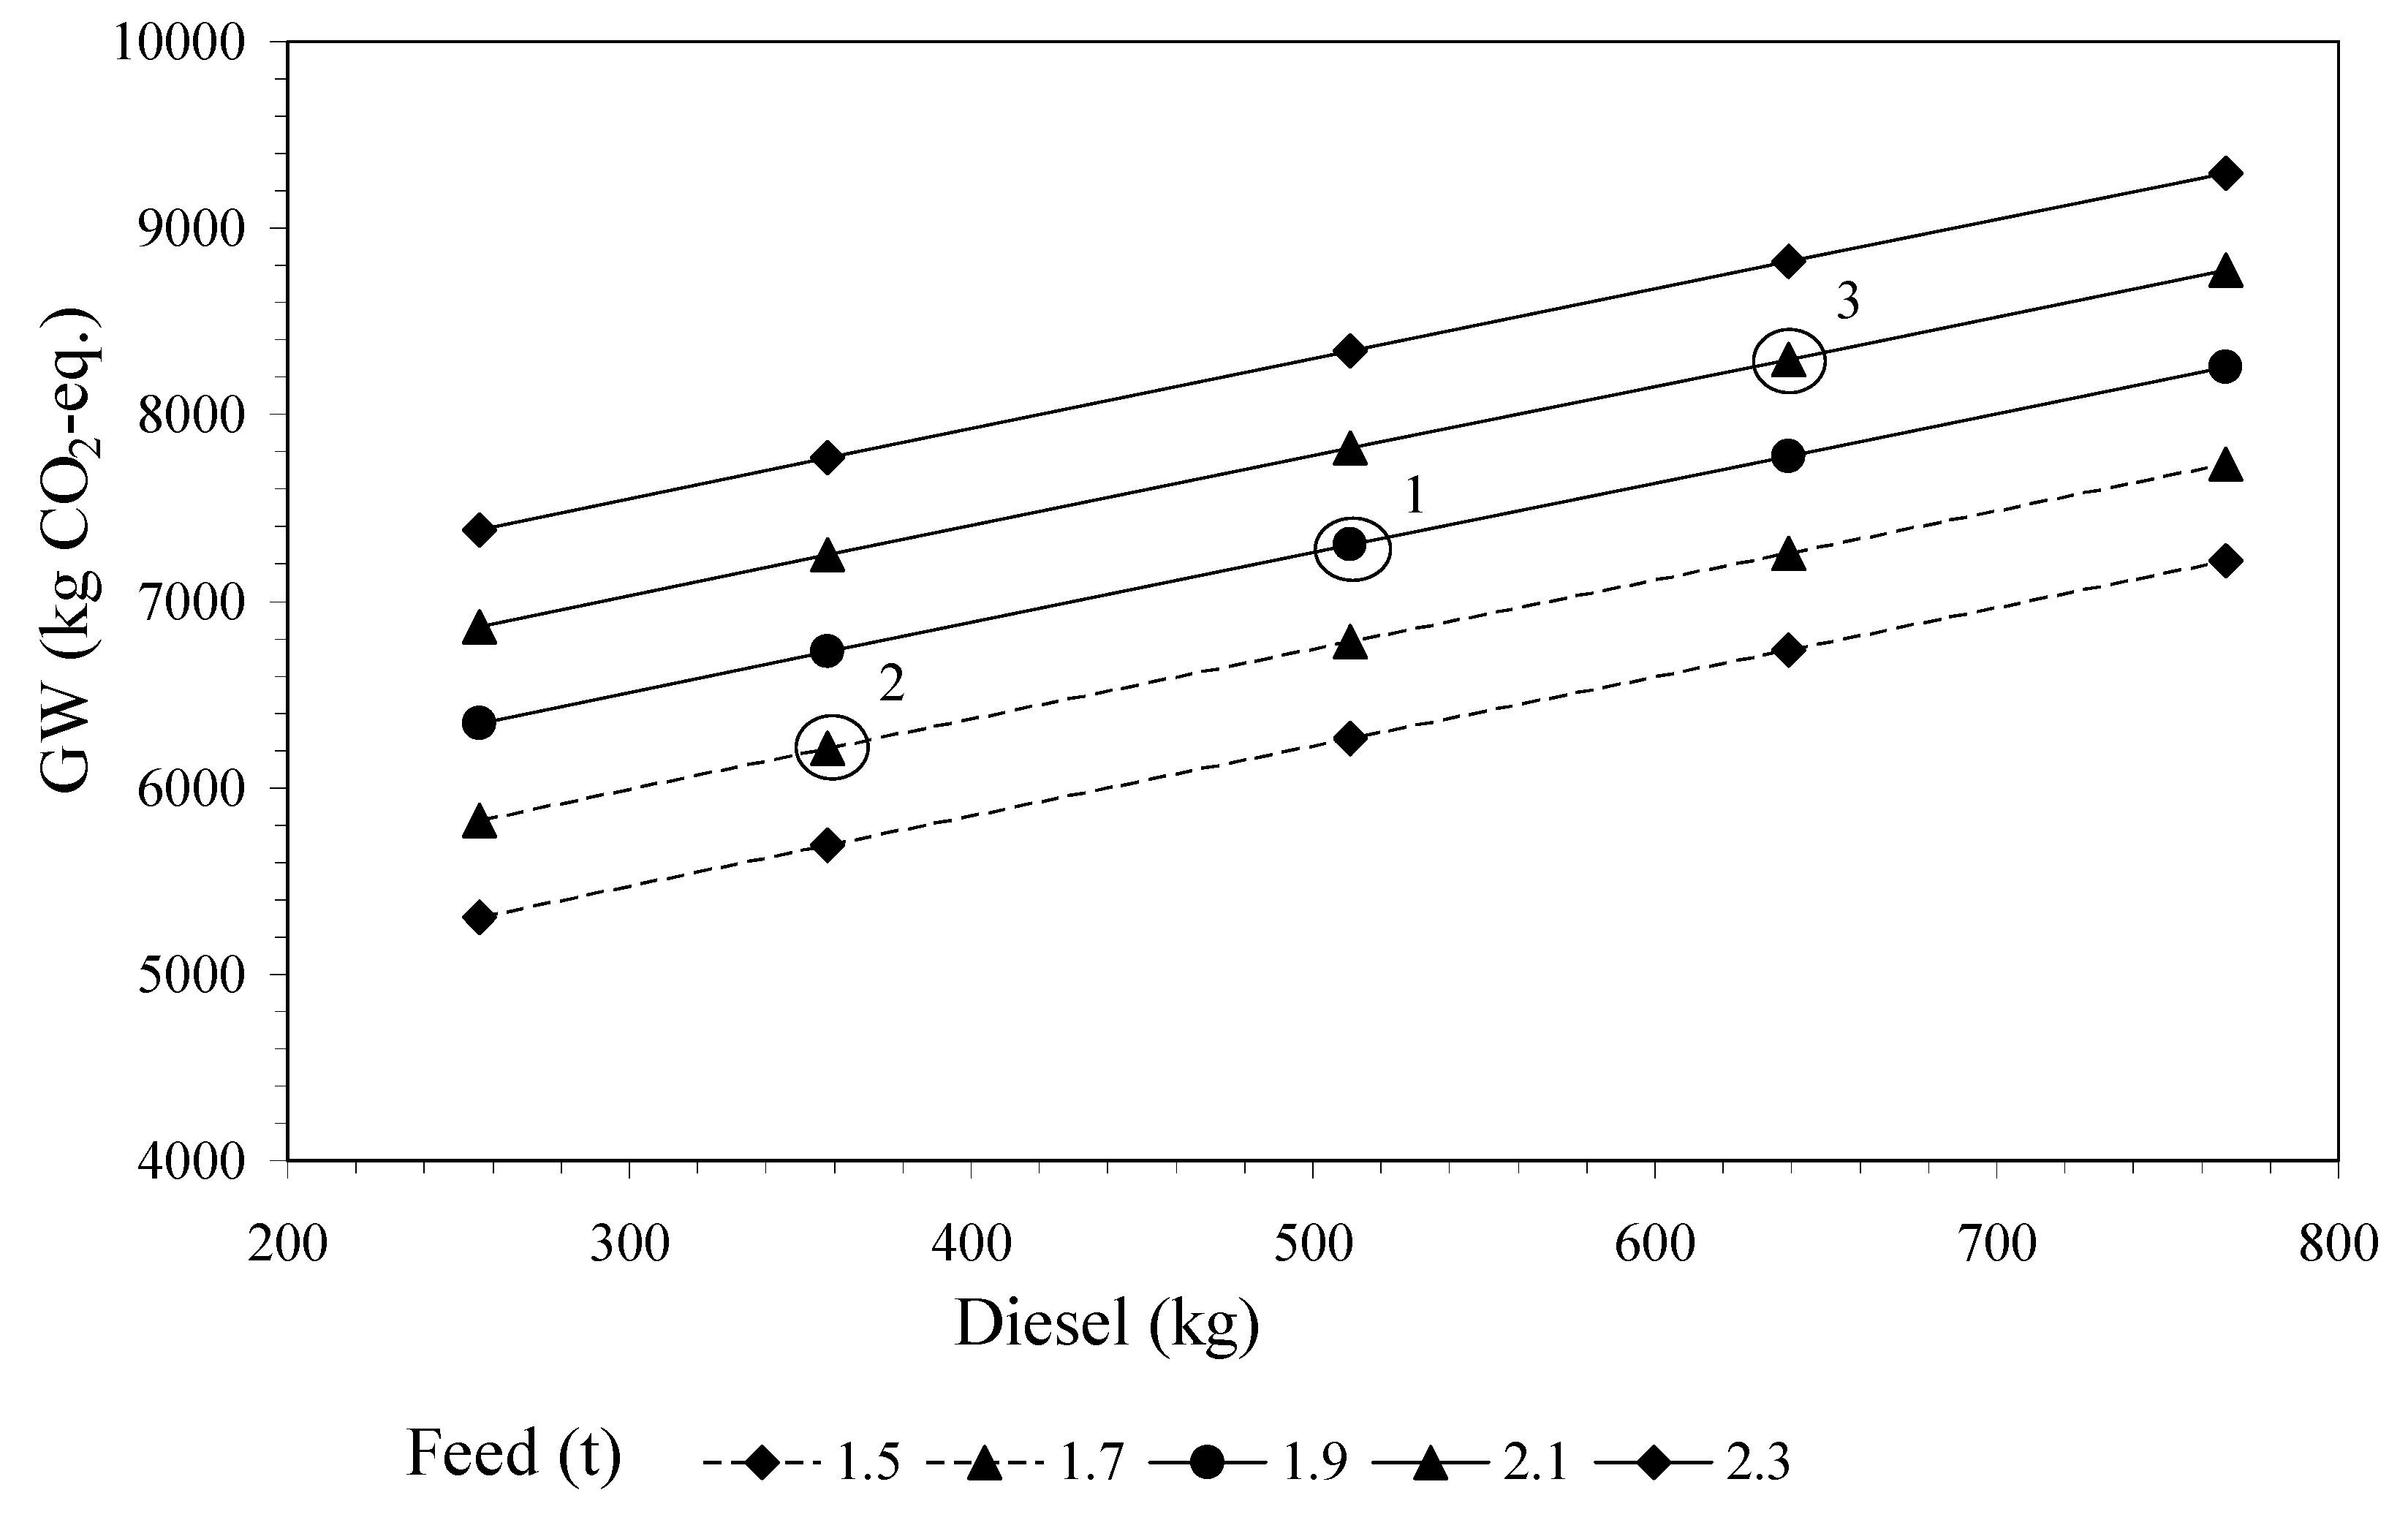
The equations developed by MRA explain the variability of the different impacts according to the feed and the consumption of diesel. Therefore, a wide range of different scenarios can be estimated that reflect the reality of different fish farms. Thus, for example, Figure 7 shows the relationship between the consumption of diesel, feed, and the value of GW in three possible scenarios: (1) Fish farm with a feed supply of 1.9 t (or FCR of 1.9) and diesel consumption of 511 kg; (2) a more efficient fish farm with 1.7 t of feed and 358 kg diesel consumed; and (3) a less efficient farm with 2.1 t of feed and 639 kg diesel consumed. These scenarios would imply GW values of 7300, 6209, and 8298 kg CO2-eq respectively. All the environmental impacts for these three scenarios are shown in Figure 8. The third scenario represents an overall increase in the impacts of 12% compared with the basic farm, and for scenario 2 an overall reduction of 14%. In scenario 2, which should represent the aim of aquacultural practices, the impacts that have been improved are OLD (21% reduction), A (19%), ADFF (17%), PO (16%), and GW (15%). For the rest of the impacts (AD, HT, FWAE, MAE, and TE), the reduction is 9% to 10%. Using the same equations, very different scenarios can be analyzed.

5. Conclusions

The system components that contribute most to environmental impacts in the production of seabass in offshore fish farms are the feed supplied and the fuel consumed by the vessels. The subcomponent that contributes most to the impacts are the raw materials used for the production of feed, especially fish meal and soybean meal.
Although the facilities of offshore fish farms have a low overall impact, their contribution to AD, HT, FWAE, or MAE means that they should be taken into account in LCA.
MRA was shown to be a useful tool for developing equations that explain the variability of environmental impacts based on the system components that contribute most quantitatively. These equations allowed us to estimate simply and quickly very different scenarios that reflect the reality of different farms at the present time, but also future scenarios based, for example, on the implementation of technologies that will decrease both feed and fuel consumption.

Author Contributions

All four authors conceived and designed the present study. The role of each of the authors was as follows: foreground data were collected by J.G.G. and F.A.-G.; background data and LCA with SimaPro were collected by C.R.J. and B.G.G.; the MRA was performed by B.G.G. and F.A.-G.; all four authors drafted the manuscript.

Funding

This research (project FEDER 14-20-09) was funded 80% by the European Development Fund, “One Way to Make Europe”.

Acknowledgments

Fisheries and Aquaculture Service of the Region of Murcia.

Conflicts of Interest

The authors declare no conflict of interest.

References

  1. ISO Environmental Management-Life Cycle Assessment: Principles and Framework; ISO 14040; ISO-International Organization for Standards: Geneva, Switzerland, 2006.
  2. Jerbi, M.A.; Aubin, J.; Achour, L.; Kacem, A. Life cycle assessment (LCA) of two rearing techniques of sea bass (Dicentrarchus labrax). Aquac. Eng. 2012, 46, 1–9. [Google Scholar] [CrossRef]
  3. Ayer, N.W.; Tyedmers, P.H. Assesing alternative aquaculture technologies: Life cycle assessment of salmonid culture systems in Canada. J. Clean. Prod. 2009, 17, 362–373. [Google Scholar] [CrossRef]
  4. Samuel-Fitwi, B.; Schroeder, J.P.; Schulz, C. System delimitation in life cycle assessment (LCA) of aquaculture: Striving for valid and comprehensive environmental assessment using rainbow trout farming as a case study. Int. J. Life Cycle Assess. 2013, 18, 577–589. [Google Scholar] [CrossRef]
  5. Aubin, J.; Papatryphon, E.; Van der Werf, H.M.G.; Chatzifotis, S. Assesment of the environmental impact of carnivorous finfish production systems using life cycle assessment. J. Clean. Prod. 2009, 17, 354–361. [Google Scholar] [CrossRef]
  6. Aubin, J.; Papatryphon, E.; Van der Werf, H.M.G.; Petit, J.; Morvan, Y.M. Characterisation of the environmental impact of a turbot (Scophthalmus maximus) re-circulating production system using Life Cycle Assessment. Aquaculture 2006, 261, 1259–1268. [Google Scholar] [CrossRef]
  7. Iribarren, D.; Moreira, M.T.; Feijoo, G. Life Cycle Assessment of Aquaculture Feed and Application to the Turbot Sector. Int. J. Environ. Res. 2012, 6, 837–848. [Google Scholar]
  8. García García, B.; Rosique Jiménez, C.; Aguado-Giménez, F.; García García, J. Life cycle assessment of gilthead seabream (Sparus aurata) production in offshore fish farms. Sustainability 2016, 8, 1228. [Google Scholar] [CrossRef]
  9. Pelletier, N.; Tyedmers, P.; Sonesson, U.; Scholz, A.; Ziegler, F.; Flysjo, A.; Kruse, S.; Cancino, B.; Silverman, H. Not all salmon are created equal: Life cycle assessment (LCA) of global salmon farming systems. Environ. Sci. Technol. 2009, 43, 8730–8736. [Google Scholar] [CrossRef]
  10. Abdou, K.; Aubin, J.; Romdhane, M.S.; Le Loc’h, F.; Lasram, F.B.R. Environmental assessment of seabass (Dicentrarchus labrax) and seabream (Sparus aurata) farming from a life cycle perspective: A case study of a Tunisian aquaculture farm. Aquaculture 2017, 471, 204–212. [Google Scholar] [CrossRef]
  11. Boissy, J.; Aubin, J.; Drissi, A.; Van der Werf, H.M.G.; Bell, G.J.; Kaushik, S.J. Environmental impacts of plant-based salmonid diets at feed and farm scales. Aquaculture 2011, 321, 61–70. [Google Scholar] [CrossRef]
  12. Basto-Silva, C.; Guerreiro, I.; Oliva-Teles, A.; Neto, B. Life cycle assessment of diets for gilthead seabream (Sparus aurata) with different protein/carbohydrate ratios and fishmeal or plant feedstuffs as main protein sources. Int. J. Life Cycle Assess. 2019. [Google Scholar] [CrossRef]
  13. Roque d’Orbcastel, E.; Blancheton, J.P.; Aubin, J. Towards environmentally sustainable aquaculture: Comparison between two trout farming systems using Life Cycle Assessment. Aquac. Eng. 2009, 40, 113–119. [Google Scholar] [CrossRef] [Green Version]
  14. Bohnes, F.A.; Hauschild, M.Z.; Shlundt, J.; Laurent, A. Life cycle assessments of aquaculture systems: A critical review of reported findings with recommendations for policy and system development. Rev. Aquac. 2018, 1–19. [Google Scholar] [CrossRef]
  15. Samuel-Fitwi, B.; Nagel, F.; Meyer, S.; Schroeder, J.P.; Schulz, C. Comparative life cycle assessment (LCA) of raising rainbow trout (Oncorhynchus mykiss) in different production systems. Aquac. Eng. 2013, 54, 85–92. [Google Scholar] [CrossRef]
  16. Cerezo Valverde, J.; García García, B. The effect of oxygen levels on oxygen consumption, survival and ventilatory frequency of sharpsnout sea bream (Diplodus puntazzo Gmelin, 1789) at different conditions of temperature and fish weiht. J. Appl. Ichthyol. 2004, 20, 488–492. [Google Scholar] [CrossRef]
  17. Muller-Feuga, A.; Petit, J.; Sabaut, J.J. The influence of temperature and wet weight on the oxygen demand of rainbow trout (Salmo gairdneri R.) in fresh water. Aquaculture 1978, 14, 355–363. [Google Scholar] [CrossRef]
  18. García García, B.; Cerezo Valverde, J.; Gómez, E.; Hernández, M.D.; Aguado-Giménez, F. Ammonia excretion of octopus (Octopus vulgaris) in relation to body weight and protein intake. Aquaculture 2011, 319, 162–167. [Google Scholar] [CrossRef]
  19. Aguado-Giménez, F.; García García, B. Growth and food intake models in Octopus vulgaris Cuvier (1797): Influence of body weight, temperature, sex and diet. Aquac. Int. 2003, 10, 361–377. [Google Scholar] [CrossRef]
  20. Björnsson, B.; Steinarsson, A.; Árnason, T. Growth model for Atlantic Cod (Gadus morhua): Effects of temperature and body weight on growth rate. Aquaculture 2007, 271, 216–226. [Google Scholar] [CrossRef]
  21. García García, B.; Cerezo Valverde, J.; Aguado-Giménez, F.; García García, J.; Hernádez, M.D. Effect of the interaction between body weight and temperature on growth and maximum daily food intake in sharpsnout sea bream (Diplodus puntazzo). Aquac. Int. 2011, 19, 131–141. [Google Scholar] [CrossRef]
  22. García García, B.; Cerezo Valverde, J.; Aguado-Giménez, F.; García García, J.; Hernádez, M.D. Growth and mortality of common octopus Octopus vulgaris reared at different stoking densities in Mediterranean cages. Aquac. Res. 2009, 40, 1202–1212. [Google Scholar] [CrossRef]
  23. Handeland, S.O.; Imsland, A.; Stefansson, S. The effect of temperature and fish size on growth, feed intake, food conversion efficiency and stomach evacuation rate of Atlantic salmon post-smolts. Aquaculture 2008, 283, 36–42. [Google Scholar] [CrossRef]
  24. Imsland, A.K.; Sunde, L.M.; Folkvord, A.; Stefansson, S.O. The interaction between temperature and size on growth of juvenile turbot (Scophthalmus maximus Rafinesque). J. Fish Biol. 1996, 49, 926–940. [Google Scholar] [CrossRef]
  25. Ballester-Molto, M.; García García, B.; García García, J.; Cerezo Valverde, J.; Aguado-Giménez, F. Controlling feed losses by chewing in gilthead sea bream (Sparus aurata) ongrowing may improve the environmental sustainability of the aquacultural activity. Aquaculture 2016, 464, 111–116. [Google Scholar] [CrossRef]
  26. García García, J.; García García, B. Econometric model of viability/profitability of octopus (Octopus vulgaris) ongrowing in sea cages. Aquac. Int. 2011, 19, 1177–1191. [Google Scholar] [CrossRef]
  27. García García, J.; García García, B. Econometric model of viability/profitability of ongrowing sharp snout sea bream (Diplodus puntazzo) in sea cages. Aquac. Int. 2010, 18, 955–971. [Google Scholar] [CrossRef]
  28. García García, J.; García García, B. An econometric viability model for ongrowing sole (Solea senegalensis) in tanks using pumped well sea water. Span. J. Agric. Res. 2006, 4, 304–315. [Google Scholar] [CrossRef]
  29. APROMAR. La Acuicultura en España; Ministerio de Agricultura, Alimentación y Medio Ambiente, Gobierno de España: Madrid, Spain, 2017.
  30. ISO Environmental Management–Life Cycle Assessment: Requirements and Guidelines; ISO 14044; ISO-International Organization for Standards: Geneva, Switzerland, 2006.
  31. PRé Consultants Introduction to LCA with SimaPro; PRé: Amersfoort, The Netherland, 2016.
  32. Guinée, J.B.; Gorrée, M.; Heijungs, R.; Huppes, G.; Kleijn, R.; de Koning, A.; van Oers, L.; Wegener Sleeswijk, A.; Suh, S.; Udo de Haes, H.A.; et al. Handbook on Life Cycle Assessment. Operational Guide to the ISO Standards. I: LCA in Perspective. IIa: Guide. IIb: Operational Annex. III: Scientific Background; Kluwer Academic Publishers: Dordrecht, The Netherland, 2002; ISBN 1-4020-0228-9. [Google Scholar]
  33. Henriksson, P.J.G.; Guinée, J.B.; Kleijn, R.; de Snoo, G.R. Life cycle assessment of aquaculture systems-a review of methodologies. Int. J. Life Cycle Assess. 2012, 17, 304–313. [Google Scholar] [CrossRef]
  34. Samuel-Fitwi, B.; Meyer, S.; Reckmann, K.; Schroeder, J.P. Aspiring for environmentally conscious aquafeed: Comparative LCA of aquafeed manufacturing using different protein sources. J. Clean. Prod. 2013, 52, 225–233. [Google Scholar] [CrossRef]
  35. Grönroos, J.; Seppälä, J.; Silvenius, F.; Mäkinen, T. Life cycle assessment of Finnish cultivated rainbow trout. Boreal Environ. Res. 2006, 11, 401–414. [Google Scholar]
  36. Baez Paleo, J.D. Ingeniería de la Acuicultura marina: Instalaciones de Peces en el Mar; Publicaciones Científicas y Tecnológicas de la Fundación OESA: Madrid, Spain, 2009; ISBN 978-84-00-08865-1. [Google Scholar]
  37. Eroldogan, O.T.; Kumlu, M.; Aktas, M. Optimun feeding rates for European sea bass Dicentrarchus labrax L. reared in seawater and freshwater. Aquaculture 2004, 231, 501–525. [Google Scholar] [CrossRef]
  38. García García, B.; Bermúdez, L.; Gómez, O.; Rosique, M.J. Consumo de oxígeno en juveniles de lubina (Dicentrarchus labrax L.). In Acuicultura Intermareal; Yúfera, M., Ed.; Instituto de Ciencias del Mar de Andalucía: Cádiz, Spain, 1989; pp. 297–303. [Google Scholar]
  39. Murcia, P.D.P. Economía de escala en las explotaciones de engorde de dorada (Sparus aurata) en jaulas flotantes en el Mediterráneo. An. Vet. Murcia 2005, 21, 69–76. [Google Scholar]
  40. García García, J.; Rouco Yañez, A.; García García, B. Directrices generales de diseño de explotaciones de engorde de especies acuícolas en jaulas en mar. Arch. Zootec. 2002, 51, 469–472. [Google Scholar]
  41. Fréon, P.; Durand, H.; Avadí, A.; Huaranca, S. Life cycle assessment of three Peruvian fishmeal plants: Toward a cleaner production. J. Clean. Prod. 2017, 145, 50–63. [Google Scholar] [CrossRef]
  42. Mosnier, E.; Van der Werf, H.M.G.; Boissy, J.; Dourmad, J.Y. Evaluation of the environmental implications of the incorporation of feed-use amino acids in the manufacturing of pig and broiler feeds using Life Cycle Assessment. Animal 2011, 5, 1972–1983. [Google Scholar] [CrossRef] [Green Version]
  43. Ballester-Molto, M.; Follana-Berná, G.; Sanchez-Jerez, P.; Aguado-Giménez, F. Total nitrogen, carbon and phosphorus digestibility in gilthead seabream (Sparus aurata) and European seabass (Dicentrarchus labrax) fed with conventional and organic commercial feeds: Implications for particulate waste production. Aquac. Res. 2017, 48, 3450–3463. [Google Scholar] [CrossRef]
  44. García García, J. Análisis del Sector del Limonero y Evaluación Económica de su Cultivo; Consejería de Agricultura y Agua: Murcia, Spain, 2014. [Google Scholar]
  45. Aguado-Giménez, F.; García García, B.; Hernández, M.D.; Cerezo Valverde, J. Gross metabolic waste output estimates using a nutritional approach in Atlantic bluefin tuna (Thunnus thynnus) under intensive fattening conditions in western Mediterranean Sea. Aquac. Res. 2006, 37, 1254–1258. [Google Scholar] [CrossRef]
  46. Cho, C.Y.; Hynes, J.D.; Wood, K.R.; Yoshida, H.K. Quantification of fish culture wastes by biological (nutritional) and chemical (limnological) methods: The development of high nutrient dense (HND) diets. In Nutritional Strategies and Aquaculture Waste; Cowey, C.B., Cho, C.Y., Eds.; University of Guelph: Guelph, ON, Canada, 1991; pp. 37–50. [Google Scholar]
  47. Cho, C.Y.; Bureau, D. Development of bioenergetic models and the Fish-PrFEQ software to estimate production feeding ration and waste output in aquaculture. Aquat. Living Resour. 1998, 11, 199–210. [Google Scholar] [CrossRef]
  48. Leung, K.M.I.; Chu, J.C.W.; Wu, R.S.S. Nitrogen budgets for the aerolated grouper Epinephelus areolatus, cultured under laboratory conditions and in open-sea cages. Mar. Ecol. Prog. Ser. 1999, 186, 271–281. [Google Scholar] [CrossRef]
  49. Lupatsch, Y.; Kissil, G.W. Predicting aquaculture waste from gilthead seabream (Sparus aurata) culture using a nutritional approach. Aquat. Living Resour. 1998, 11, 265–268. [Google Scholar] [CrossRef]
  50. Mazón, M.J.; Piedecausa, M.A.; Hernádez, M.D.; García García, B. Evaluation of environmental nitrogen and phosphorus contributions as a result of intensive ongrowing of common octopus (Octopus vulgaris). Aquaculture 2007, 266, 226–235. [Google Scholar] [CrossRef]
  51. Piedecausa, M.A.; Aguado-Giménez, F.; Cerezo Valverde, J.; Hernández, M.D.; García García, B. Simulating the temporal pattern of waste production in farmed gilthead seabream (Sparus aurata), European seabass (Dicentrarchus labrax) and Atlantic bluefin tuna (Thunnus thynnus). Ecol. Model. 2010, 221, 634–640. [Google Scholar] [CrossRef]
  52. Klein, J.; Geilenkirchen, G.; Hulskotte, J.; Ligterink, N.; Fortuin, P.; Mlnár-in’t Veld, H. Methods for Calculating Transport Emission in the Netherland; Task Force on Transportation of the Dutch Pollutant Release and Transfer Register: The Hague, The Netherland, 2014. [Google Scholar]
  53. Cooper, J.; Diesburg, S.; Babej, A.; Noon, M.; Kahn, E.; Puettmann, M.; Colt, J. Life Cycle Assessment of products from Alaskan salmon processing wastes: Implication of coproduction, intermittent landings, and storage time. Fish. Res. 2014, 151, 26–38. [Google Scholar] [CrossRef]
  54. Pelletier, N.; Tyedmers, P. Feeding farmed salmon: Is organic better? Aquaculture 2007, 272, 399–416. [Google Scholar] [CrossRef]
  55. Hargrave, B.T.; Holmer, M.; Newcombre, C.P. Towards a classification of organic enrichment in marine sediments based on biogeochemical indicators. Mar. Pollut. Bull. 2008, 56, 810–824. [Google Scholar] [CrossRef]
  56. Hargrave, B.T.; Duplisea, D.E.; Pfeiffer, E.; Wildish, D.J. Seasonal changes in benthic fluxes of dissolved oxygen and ammonium associated with marine cultured Atlantic salmon. Mar. Ecol. Prog. Ser. 1993, 96, 249–257. [Google Scholar] [CrossRef]
  57. Karakassis, I.; Hatziyanni, E.; Tsapakis, M.; Plaiti, W. Benthic recovery following cessation of fish farming: A series of sucesses and catastrophes. Mar. Ecol. Prog. Ser. 1999, 184, 205–218. [Google Scholar] [CrossRef]
  58. Mazzola, A.; Mirto, S.; La Rosa, T.; Fabiano, M.; Danovaro, R. Fish farming effects on benthic community structure in coastal sediments: Analysis of meiofaunal resilience. ICES J. Mar. Sci. 2000, 57, 1454–1461. [Google Scholar] [CrossRef]
  59. Ballester-Moltó, M. Dinámica de la Producción de Residuos Particulados en Granjas de Peces Mediterráneas: Influencia de la Ictiofauna Salvaje. Ph.D. Thesis, Universidad de Alicante, Alicante, Spain, 2016. [Google Scholar]
  60. Aguado-Giménez, F.; García García, B. Assessment of some chemical parameters in marine sediments exposed to offshore cage fish farming influece. Aquaculture 2004, 242, 283–296. [Google Scholar] [CrossRef]
  61. Black, K.D. Sustainability of Aquaculture. In Environmental Impacts of Aquaculture; Black, K.D., Ed.; Sheffield Academic Press: Sheffield, UK, 2001; pp. 199–212. [Google Scholar]
  62. Cromey, C.J.; Nickell, T.D.; Black, K.D. DEPOMOD-modeling the deposition and biological effects of waste solids from marine cage farm. Aquaculture 2002, 214, 211–239. [Google Scholar] [CrossRef]
  63. Pitta, P.; Tsapakis, M.; Apostolaki, E.T.; Tsagaraki, T.; Holmer, M.; Karakassis, I. “Ghost nutrients” from fish farms are transferred up the food web by phytoplankton grazers. Mar. Ecol. Prog. Ser. 2009, 374, 1–6. [Google Scholar] [CrossRef]
  64. Pitta, P.; Karakassis, I.; Tsapakis, M.; Zivanovic, S. Natural vs. Mariculture induced variability in nutrients and plankton in the Eastern Mediterranean. Hydrobiologia 1999, 391, 181–184. [Google Scholar]
  65. Thigstad, T.F.; Krom, M.D.; Mantoura, R.F.C.; Flaten, G.A.G.; Groom, S.; Herut, B.; Kress, N.; Law, C.S.; Pasternak, A.; Pitta, P.; et al. Nature of phosphorous limitation in the ultraoligotrophic eastern Mediterranean. Science 2005, 309, 1068–1071. [Google Scholar] [CrossRef] [PubMed]
  66. Fernández-González, V.; Aguado-Giménez, F.; Gairin, J.I.; Sánchez-Jerez, P. Exploring patterns of variation in amphipod assemblages at multiple spatial scales: Natural variability versus coastal aquaculture effect. Aquac. Environ. Interact. 2013, 3, 93–105. [Google Scholar] [CrossRef]
  67. Karakassis, I.; Tsapakis, M.; Hatziyanni, E.; Papadopoulou, K.N. Impact of cage farming of fish on the seabed in three Mediterranean coastal areas. ICES J. Mar. Sci. 2000, 57, 1462–1471. [Google Scholar] [CrossRef] [Green Version]
  68. Ruiz, J.M.; Pérez, M.; Romero, J. Effects of fish farm loading on seagrass (Posidonia oceanica) distribution, growth and photosynthesis. Mar. Pollut. Bull. 2001, 42, 749–760. [Google Scholar] [CrossRef]
  69. Piedecausa, M.A.; Aguado-Giménez, F.; García García, B.; Ballester, G.; Telfer, T. Settling velocity and total ammonia nitrogen leaching from commercial feed and faecal pellets of gilthead seabream (Sparus aurata L. 1758) and seabass (Dicentrarchus labrax L. 1758). Aquac. Res. 2009, 40, 1703–1714. [Google Scholar] [CrossRef]
  70. Gowen, R.; Bradbury, N. The ecological impact of salmon farming in coastal waters: A review. Oceanogr. Mar. Biol. Annu. Rev. 1987, 25, 563–575. [Google Scholar]
  71. Gasca-Leyva, E.; León, C.; Hernádez, J.M.; Vergara, J.M. Bioeconomic analysis of production location of sea bream (Sparus aurata) cultivation. Aquaculture 2005, 213, 219–232. [Google Scholar] [CrossRef]
  72. Merinero, S.; Martínez, S.; Tomás, A.; Jover, M. Análisis económico de alternativas de producción de Dorada en jaulas marinas en el litoral Mediterráneo español. Rev. Aquat. 2005, 23, 1–19. [Google Scholar]
  73. Aguado-Giménez, F.; Piedecausa, M.A.; Carrasco, C.; Gutiérrez, J.M.; Aliaga, V.; García García, B. Do benthic biofilters contribute to sustainability and restoration of the benthic environment impacted by offshore cage finfish aquaculture? Mar. Pollut. Bull. 2011, 62, 1714–1724. [Google Scholar] [CrossRef] [PubMed]
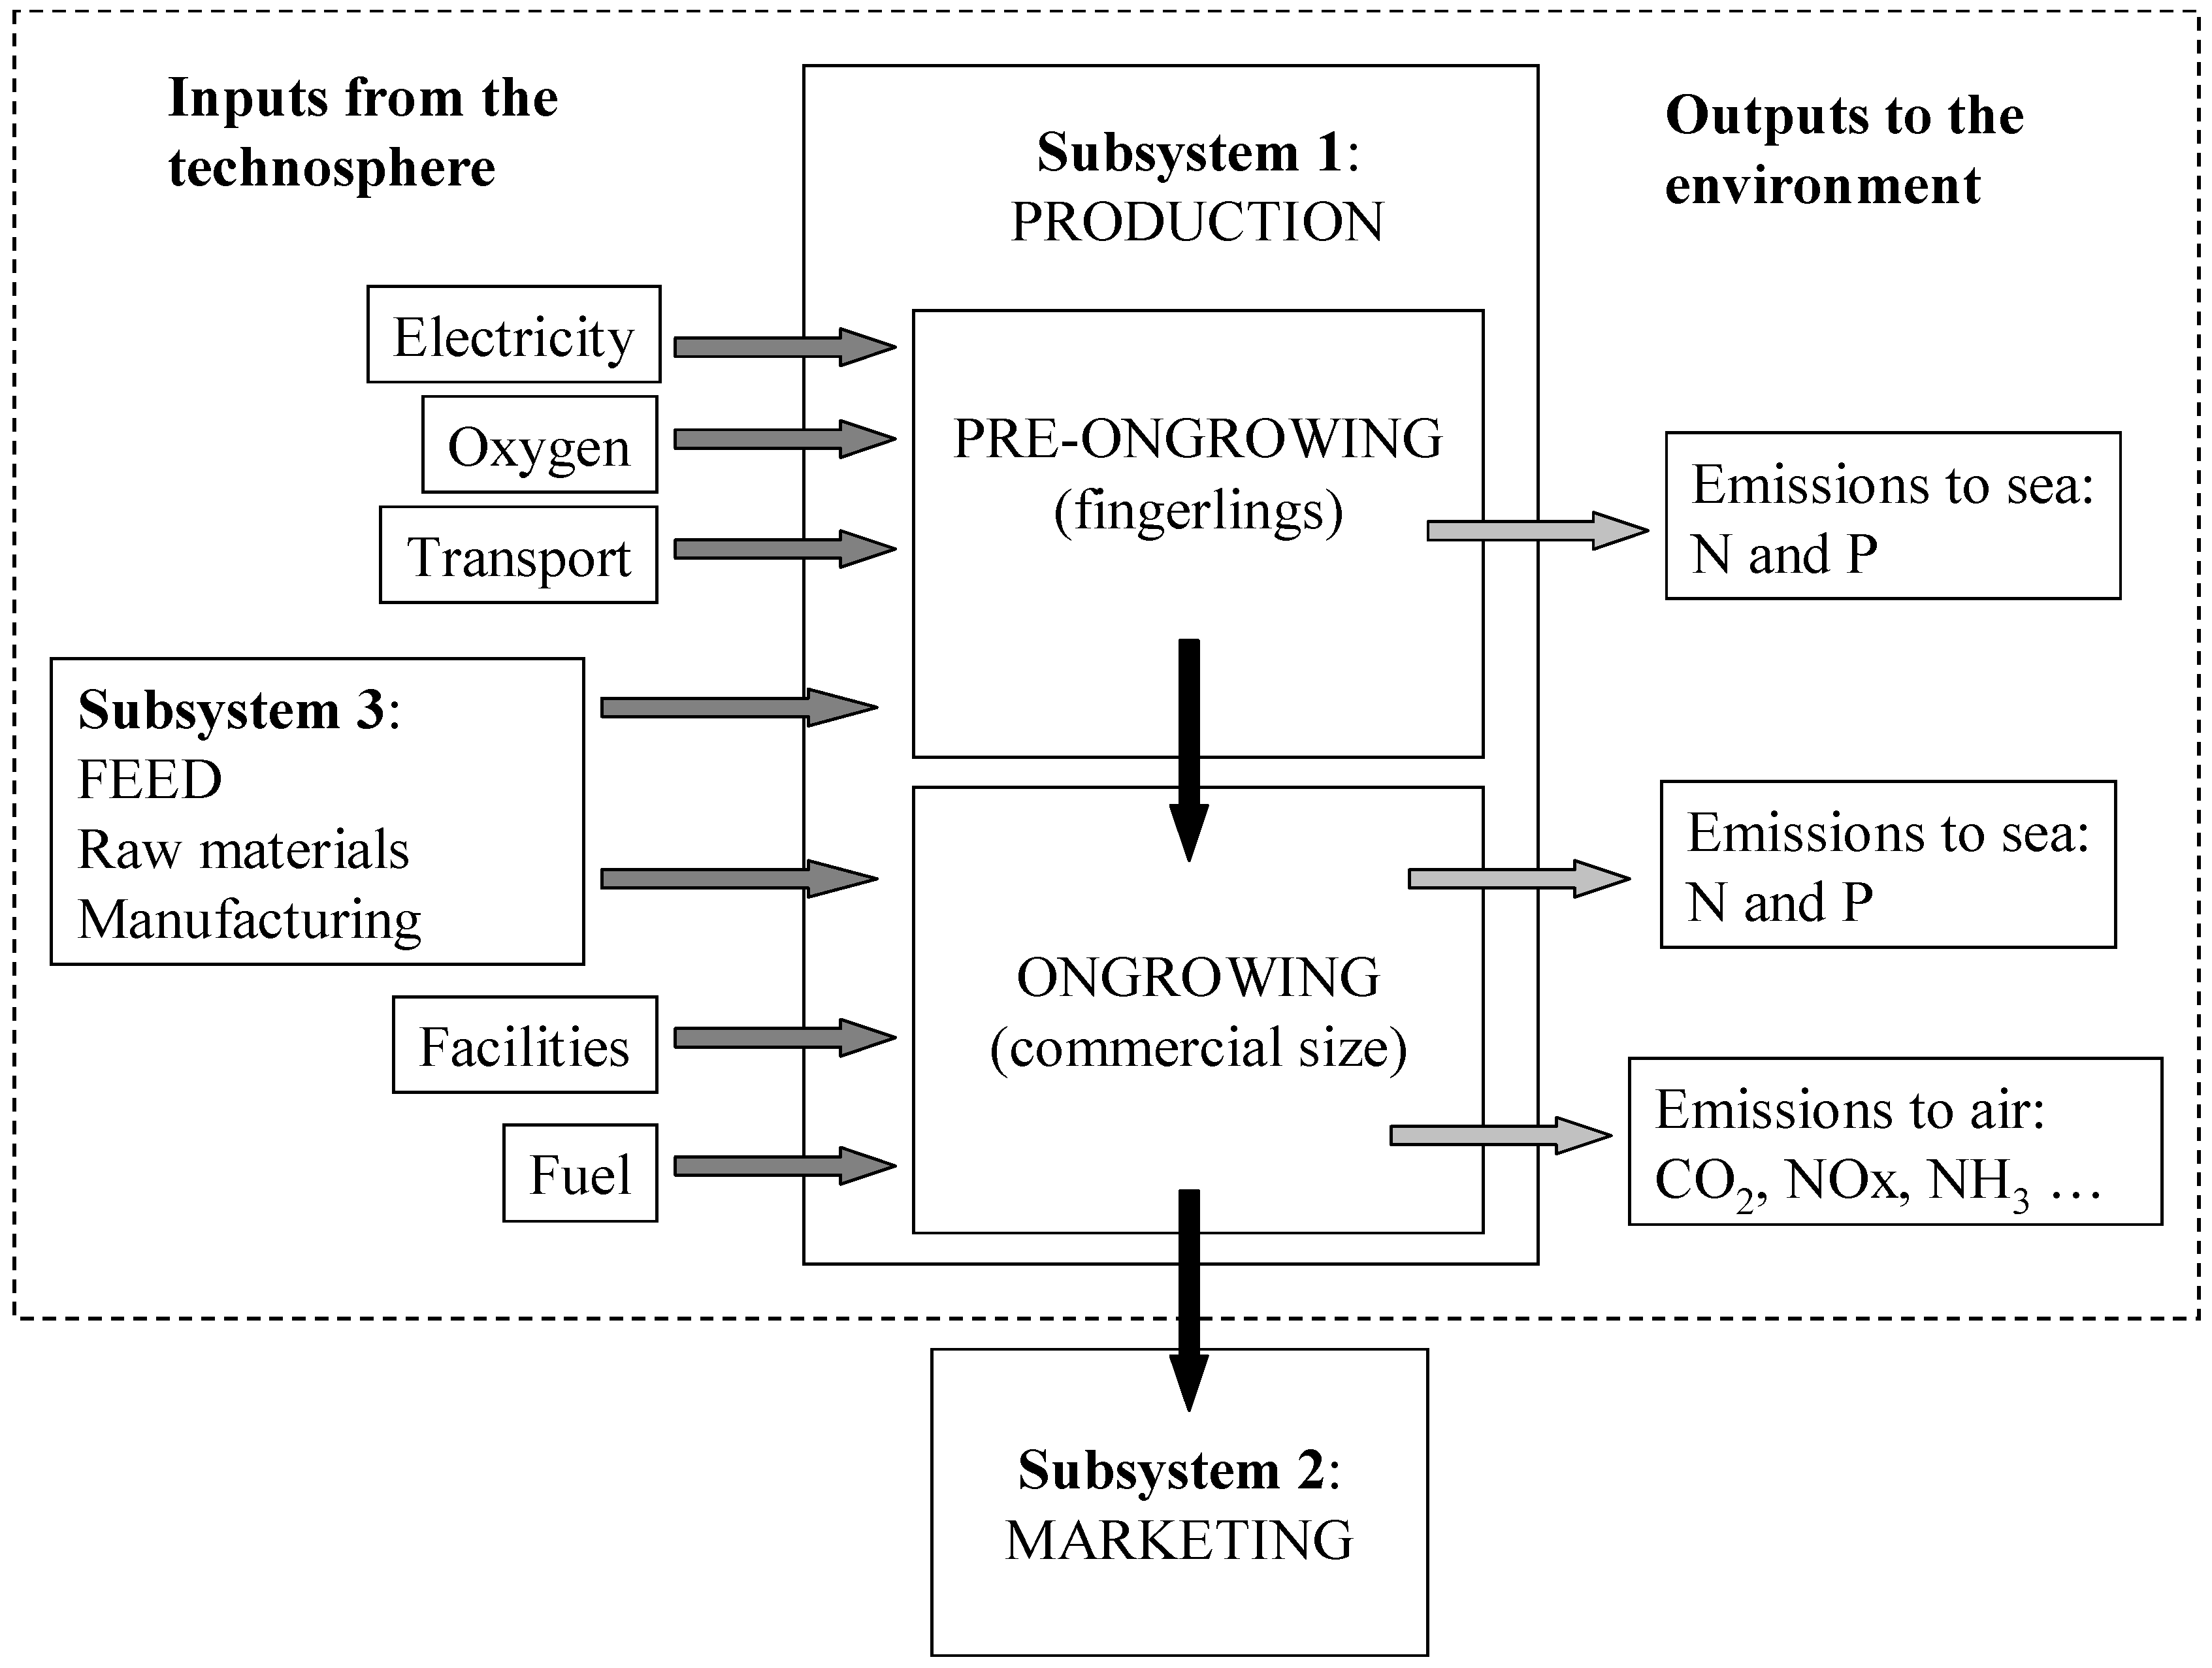
Figure 1. Subsystems and system components for the LCA of seabass production offshore. The dotted line shows the scope of the study.
Sustainability 11 03523 g001
Figure 2. Contribution of system components to different impact categories. AD: abiotic depletion; ADFF: abiotic depletion fossil fuels; GW: global warming; OLD: ozone layer depletion; HT: human toxicity; FWAE: fresh water aquatic ecotoxicity; MAE: marine aquatic ecotoxicity; TE: terrestrial ecotoxicity; PO: photochemical oxidation; A: acidification; E: eutrophication.
Sustainability 11 03523 g002
Figure 3. Contribution of feed components to the environmental impact categories.
Sustainability 11 03523 g003
Figure 4. Contribution of the different raw materials of the ongrowing feed to the impact categories.
Sustainability 11 03523 g004
Figure 5. Contribution of the sub-components of the pre-ongrowing system to the different impact categories.
Sustainability 11 03523 g005
Figure 6. Feed and diesel scenarios evaluated for the MRA.
Sustainability 11 03523 g006
Figure 7. GW based on feed supply and diesel consumed. Functional unit is 1 ton live-weight of seabass. The values of the three scenarios are shown within the circle: (1) Basic offshore fish farm, (2) most efficient scenario, and (3) least efficient scenario.
Sustainability 11 03523 g007
Figure 8. Comparison of the potential environmental impacts for three possible scenarios: (1) Basic offshore fish farm, (2) most efficient scenario, and (3) least efficient scenario.
Sustainability 11 03523 g008
Table 1. Characteristics of the feed used in the pre-ongrowing and ongrowing of seabass.
Raw Materials (kg) (1 t Feed)Pre-OngrowingOngrowingOrigin
Wheat130130Spain
Fish meal490200Peru [41]
Soybean meal15021076% Brazil, 21% the USA
Wheat gluten meal5015050% Spain, 11% France, EU
Corn gluten meal50110France
Fish oil4090Peru [41]
Soybean oil404076% Brazil, 21 the USA
Rapeseed oil405090% France, EU
Vitamins and mineral1010
Monocalcium phosphate5Ecoinvent
Amino acids5[42]
Manufacture of feed (1 t)[7]
Chemical composition
Protein (%)50.142.1
Lipids (%)18.421.5
N (%)8.16.7
P (%)1.21.1
Nutritional indexes
Gross energy (MJ)214222
Protein/Energy23.519.0
FCR1.51.9Confidential surveys
ADCN (%)94.5295.35[43]
ADCP (%)41.4051.70[43]
The data of the raw materials come from Agri-footprint, unless another source is indicated. ADC; Apparent digestibility coefficient. EU: Other European countries. FCR: kg of feed supplied·kg−1 of live weight of fish produced.
Table 2. Calculation of electricity and oxygen for the production of 1 kg of fingerlings during the pre-ongrowing phase.
BW (g)SOC (mg O2·kg−1·h−1)SWF (L·kg−1·s−1)OS (g O2·kg−1·h−1)Q (kwh)
0.519070.057921.173340.00834
1.012830.038980.789540.00561
5.05140.015630.316550.00225
10.03480.010570.214110.00152
15.02770.008420.170470.00121
Average8660.026300.532800.00379
Time (Days)Electricity (kw·h)Oxygen (g O2)
1 kg of fingerlings908.181151
BW: Body weight.
Table 3. Data of system components in the pre-ongrowing phase. Functional unit: 1 kg of live weight of fingerlings (15 g).
System ComponentsValuesObservations
Feed (kg)1.5Raw materials, manufacturing and transportation
Electricity (kw·h)8.18Pumping seawater to the culture tanks
Oxygen (g O2)1151Supply of oxygen to the culture tanks
N emission (g)97.2991.71 dissolved, 5.58 particulate
P emission (g)13.074.42 dissolved, 8.64 particulate
Transport by truck (kg·km)1813.3634% of 5333.42 kg·km
Oxygen in the truck (g O2)0.3934% of 1.15
Transportation by boat (kg·km)3777.1866% of 5723 kg·km
Oxygen in the boat (g O2)3.5966% of 5.44
Table 4. Inputs and outputs for the production of 1 t live-weight of seabass in the basic offshore fish farm.
Input Pre-OngrowingOutput Pre-Ongrowing
Feed (kg)56.25Fingerlings (kg)37.50
Electricity (kw·h)306.75
Oxygen (kg O2)43.16Emissions to sea water
Transport by truck (kg·km)68,001N (kg)3.65
Oxygen in the truck (g O2)14.63P (kg)0.49
Transport by boat (kg·km)141,644
Oxygen in the boat (kg O2)134.63
Input OngrowingOutput Ongrowing
FacilitiesCommercial seabass (kg)1000
Polyethylene (kg)21.028
Polystyrene (kg)0.294Emissions to sea water
Nylon (kg)5.037N (kg)105.27
Polypropylene (kg)5.675P (kg)17.21
Polyurethane (kg)0.084
Polyvinylchloride (kg)0.026Emissions to air
Concrete block (kg)1.067CO2 (kg)1622.270
Cast iron (kg)2.000NOx (kg)30.169
Steel, low-alloyed (kg)1.623CO (kg)4.091
Steel, chromium steel (kg)2.318NMVOC (kg)1.329
VOL (kg)1.381
Feed (kg)1900PM10 (kg)0.716
CH4 (kg)0.056
FuelSO2 (kg)2.812
Diesel (kg)511.34N2O (kg)0.041
Lubricating oil (kg)1.44NH3 (kg)0.005
Table 5. Monte Carlo uncertainty analysis of the potential environmental impacts (PEIs) in the basic offshore fish farm (BOFF); 1 t live-weight of sea bass.
PEIEquivalency UnitMeanSDCV (%)95% CISEM
ADkg Sb-eq0.001810.0002413.160.001450.002390.000008
ADFFMJ72,59165869.0761,82387,068208
GWkg CO2-eq72931552.13703776494.90
OLDkg CFC-11-eq0.000620.0002234.830.000360.001190.000007
HTkg 1,4-DB-eq837748.8772410102.35
FWAEkg 1,4-DB-eq5146913.464286612.19
MAEkg 1,4-DB-eq1,003,519169,74016.91739,2401,409,0415368
TEkg 1,4-DB-eq11.990.413.4311.4712.980.013
POkg C2H4-eq12750.0554.2811951.4090.0017
Akg SO2-eq44.151.413.1942.0647.580.045
Ekg PO−4-eq115.230.390.34114.68116.140.012
SD: standard deviation; CV: coefficient of variation; CI: confidence intervals; SEM: standard error of the mean.
Table 6. Results of MRA. PEI = a + b × F + c × D. n = 13, degree of freedom = 11. SE: Standard error. RSE: Residual standard error. UF: 1 t live-weight of sea bass.
PEIabcR2adjANOVA
SESESERSEF-Statistic
p-Levelp-Levelp-Levelp-Levelp-Level
AD (kg Sb-eq)5.38E-045.82E-043.50E-0714.90E+07
1.31E-076.30E-089.86E-116.43E-080.001
0.0010.0010.001
ADFF (MJ)5.92E+032.08E+045.34E+0118.60E+06
2.00E+019.63E+001.51E-029.82E+000.001
0.0010.0010.001
GW (kg CO2-eq)4.53E+022.60E+033.74E+001
1.40E+006.74E-011.06E-030.69E+001.37E+07
0.0010.0010.0010.0010.001
OLD (kg CFC-11-eq)2.61E-051.27E-046.87E-071
2.57E-071.24E-071.94E-101.26E-076.81E+06
0.0010.0010.0010.001
HT (kg 1,4-DB-eq)2.87E+022.25E+022.30E-011
8.62E-024.14E-026.49E-054.23E-022.11E+07
0.0010.0010.0010.001
FWAE (kg 1,4-DB-eq)1.24E+021.87E+027.37E-0211.05E+08
2.76E-021.33E-022.08E-051.35E-020.001
0.0010.0010.001
MAE (kg 1,4-DB-eq)4.05E+052.50E+052.56E+0212.10E+07
9.60E+014.61E+017.22E-024.71E+010.001
0.0010.0010.001
TE (kg 1,4-DB-eq)1.03E+005.50E+009.56E-041
3.58E-041.72E-042.70E-071.76E-045.16E+08
0.0010.0010.0010.001
PO (kg C2H4-eq)1.09E-013.94E-018.17E-041
3.07E-041.47E-042.31E-071.50E-049.86E+06
0.0010.0010.0010.001
A (kg SO2-eq)2.41E+001.08E+014.18E-021
1.56E-027.51E-031.18E-057.66E-037.31E+06
0.0010.0010.0010.001