Article

A Comparative Study of User Behaviors on Unimproved and Improved Street Spaces in Da Nang, Vietnam

1
Graduate School of Engineering, Hokkaido University, Sapporo 060-8628, Japan
2
Faculty of Engineering, Hokkaido University, Sapporo 060-8628, Japan
*
Author to whom correspondence should be addressed.
Sustainability 2019, 11(12), 3457; https://doi.org/10.3390/su11123457
Submission received: 28 May 2019 / Revised: 12 June 2019 / Accepted: 13 June 2019 / Published: 24 June 2019

Abstract

:
The shortage of open spaces in developing countries in Asia such as Vietnam has been a thorny question for urbanists. Due to a poor history of public spaces, people tend to use street spaces as open spaces and other functions that bring chaos and danger onto the streets. Although developed countries in the West have overcome the dangers of life on street spaces to some extent, Vietnam, with its low quality of life, retains its inherent street bustle. Street improvements have been carried out to enhance the quality of urban life. This research aims at comparing improved and unimproved street spaces in various aspects, including user behavior and the environment-behavior relationship within street spaces and their surroundings. The findings contribute to the future improvement of street spaces in Vietnam and other developing countries based on theories of Environment-Behavior Studies. Through this research, the street renovation and development idea can be processed in a distinctive manner that appreciates the cultural and social context instead of being derived from the arbitrary or intuitive ideas of designers. By using various observation methods such as centered behavioral mapping (PcBM) and visual encounter surveys (VES), and statistical analysis such as principal component analysis (PCA) and cluster analysis (CA), the findings show that a total of eight physical attributes need consideration during street renovations or development processes. Improved and unimproved street spaces share two attributes and differ in six attributes. Additionally, three environment-behavior patterns support the implications detailed in this paper. Finally, a suggestion for street space development and management is made to support related authorities and urbanists in future projects; it is hope that this research will contribute to creating more livable and sustainable street environments.

1. Introduction

1.1. Background

There is a growing concern about the quality of the public environments of cities, and substantial public and private resources have been devoted to enhancing urban open spaces in recent decades. Open spaces are a vital environmental component of urban landscapes, providing the space that is appropriate for most common community activities [1,2]. Urban open space provides various advantages by offering an environment that mitigates stress, promotes recovery from mental and physical health issues, and encourages an active lifestyle as compared to a sedentary lifestyle [1,3,4]. Urban open spaces also play a significant role in creating social cohesion and interactions, fostering economic benefits from tourism, reducing diseases and health care costs, and improving the quality of life [1,5,6,7,8,9,10].
Jacobs (1961) emphasized the importance of the usage of open spaces that can be considered a vital criterion for a successful place [11]. Indeed, usage, or livability, is a dimension which is often employed to measure the success of open space [12,13]. An open space is not successful when it is empty or vandalized [13,14]. Montgomery (1998) believed that active and vibrant urban spaces are associated with competence in management, development, and design [15]. He referred to the terminology of urbanity to describe the city filled with activities, street life, and urban culture [15]. Designing, developing, and managing urban open spaces require an understanding of the characteristics of urban spaces and of their users. Buchanan (1988) believed that places are not just spaces with physical attributes, but that they accommodate different activities and interactions that take place and provide an opportunity for using such places [16]. Recently, the advances in research on the quality of urban life have developed an assessment framework with a more informed, coherent and transparent evaluation system. This assessment model consists of a number of variables involving various respects such as health and safety, happiness, transportation and services, environment and surrounding spaces and biodiversity, and so on [17]. It contributes a theoretical framework to building a sustainable environment and to enhancing the quality of life. Accompanying these studies, in a quantitative approach, such urban indicators as green landscapes, urban sprawl, fragmentation, spatiotemporal, and density are also proposed to diagnose urban transformation problems from a range of perspectives [18].
As one of multifunctional spaces in a city, street space is common open space in a city that does not serve only as traffic function that connects urban environment elements together; it also serves as a place for social interactions, community engagements, and daily activities such as trading, physical exercises, active travel, and private use [19,20,21,22,23,24,25]. Vietnamese contemporary society has been influenced by Western countries in constructing pseudo-public spaces [26]. Nevertheless, urban residents often tend to use streets and sidewalks for their leisure and daily habits [26]. By the pressure caused by urbanization, the number of open-green spaces is decreasing rapidly in urban areas [27]. Local governments implement street space improvements as an affordable way to alleviate open space shortages [28].

1.2. Theoretical Background and Previous Studies

There have been growing concerns globally regarding open space development. The relationship of humans and the environment in various respects has been studied by many scholars around the world. The field theory of Lewin (1943) stated that human behavior is the result of the interaction between people and their environment [29]. Similarly, Hillier (1989) stated that the environment is not the background of human activities, but their nature; the environment is the mechanism in which human behavior is affected [30]. Behavior setting showed that the observable environment exists independently of the psychological processes of any particular individual [31]. He defined a behavior setting as a standing pattern of behavior synomorphic and circumjacent to the milieu [31]. A behavior setting includes a standing pattern of behavior that is tied to a particular place and that occurs at regular intervals [32]. Barker (1968) emphasized that behavior setting is considered a stable combination of human activities and the environment, and he also offered a behavior setting conceptual framework to examine the relationship between the environment and behaviors, encouraging the understanding of user needs to be observed and surveillance in the daily living environment [31].
User perceptions toward urban open spaces such as street spaces that have been studied point out the multidimensional nature of the accessibility concept and behavior setting. Lang (1987) indicated four characteristics, i.e., a recurrent activity, a particular layout of the environment, a congruent relationship between activity, and a specific time period, compose the behavior setting [33]. Wicker (1992) considered that a small-scale social system bounded by time and place and composed of people and physical objects can be seen as a behavior setting (Wicker 1992). It is clear that behavior setting analysis was used to investigate the comprehensive variables associated with people’s activity and environment setting. Byrne and Wolch (2010) reckoned that user perceptions of open space accessibility are closely related to user characteristics and environment features; Wang (2015) empirically studied integrated park accessibility between two comparable parks based on different socioeconomic statuses [34]. The findings show the multidimensional nature of accessibility including both physical and non-physical dimensions that significantly contribute to open space user cognition. Moreover, the cultural and socioeconomic differences of users also affect perceived open space usage and access that need further research specifically for each group [35]. The research findings of Wang (2015) showed that the socioeconomic variables significantly affect perceived open space access, while other studies address the difference between demography, culture context, and open space cognition and usage [36]. However, the findings only address the urban open space in a Western context and in developed countries.
Developed countries have studied urban open spaces and then obtained certain achievements that contribute to human wellbeing. Meanwhile, with dissimilar urban structures, economies, cultures, and societies, developing countries in Asia tend to base their development on the existing achievements of Western nations [26]. In Vietnam, because of the shortages of open space in cities, authorities exploit the street space as an urban open space to fulfill inhabitants’ needs [27,37,38]. The Western archives in open space design were set up to provide attractive and well-organized space for people. Unlike Western urban areas that are an attempt to revive activities in street spaces, Vietnam’s counterpart is trying to meet human needs for complicated uses in the space [26]. Indeed, campaigns for the renovation and upgrading of urban street space are organized to serve human activities and restructure street space uses at the human and urban scales (i.e. adding street furniture, upgrading pavements, widening sidewalks, or providing visual objects). However, the daily routines of Vietnamese people, in fact, enable the boundary between urban public and private space to be encroached upon [26,39] (i.e., residents use too much public space for trading or private activities; they even encroach on pavements and roadways for those activities). In Vietnam, there is a never-ending dispute between the government and residents or between citizens to gain control of the street space which has socioeconomic dimensions [40]. Consequently, street space is not simply a place for relaxation or traffic, but also for economic activities [41].
Also, studies based on the understanding of the relationship between an environment and user activities have been conducted in developed countries to renovate and upgrade street spaces, while research on street spaces in Vietnam is mostly theoretical and based on subjective ideas or randomly collected opinions from foreign countries [42,43]. A few studies on open street spaces were carried out in Vietnam by Do (2018) with the purpose of determining physical elements that caught user attention along the street and revealed relationships between user activities and the street environment [28,39]. This paper will provide further research to clarify street space user behaviors associated with the surrounding environment in improved and unimproved street spaces to find qualities in urban streets in Vietnam that may contribute to and preserve the local identity and community.

1.3. Objective and Research Questions

This study was conducted on an improved and an unimproved street in Da Nang, Vietnam that have equivalent and comparable features (i.e., length, population density, and urban context). This investigation aims to empirically examine how street spaces are used and to compare the characteristics and problematic aspects of public open spaces in contrasting types of streets. Specifically, this research explores and examines the difference in user behaviors on two types of streets using place-centered behavioral mapping and visual encounter surveys. Furthermore, the difference in behavioral distribution according to street environments is also compared. This systematic observation provides a better opportunity to empirically understand which physical environment elements contribute to the usability of streets in Vietnam. The findings contribute to street improvements and the enhancement of local daily activities in the studied city, other cities in Vietnam, and other developing countries with similar social contexts.
This study attempts to clarify the research questions by comparing results between two different streets. (1) Does the behavior setting pattern along street spaces differ between improved and unimproved streets? (2) What is the difference in the behavioral distribution corresponding to the environment between improved and unimproved streets? These findings contribute to the proposals, frameworks, and guidelines on street space improvement, management, and development to satisfy user needs and support urban community sustainability and the quality of life.

2. Materials and Methods

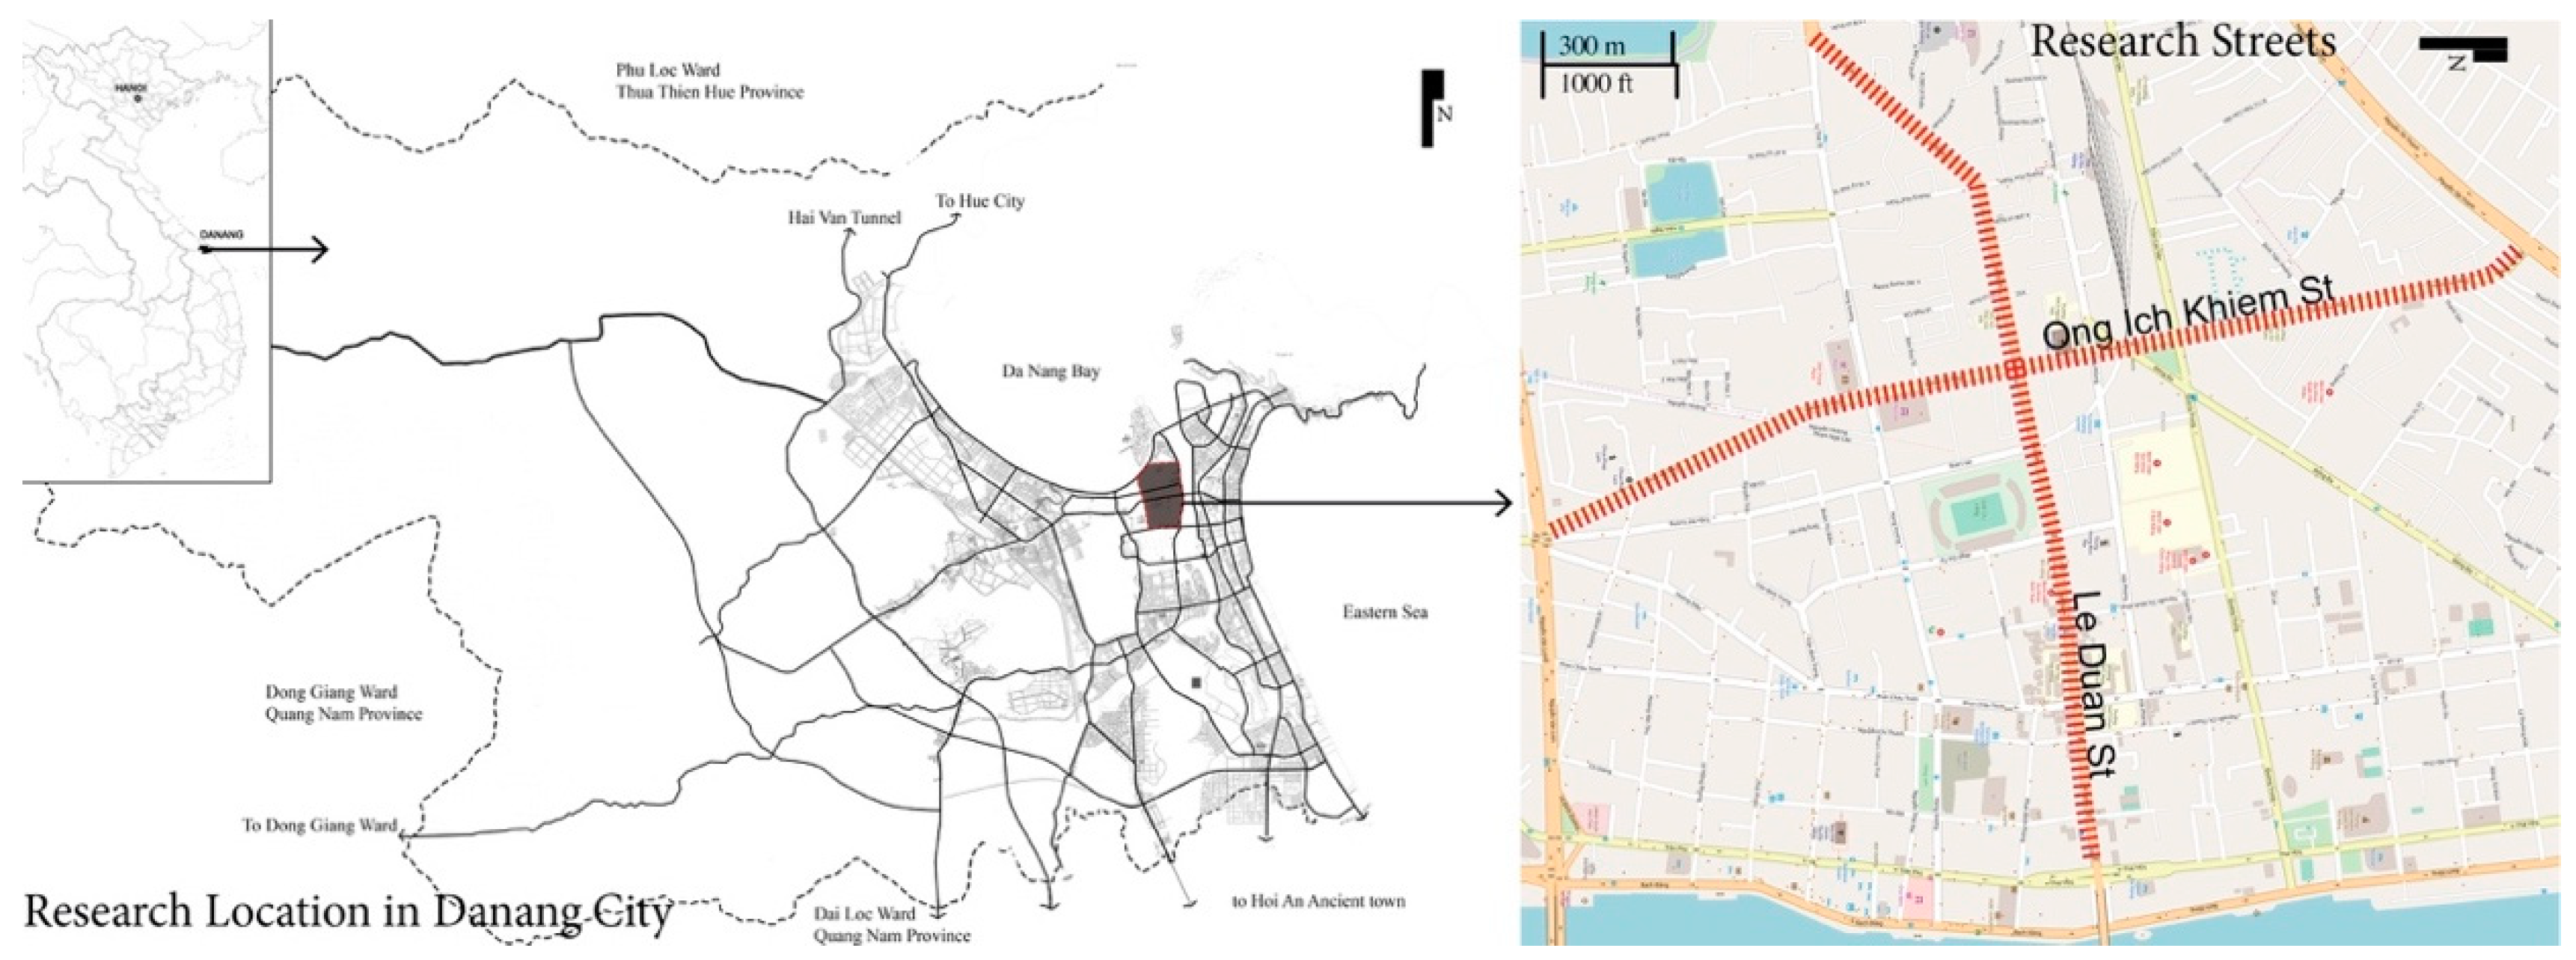
2.1. Da Nang and Street Space Improvement Overview

Da Nang was originally a colonial city that became a military center during the Vietnam war. After the Independence Day, the “Open Door” policy was implemented, leading to the rapid development of cities all around the country, including Da Nang. After 1997, Da Nang became one of three major cities in Vietnam and the biggest city in the central region and central highlands.
Da Nang streets were constructed in accordance with old standards of French or American colonial periods to mainly serve transportation purposes. Currently, due to high population and construction density, the former street spaces are not appropriate for a contemporary city. Therefore, the upgrading of Vietnam’s street spaces was launched in two main stages. Firstly, streets were enhanced by the installation of amenities which are common elsewhere in the world, such as paving sidewalks, arranging signs, traffic lights, and streetlights, and drawing parking lines with pedestrian crossings. Secondly, pilot projects were implemented and are being considered for mass implementation, such as expanding streets, improving pavement quality by using higher quality surfaces finishes, growing trees and greenery, arranging visual objects and benches, and managing vendors, traditional trading, and personal activities. With its characteristics and strong potential application, Da Nang can be seen as a pilot model for the improvement or development projects in other street spaces in Vietnam.

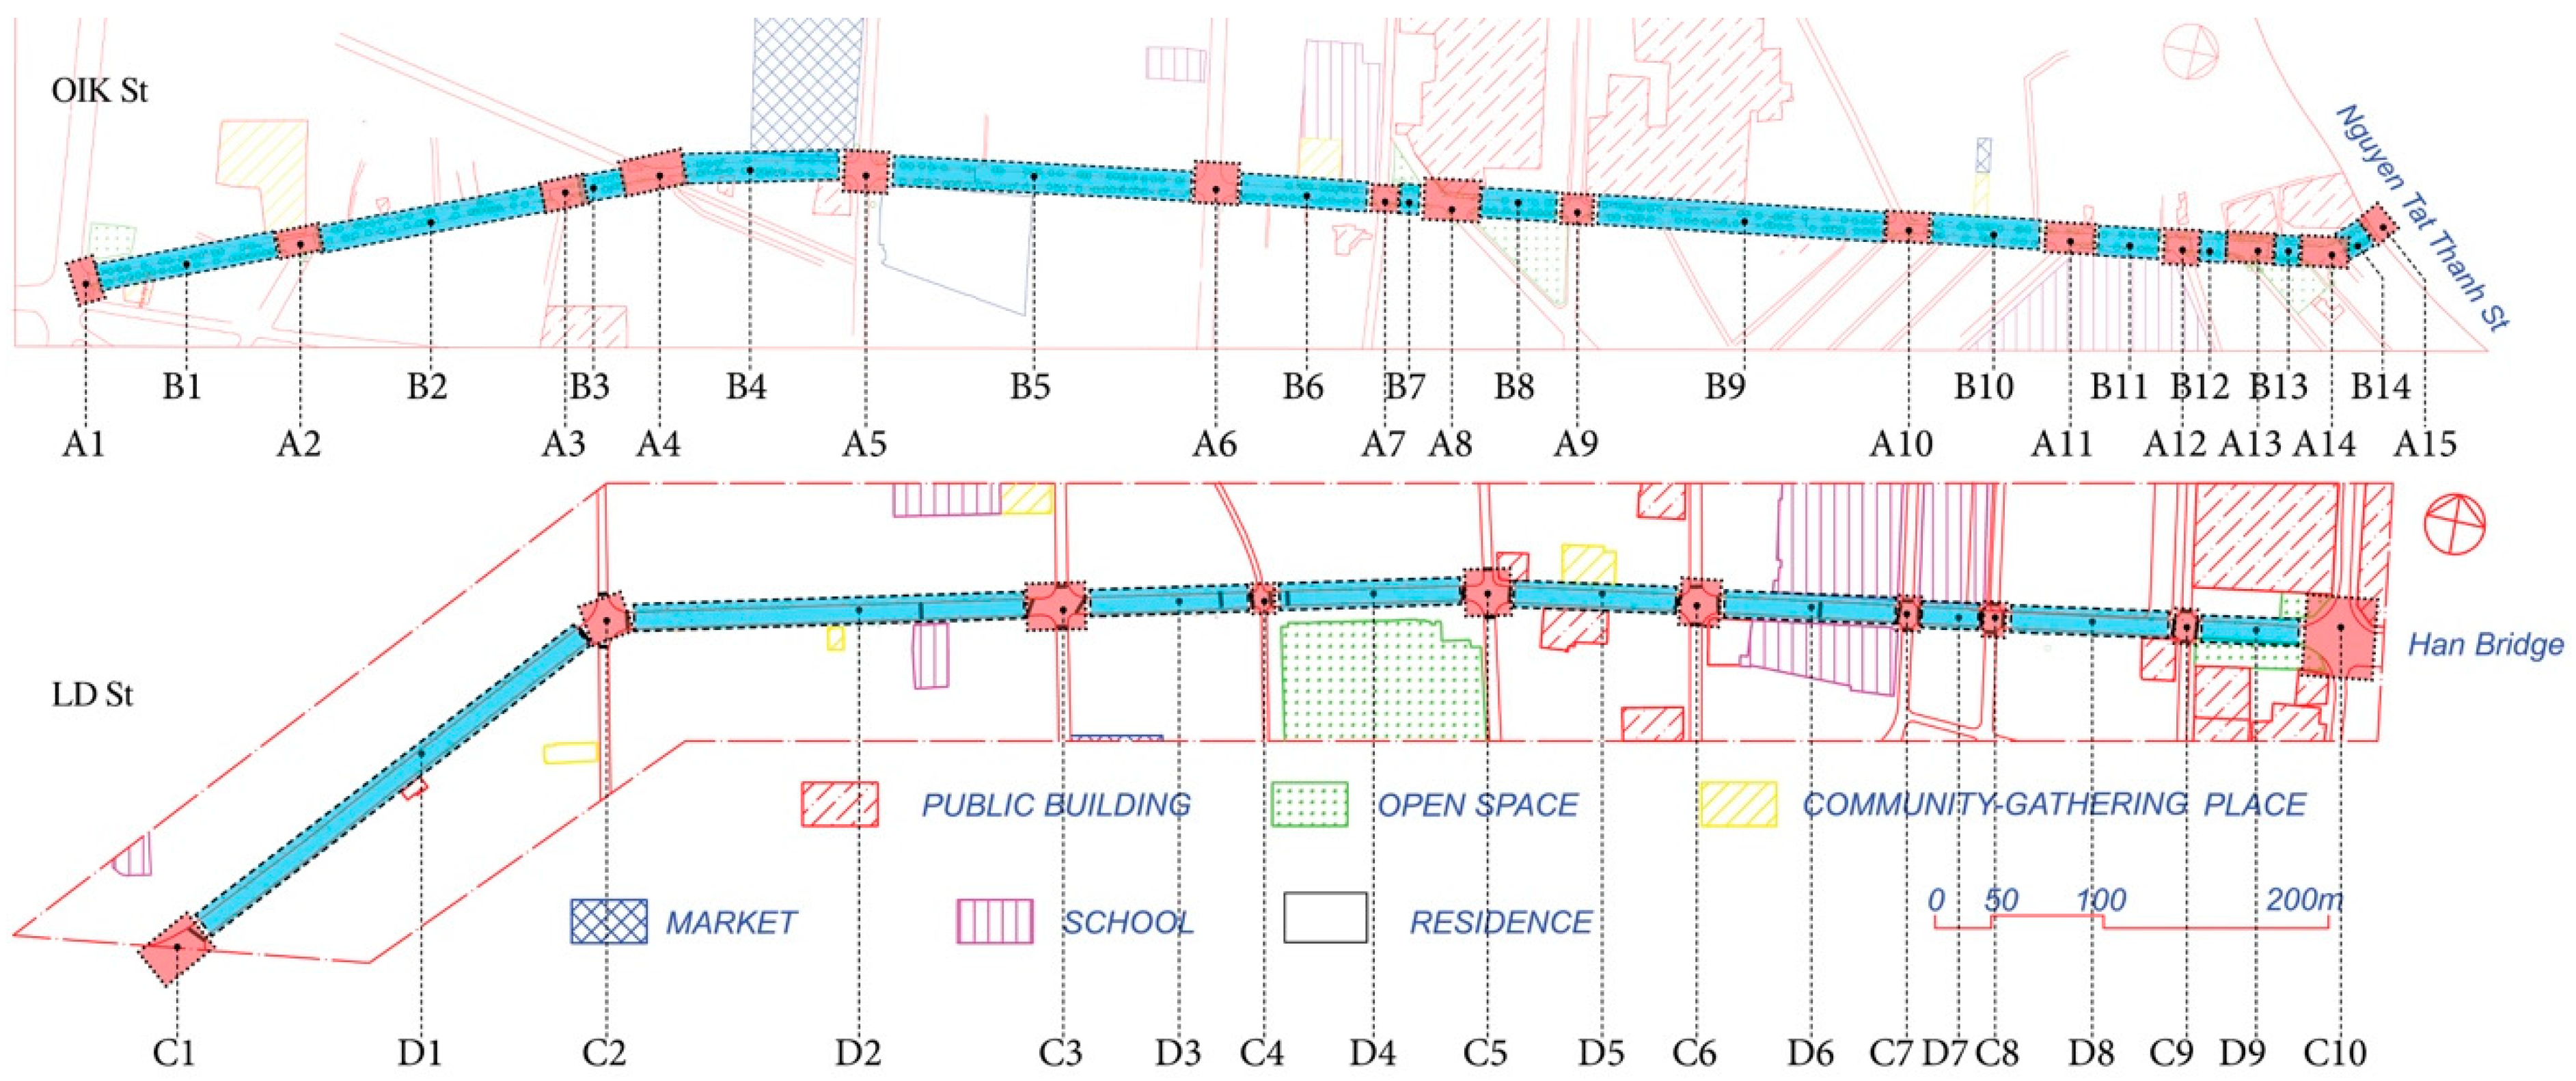
2.2. Street Sampling

Street sampling was based on the authors’ former research using a screening survey to narrow street candidates. The screening survey consisted of a questionnaire survey and extreme value analysis of street spaces in six districts of Da Nang. A set of 598 questionnaires were randomly collected from a population of users from 14 to 87 years old (M = 28.5; SD = 9.7) with occupational diversity. Of a total of 203 streets, 114 were marked by users as positive and 89 were marked as negative. According to the definition of a street, nine roads with movements of heavy vehicles were excluded from the candidate list. Extreme value analysis based on the purposes of this research and high user ratings shortened the candidate list to 33 streets. The 33 streets were then classified as improved or unimproved streets based on the upgrading street space policy of the local government. Eventually, Le Duan Street (LD St), an improved street, and Ong Ich Khiem Street (OIK St), an unimproved street, were chosen for this research (Figure 1). Table 1 illustrates the characteristics of the two streets and describes their comparable physical features such as street type, length, width, land use, and setback.

2.3. Outline of Investigation

This survey was conducted by (1) collecting user behaviors using place-centered behavioral mapping (PcBM) and (2) collecting entire street environment and user surrounding environment using visual encounter surveys (VES).
To collect behavior setting patterns that occurred on the streets, all activities and environmental features including physical and non-physical features resulting from the impacts of physical settings were observed for three different time frames consisting of morning (6am-9am), noon (11am-2pm), and afternoon (4pm-7pm) on two weekdays and two weekends. This survey was divided into two stages. Firstly, the observation of current construction and the kinds of physical settings on the streets was conducted and mapped out. Secondly, all user street behaviors were recorded on paper-based maps based on PcBM and VES (Figure 2). Place-centered behavioral mapping (PcBM) was used to make a graphical representation of the study location, divided into different segments. The observation contains photographs or time-lapse recordings of behaviors and positions of people in each segment. This type of observation is considered more suitable for the study of a particular physical space [44]. Visual Encounter Survey (VES) method, formalized by Campbell & Christman (1982), was used to document the presence of individuals to provide both quantitative and qualitative data [45]. Researchers walked through a designated area for a prescribed time and performed a visual observation. Observation of the physical environment and user behaviors on the two streets was conducted as follows: (1) For OIK St, observation was conducted on May 4th (Friday) and May 5th (Saturday) using VES method that requires observers to walk along the street to collect all data regarding current situation of street environment such as physical setting, audio, and scent (Figure 3). Behavior mapping was collected by PcBM on two weekends and two weekdays: May 12th (Saturday), May 19th (Saturday), May 15th (Tuesday), and May 17th (Thursday) in 2018 that recorded all user behaviors in physical, social, and stationary terms; (2) For LD St, the aforementioned observations were carried out on January 7th (Monday), January 8th (Tuesday), January 10th (Thursday), January 13th (Sunday), January 14th (Monday), and January 19th (Saturday) in 2019. Participants in one certain activity were considered as an activity unit. Although two different observation batches were conducted, the variation caused by weather and seasonal factors had less influence on field survey results due to tropical monsoon climate’s characteristics with two distinct seasons: a typhoon/wet season starts from September to December and a dry season from January to August [46]. Indeed, May and January falls into the dry season of Da Nang city in which the average precipitation (mm) that is almost the same 85 (Jan) and 84 (May) [47].

2.4. Data Processing

2.4.1 User Behavior Findings and Street Environment Division

User behaviors were determined based on their actions within their personal environment. Behavior categories were then classified based on behavior setting that was first coined by Roger Barker and Herbert Wright (1955). This theory aims at expressing the complex combination of human behavior and the physical environment. In addition, according to the understanding of the term “personal space” given by Edward T. Hall [48] in his Proxemics theory, the definition of user behavior was clarified (Figure 3). Because the physical environment and user behavior are indissolubly connected as the nature of behavior setting theory [31,49,50], street environment characteristics can be divided into sections (Figure 4) that accommodate user behaviors. Among the various sections, the two main kinds are the A (OIK St) and C (LD St) sections, which refer to the space where two or more streets intersect (excluding small alleys as they do not attract non-motorized traffic movement) and the B (OIK St) and D (LD St) sections, which refer to segments where houses are on both sides of the street.

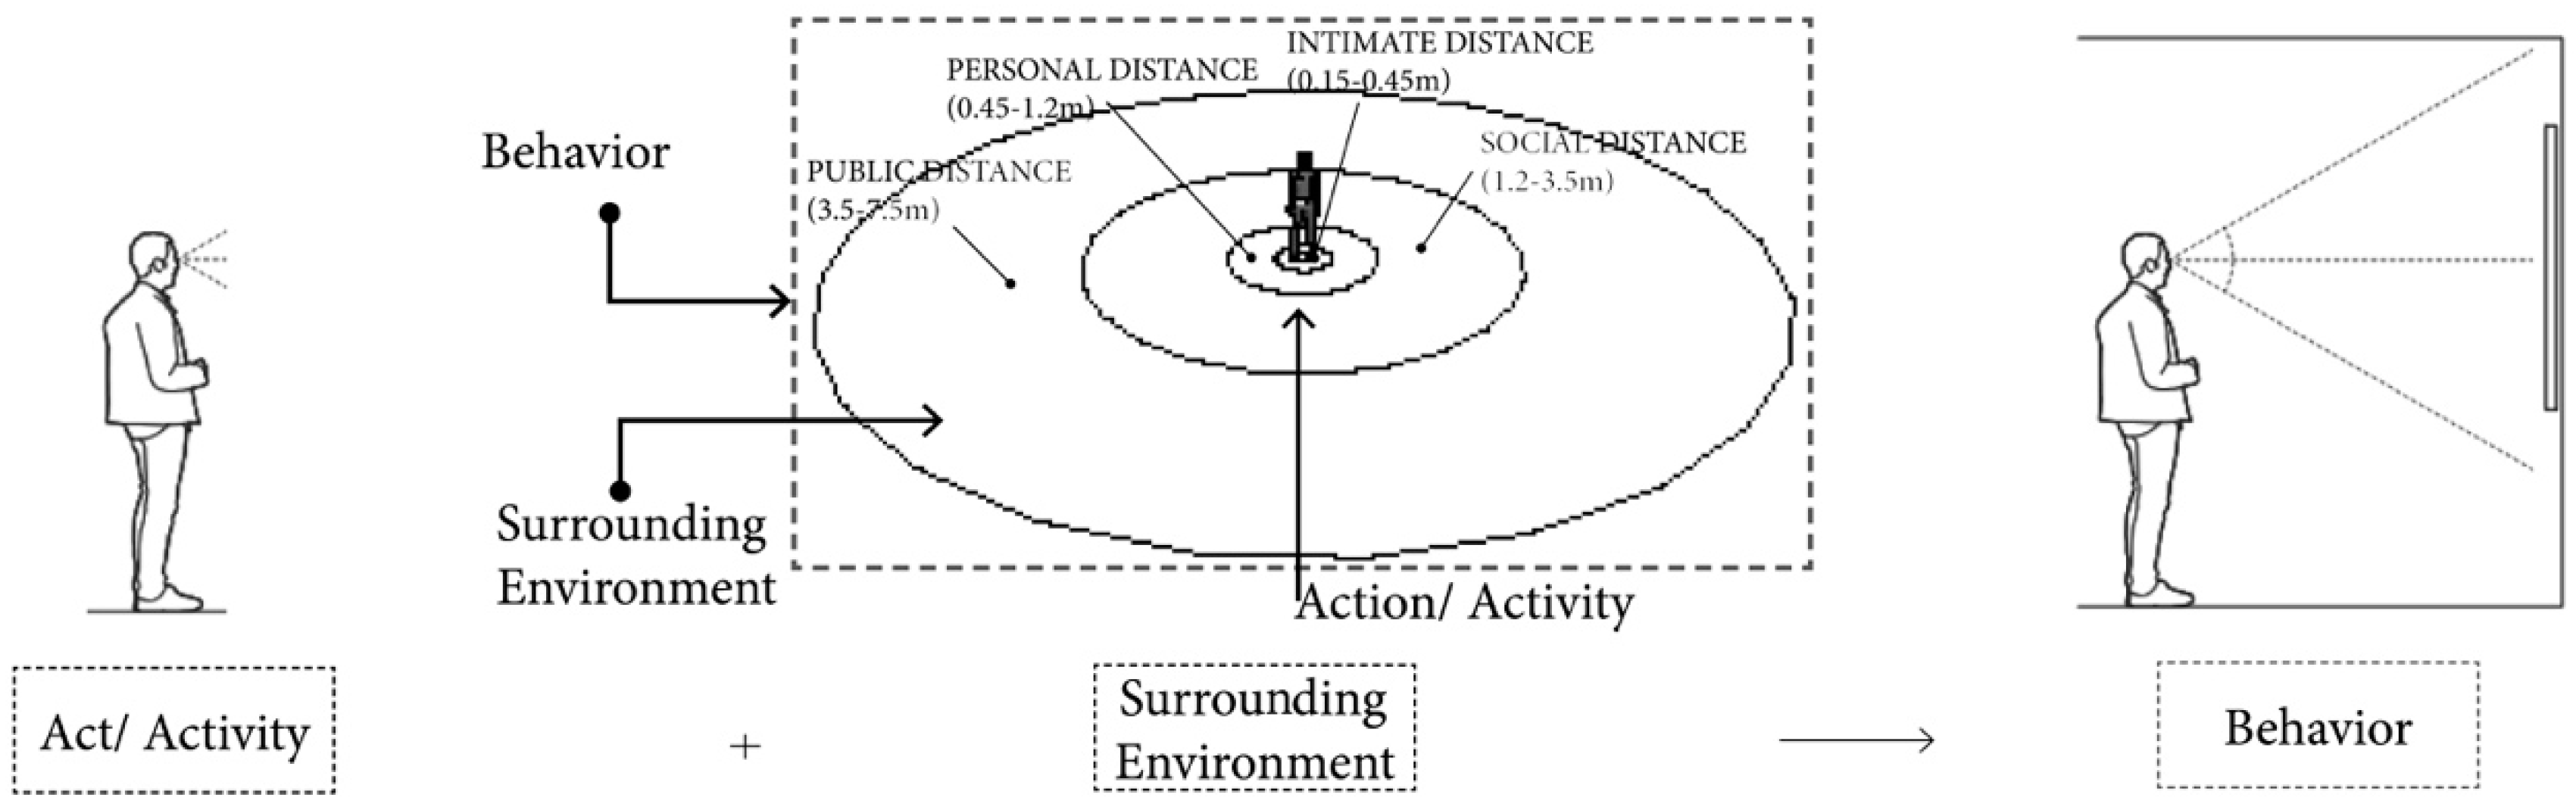
2.4.2. Statistical Analysis and Comparative Study

The principal component analysis (PCA), which is a dimension-reduction tool, was applied to reduce a large set of variables to a small set that still contains most of the information in the large set [51]. It is a statistical procedure that uses an orthogonal transformation to convert a set of observations of possibly correlated variables into a set of values of linearly uncorrelated variables. The results of a PCA are normally discussed in terms of component scores or factor scores (the transformed variable values corresponding to a particular data point), and loadings (the weight by which each standardized original variable should be multiplied to get the component score) [52]. Hence, by applying this method, the physical environment of each section of the street was clarified. Then, a cluster analysis (CA) was conducted to classify different categories of space based on its physical characteristics [53,54]. Cluster analysis is the task of grouping a set of objects in such a way that objects in the same group are more similar to each other than to those in other groups. Finally, a comparative analysis was conducted between different kinds of space and various behaviors to comprehend the distribution of behavior within the street environment and the difference between improved and unimproved streets.

3. Results

3.1. User Behavior Finding

All user behaviors along both types of streets were classified into six main categories, with 26 subcategories (Figure 5). There was no difference in the categories of behaviors between the two types of streets.
The “accessibility” category includes behaviors defined as physical activities in reaching a destination by hoof, motorized vehicle, or non-motorized vehicle. This category consists of 3 subcategories: (1) “crossing road” is the act of going across the other side of the street regardless of being allowed to or not; (2) “walking to a destination” is the act of moving along the street on the sidewalk or roadway by hoof; (3) “coming/leaving with motorcycle/without motorcycle” is the act of moving onto the sidewalk from traffic movement on the road or vice versa.
The group of “trading” behaviors consists of 4 subcategories: (1) “fixed food transaction” refers to the trading of food at a fixed location on the sidewalk; (2) “food transaction mobility” refers to the mobile trading of food along the sidewalk or roadside; (3) “goods transaction fixed” refers to the trading of consumer goods or unprocessed food at a fixed location on the sidewalk; and (4) “goods transaction mobility” refers to the trading of consumer goods or unprocessed food along the sidewalk or roadside.
The “idling” category includes behaviors defined as an inactive state or a state of non-movement. This category consists of four subcategories: (1) “waiting to cross the road” is the act of waiting for a red traffic light turning to green in the zebra crossing before crossing the road; (2) “waiting for others” is the act of temporarily stopping to wait for another person; (3) “waiting for the bus” is the act of waiting for a bus, usually at a bus stop; and (4) “waiting for customers” is the act of sitting on the sidewalk for a long time to welcome customers.
The “service/maintenance” category includes behaviors defined as acts of supporting, serving, or preserving a condition or situation, or the state of being preserved. This category consists of five subcategories: (1) “cleaning” is the act of making the sidewalk clean, especially in front of houses or shops; (2) “commercial preparation” is the act of arranging and displaying goods for sale; (3) “guarding” is the act of setting up chairs in front of houses or shops and observing customers to prevent theft; (4) “public maintenance” is the act of environmental workers taking care of plants along streets or collecting litter; and (5) “repairing” is the act of providing repair services.
The “relaxation” category includes behaviors defined as a state of being free from tension and anxiety. This category consists of 6 subcategories: (1) “playing” is a range of intrinsically motivated activities by children or adults for self-amusement; (2) “reading” is the act of reading newspapers, books, or other electronic devices; (3) “strolling” is the act of walking in a leisurely or idle manner; (4) “looking others” is the act of people watching; (5) “resting” is the act of taking naps on chairs, motorbikes, or taxis; and (6) “chatting” is the act of gathering by group for informal conversation.
The others category consists of three subcategories: (1) “inquiring” is the act of asking or communicating with others for information; (2) “eating” and (3) “drinking” are acts of eating or drinking at tables and chairs by food and beverage vendors.

3.2. Quantities of User Behavior Units

The total number of user behavior units recorded on the four observation days on OIK St and LD St was 2389 and 2177, respectively (Table 2). In general, [Accessibility] behaviors occurred the most frequently on both streets. The frequency of [Accessibility] behaviors on LD St was higher than on OIK St. The frequency of [Service/Maintenance] behaviors on LD St was slightly higher than on OIK St. In contrast, the frequency of [Trading], [Idling], and [Others] behaviors on OIK St was higher than on LD St. Notably, the frequency of [Relaxation] behaviors was relatively the same on both streets (Figure 6).
More specifically, in the subcategories, the highest behavior frequency was [leaving/coming without motorcycle], which accounted for 421 times on OIK St and 549 times on LD St respectively (Table 2). In general, the differences between the two streets are as follows: (1) [crossing road], [walking for destination], and [playing] were relatively the same on both streets; (2) [leaving/coming with/without motorcycle], [guarding], [strolling], [resting], [chatting], [waiting for the bus] dominated on LD St; and (3) all other behaviors dominated on OIK St, most notably, [trading], [idling] excluding [waiting for the bus], [service/maintenance] excluding [guarding] and [looking at others], and [others] (Figure 6).
As can be seen in Figure 7, the highest frequency of behaviors on the two streets were shown by section. Most noticeably, most of the high frequent behaviors occurred in the middle street segments. Specifically, on LD St, seven sections dominated with high occurrence frequency of behavior: D1, D2, D3, D4, D5, D6, and D8 with 562, 453, 131, 155, 158, 125, 132 times respectively (the overall average behavior frequency is 104.7 times); on OIK St, 7 sections also dominated with high occurrence frequency of behavior: B1, B2, B4, B5, B6, B9, and B10 with 242, 239, 230, 505, 156, 232, and 93 times respectively (the overall average behavior frequency is 82.4 times).
Meanwhile, the diversity of behaviors appearing in all sections of both streets was found to be as follows: On LD St, section D1 had the widest range of behavior with 25 kinds of behavior, while section D2 was second with 24; and D3 and D8 were third with 22; On OIK St, section B4 had the full range of 26 kinds of behavior, while section B5 was second with 25; and B2 was third with 24. On average, the diversity of behavior appearing on OIK St is higher than on LD St with 15 and 14 kinds of behavior, respectively (Figure 7).

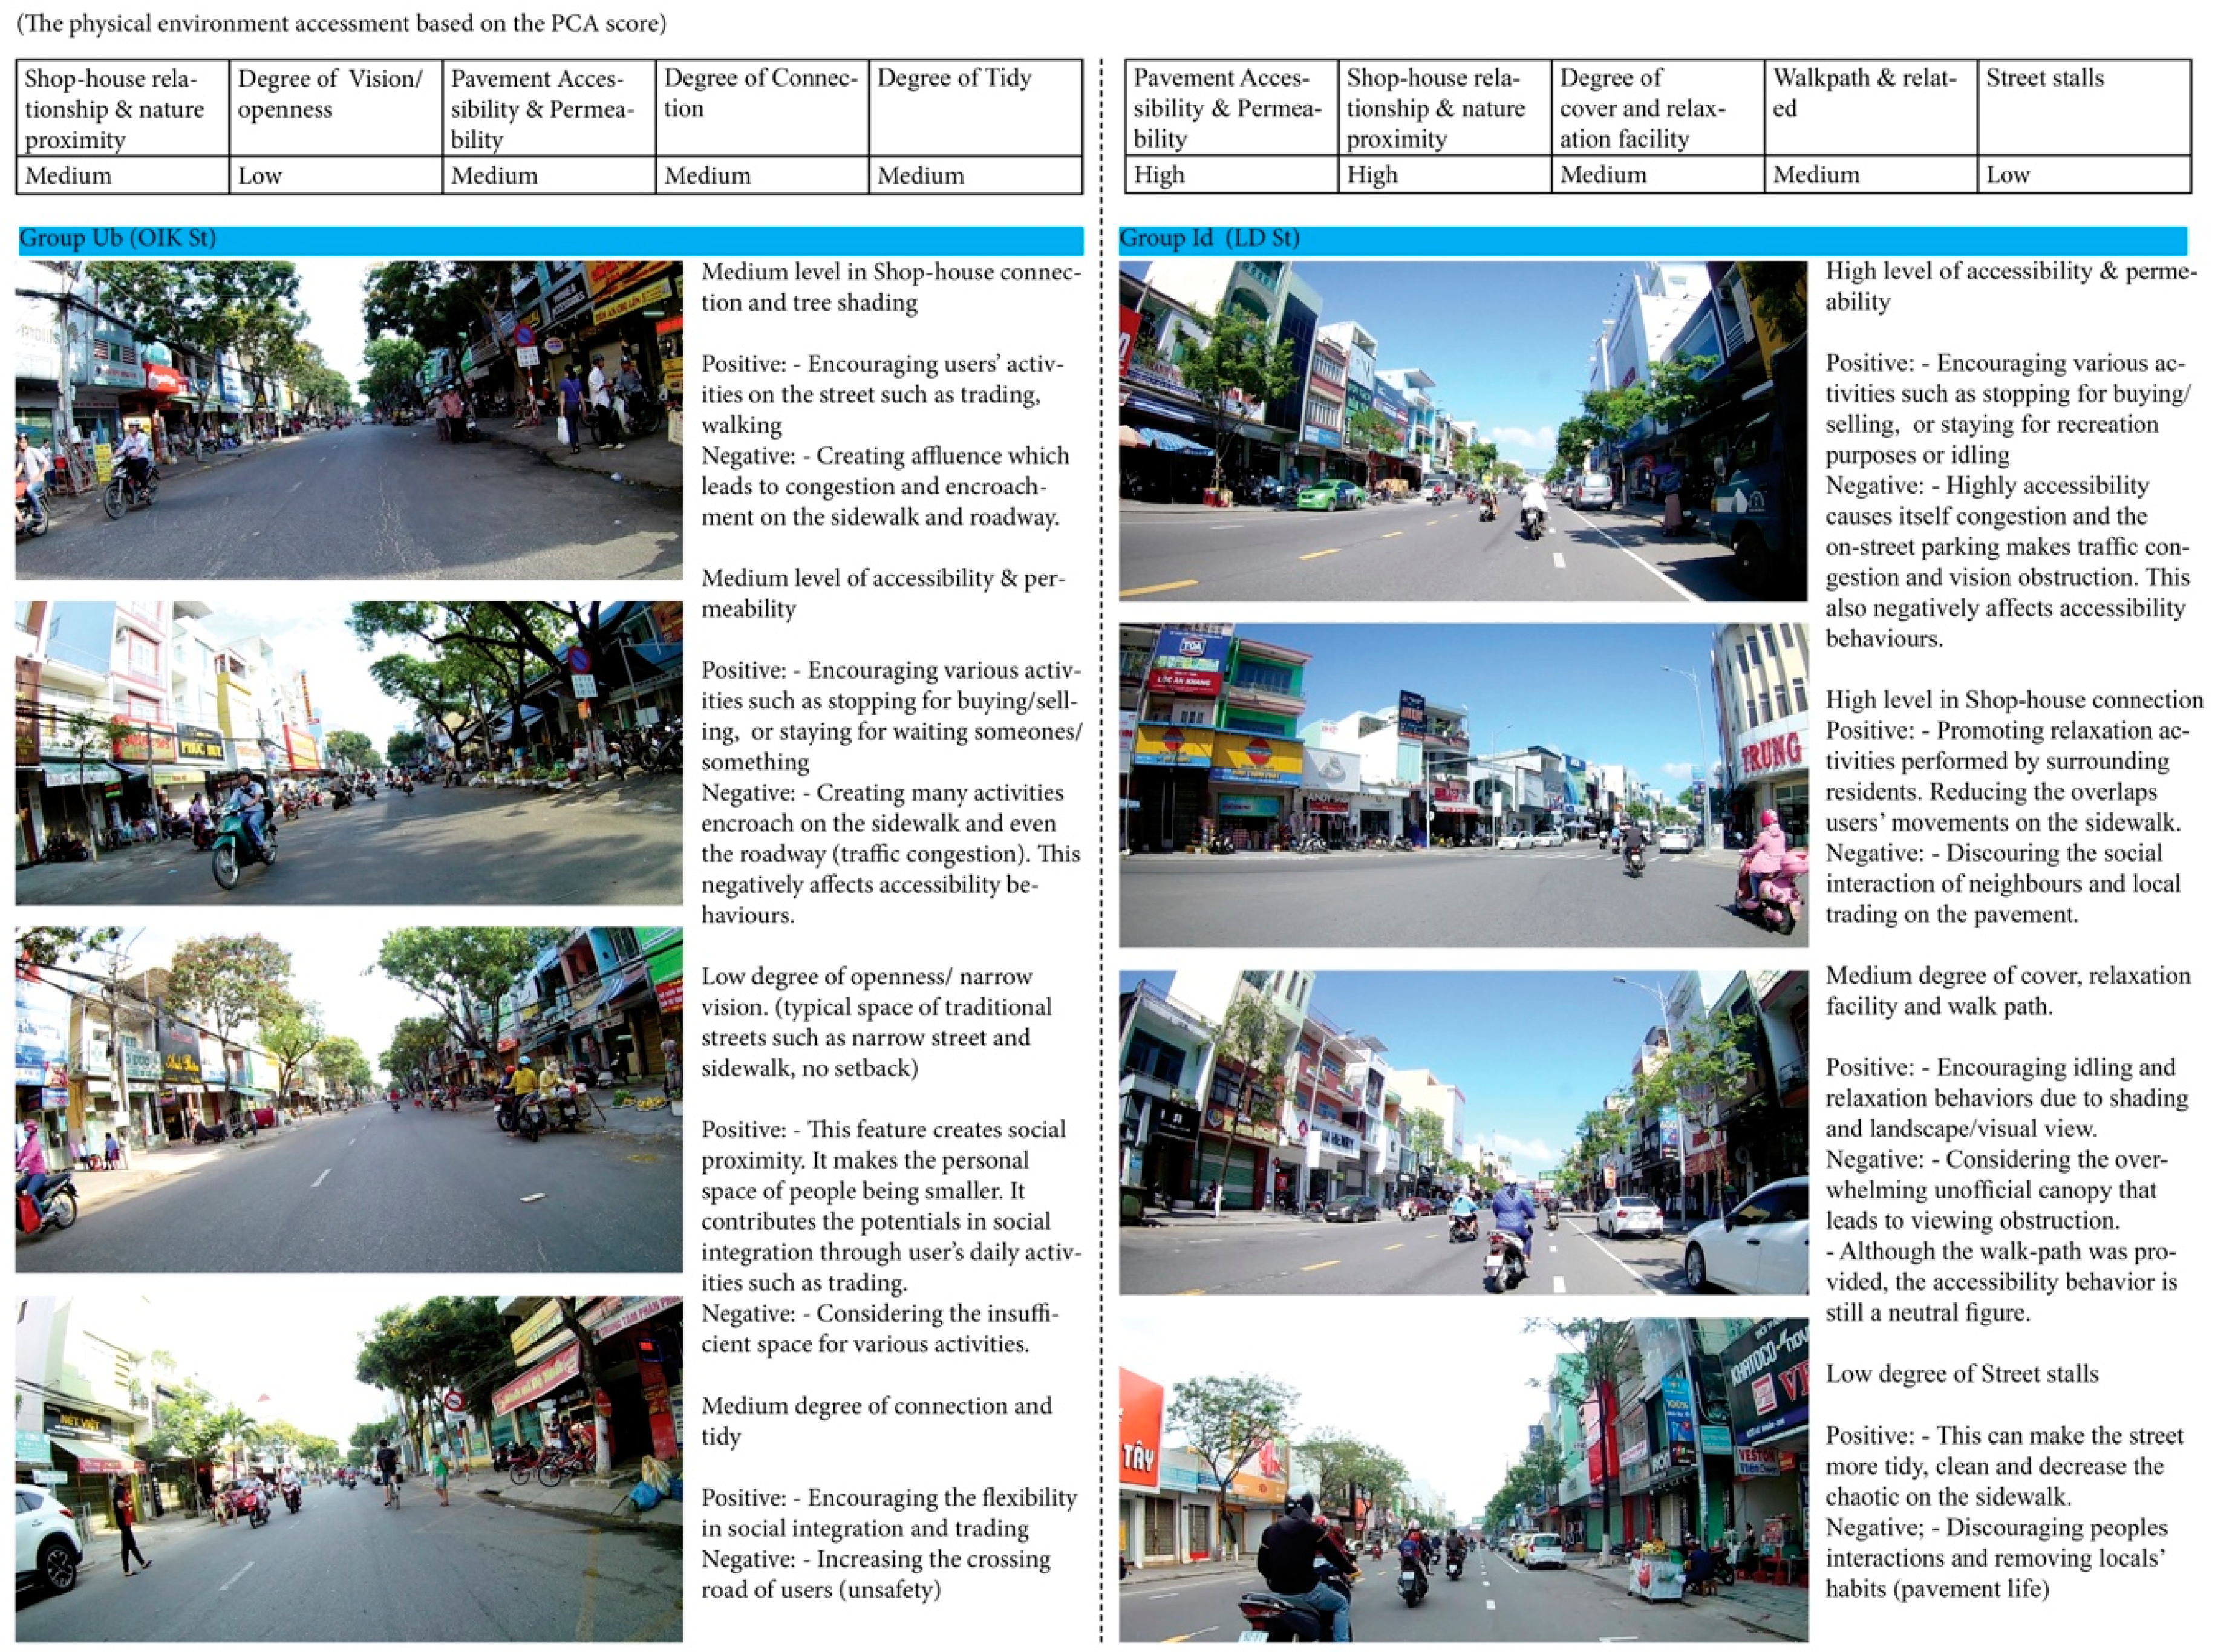
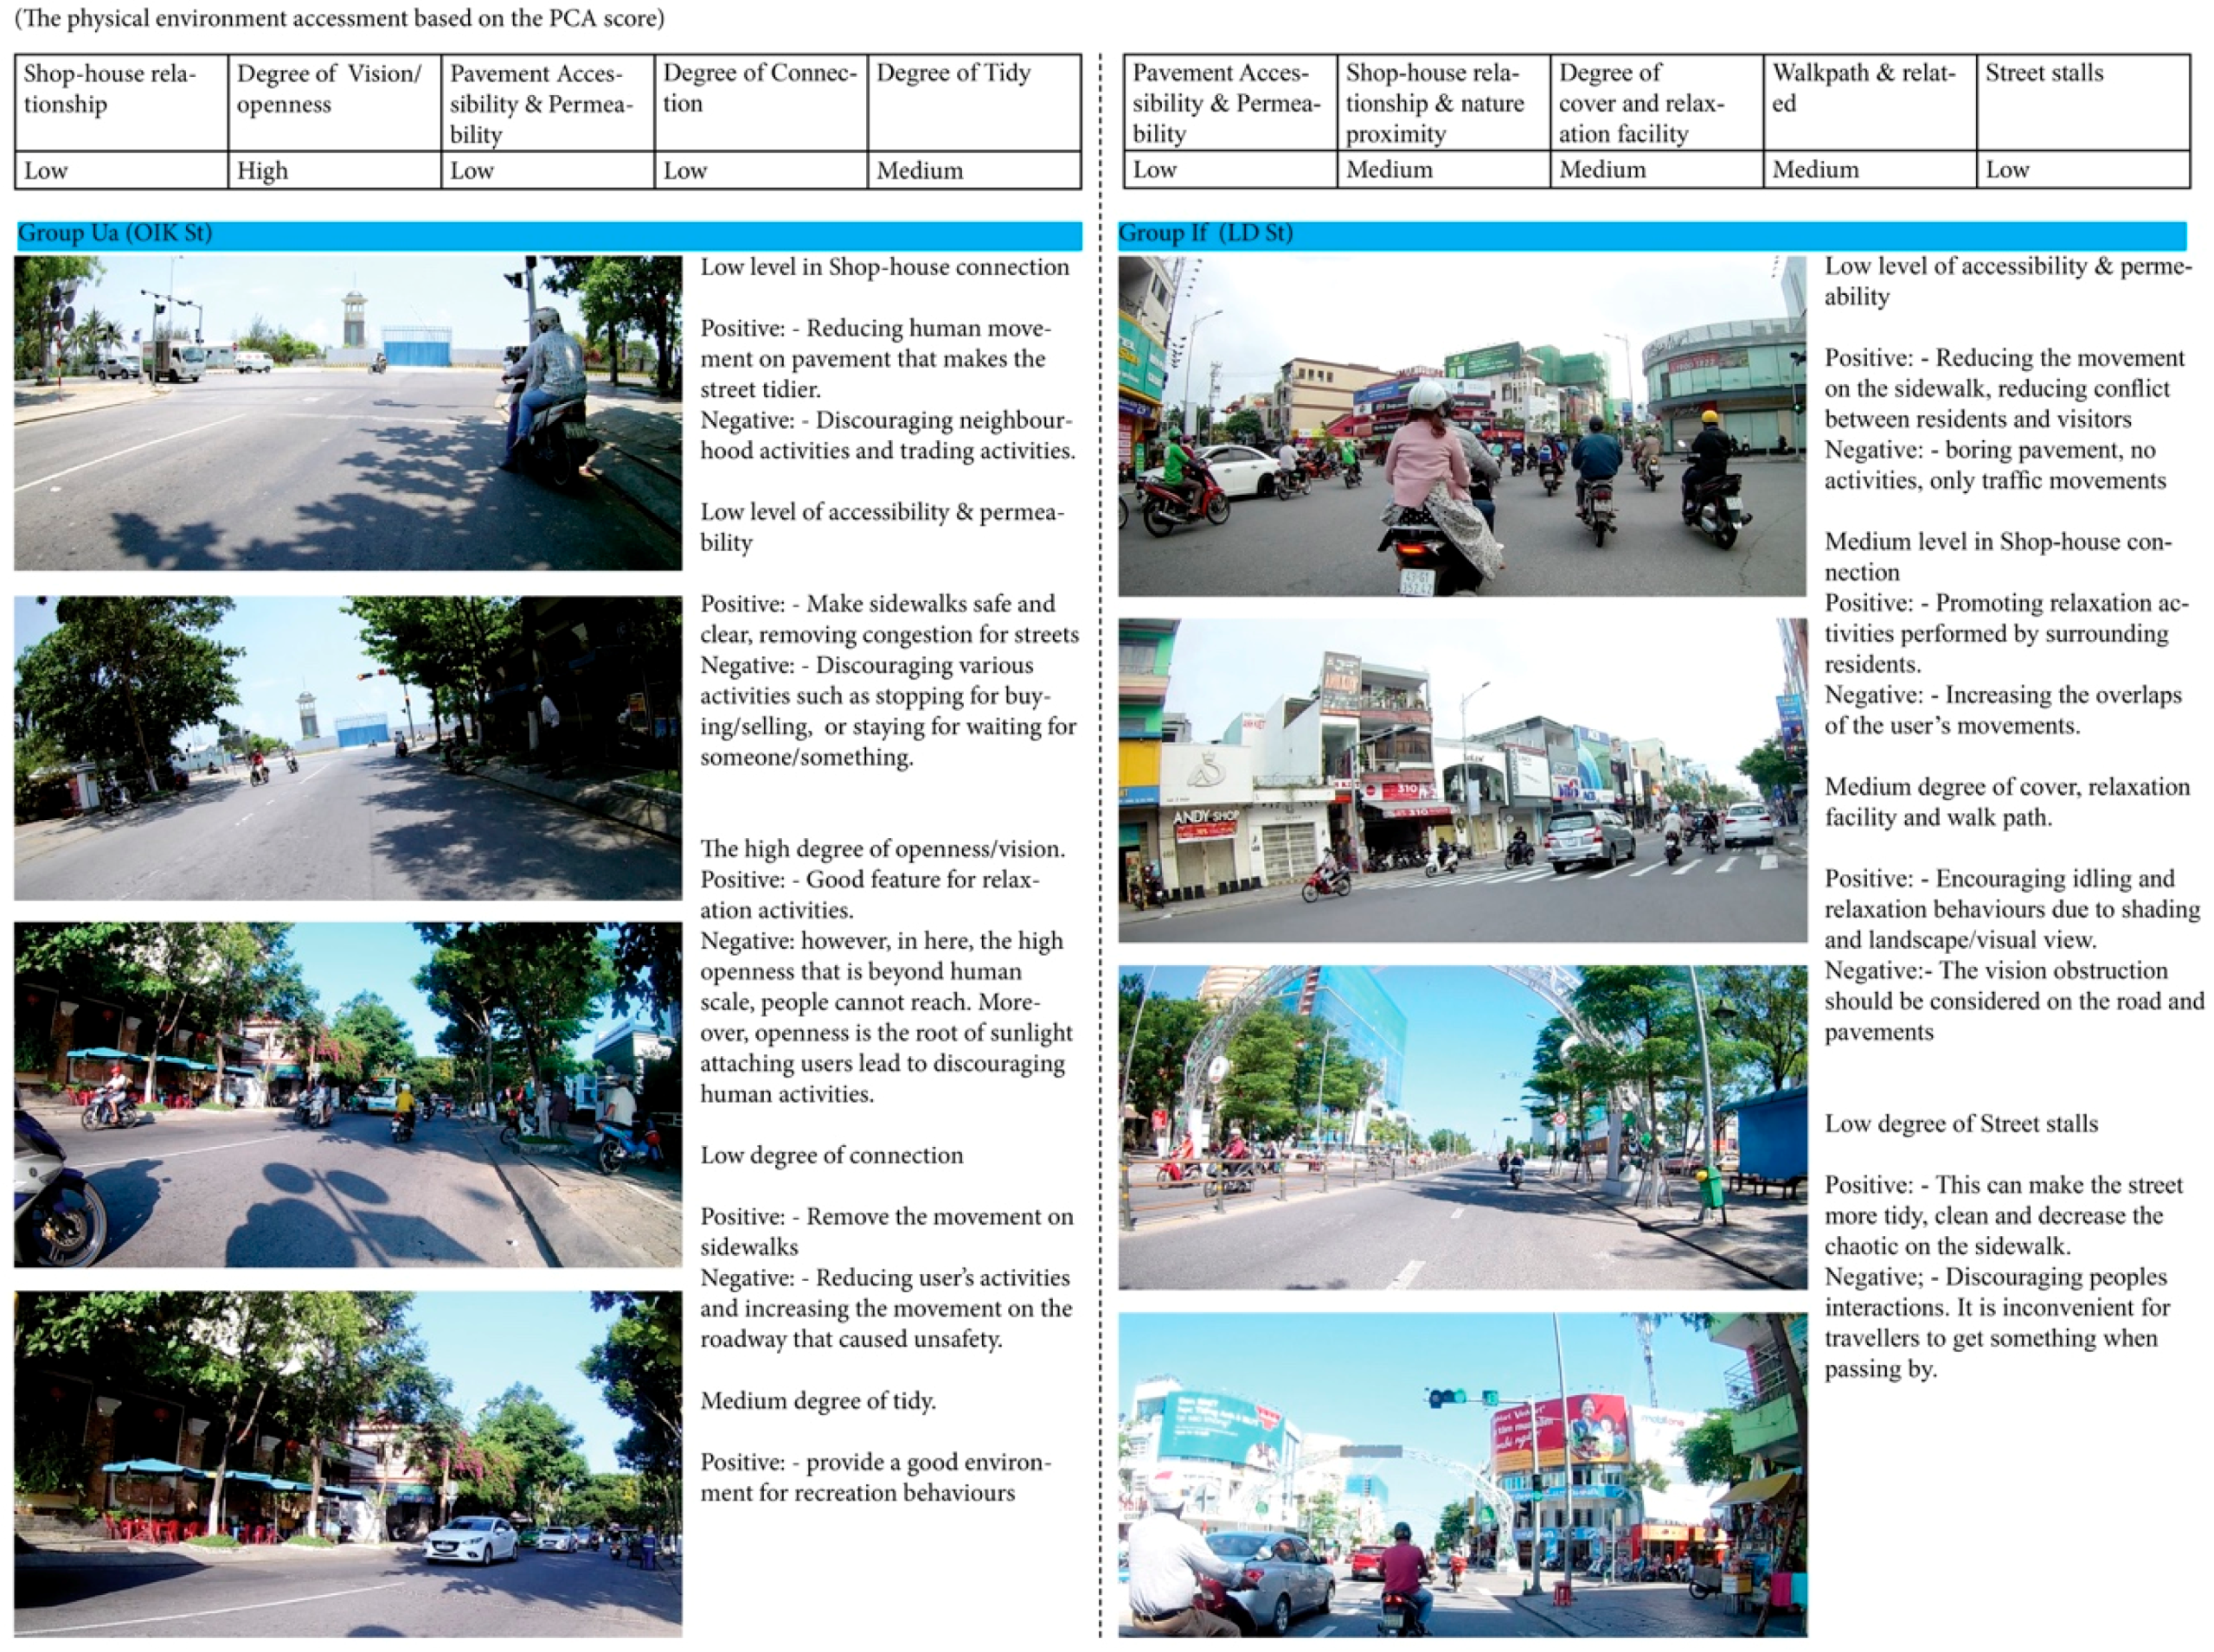
3.3. Environment Characteristics Analysis

The physical environment characteristics of the two streets and their sidewalks were recorded and denoted by “1” and “0” for their presence and absence, respectively (Table 3). The characteristics of street environments were processed by principal component analysis (PCA) and cluster analysis (CA) using SPSS to reveal the physical environment features along the streets.
The results show that the cumulative contribution rate is over 75% (OIK St) and 73% (LD St), respectively. The main characteristics of the streets were explained in five axes that can be seen in Table 4 and Table 5.
Differences between the physical features on both streets are as follows: On OIK street, the eigenvalues of the 1st axis indicates the shop-house relationship and shading by the presence of store signs, retail services, residences, and awnings. The 2nd axis indicates degree of openness by the presence of balconies, greenspaces, vacancies, and official signs. The 3rd axis indicates accessibility of the sidewalk by the presence of public agencies, setbacks, and bus stops. The 4th axis indicates the degree of connection due to the prominence of street width and crossings/pedestrian ways. The 5th axis indicates level of tidiness of the street environment by the presence of trash cans and unofficial signs. On LD street, the eigenvalues of the 1st axis indicates accessibility and permeability of the sidewalk by the presence of setbacks, fences, sign poles, and public agencies. The 2nd axis indicates the shop-house relationship and proximity to nature by the presence of retail services, residences, and greenspaces. The 3rd axis indicates the degree of cover and relaxation of street space by the presence of trees, bus stops, and recreational facilities. The 4th axis indicates walking paths and related paths by the presence of sidewalks. The 5th axis indicates street stall characteristics by the presence of food spots and awnings.
To some extent, the two streets had all the qualities and features through the ten axes (five axes for OIK St, and five axes for LD St). Although there are different environmental characteristics between the two streets, both share two factors: shop-house relationship and sidewalk accessibility and permeability. In contrast, the two streets differ as follows: On OIK St, the degree of vision/openness, connection, and tidiness were distinctive characteristics. On LD St, the degree of cover and relaxation of street space, walking paths and related paths, and street stalls were considered distinctive characteristics. In order to better understand the differences in street environment characteristics, cluster analysis was conducted to group sections with the same qualities and features. On OIK St, the sections can be classified into four types, while on LD St, the sections can be classified into three types (Figure 8).

3.4. The Correlation between User Behaviors and Street Environment between Two Streets

User behaviors along all sections of the two streets (29 sections for OIK St and 19 sections for LD St) were categorized into six main categories including 26 subcategories of behaviors. The average occurrence frequency of each kind of behavior in the sections is commonly reasoned as about 15% (OIK St) or 23% (LD St). Hence, behaviors with occurrence frequency higher than 15% (OIK St) or 23% (LD St) are considered “frequent”. If the occurrence frequency of a certain behavior group was over 15% (OIK St) or 23% (LD St) in more than half of the sections when focusing on one type of street space, the behavior group was defined as “frequent”. Following the same logic, conversely, if the frequency of a certain behavior group was under 15% (OIK St) or 23% (LD St) in all sections when focusing on one type of street space, the behavior group was defined as “infrequent”.
As shown in Figure 9, in general, trading behaviors such as food or goods transactions were prominent in OIK street. In contrast, idling, service/maintenance, and relaxation behaviors were prominent on LD street. Specifically, on OIK street, T4 attracted the most user behaviors with high frequency in trading. T1 discouraged the most users’ behaviors. T2 and T3 neither attracted nor discouraged user behaviors (Figure 9a). On LD street, T’1 attracted the most user behaviors with high frequency in idling, service/maintenance, and relaxation. T’3 discouraged most user behaviors. T’2 neither attracted nor discouraged user behaviors (Figure 9b).
In short, statistical results indicate that the distribution of all user behaviors on street space is unequal in different types of space and can be grouped into three typical environment-behavior relationship patterns (Figure 9 and Figure 10).

4. Discussion

Further analysis was conducted to interpret the difference between the two kinds of streets in the three typical environment-behavior patterns explained in Figure 11.

4.1. The Difference between Three Environment-Behavior Patterns on Two Kinds of Street

4.1.1. The Environmental Behavior Pattern Attracting the Highest Frequency of User Behaviors (the 1st Pattern)

The first environmental behavior pattern attracts the highest frequency of user behaviors. Trading behavior was the most frequent behavior occurring on OIK St, while idling, service/maintenance, and relaxation behaviors were the most frequent behaviors occurring on LD St (Figure 9). The studied streets have similar and different environmental features that lead to the differences in behavior distributions discussed herein (Figure 9 and Figure 12).
(1) Similar features: level of shop-house connection on land-use (or shop-house functional division) and sidewalk accessibility/permeability
Positive aspects: On OIK St, these features promote trading behaviors. On LD St, these features encourage relaxation, recreation, and idling behaviors. They also reduce human movement on the sidewalks.
Negative aspects: On OIK St, these features contribute to sidewalk and traffic congestion due to the need for moving between residences to shops and vice versa. On LD St, these features discourage social interaction between neighbors and local trading activities. The high degree of sidewalk accessibility/permeability also leads to parking on the roadside, which obstructs vision and affects accessibility behaviors.
(2) Different features: degree of openness, connection, and tidiness on OIK St; degree of cover and relaxation facilities, walking paths and related paths, and street stalls on LD St
Positive aspects: On OIK St, the low degree of openness promotes social integration due to narrowing personal space. The medium degree of connection and tidiness contributes to increasing human movements that lead to social interaction and trading activities. On LD St, the medium degree of cover, walking paths, and relaxation facilities such as canopies, shading, benches, and green spaces contribute to the frequent occurrence of idling and relaxation behaviors. The low distribution of street stalls reduces the level of chaos on the sidewalks.
Negative aspects: On OIK St, the low degree of openness contributes to sidewalk and traffic congestion due to insufficient space for various concurrent activities. The medium degree of connection and tidiness contributes to increasing pedestrian crossings. On LD St, the frequency of accessibility behaviors is modest despite the medium degree of cover, walking paths, and relaxation facilities. The medium degree of cover may discourage walking activities.

4.1.2. Environmental Behavior Pattern Discouraging User Behaviors (the 2nd Pattern)

The second environmental behavior pattern discourages user behaviors. The two studied streets have similar and different environmental features that lead to the difference in behavior distribution discussed herein (Figure 9 and Figure 13).
(1) Similar features: level of shop-house connection on land-use (or shop-house functional division) and sidewalk accessibility/permeability
Positive aspects: On OIK St, these features reduce human movement on the sidewalks due to the great distances between residences and shops (about more than a 5-minute walk or 500 m walking [55]). On LD St, these features allow residents to conduct business in front of their own house. The low degree of sidewalk accessibility/permeability promotes safety due to unobstructed view. Indeed, high level of accessibility leads to the roadway and sidewalk obstruction caused by freely parking on-street and on-sidewalks.
Negative aspects: On OIK St, these features discourage most behaviors due to the lack of residents. Here, the only commercial activity is a hotel and a restaurant closed off by fence. Narrow sidewalks and high volume of transportation cause low accessibility of space. On LD St, the medium degree of shop-house connection discourages social interaction of neighbors and local trading activities to some extent. The low degree of sidewalk accessibility/permeability constrains accessibility behaviors.
(2) Different features: degree of openness, connection, and tidiness on OIK St; degree of cover and relaxation facilities, walking paths and related paths, and street stalls on LD St.
Positive aspects: On OIK St, the high degree of openness provides a wider vision for relaxation behaviors due to the street’s connection with a big road. The low degree of connection promotes tidiness and reduces sidewalk congestion. On LD St, the medium degree of cover, walking paths, and relaxation facilities such as canopies, tree shading, and benches contribute to the frequent occurrence of relaxation behaviors. The low distribution of street stalls removes chaos on the sidewalks.
Negative aspects: On OIK St, the high degree of openness discourages user behaviors due to oppressive sunlight. The low degree of connection causes pedestrians to put themselves in danger by walking on the roadway instead of sidewalks. On LD St, although there is a medium degree of cover, walking paths, and relaxation facilities, it is not enough to attract idling behaviors. The low distribution of street stalls makes the space boring.

4.1.3. Neutral Environmental Behavior Pattern that Is Neither Frequent nor Infrequent (the 3rd Pattern)

The third environmental behavior pattern neither attracts nor discourages user behaviors. On OIK St, most of the behaviors were neither frequent nor infrequent. However, on LD St, there were some frequent behaviors (relaxation) and infrequent behaviors (idling). The two studied streets have similar and different environmental features that lead to the difference in behavior distribution discussed herein (Figure 9 and Figure 14).
(1) Similar features: level of shop-house connection on land-use (or shop-house functional division) and sidewalk accessibility/permeability
Positive aspects: On both OIK St and LD St, these features are conducive to activities of daily living and business and contribute to accessibility, trading, and idling behaviors.
Negative aspects: On both OIK St and LD St, these features create sidewalk and roadway obstructions due to various overlapping and concurrent activities. On LD St, the low degree of shop-house connection makes the sidewalks boring when shops are closed. It also reduces trading behaviors to some extent and discourages social interaction of neighbors.
(2) Different features: degree of openness, connection, and tidiness on OIK St; degree of cover and relaxation facilities, walking paths and related paths, and street stalls on LD St.
Positive aspects: On OIK St, the high degree of openness provides a wider vision for relaxation behaviors. The medium degree of connection and tidiness attracts accessibility, trading, and relaxation behaviors. On LD St, the medium degree of cover provides a wider vision for trading and idling behaviors. The medium degree of walking paths and relaxation facilities such as canopies, shade from trees, and benches contribute to the frequent occurrence of relaxation behaviors. The medium distribution of street stalls maintains the order of the street space.
Negative aspects: On OIK St, the high degree of openness permits oppressive sunlight that discourages trading, relaxation, and idling behaviors. The medium level of connection and tidiness discourages accessibility, trading, and relaxation behaviors. On LD St, there is a lack of trading and idling activities despite the medium degree of cover, walking paths, relaxation facilities, and street stalls.

4.1.4. Suggestions for Each Environment-behavior Pattern

The degree of shop-house connection on land-use (or shop-house functional division) is an important factor for facilitating business activities and consumer behaviors. The degree of sidewalk accessibility/permeability is an important factor for providing adequate space for safe and easy access to sidewalks. The degree of openness, connection, and tidiness is an important factor for encouraging social interaction. The degree of cover, walking paths, and relaxation facilities is an important factor for providing comfort from harsh weather elements and other negative conditions. Finally, a systematic distribution of street stalls should be considered for enhancing and preserving local identity and customs.
(1) For street sections in the 1st pattern: Improvement of the street space for sections in the 1st pattern should consider the impacts of sidewalk and traffic congestion. Such congestion obstructs vision and creates dangerous conditions to discourage many kinds of user behaviors. Therefore, a separate buffer zone adjacent to the sidewalk and off-street parking spaces should be established. On-street vehicle parking should be prohibited and lines limiting public, semi-public, and private use of sidewalks should be enforced.
(2) For street sections in the 2nd pattern: Improvement of the street space for sections in the 2nd pattern should consider increasing the population density of users. Therefore, more residential and commercial properties should be erected to attract more users. Additionally, open space should be utilized more efficiently and restrictions on traffic speed and volume should be implemented.
(3) For street sections in the 3rd pattern: Improvement of the street space for sections in the 3rd pattern should consider aesthetic enhancements to encourage more social interaction and relaxation and idling behaviors. Therefore, properly selected street furnishings should be strategically placed to provide comfort and safety and create a sense of local identity.

5. Further Discussion, The Implication of Street Improvement and Management

This research found differences in the occurrence frequency and distribution of user behaviors on an improved street versus an unimproved street. However, regardless of the quality of street space, each street had both positive and negative characteristics that affect user behaviors. Therefore, street improvement and management should consider enhancing positive characteristics and mitigating negative characteristics of street spaces in eight environmental attributes: (1) shop-house relationship and nature proximity; (2) sidewalk accessibility and permeability; (3) degree of openness; (4) degree of connection; (5) degree of tidiness; (6) degree of cover and relaxation facilities; (7) degree of walking paths and related paths; and (8) distribution of street stalls. This analysis is analogous to the research of Christopher Alexander in seeking language patterns to build a living environment with tangible and intangible qualities that provides positive interaction in community [56,57,58,59].
The findings also show that trading activities attract people to participate in and be engaged in the community on unimproved streets. This is a key factor that needs to be preserved and refined in the renovation process to provide a new street space with a richness of cultural identity and variety of human activities. This is consistent with the studies of Drummond (2000), and Babiano (2007), which found an emphasis on the need to use street space in the daily lives of locals in Asian developing countries [26,60]. It also confirms the perspective in economic pavement existing in Vietnamese cities [41].
In order to facilitate various activities in the new urban context with a variety of motor vehicles, especially motorcycles, streets need to include a buffer space that provides a physical setting to encourage accessibility and temporary idling behaviors. Because street space is limited, the application of street space sharing theory to build a buffer zone for different activities has changed at different time periods to serve various activities including relaxation activities as well as access and profit-making activities such as trading and maintenance services [39].
One of the significant elements that affects user movements along the street which contributes to the potential of social interactions is land-use form. Indeed, there is little difference in land-use form or residence and shop relationship on unimproved and improved streets. On the unimproved street, because of a long history of development, the environmental conditions are currently of low quality and out of date. Some people tend to move away to find better places to live. Others live in residential areas settled behind front land lots adjacent to street spaces; however, they still return on a daily basis for work. These streets are active during the day and deserted at night. However, stronger community cohesion was found on these streets as evidenced by the diversity of user behaviors. In contrast, the shop-houses on the improved street were mainly planned for housing but were eventually exploited for profit-making activities. The house is separated for two functions, residence and business. Landlords rent the business zone to other businesspeople. They keep to the living zone and rarely appear in the business zone or sidewalks because the sidewalk is the most important area for business activities in Vietnamese cities. Gradually, the relationship between neighbors disintegrate. Tenants stay in another place and exploit the rent zone for business. Hence, the street space becomes a space for accommodating strangers’ activities.
Necessary activities such as accessibility, parking, and waiting for someone or something usually occur on these streets. A small number of optional activities occur in arranged recreational facilities such as green spaces, benches, and canopies, but without social interaction. These findings implicate the role of walking distance of residents from residence to working place in creating a living environment on the street. This feature was also observed by Mehaffy (2015) in his research about the concept of neighborhood units initiated by Clarence Perry (1920) regarding walkable distances in 5- and 10- minute walking thresholds that affect user accessibility toward open space [55]. These research findings posit a new hypothesis about the relationship between land-use pattern related to residence-shop connection and neighbor relationships affecting the diversity and occurrence of user behaviors on streets in necessary, optional, and social activities, and contribute to reducing vehicle transportation on streets. This can help broaden the scope of street space improvement and city planning to contribute to the sustainable development of communities in nations using streets as multifunctional spaces.
This research has possible limitations. Broadening the time frame would enable the collection of more user behavior units. To this end, user behaviors could be recorded by multiple video cameras set up in various places for the entire day [61]. Additionally, behavior mapping and coding requires time and skill. The application of GPS and GIS could improve the ease and accuracy of data collection and analysis [62,63]. Moreover, this comparative study neglects aspects of nature such as weather and season, as well as the social conditions of the two kinds of street. Indeed, the difference in the demographics of users, especially differentiation between rich and poor, on both streets influences user behaviors and perceived accessibility. Upcoming studies can conduct further surveys of user perceptions regarding the accessibility or usability of street spaces including tangible and intangible elements.

6. Conclusions

Our comparative study on the domain of user behaviors and the behavior-environment relationship on unimproved and improved streets in a Vietnamese city concludes the following:
(1) Regarding user behaviors, there was no difference in the diversity of behavior categories between the two streets despite their different physical characteristics. This reflects the strong nature of using streets in the daily lives of Vietnamese people. There were only differences in occurrence frequency. Accessibility and service/maintenance behaviors were more frequent on improved streets, while trading and idling behaviors were more frequent on unimproved streets. Both streets had a similar frequency of relaxation behaviors.
(2) Regarding street environment characteristics, eight physical attributes were identified: (a) shop-house relationship and nature proximity; (b) sidewalk accessibility and permeability; (c) degree of openness; (d) degree of connection; (e) degree of tidiness; (f) degree of cover and relaxation facilities; (g) degree of walking paths and related paths; and (h) distribution of street stalls. Both streets share attributes (a) and (b). The unimproved street had attributes (c), (d), and (e) while the improved street had attributes (f), (g), and (h).
(3) Regarding environmental behavior patterns, both streets exhibited three patterns: attracting the highest frequency of user behaviors (1st pattern), discouraging the highest frequency of user behaviors (2nd pattern), and neither attracting nor discouraging user behaviors (3rd pattern). Each pattern has similar and different features with positive and negative aspects. The similar features lead to the following hypotheses for city planning and urban design: land-use pattern related to residence-shophouse relationship affects user behaviors on streets and providing buffer zones can promote various activities along the street. This paper identifies the environment-behavior relationship on an unimproved and an improved street, contributing to a theoretical framework for developing a sustainable street environment within the local context. The findings of this paper reveal that improvement process should focus on solving the nature of conflicts of street-inputted variables affecting users such as physical and non-physical settings and facilities, by considering these variables as components or patterns instead of providing individual variables as the current situation in Vietnam.
In summary, the environment-behavior relationship can be said to have become established about 35 years ago due to the demand for understanding about the mechanism of people-environment interactions. Without it, the improvement of the built environment was likely to fail due to the inability to reliably predict outcomes. It is impossible to know when an outcome is successful without the criteria for success. An environment is good when one knows what is good, who benefits from that, and why it is good. Therefore, developing and improving the environment should consider environment-behavior objectives, psychological, scientific and comprehensive patterns and contribute to the development of a cumulative body of knowledge for evidence-based design.

Author Contributions

Conceptualization, D.T.D.; Methodology, D.T.D., S.M., and R.N.; Software, D.T.D.; Validation, D.T.D., S.M., and R.N.; Formal Analysis, D.T.D.; Investigation, D.T.D.; Resources, D.T.D.; Data Curation, D.T.D.; Writing—Original Draft Preparation, D.T.D.; Writing—Review and Editing, D.T.D.; Visualization, D.T.D.; Supervision, S.M. and R.N; Project Administration, D.T.D.; Funding Acquisition, S.M.

Funding

This research was funded by MEXT Scholarship, and The APC was funded by my supervisor, Suguru Mori.

Acknowledgments

I would like to express my sincere gratitude to Japanese Government Scholarship (MEXT), for aiding my study in Japan and this research. Sincerest appreciation to the first author’s supervisor, Suguru Mori for providing guidance and financial support. Finally, the first author extends his gratitude towards his friend, Linda Truong for proofreading the paper.

Conflicts of Interest

The authors declare no conflicts of interest.

References

  1. Bedimo-Rung, A.L.; Mowen, A.J.; Cohen, D.A. The significance of parks to physical activity and public health: A conceptual model. Am. J. Prev. Med. 2005, 28, 159–168. [Google Scholar] [CrossRef] [PubMed]
  2. Abbasi, A.; Alalouch, C.; Bramley, G. Open space quality in deprived urban areas: User perspective and use pattern. Procedia-Soc. Behav. Sci. 2016, 216, 194–205. [Google Scholar] [CrossRef]
  3. Byrne, J.; Wolch, J. Nature, race, and parks: Past research and future directions for geographic research. Prog. Hum. Geogr. 2009, 33, 743–765. [Google Scholar] [CrossRef]
  4. Cohen, D.A.; McKenzie, T.L.; Sehgal, A.; Williamson, S.; Golinelli, D.; Lurie, N. Contribution of public parks to physical activity. Am. J. Public Health 2007, 97, 509–514. [Google Scholar] [CrossRef] [PubMed]
  5. Beck, H. Linking the quality of public spaces to quality of life. J. Place Manag. Dev. 2009, 2, 240–248. [Google Scholar] [CrossRef]
  6. Mensah, C.A.; Andres, L.; Perera, U.; Roji, A. Enhancing quality of life through the lens of green spaces: A systematic review approach. Int. J. Wellbeing 2016, 6, 142–163. [Google Scholar] [CrossRef] [Green Version]
  7. Consultants, L.U. Making the Links: Greenspace and Quality of Life; Scottish Natural Heritage: Inverness, UK, 2004. [Google Scholar]
  8. Bolitzer, B.; Netusil, N.R. The impact of open spaces on property values in Portland, Oregon. J. Environ. Manag. 2000, 59, 185–193. [Google Scholar] [CrossRef]
  9. Byrne, J.; Wolch, J.; Zhang, J. Planning for environmental justice in an urban national park. J. Environ. Plan. Manag. 2009, 52, 365–392. [Google Scholar] [CrossRef]
  10. Geoghegan, J. The value of open spaces in residential land use. Land Use Policy 2002, 19, 91–98. [Google Scholar] [CrossRef]
  11. Jacobs, J. The Death and Life of American Cities; Random House: New York, NY, USA, 1961. [Google Scholar]
  12. Donald, A.; Gerson, M.S.; Lintell, M. Livable Streets; University of California Press: Berkely, CA, USA, 1981. [Google Scholar]
  13. Francis, M. Urban open spaces. Adv. Environ. Behav. Des. 1987, 1, 71. [Google Scholar]
  14. Whyte, W.H. The Social Life of Small Urban Spaces; The Conservation Foundation: Washington, DC, USA, 1980. [Google Scholar]
  15. Montgomery, J. Making a city: Urbanity, vitality and urban design. J. Urban Des. 1998, 3, 93–116. [Google Scholar] [CrossRef]
  16. Buchanan, P. What city? A plea for place in the public realm. Archit. Rev. 1988, 184, 31–41. [Google Scholar]
  17. Faria, P.A.; Ferreira, F.A.; Jalali, M.S.; Bento, P.; António, N.J. Combining cognitive mapping and MCDA for improving quality of life in urban areas. Cities 2018, 78, 116–127. [Google Scholar] [CrossRef]
  18. Garcia-Ayllon, S. Urban transformations as indicators of economic change in post-communist Eastern Europe: Territorial diagnosis through five case studies. Habitat Int. 2018, 71, 29–37. [Google Scholar] [CrossRef]
  19. Lynch, K. The Image of the City; MIT Press: Cambridge, MA, USA, 1960; Volume 11. [Google Scholar]
  20. Hassen, N.; Kaufman, P. Examining the role of urban street design in enhancing community engagement: A literature review. Health Place 2016, 41, 119–132. [Google Scholar] [CrossRef] [PubMed]
  21. Gehl, J. Life between Buildings: Using Public Space; Island Press: Washington, DC, USA, 2011. [Google Scholar]
  22. Carmona, M.; Heath, T.; Oc, T.; Tiesdell, S. Public Places-Urban Spaces; Routledge: Abingdon, UK, 2012. [Google Scholar]
  23. Mehta, V. Lively streets: Determining environmental characteristics to support social behavior. J. Plan. Educ. Res. 2007, 27, 165–187. [Google Scholar] [CrossRef]
  24. Carmona, M. London’s local high streets: The problems, potential and complexities of mixed street corridors. Prog. Plan. 2015, 100, 1–84. [Google Scholar] [CrossRef]
  25. Barton, H. Land use planning and health and well-being. Land Use Policy 2009, 26, S115–S123. [Google Scholar] [CrossRef]
  26. Drummond, L.B. Street scenes: Practices of public and private space in urban Vietnam. Urban Stud. 2000, 37, 2377–2391. [Google Scholar] [CrossRef]
  27. Dang, P.N. Challenges for sustainable environment in urbanisation in Vietnam. In Proceedings of the Third International Workshop Council Subscription: Natural Resources, Environment and Sustainable Development, Hanoi, Vietnam, 5 December 2008. [Google Scholar]
  28. Do, T.D.; Mori, S.; Nomura, R. Passenger’s Attention Behaviors along Street Space: A Case Study of Da Nang City. J. Civ. Eng. Archit. 2018, 12, 245–261. [Google Scholar]
  29. Lewin, K. Defining the ‘field at a given time’. Psychol. Rev. 1943, 50, 292. [Google Scholar] [CrossRef]
  30. Hillier, B.; Hanson, J. The Social Logic of Space; Cambridge University Press: Cambridge, UK, 1989. [Google Scholar]
  31. Barker, R.G. Ecological Psychology: Concepts and Methods for Studying the Environment of Human Behavior; Stanford University Press: Stanford, CA, USA, 1968. [Google Scholar]
  32. Bechtel, R.B.; Marans, R.W.; Michelson, W.E. Methods in Environmental and Behavioral Research; Van Nostrand Reinhold Co.: New York, NY, USA, 1987. [Google Scholar]
  33. Lang, J. The behavior setting: A unit for Environmental Analysis and Design. Creat. Archit. Theory Role Behav. Sci. Environ. Des. 1987, 113–125. [Google Scholar]
  34. Wang, D.; Brown, G.; Liu, Y.; Mateo-Babiano, I. A comparison of perceived and geographic access to predict urban park use. Cities 2015, 42, 85–96. [Google Scholar] [CrossRef]
  35. Wang, D.; Brown, G.; Zhong, G.; Liu, Y.; Mateo-Babiano, I. Factors influencing perceived access to urban parks: A comparative study of Brisbane (Australia) and Zhongshan (China). Habitat Int. 2015, 50, 335–346. [Google Scholar] [CrossRef]
  36. Wang, D.; Brown, G.; Liu, Y. The physical and non-physical factors that influence perceived access to urban parks. Landsc. Urban Plan. 2015, 133, 53–66. [Google Scholar] [CrossRef]
  37. Pham, N.D.; Pham, H.H. Notes on ecological urban development in Vietnam. Vietnam Architecture Magazine, 3 April 2002. [Google Scholar]
  38. Do, D.; Huang, J.; Cheng, Y.; Truong, T. Da Nang Green Space System Planning: An Ecology Landscape Approach. Sustainability 2018, 10, 3506. [Google Scholar] [CrossRef]
  39. Do, D.T.; Mori, S.; Nomura, R. An Analysis of Relationship between the Environment and User’s Behavior on Unimproved Streets: A Case Study of Da Nang City, Vietnam. Sustainability 2018, 11, 83. [Google Scholar] [CrossRef]
  40. Hùng, T. Tái Diễn Lấn Chiếm Vỉa Hè Làm Nơi Buôn Bán; Báo Đà Nẵng: Danang, Vietnam, 2018. [Google Scholar]
  41. Giang, L.A. Kinh tế vỉa hè—Kinh tế đô thị (Pavement Economic—Urban Economic). Vietnam Archit. J. 2016, 200, 23–26. Available online: http://kientrucvietnam.org.vn/paper/tap-chi-ktvn-so-200-2016/ (accessed on 23 December 2018).
  42. Loan, P.T. Đường phố—Hè phố: Cơ sở khoa học cho nghiên cứu thiết kế đô thị. Archit. J. Vietnam 2016, 200. [Google Scholar]
  43. Nhi, L.T.H. vỉa hè, không gian của cộng đồng (Pavement-community space). Vietnam Archit. J. 2017, 6, 58–61. [Google Scholar]
  44. Klein, C.; Kuhnen, A.; Felippe, M.L.; Silveira, B.B. Place-Centered or Person-Centered? Considerations about the Behavioral Mapping Approach. Trends Psychol. 2018, 26, 593–616. [Google Scholar] [CrossRef]
  45. Campbell, H.W.; Christman, S.P. Field techniques for herpetofaunal community analysis. Herpetol. Communities 1982, 13, 193–200. [Google Scholar]
  46. Da Nang People’s Committee. Location and Natural Conditions. 2018. Available online: https://web.archive.org/web/20181009042731/https://danang.gov.vn/web/en/detail?id=26029&_c=16407111 (accessed on 10 June 2019).
  47. Vietnam Institute for Building Science and Technology. Vietnam Building Code Natural Physical & Climatic Data for Construction; Vietnam Institute for Building Science and Technology: Hanoi, Vietnam, 2009; pp. 188–192. [Google Scholar]
  48. Hall, E.T. Proxemics: The Study of Man’s Spatial Relations; International Universities Press: New York, NY, USA, 1963. [Google Scholar]
  49. Heft, H. Ecological Psychology in Context: James Gibson, Roger Barker, and the Legacy of William James’s Radical Empiricism; Psychology Press: London, UK, 2001. [Google Scholar]
  50. Schoggen, P. Behavior Settings: A Revision and Extension of Roger G. Barker’s Ecological Psychology; Stanford University Press: Palo Alto, CA, USA, 1989. [Google Scholar]
  51. Jolliffe, I. Principal Component Analysis; Springer: Berlin, Germany, 2011. [Google Scholar]
  52. Shaw, P.J. Multivariate Statistics for the Environmental Sciences; Wiley: Hoboken, NJ, USA, 2009. [Google Scholar]
  53. Eisen, M.B.; Spellman, P.T.; Brown, P.O.; Botstein, D. Cluster analysis and display of genome-wide expression patterns. Proc. Natl. Acad. Sci. USA 1998, 95, 14863–14868. [Google Scholar] [CrossRef] [PubMed] [Green Version]
  54. Fredline, E.; Faulkner, B. Host community reactions: A cluster analysis. Ann. Tour. Res. 2000, 27, 763–784. [Google Scholar] [CrossRef]
  55. Mehaffy, M.W.; Porta, S.; Romice, O. The “neighborhood unit” on trial: A case study in the impacts of urban morphology. J. Urban. Int. Res. Placemaking Urban Sustain. 2015, 8, 199–217. [Google Scholar] [CrossRef]
  56. Alexander, C. A Pattern Language: Towns, Buildings, Construction; Oxford University Press: Oxford, UK, 1977. [Google Scholar]
  57. Alexander, C. The Nature of Order: The Phenomenon of Life; Taylor & Francis: Abingdon, UK, 2002. [Google Scholar]
  58. Alexander, C. The Nature of Order: The Process of Creating Life; Taylor & Francis: Abingdon, UK, 2002. [Google Scholar]
  59. Carlson, S.A.; Guide, R.; Schmid, T.L.; Moore, L.V.; Barradas, D.T.; Fulton, J.E. Public support for street-scale urban design practices and policies to increase physical activity. J. Phys. Act. Health 2011, 8, S125–S134. [Google Scholar] [CrossRef] [PubMed]
  60. Mateo-Babiano, I.B.; Ieda, H. Street space sustainability in Asia: The role of the Asian pedestrian and street culture. In Proceedings of the 7th International Conference of Eastern Asia Society for Transportation Studies, Beijing, China, 9–13 October 2007. [Google Scholar]
  61. Li, Z.; Munemoto, J.; Yoshida, T. Analysis of Behaviors along the Waterside in a Chinese Residential Quarter. J. Asian Archit. Build. Eng. 2011, 10, 85–92. [Google Scholar] [CrossRef]
  62. Pánek, J.; Benediktsson, K. Emotional mapping and its participatory potential: Opinions about cycling conditions in Reykjavík, Iceland. Cities 2017, 61, 65–73. [Google Scholar] [CrossRef]
  63. Brown, G.; Rhodes, J.; Dade, M. An evaluation of participatory mapping methods to assess urban park benefits. Landsc. Urban Plan. 2018, 178, 18–31. [Google Scholar] [CrossRef] [Green Version]
Figure 1. Location of Da Nang and street space samples.
Sustainability 11 03457 g001
Figure 2. Investigation route in two street spaces: (a) investigation path on Ong Ich Khiem St; (b) investigation path on Tran Phu St.
Sustainability 11 03457 g002
Figure 3. Behavior definition diagram.
Sustainability 11 03457 g003
Figure 4. Street sections division of Ong Ich Khiem St and Le Duan St: A & C sections - intersection spaces; B & D sections (middle street segment)– unit front houses on both sides.
Sustainability 11 03457 g004
Figure 5. Behavior categories formation.
Sustainability 11 03457 g005
Figure 6. A comparison of occurrence frequency of users’ behavior between two streets. (Unit: frequency).
Sustainability 11 03457 g006
Figure 7. The sections with high occurrence frequency and high level of diversity of behavior on two streets.
Sustainability 11 03457 g007
Figure 8. Section classification using cluster analysis.
Sustainability 11 03457 g008
Figure 9. Distribution of users’ behaviors in different typologies of space.
Sustainability 11 03457 g009
Figure 10. Three typical environment-behavior relationship patterns in street space: (a) OIK St; (b) LD St.
Sustainability 11 03457 g010
Figure 11. Results interpretation diagram and further analysis for discussion.
Sustainability 11 03457 g011
Figure 12. Characteristics of the first typical types of environmental behaviors.
Sustainability 11 03457 g012
Figure 13. Characteristics of the second typical types of environmental behaviors.
Sustainability 11 03457 g013
Figure 14. Characteristics of the third typical types of environmental behaviors.
Sustainability 11 03457 g014
Table 1. Street space samples overview.
Street NameOng Ich KhiemLe Duan
Street TypeCollector StreetsCollector Streets
Street ClassificationUnimprovedImproved (launch in 1998)
Length2.22 km2.17 km
DistrictHai ChauHai Chau
Width10.5 m15 m
Pavement Width1–4 m4–6 m
Landuse along the streetResidences, Commercial Buildings, Greenspace, Markets, School, Shop house, Administration Agency, Public buildingResidences, Commercial Buildings, Greenspace, Markets, School, Shop house, Administration Agency, Public building
Setback1.2 m1.2 m
Table 2. Quantizing occurrence frequency of users’ behavior units.
Behavioral CategorySpecific BehaviorsBehavior Frequency in Ong Ich Khiem StBehavior Frequency in Tran Phu StTotal
Accessibilitycrossing road6263125
leaving/coming with motorcycle421549970
leaving/coming without motorcycle146173319
walking for destination204209413
Tradingfood transaction fixed66571
goods transaction fixed251136
food transaction mobility781795
goods transaction mobility513586
Idlingwaiting for crossing road462369
waiting for others225150375
waiting for the bus42529
waiting for customers7036106
Service/ Maintenancecleaning7350123
commercial preparation572683
guarding46196242
public maintenance201434
repairing512677
Relaxationplaying212748
reading7567142
strolling7286158
looking others210180390
resting293968
chatting5066116
Otherseating8921110
inquiring7647123
drinking12236158
Table 3. Characteristics of physical environment on two streets.
SectionCommercial/Private ComponentPublic ComponentStreet Functions Component
Retail + ServiceFood SpotsRecreational FacilitiesOffices/Public AgencyVacanciesGreenspaceResidenceSidewalkAmenitiesObstructionsLandscapeWidthSignsTransportation
Width > 6m (Ld); > 4m (Oik) *Curb CutsBenchTrash CansFenceElectric Poles/Infra.Sign PolesMotorcycle Parking LineTreesAwningBalconySetback > 1.2 m *>15m (Ld st); > 10.5 m (Oik st) * Official SignsUnofficial SignsStore SignBus StopCar Parking AreaCrossing Lane
Ong ich khiem StreetA110000001100111011001101001
B111000010100010011100111000
B1410010010100110000011111000
A1511010000100101011011010001
Le duan StreetC110000011100010100100011001
D111010011101011111101111110
D911110100111111111011111100
C1000010100110011110111011001
* according to Da Nang Urban Planning Institute.
Table 4. Score of categories of physical environment in Ong Ich Khiem street.
Component
Axis 1Axis 2Axis 3Axis 4Axis 5
Store sign00.9590.0030.036−0.0120.117
Retail service00.9590.0030.036−0.0120.117
Residence00.8180.159−0.051−0.076−0.337
Awning00.7470.0840.042−0.2460.169
Balcony00.3240.8430.100−0.2440.051
Greenspace00.114−0.840−0.2660.1640.138
Vacancies−00.246−0.800−0.233−0.2800.166
Official signs−00.1130.589−0.3140.0190.129
Public agency00.169−0.0590.840−0.0650.058
Setback−00.2310.0860.7970.014−0.067
Bus stop00.0850.3190.618−0.155−0.048
Street width−00.095−0.1210.0760.860−0.005
Crossing/ pedestrian way−00.1510.040−0.3580.7850.137
Trash cans−00.0390.055−0.2380.0010.864
Unofficial signs00.280−0.1580.2970.1300.628
Eigenvalue3.9542.6711.9721.4781.254
Variance %26.36117.81013.1469.8508.363
Cumulative %26.36144.17057.31667.16675.529
Extraction Method: Principal Component Analysis. Rotation Method: Varimax with Kaiser Normalization.
a. Rotation converged in 6 iterations.
Table 5. Score of categories of physical environment in Le Duan street.
Component
Axis 1Axis 2Axis 3Axis 4Axis 5
Setback0.834−0.1780.083−0.135−0.060
Fence0.7980.0030.0330.181−0.041
Sign poles0.685−0.0390.047−0.3730.330
Public agency0.555−0.4500.2380.3980.084
Retail service−0.0060.8600.204−0.0490.139
Residence−0.1730.844−0.0520.248−0.005
Greenspace0.167−0.5310.116−0.495−0.273
Trees−0.040−0.1480.8490.0570.174
Bus stop0.1730.1810.8120.064−0.096
Recreational facilities0.1060.0830.582−0.4760.051
Sidewalk0.0530.1820.0510.8810.064
Food spots0.2390.1860.023−0.1270.815
Awning−0.1470.0080.0790.2400.789
Eigenvalue3.0092.3181.6561.3761.173
Variance %23.14917.83312.73910.5859.024
Cumulative %23.14940.98253.72164.30673.330
Extraction Method: Principal Component Analysis. Rotation Method: Varimax with Kaiser Normalization.
a. Rotation converged in 6 iterations.

