Abstract
This study discusses the organizational characteristics, driving factors, and value perceptions of small- and medium-sized construction enterprises in information and communication technology (ICT) implementation and investigates how the heterogeneous impacts of these features on subsequent ICT implementation practices are manifested. Based on questionnaire responses provided by 338 respondents from the Chinese construction industry, these associations were empirically tested using statistical methods, such as t-test, ANOVA, and correlation test. The analysis results indicate that the engagement of small- and medium-sized enterprises (SMEs) in ICT is a function of their annual sales turnover and the location in which they are operating, but no correlation was found with age, ownership structure, or business type. Moreover, strategic orientation was found to be the most effective driver in determining SMEs’ ICT-level, followed by pressures from competitors, incentive and mandatory policies from the government, intentions to improve work efficiency and quality, and ICT requirements from clients and partners, in that order. The findings further reveal that the differences in value perceptions generated after the adoption of ICT is the reason why SMEs tend to adopt less expensive ICT, that is, to use packaged rather than customized ICT, which can improve efficiency quickly, without considering the long-term benefits of the selected ICT. These findings provide insights for researchers and policymakers, allowing them to develop an in-depth understanding of the stimuli that are advantageous in ICT implementation in construction SMEs in developing countries.
1. Introduction
In order to achieve sustainable development in the construction industry, applying information and communication technology (ICT) to solve inherent problems, such as time and cost overruns, inefficiency, and safety and quality issues, has drawn increasing interest from both practitioners and academics over the past decade [1,2]. However, the integration of ICT into construction practices is very slow compared with that in other industries [3]. For instance, building information modeling (BIM) is still in the pre-adoption stage for the majority of construction enterprises [4], and enterprise resource planning (ERP) system technology is only used in large enterprises and has a high risk of failure [5]. Many types of ICT, such as radio frequency identification (RFID), three-dimensional (3D) laser scanning, augmented reality (AR), and mobile computing, are not popular, nor do they achieve the envisaged effect [6,7].
Based on the efficient-choice perspective for innovation diffusion [8], some recent studies have attributed the above situation to the insensitivity of ICT-related policies and the lack of research into ICT implementation in small- and medium-sized construction enterprises (SMCEs). An important underlying fact is that although SMCEs constitute the largest group in building supply chains (accounting for more than 90% in some countries), they are very inert in ICT adoption, which is widening the digital divide between large-scale enterprises and small- and medium-sized enterprises [9,10] and influencing the sustainable transformation and upgrading of the construction industry [11]. Due to the lack of finance, personnel, and knowledge relevant to the management and adoption of ICT [10], SMCEs are reticent to adopt new technology [12], invest little money into activities related to innovation [13,14], and are almost incapable of influencing ICT-related policymaking and technology diffusion. All of these limitations have hampered SMCEs’ ability to implement ICT [15,16] and, in turn, influence ICT innovation and diffusion in the entire construction industry [17].
Since the beginning of the 21st century, small- and medium-sized enterprises (SMEs) in the construction industry have realized the critical role of ICT in innovation, and several factors regarding the adoption of ICT have been explored [2,14]. First, many studies have highlighted how SMEs with different organizational characteristics (such as age, type, number of employees, annual sales turnover, etc.) adopt ICT. Love et al. [18] reported that different organization types significantly differ in ICT investment, but this is not impacted by annual sales turnovers or the number of employees. However, Acar et al. [19] found that as SMEs’ employees and turnovers become larger, contractors use ICT more intensively in many fields. Similar studies include Ahuja et al. [20] and Gledson and Phoenix [9]. Additionally, other influential factors in increasing the likelihood of the adoption of ICT include the following: ICT human capital skills, a firm’s decision-making process and support of visionary leaders, and inter-organizational research and development collaboration [14,21,22,23]. Some studies have focused on the analysis of internal and external factors that are most influential in affecting SMEs’ use of ICT, such as cost and resource availability [13,14,15,24]. Moreover, SMEs’ intentions for using ICT are greatly influenced by external forces, such as policies, industry environment, and cooperation with large enterprises [15]. The framework of the technology, organization, and environment (TOE) also represents the role of the industry’s external factors in SMEs adopting new technology [23,25]. However, the overall landscape in this research field is more or less unexplored. Not only is the available literature limited, but also the research findings are rather scattered and have little depth. There are hardly any studies that comprehensively identify why some construction SMEs implement more ICT and others less. This is a gap in extant SME theory that needs to be addressed. Some features of SMCEs may be enablers and others disablers in adopting ICT. It is necessary to propose a comprehensive framework that illustrates how SMCEs are distinguished from each other with respect to their ICT implementation. Relevant empirical evidence is necessary to help understand if and how different types of factors affect the extent of SMEs’ ICT implementation practice in the construction industry. Specifically, this study addresses three research questions: (1) Do significant differences exist in SMCEs’ ICT implementation across different organizational characteristics? (2) Is the difference in SMCEs’ ICT implementation a function of external driving forces? and (3) Are there significant differences in ICT levels based on different value perceptions after the implementation of ICT by SMCEs? Here, these research questions are explored using 338 survey data points collected from Chinese construction SMEs.
The remainder of this paper will present the research background and will secondly propose a theoretical framework on the relationship between ICT implementation and SMEs’ organizational characteristics, driving forces, and value perceptions. The methods used in this study will be described in Section 3. Section 4 presents the results and discussion of the data analysis, while Section 5 provides our conclusions, a discussion of the contributions and limitations of this study, and future research directions.
2. Research Background
2.1. Definition of SMEs in the Construction Industry
The study of SMEs has strong regional characteristics [21,22], not only with respect to research data from different countries, but also with respect to the different understanding of ICT implementation in each country. In the construction industry, SMEs not only make up the largest group in building supply chains (accounting for more than 90% in some countries), but they also produce almost all the physical aspects of construction [9,10]. Western studies tend to define SME by the number of employees [26]. For instance, the European Union (EU) Commission defines a small enterprise as 0–49 employees, while a medium company has up to 249 employees [27]. In Australia, a small business is defined as having between 5 and 20 people, and a medium enterprise has between 20 and 200 employees [15]. The United States and Canada have adopted a similar definition: an enterprise with less than 90 employees is small sized, and between 100 and 499 is medium sized [28].
In particular, some developing countries, such as China and Malaysia, tend to define SMEs based on annual sales turnover, the contractor’s tendering capacity, or the paid-up capital [29,30]. Considering that the data samples used in this study came from China, the definition and classification of SMEs adopted here was based on the official Chinese criterion issued by the Ministry of Industry and Information Technology (MIIT), which uses annual sales turnover or general assets as the group standard for determining the size of a construction enterprise (Table 1). We could not use number of employees to determine the size of an SME as most studies do, because in developing countries, because of low productivity, the number of employees in construction enterprises is much larger than that in other professional enterprises, such as engineering design enterprises, and many state-owned firms employ far more people than private firms of the same scale.

Table 1.
Definitions of small- and medium-sized enterprises (SMEs) in the Chinese construction industry.
2.2. SMEs and ICT Implementation in the Chinese Construction Industry
Since the mid-90s, the Chinese government has used ICT implementation as an important national strategy [31] to develop and utilize information resources, promote information exchange and knowledge sharing, improve the quality of economic growth, and to promote economic and social transformation. On a specific organizational level, ICT is seen as a collective term for a series of hardware, software, telecommunication, and information management techniques, applications, and equipment [21,32]. The main aim for such enterprises is to use ICT to support workflow, enhance organizational processes, and transform organization and strategy [33]. With this background, the Chinese construction industry has also experienced a process of ICT innovation and application over the past 30 years [34]. As shown in Table 2, this study divided this process into three stages (Info. 1.0, Info. 2.0, and Info. 3.0) based on past industry practices [35]. Each phase completed an upgrade relative to the previous phase and displayed many changes to the characteristics and application of the innovations.
Table 2.
Information and communication technology (ICT) implementation practice in the Chinese construction industry.
Although advanced ICT has been adopted and used by Chinese construction enterprises in the past 20 years (Table 2), the ICT level of the industry as a whole is still very low. More than 90% of enterprises are still between the Info. 1.0 and Info. 2.0 stages, and less than 10% of large-sized companies can successfully use the ERP system [35]. As mentioned by Dainty and Gledson [9,10], the ICT level of SMEs is the key to affecting the ICT level of the whole industry. In China, there are approximately 85,993 construction firms, which have 44,192,400 employees, and the overwhelming majority are SMEs, accounting for more than 90% of the total number of construction enterprises [30]. Although SMEs only create about 50% of the total output, almost all the physical aspects of construction are delivered by SMEs, while large-scale enterprises are only responsible for management. Unequal practices, diversified ownership structures, strong regionalism, and a low degree of specialization have led SMEs to make survival the primary motivation for all their actions, while having no ambition to innovate and develop [29,36]. Take BIM technology as an example, at present, 72% of SMEs in China do not use BIM or are not even familiar with BIM [35]. Therefore, in the vast supply chain network, if the ICT level of SMEs cannot be improved, enhancing the ICT level across the industry will be more challenging and be also slower than expected.
3. Theoretical Framework and Research Question
Based on innovation theories, such as innovations diffusion theory (IDT), TOE framework, resource-based view (RBV), and transaction cost theory (TC), established in other industries, innovation research on SMEs in the construction industry has just started recently [13,14,19]. In contrast with the resource-based view, which highlights enterprise heterogeneity and suggests that unique assets and capabilities of enterprises are important factors influencing their business strategies and providing direction for innovation [14,37], the market-based view emphasizes that the direction or quantity of innovation activities are influenced by their external environment or initial market conditions [38]. In view of this, two kinds of popular and comprehensive models of influencing factors on technological innovation have been formed. One is the TOE model. It is an organization-level framework that explains the effect of technology, organization, and environment on technology adoption decisions [39]. The other is the extended IDT model, which divides factors that affect technological innovation into industry, institutional, organizational, and project contexts [9].
Compared with large construction enterprises, SMEs usually operate in relatively simple and local business networks, so they are more susceptible to their characteristics and key events triggered by the external environment rather than within the SMEs themselves [40,41,42]. Therefore, according to the theory of reasoned action (TRA) [43], when the drivers from the external context emerge, the owners of SMEs predominantly filter and prioritize them based on their enterprise features and the benefits that the innovation can bring and then quickly make decisions and innovate to respond to the changing external conditions and partner needs [13]. Obviously, the characteristics of sensitivity to innovation indicate that the most effective way to promote ICT adoption by SMEs in the construction industry is to influence the behavior and strategic direction of SMEs through external stimulation. Meanwhile, perceived benefits generated after the adoption of ICTs should not be neglected. As Hosseini pointed out, the higher the ICT value perception of an enterprise, the greater the likelihood of further ICT investment [26]. Therefore, this study constructed a conceptual model at the industry level, which includes three categories of influencing factors: organizational characteristics, external driving forces, and value perceptions. Figure 1 illustrates a concept model containing these categories and their variables. Based on Table 2, ICTs levels were used to describe the situation of ICT implementation (Appendix A). All of these variables were based on industry practices and existing literature and are demonstrated in the presentation of the theory. Finally, this study addresses the question of whether or not SMEs with varying features differ with respect to ICT implementation.
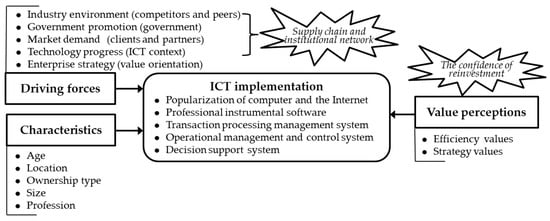
Figure 1.
Conceptual model of the impact of organizational characteristics, external driving forces, and value perceptions on small- and medium-sized construction enterprises’ (SMCEs) ICT implementation level.
3.1. Organizational Characteristics and ICT Implementation
The existing literature usually uses firmographics as independent variables or control variables in the process of studying the influence of organizational characteristics on ICT adoption. In general, demographics are statistics with people as the objects, while firmographics, also known as emporographics or firm demographics, are sets of characteristics used to subdivide prospect firms [44]. These characteristics can be general assets but also include annual sales turnover, number of employees, market capitalization, and available cash [45]. Because it is a combination of demographics and geographies, sometimes firmographics can even comprise duration of operation, number of branches, additional events organized, and the nature of products and services offered [46].
Past studies have suggested that SMEs with different sizes have different innovation strategies and abilities [47,48]. As enterprises become larger, their number of employees and revenue increase and their innovation systems become more matured and structured [49], so they have greater R&D capabilities and resources to absorb new knowledge and explore new technology [50]. Having said this, only after obtaining financial stabilization, are SMEs willing to improve and innovate [51]. As Acar et al. [19] noted, as enterprises become larger, they use ICT more intensively in many aspects. Ahuja, Yang, and Shankar [20] also suggested that SMEs with higher turnovers and larger organizations have a higher adoption rate of ICT. Overall, the number of employees and sales turnover of an organization are the most commonly used variables and appear to explain the effects of organizational characteristics on ICT implementation.
In addition, a firm’s age, location, ownership structure, and business type are also considered to be important factors affecting the implementation of ICT. With respect to learning curve effects [52], as an enterprise grows older, its ability to identify and utilize useful information increases [53], and it becomes more efficient and effective in managing knowledge flows and enforcing connections with external entities [54]. Barrett and Sexton [51] pointed out that SMEs usually go through five development phases, i.e., existence, survival, success, take off, and resource maturity. Only when an SME achieves financial stabilization will it pay more attention to technological innovation [9]. Moreover, the significance of innovative activity in an enterprise’s local operating context has been widely proven. Enterprises in developed regions have more market opportunities, collaborative networks, and technology transfers than those in underdeveloped regions, and they develop greater innovation intensity [55]. According to the observed practice of the Chinese construction industry [35], we found that SMEs on the east coast generally have higher ICT abilities and levels than in the west.
By the same token, an enterprise’s ownership structure plays an important role in ICT adoption. It is essential for an enterprise to use levels of autonomy and control over their decisions and orientation [56]. Usually, state-owned enterprises are less independent in making decisions than private ones, which then limits their innovative performance [57], and they also lack a culture of supporting innovation. The construction industry is no exception [58]. In addition, the industry or professional type is also often considered to be a crucial feature related to ICT adoption. Gordon [59] found that enterprises within an industry share certain industry-driven cultural elements that are required for survival. Firms in industries, such as Information Technology (IT), electronics, and other high-tech industries, are always more willing to innovate than others due to market demands, culture values, and industry context. In the construction industry, architects and engineers show high level of ICT adoption, but construction managers and contractors do not [3].
To sum up, to prove the effect of organizational characteristics on ICT implementation, five characteristics (age, size, location, ownership type, and business type) were selected as analysis variables. Each variable was described by multiple dimensions (Appendix A).
3.2. Driving Forces of ICT Implementation
Due to the lack of finance, personnel, and knowledge relevant to management and adopting ICT [10], SMEs are likely to broaden the industry trend and be less technically innovative than large-sized enterprises [60]. Most of the existing literature analyzes SMEs’ innovation from a resource-based perspective, which highlights enterprise heterogeneity and suggests that unique assets and capabilities of enterprises are important factors influencing their business strategies and providing direction for innovation [14,37,61]. They suggest that risk, uncertainty, and resources (e.g., humans, finance, and infrastructure) are the most important factors influencing SME innovation [13,14,15,24]. Only after obtaining financial stabilization are SMEs willing to improve and innovate [51].
However, from the market-based view, research has emphasized that driving forces for SMEs’ ICT adoption come from a number of fluctuating inter-organizational networks of varying complexity, i.e., the supply chain networks and the institutional networks [42,62]. The former plays a role through enterprises’ normal client and supply chain interactions, while the latter, involving governments, educational institutions, and professional associations and so on, affects enterprises’ innovation by making policies, transferring knowledge, or creating an innovative industry environment [15,42]. Oyebiyi et al. (2017) pointed out that SMEs are being driven to adopt ICT because of the influence of customers and suppliers, in order to improve their customer service and keep up with competitors and enhance supplier relationships. Arayici et al. [63] showed that incentive and mandatory policies from the government put the construction industry under pressure to supply value for money, sustainable design, and construction, all of which are directly related to the implementation of new technology. Of course, given the competitive nature of the construction industry, these pressures may also come from clients or competitors who are using or wanting to use ICT [64]. The TOE framework also demonstrates the significant role of the industry’s external context, including technological progress, competitors, and interactions with the government, in which an enterprise adopts a new technology [23,25]. In addition, according to the discussion of the conceptual model, strategic orientation for ICT adoption within an organization and for projects was also found to be an important driving force [14]. Thus, based on two studies [18,35], in this study, we categorized and measured five types of driving forces, as shown in Appendix A.
3.3. Value perceptionsand ICT Implementation
Value perception for ICT implementation refers to the values or benefits that an enterprise perceives after using an ICT [19]. The higher the ICT value perception of an enterprise, the greater the likelihood of further ICT investment [26]. The principal part of value perception is the enterprise itself, while the object of perception is the actual benefits enjoyed after use of the ICT. Typically, due to a time lag, productivity benefits are not reflected until the industry’s technology diffusion rate exceeds 50% [65,66]. Hence, in this study, the perceived benefits are different from the technical progress-based ICT drivers (possible benefits) and relate to the confidence of SMEs in investing in new ICT in the future. Enterprises adopt an ICT because of the benefits the ICT may bring, but this does not guarantee that the benefits and expectations of adopting the ICT are completely consistent.
Previous studies have established sufficient evidence of the values or benefits of ICT implementation in SMEs. A number of these values are applicable to general practices, including the potential for ICT to facilitate a broad range of intra- and inter-enterprise business operations and transactions by enhancing productivity and work effectivity [67], reducing transaction costs [68], promoting organizational and commercial reform, improving communication and collaboration processes [69], boosting knowledge transfer and management [70], improving customer/supplier satisfaction or quality of services [21], and enhancing competitive advantage and increasing market share [19,66]. Similarly, Tan et al. [67] made a relatively systematic summary of the benefits of ICT adoption.
In summary, in addition to the categorization of direct values and intangible values, Peters [71] concluded that the benefits of information technology and systems can be divided into three categories, namely improved productivity, expanded business, and minimized risk. In industries such as construction, Acar et al. [19] categorized the perceived influence of ICT implementation into two sides, namely the improvement of office performance and construction performance. Based on the study from Demmel and Askin [72], Love et al. [18] classified ICT benefits as being strategic values, tactical values, and operational values. In other words, ICT not only enhances work effectiveness and reduces labor costs, but also influences organizational structure and business processes [73]. Considering that tactical and operational values are based on efficiency [18], and in order to facilitate data collection, this paper divided ICT value perceptions into efficiency values and strategy values based on the practice in China, which contained many measurement variables, as given in Appendix A.
4. Research Methodology
4.1. Sample, Proceduress and Measures
The analysis of this study is based on a big dataset that includes diverse information at the organizational level of SMEs in China’s construction industry. The data was collected via a large-scale online survey conducted in 2016 (from July to October), as it enabled the researchers to reach a large sample at a relatively low cost. The structured questionnaire for the survey consisted of four distinct sections referring to an enterprise’s ICT implementation levels, organizational characteristics, driving forces, and value perceptions. The questionnaire did not allow for anonymity and required the respondents to be middle or top managers.
Through ‘the stratified sampling method’, which is often considered to be an appropriate method for studying ICT adoption within the construction industry [19], SMCEs were selected from seven regions (the northeast, north, east, central, southwest, northwest, and south). With the assistance of government departments, the questionnaire required senior managers of enterprises to complete the survey non-anonymously. However, it was discovered in the preliminary survey that most SMCEs from non-core cities of these regions demonstrate a very low level of ICT adoption and a high degree of homogeneity [74], and the managers also lacked knowledge and awareness of ICT development. It was difficult to obtain effective data by completely random sampling. Therefore, the questionnaire was distributed to cities above the third tier in China (referring to the five levels of China’s urban hierarchy of 2018), in which ICT development is more mature and SMCEs have more opportunities to adopt ICT. Out of 1200 questionnaires distributed electronically by e-mail, 769 managers from 632 firms returned the forms. The process of data cleaning was conducted as follows: questionnaires filled out by management personnel below the mid-level were excluded. Questionnaires from cities below the third tier were excluded. Questionnaires with annual turnover over ¥800 million according to the definition of SMCEs were excluded. Ultimately, 338 forms from 338 SMEs were completed and deemed usable (response rate: 28.2%).
The detailed measurement items can be found in Appendix A. The validity and reliability of the data were established, and Cronbach’s alpha was greater than 0.8. Specifically, the level of ICT implementation was measured with a five-item scale [23,35,75]. These terms were converted to a scale of one to five, with one indicating the lowest level (level 1) and five indicating the highest level (level 5). The SMEs’ organizational characteristics were measured using five questions, which required the SMEs surveyed to provide the following information: the firm’s age, location, size, type of ownership, and business type. Based on two prior studies [15,23,25], driving forces were categorized into five types, and these types were measured using a three-point (‘yes’, ‘no’, or ‘not sure’) scale, respectively. Value perception was measured with a 10-item scale [18]. Five items measured the efficiency value, while five terms measured the strategy value. Each item was measured in the same way as the driving forces.
4.2. Data Description
Focusing on the level of ICT implementation (Appendix A and Table 3), we found that the majority of surveyed SMEs (45%) are at the stage of developing and applying the transaction processing management system (e.g., office automation (OA), e-Portal, file, personnel, knowledge, and equipment management). The use of computers and the internet has become widespread in SMEs (e.g., personal computers (PCs), laptops, instant messaging (IM) devices, the internet, office software). At least 82.3% were using professional instrumental software, such as computer-aided design (CAD), project planning, estimating, quantity calculation, video surveillance, and engineering calculation software, and 56% had the ability to adopt a transaction processing management system. All of these data indicate that most of the SMEs surveyed were moving from level 2 to level 3, while a few of the SMEs surveyed had reached level 4 (e.g., ERP, project management information system (PMIS), finance, human resources, contract, cost, procurement, and a budget management system) or above. That means that SMEs that use ICT to realize operational management and control (level 4) only accounted for 11% of the total, let alone the development and application of a decision support system (level 5), which only accounted for 0.9%.
Table 3.
Dataset description: level of ICT implementation.
As shown in Table 4, almost 50% of the firms surveyed were established between 2000 and 2016, with the average age being 13.4 years. In regard to the location of firms, most of the respondents came from northeast China (53%) and east China (29.3%). In addition, almost 82.8% of the respondent firms were privately-owned, 49.1% were construction firms, and 32.2% were design firms. The number of micro (37%), small (25.4%), and medium (37.6%) firms was relatively evenly distributed.
Table 4.
Dataset description: organizational characteristics.
Table 5 shows that the requirements of clients and partners were the most common driving force, i.e., the respondents would agree that a major determinant of ICT adoption is market demand (MD) instead of government promotion (GP) (only 5%), while the other parts are 13% industry environment (IE), 24% technology progress (TP), and 11.8% enterprise strategy (ES), respectively. For value perception variables, Table 6 indicates that the mean score of the efficiency value and strategy value were 3.97 and 1.21, respectively. Moreover, 95.9% of the respondents surveyed believed that ICT can enhance productivity and work effectivity, but the proportion of perceived strategy values was low.
Table 5.
Dataset description: driving forces.
Table 6.
Dataset description: value perceptions.
After a preliminary data description, some samples of variables were found to be too small (less than five), so necessary modifications were made with respect the variables. Based on the informatization development level of the regional construction industry [35], the firm’s location can be merged into two categories: developed and underdeveloped areas. The former includes respondents from Shanghai, Jiangsu, Guangdong, Shandong, Zhejiang, Beijing, and Liaoning, and the latter includes respondents from Jilin, Shanxi, Jiangxi, Hebei, Sichuan, Qinghai, and Yunnan. Additionally, during the investigation, it was found that few enterprises specialized in the business of operations and maintenance, while many ‘other’ responses (24%) were from management consulting firms. Hence, the variable of a firm’s profession was reclassified into three categories: consulting firms (survey, planning, design, and management consultation), construction firms, and comprehensive firms (both consulting and construction). In Section 5, the revised variable types will be used.
5. Data Analysis, Findings, and Discussions
The research questions discussed previously were tested using the survey data collected from 338 SMEs in China’s construction industry. Considering the purpose of this study and the type of data collected, the most suitable statistical techniques for this study were t-tests, ANOVA, and correlation tests [3,66]. In terms of intra-group difference analysis, one-way ANOVA and t-test were conducted to compare the means of the respondents’ ICT implementation as a percentage of the analyzed variables and to determine whether there were any significant differences among them. To do this, Kruskal–Wallis test (a nonparametric test equivalent to ANOVA in SPSS) was used to analyze the ordinal scale of measurement, such as age, size, and driving forces. For the nominal scale of measurement (location and ownership type), t-test was adopted. In particular, Tukey’s test (an ANOVA test in SPSS) was used to show more clearly the impact of differences in perceived strategy value on the level of ICT implementation. In terms of inter-group difference analysis, multi-factor ANOVA was used to analyze whether there were significant differences in the impacts of the variables of organizational; characteristics, driving forces, and value perceptions on the level of ICT implementation. Correlation analysis further was used to determine the extent to which these variables affect the level of ICT implementation. Of all the significance levels, this study adopted α = 0.05. Therefore, if the value of p was less than 0.05, then there was a significant difference between tested groups. The results of the statistical tests are presented and discussed in the following sub-section.
5.1. ICT Implementation and Organizational Characteristics
The first objective of this study was to explore whether significant differences existed in ICT implementation across different organizational characteristics. Figure 2 and Table 7 provides the results for the question. All organizational characteristics studied (age, size, location, profession, and ownership type) show significant differences within their respective groups with respect to ICT implementation (p < 0.05), but when analyzing the findings further, only the SMEs’ location (p = 0.043) and size (p = 0.000) have a significant impact on their ICT implementation level.
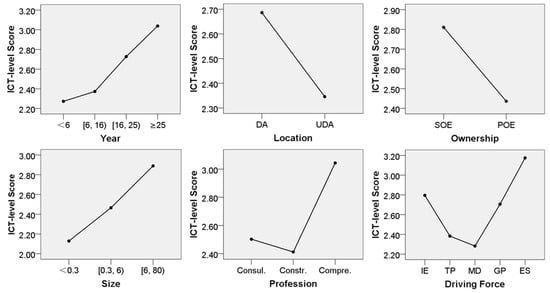
Figure 2.
Organizational characteristics and driving forces of ICT implementation.
Table 7.
Results for organizational characteristics.
Specifically, SMEs operating for more than 16 years had a higher level of ICT implementation than those operating for less than 16 years (compared with the first group ‘less than 6 years’, the order of p values was as follows: 0.476, 0.004, 0.000). It is worth noting that micro, small, and medium enterprises varied from one other with respect to ICT level (compared with the first group ‘less than 3 million’, the order of p values was as follows: 0.006, 0.000). This implies that the larger the size, the higher the ICT level. The ICT level values of comprehensive firms (both consulting and construction businesses) were significantly higher than construction firms and consulting firms (compared with the group ‘comprehensive firms’, the order of p values was as follows: 0.009, 0.002). Interestingly, no significant differences were found between consulting and construction firms with respect to their implementation of ICT. Additionally, in the testing of location and ownership type, a two-sided t-test was used. The test found that the mean ICT level values for the developed areas (DAs) and non-privately-owned enterprises (NPOEs) were higher than the mean ICT level values for the underdeveloped areas (UDAs) and privately-owned enterprises (POEs; p-Location = 0.001, p-Ownership = 0.005). These findings are shown in Figure 2 and Table 7. However, the results of the multi-factor ANOVA show that only the SMEs’ location (p = 0.043) and size (p = 0.000) had a significant effect on their ICT implementation level, while no significant differences were found with respect to age (p = 0.406), ownership type (p =0.285), and profession (p = 0.183) in their ICT implementation level.
These analyses show that organizational characteristics, which indicate a higher level of ICT implementation are as follows: age (more than 16 years), operation location (developed areas), ownership type (non-private ownership structures), relative scale (large), and type of business (both consulting and construction businesses). If an SME fit into any one of these organizational characteristics, it was more likely to have a higher ICT level than those who do not. When all organizational features are taken into account together, only annual sales turnover and operation location were highly correlated with the ICT level of SMEs. This implies that when an SME implements a new ICT, it does not matter if the SME is young or old, state-owned or privately-owned, or engaged in design or construction. This finding contradicts those that emphasize the effect of an SME’s age on the implementation of ICT [9] but is consistent with those that highlight differences in ICT implementation based on size (annual turnover or number of employees) [10,19,76]. The opposite view has also been put forward, which suggested that the ICT investment of SMEs is not influenced by firm size [18]. It is worth noting that few studies have focused on the impact of location on ICT adoption. Consoli (2012) pointed out that the location of SMEs is one of the most important determinant factors in new ICT adoption. As we have investigated, even when there is the same level of annual turnover, many SMEs in underdeveloped areas have a much lower ICT level than those in developed regions. Many SMEs depend on special local resources for survival, such as political or non-political guanxi (personal relationships) with local large-sized firms, meaning they lack the motivation to innovate independently [77]. In addition, SMEs in developed areas may have more market opportunities, collaborative networks, and technology transfers than those in underdeveloped areas and may develop greater innovation intensity [55]
5.2. ICT Implementation and Driving Forces
The second objective of this study was to explore whether the difference in SMEs’ ICT implementation was a function of external driving forces. Figure 2 and Table 8 provide the answer to this question. Analysis results of a one-way ANOVA show that there are significant differences among the five categories of driving forces in terms of engagement in ICT (F = 10.057, p < 0.05), but the results of the correlation analysis show that only strategic value perception has a significant positive correlation with the level of SMEs’ ICT implementation (r = 0.267, p = 0.000).
Table 8.
Results for driving forces.
In detail, Tukey’s multiple comparison results show that the groups of GP, IE, and ES differed from the other groups (MD and TP) with respect to mean ICT level values. However, considering the fact that the different dimensions had a different number of respondents in each dimension (unequal N values), the mean ICT level values disregarding the N values were more accurate than Tukey’s multiple comparison results. Therefore, based on the mean ICT level values, the order of driving forces from the lowest influence to the highest was as follows (Figure 2 and Table 8): MD ( = 2.282), TP ( = 2.383), GP ( = 2.706), IE ( = 2.796), and ES ( = 3.175). It could be found that there were three distinct groups of ICT levels: (1) MD and TP had the lowest likelihood of promoting the ICT level, (2) GP and IE had a moderate likelihood of promoting the ICT level, and (3) ES had the highest likelihood of promoting the ICT level. These findings were confirmed by a correlation analysis. First, this study revised the data, made the driving force’s dimensions into dumb variables, i.e., ‘0′ and ‘1′ variables, and then Pearson’s correlation test was used. Second, there was no consensus among the existing studies on the effect of the external driving forces on ICT implementation. The same dimension often has both a positive and negative relationship with the ICT level. Hence, this testing adopted a two-sided test rather than a one-sided test. Table 8 shows that significant linear relationships were found with respect to ICT implementation based on ES (r = 0.267, p = 0.000) and IE (r = 0.123, p = 0.023). Interestingly, GP (p = 0.349) and TP (p = 0.193) did not have a significant linear relationship with ICT level values. Pearson’s correlation for the test of MD and ICT level values was r = −0.218 with a p value of 0.000, showing that there was a negative relationship between the ICT level and ICT requirements from clients and partners.
These findings reveal that strategic planning for ICT adoption within an SME was the most effective enabler for the improvement of ICT levels [14], followed by pressure from competitors who are using ICT, while the role of incentive and mandatory policies from the government was not significant. It is worth noting that in China, SMEs’ differences in ICT implementation were an inverse function of MD and TP. This means that the whole Chinese construction supply chain network (clients and partners) lacks the motivation and willingness to stimulate SMEs to innovate with respect to ICT use compared with institutional networks (e.g., government). Furthermore, this suggests that SMEs are not active in improving work efficiency and quality through new ICT, and clients and partners do not impose higher requirements regarding ICT implementation for them. Therefore, we inferred that the driving forces of imbalance, just relying on strategic planning and pressure from competitors, may be the most important cause of the low level of ICT implementation in SMEs. In China, almost all the physical aspects of construction are delivered by SMEs, while large-scale enterprises are only responsible for management. If ICT requirements from clients and large-sized firms are very low, and incentive and mandatory policies from the government are not enough to encourage ICT implementation, it is unlikely that SMEs will be motivated to improve their ICT level due to resource constraints. Moreover, if each industry participant only passively adopts ICT, the ICT level of the whole industry will fall into a vicious circle.
5.3. ICT Implementation and Value Perceptions
The third objective of this study was to explore whether there are significant differences in ICT levels based on value perceptions after the implementation of ICT by SMEs. As shown in Table 9, this test found that there are significant differences in perceived efficiency values (p = 0.006) and strategy values (p = 0.000) in the different ICT levels. Interestingly, the results of Tukey’s test showed that no significant differences were found among SMEs in different perceived efficiency value groups with respect to their ICT implementation (p = 0.260), but the perceived strategy value groups, regarding their ICT levels, were divided into three subsets, and there were significant differences between them. As mentioned above, in order to avoid analysis error (unequal N values), the order of perceived strategy value from lowest influence to the highest was as follows: computer and internet ( = 0.45), professional software ( = 1.090), transaction processing ( = 1.145), operational control ( = 2.941) and decision support system ( = 3.333).
Table 9.
Test results for value perceptions.
Although the SMEs showed no significant differences in the tactical and operational benefits (efficiency values) generated after the adoption of ICT, differences were found with respect to the strategic benefits (Figure 3). Therefore, combined with the above discussion (see Table 2 and the part of the theoretical framework), we further concluded that SMEs tend to adopt less expensive ICT, that is, to use packaged rather than customized ICT, which can improve efficiency quickly, and without considering the extendibility of the ICT [78]. In this way, in view of the inherent fear of strategic risks and uncertainties, most SMEs lack the foresight to invest in an advanced ICT, and therefore, they behave as if they are satisfied with the status quo or improving passively rather than formulating strategic plans.
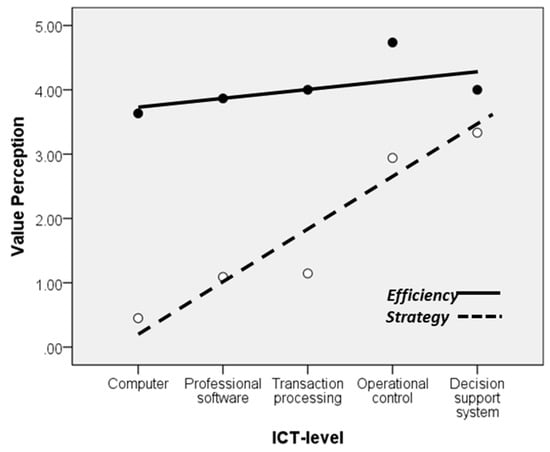
Figure 3.
Interaction effect of ICT implementation on value perceptions.
6. Conclusions
In this paper, we developed and empirically tested a concept model to explain how the studied SMEs differed in ICT adoption owing to their organizational characteristics, driving forces, and value perceptions. These associations were empirically tested using statistical methods, such as t-test, ANOVA, and correlation test. The findings indicate that SMEs’ engagement in ICT was a function of their annual sales turnover and the location in which they were operating, but no correlation was found with age, ownership structure, or business type. Moreover, strategic orientation was found to be the most effective driver in determining SMEs’ ICT level, followed by pressure from competitors, incentive and mandatory policies from the government, intentions to improve work efficiency and quality, and ICT requirements from clients and partners, in that order. The findings further reveal that while the majority of SMEs perceived only the tactical and operational benefits (efficiency values) generated from the adoption of ICT, only a few SMEs perceived the strategic benefits produced by ICT use, and these SMEs were more willing to invest in new ICT and thus had a higher ICT level. This is the reason SMEs tend to adopt less expensive ICT, that is, to use packaged rather than customized ICTs, which can improve efficiency quickly, without considering the long-term benefits of the selected ICTs.
Compared with large enterprises, SMEs demonstrate significant differences in innovation capability and output, and this difference must be understood and used as a basis for policy and corporate guidance [14,79]. In view of the high degree of discordance in the related research findings regarding the reasons for adopting and implementing innovations by SMEs [14,21,22], this study contributes knowledge to the existing literature by proposing a theoretical framework of ICT implementation by SMEs in the construction industry based on the theories of TOE, IDT, and TRA. Thus, this study extends the applicability of these three theories into the context of SMEs’ ICT implementation in the conservative construction industry. By integrating four categories of factors relating to ICT adoption—namely (1) supply chain network and institutional network, (2) enterprise strategy, (3) firmographics, and (4) value perception—into our research model, we also contribute to the understanding of the stimuli that are advantageous to ICT implementation in construction SMEs. Considering that the definition of and data relating to SMEs used in this study were from China, research results can also provide direct empirical experience that is useful for stakeholders in developing countries. Additionally, the findings here contribute to the literature by providing academics and practitioners with scholarly knowledge that better informs their debates and provides direction for further studies on ICT implementation by SMEs in the construction industry.
If there is no ICT upgrading in SMEs, there will be no sustainable development of the industry. The empirical results provided by this study also have several practical significances. First, based on these results, stakeholders, including the government, researchers, sponsors, and financial institutions, can be more sensitive to and supportive of SMEs’ ICT implementation by consciously using the findings to develop workable policies that support plausible and sustainable informatization innovations in SMEs. For instance, SMEs’ ICT adoption should be implemented step by step and based on each SME’s income and operation location so that medium-sized enterprises in relatively developed areas can be the driving force behind ICT promotion. Moreover, the cultural issue that customers and partners are still accustomed to imposing low informatization requirements needs to be taken seriously. Second, potential SMEs may obtain useful knowledge from this study in order to analyze the situation they are currently facing and to make informed decisions about investing in ICT and formulating effective business strategies. Third, the results also potentially provide guidance for practitioners and academics, that is to concentrate more efforts on the three areas that help improve the level of SMEs’ ICT implementation: financing, the interactive impact of the local supply chain network and institutional networks, and the cultivation of strategic orientation.
7. Limitations and Future Research Directions
With regard to the limitations of this study, one could question the current sample size given that unequal N values for different variables were used in the tests conducted here. However, this limitation may not have any drastic effect on the conclusions of this study. The sample size of each variable in our study met the requirements of an exploratory study because of the homogeneity of the variance test [80]. Another limitation was that our samples all came from the Chinese construction industry, which may be responsible for the explanatory power of the research findings. A natural extension of this study would be to compare how organizational characteristics, external driving forces, strategic orientation, and value perceptions of ICT adoption reveal themselves in different cultural and market environments, thus helping us to further understand which stimuli are the core factors promoting SMEs’ ICs innovation in the construction industry and how they work. Based on other theoretical perspectives, such as organizational learning, future research should incorporate more related factors, such as types of collaboration networks and characteristics of the innovation context [81], and further describe and test the interaction mechanism of factors at different levels during the ICT adoption process for construction SMEs.
Author Contributions
Conceptualization, G.W., P.P., and H.L.; funding acquisition, G.W.; investigation, H.L. and Y.X.; methodology, H.L.; writing—original draft, H.L.
Funding
National Natural Science Foundation of China: grant no. 71771172; and China Scholarship Council: grant no. 201706260209.
Acknowledgments
The authors are grateful to the respondents for their participation in this research survey, as well as Bin Lu, Kaihua, Jianli, Yuqing, Xinhua, Yang, and Bing Dong at Tongji University and Georgia Tech for their valuable assistance during the research design and data collection processes. The authors also would like to thank the editor and the reviewers for their helpful suggestions.
Conflicts of Interest
The authors declare no conflicts of interest.
Appendix A
Measure
Levels of ICT Implementation
What are the levels of ICT implementation in the enterprise you are working for?
- Level 1
- Popularization of computer and the internet, e.g., personal computer (PC), laptop, instant messaging (IM) device, Internet, and office software (characteristics: direct purchase; strong generality).
- Level 2
- Application of professional instrumental software, e.g., CAD, project planning, estimating, quantity calculation, video surveillance, and engineering calculation software (characteristics: direct purchase; strong generality).
- Level 3
- Development and application of transaction processing management system, e.g., office automation (OA), e-Portal, file management, personnel management, knowledge management, and equipment management system (characteristics: direct purchase; a small amount of customization; strong generality).
- Level 4
- Development and application of operational management and control system, e.g., enterprise resource planning (ERP) system, project management information system (PMIS), finance, human resources, contract, cost, procurement, and budget management system (characteristics: customization; a small amount of purchase; weak generality).
- Level 5
- Development and application of decision support system (provide decision support to top managers), e.g., strategic management decision support system, risk management decision support system (characteristics: customization; weak generality).
Organizational Characteristics
- Firm’s age: less than 6 years; 6–16 years; 16–25 years; over 25 years.
- Firm’s location: northeast China; north China; east China; central China; southwest China; northwest China; south China.
- Firm’s ownership: non-privately-owned enterprise (state-owned and mixed ownership); privately-owned enterprise.
- Firm’s annual turnover: less than 3 million; 3–60 million; 60–800 million (RMB ¥).
- Firm type (business area): planning; survey; design; construction; operation maintenance.
Driving Forces
- Industry environment (IE): pressures from competitors who are using ICT.
- Government promotion (GP): incentive and mandatory policies from government.
- Market demand (MD): requirements from clients and partners.
- Technology progress (TP): intentions to improve work efficiency and service quality.
- Enterprise strategy (ES): support the strategic direction of the enterprise (e.g., to gain a competitive advantage; improve profitability; leader in new ICT).
Value Perceptions
- Perceived efficiency values: enhanced the productivity and work effectiveness; reduced labor costs; improved quality of services; improved communication and collaboration processes; improved integration with internal and external relationships.
- Perceived strategy values: enhanced competitive advantage; increased market share; improved client/partner relationship; leader in new ICT; promoting organizational and commercial reform.
References
- Isikdag, U.; Underwood, J.; Kuruoglu, M.; Goulding, J.; Acikalin, U. Construction informatics in Turkey: Strategic role of ICT and future research directions. Electron. J. Inf. Technol. Constr. 2009, 14, 412–428. [Google Scholar]
- Lu, Y.; Li, Y.; Skibniewski, M.; Wu, Z.; Wang, R.; Le, Y. Information and communication technology applications in architecture, engineering, and construction organizations: A 15-year review. J. Manag. Eng. 2014, 31, A4014010. [Google Scholar] [CrossRef]
- Davis, K.A.; Songer, A.D. Resistance to IT Change in the AEC Industry: Are the Stereotypes True? J. Constr. Eng. Manag. ASCE 2009, 135, 1324–1333. [Google Scholar] [CrossRef]
- Cao, D.P.; Li, H.; Wang, G.B.; Huang, T. Identifying and contextualising the motivations for BIM implementation in construction projects: An empirical study in China. Int. J. Proj. Manag. 2017, 35, 658–669. [Google Scholar] [CrossRef]
- Hadidi, L.; Assaf, S.; Alkhiami, A. A Systematic Approach for Erp Implementation in the Construction Industry. J. Civ. Eng. Manag. 2017, 23, 594–603. [Google Scholar] [CrossRef]
- Xue, X.L.; Shen, Q.P.; Fan, H.Q.; Li, H.; Fan, S.C. IT supported collaborative work in A/E/C projects: A ten-year review. Autom. Constr. 2012, 21, 1–9. [Google Scholar] [CrossRef]
- Alsafouri, S.; Ayer, S.K. Review of ICT Implementations for Facilitating Information Flow between Virtual Models and Construction Project Sites. Autom. Constr. 2018, 86, 176–189. [Google Scholar] [CrossRef]
- Abrahamson, E. Managerial Fads and Fashions-the Diffusion and Rejection of Innovations. Acad. Manag. Rev. 1991, 16, 586–612. [Google Scholar] [CrossRef]
- Gledson, B.J.; Phoenix, C. Exploring organisational attributes affecting the innovativeness of UK SMEs. Constr. Innov. 2017, 17, 224–243. [Google Scholar] [CrossRef]
- Dainty, A.; Leiringer, R.; Fernie, S.; Harty, C. BIM and the small construction firm: A critical perspective. Build. Res. Inf. 2017, 45, 696–709. [Google Scholar] [CrossRef]
- Zhang, Y.; Zheng, J.; Darko, A. How Does Transformational Leadership Promote Innovation in Construction? The Mediating Role of Innovation Climate and the Multilevel Moderation Role of Project Requirements. Sustainability 2018, 10, 1506. [Google Scholar] [CrossRef]
- Shapira, A.; Rosenfeld, Y. Achieving Construction Innovation through Academia-Industry Cooperation-Keys to Success. J. Prof. Issues Eng. Educ. Pract. 2011, 137, 223–231. [Google Scholar] [CrossRef]
- Sexton, M.; Barrett, P. Appropriate innovation in small construction firms. Constr. Manag. Econ. 2003, 21, 623–633. [Google Scholar] [CrossRef]
- Sexton, M.; Barrett, P. A literature synthesis of innovation in small construction firms: Insights, ambiquities and questions. Constr. Manag. Econ. 2003, 21, 613–622. [Google Scholar] [CrossRef]
- Hardie, M.; Newell, G. Factors influencing technical innovation in construction SMEs: An Australian perspective. Eng. Constr. Archit. Manag. 2011, 18, 618–636. [Google Scholar] [CrossRef]
- Bach, M.P.; Zoroja, J.; Vukšić, V.B. Review of corporate digital divide research: A decadal analysis (2003–2012). Int. J. Inf. Syst. Proj. Manag. 2013, 1, 41–55. [Google Scholar]
- Shelton, J.; Martek, I.; Chen, C. Implementation of innovative technologies in small-scale construction firms: Five Australian case studies. Eng. Constr. Archit. Manag. 2016, 23, 177–191. [Google Scholar] [CrossRef]
- Love, P.E.D.; Irani, Z.; Edwards, D.J. Industry-centric benchmarking of information technology benefits, costs and risks for small-to-medium sized enterprises in construction. Autom. Constr. 2004, 13, 507a–524a. [Google Scholar] [CrossRef]
- Acar, E.; Kocak, I.; Sey, Y.; Arditi, D. Use of information and communication technologies by small and medium-sized enterprises (SMEs) in building construction. Constr. Manag. Econ. 2005, 23, 713–722. [Google Scholar] [CrossRef]
- Ahuja, V.; Yang, J.; Shankar, R. Study of ICT adoption for building project management in the Indian construction industry. Autom. Constr. 2009, 18, 415–423. [Google Scholar] [CrossRef]
- Barba-Sánchez, V.; Martínez-Ruiz, M.P.; Jiménez-Zarco, A.I. Drivers, benefits and challenges of ICT adoption by small and medium sized enterprises (SMEs): A literature review. Probl. Perspect. Manag. 2007, 5, 103–114. [Google Scholar]
- Consoli, D. Literature analysis on determinant factors and the impact of ICT in SMEs. Procd. Soc. Behv. 2012, 62, 93–97. [Google Scholar] [CrossRef]
- Giotopoulos, I.; Kontolaimou, A.; Korra, E.; Tsakanikas, A. What drives ICT adoption by SMEs? Evidence from a large-scale survey in Greece. J. Bus. Res. 2017, 81, 60–69. [Google Scholar] [CrossRef]
- Reichstein, T.; Salter, A.J.; Gann, D.M. Last among equals: A comparison of innovation in construction, services and manufacturing in the UK. Constr. Manag. Econ. 2005, 23, 631–644. [Google Scholar] [CrossRef]
- Karahanna, E.; Straub, D.W.; Chervany, N.L. Information technology adoption across time: A cross-sectional comparison of pre-adoption and post-adoption beliefs. MIS Q. 1999, 23, 183–213. [Google Scholar] [CrossRef]
- Hosseini, M.R.; Banihashemi, S.; Chileshe, N.; Namzadi, M.O.; Udaeja, C.; Rameezdeen, R.; McCuen, T. BIM adoption within Australian Small and Medium-sized Enterprises (SMEs): An innovation diffusion model. Constr. Econ. Build. 2016, 16, 71–86. [Google Scholar] [CrossRef]
- European Union Commission. Commission recommendation of 6 May 2003 concerning the definition of micro, small and medium-sized enterprises. Off. J. Eur. Union 2004, 46, 36–41. [Google Scholar]
- Gibson, B.; Leung, D.; Rispoli, L. Small, Medium-Sized and Large Businesses in the Canadian Economy: Measuring Their Contribution to Gross Domestic Product in 2005. Econ. Anal. Res. Pap. 2011. [Google Scholar] [CrossRef]
- Kamal, E.M.; Flanagan, R. Key characteristics of rural construction SMEs. J. Constr. Dev. Ctries. 2014, 19, 1. [Google Scholar]
- China Construction Industry Association (CCIA). Analysis of the Basic Situation of Level I Enterprise Qualification in China Construction Industry. China Investig. Des. 2017, 7, 84–93. [Google Scholar]
- Hanna, N.K.; Qiang, C.Z.-W. China’s emerging informatization strategy. J. Knowl. Econ. 2010, 1, 128–164. [Google Scholar] [CrossRef]
- Brady, M.; Saren, M.; Tzokas, N. Integrating information technology into marketing practice–the IT reality of contemporary marketing practice. J. Mark. Manag. 2002, 18, 555–577. [Google Scholar] [CrossRef]
- Guy, K.; Arnold, E. The Diffusion of Information Technology: Experience of Industrial Countries and Lessons for Developing Countries; World Bank Publications: Washington, DC, USA, 1995; Volume 281. [Google Scholar]
- Shang, C.M.; Wang, Y.W.; Liu, H.Y.; Yang, H.T. Study on the standard system of the application of information technology in China’s construction industry. Autom. Constr. 2004, 13, 591–596. [Google Scholar] [CrossRef]
- Wang, G.; Lu, H.; Zhao, X.; Li, J. Report on the Development of Informatization in China’s Construction Industry; China Building Materials Press: Beijing, China, 2017. [Google Scholar]
- Wang, D.; Hadavi, A.; Krizek, R.J. Chinese construction firms in reform. Constr. Manag. Econ. 2006, 24, 509–519. [Google Scholar] [CrossRef]
- Andreu, R.; Ciborra, C. Organisational learning and core capabilities development: The role of IT. J. Strateg. Inf. Syst. 1996, 5, 111–127. [Google Scholar] [CrossRef]
- Slater, S.F.; Narver, J.C. Does competitive environment moderate the market orientation-performance relationship? J. Mark. 1994, 58, 46–56. [Google Scholar] [CrossRef]
- Drazin, R. The processes of technological innovation. J. Technol. Transf. 1991, 16, 45–46. [Google Scholar] [CrossRef]
- Murovec, N.; Prodan, I. Absorptive capacity, its determinants, and influence on innovation output: Cross-cultural validation of the structural model. Technovation 2009, 29, 859–872. [Google Scholar] [CrossRef]
- Kamal, E.M.; Flanagan, R. Understanding absorptive capacity in Malaysian small and medium sized (SME) construction companies. J. Eng. Des. Technol. 2012, 10, 180–198. [Google Scholar]
- Sexton, M.; And, P.B.; Aouad, G. Motivating small construction companies to adopt new technology. Build. Res. Inf. 2006, 34, 11–22. [Google Scholar] [CrossRef]
- Alam, S.S.; Jani, M.F.M.; Omar, N.A.; Hossain, T.; Ahsan, N. Empirical study of theory of reason action (TRA) model for ICT adoption among the Malay based SMEs in Malaysia. Bus. Manag. Strategy 2012, 3, 43. [Google Scholar]
- Van Oort, F.G.; Van der Laan, L. The value of the firmographic method for regional labour demand modeling. In Proceedings of the 37th Conference of the European Regional Science Association (ERSA), Rome, Italy, 26–29 August 1997; pp. 9–25. [Google Scholar]
- Papadopoulos, A.; Cimon, Y.; Hebert, L. Asymmetry, heterogeneity and inter-firm relationships: Organizing the theoretical landscape. Int. J. Organ. Anal. 2008, 16, 152–165. [Google Scholar] [CrossRef]
- Olanga, C.A. Impact of Firmographics, Expertise, Constraints and Constraint Management Methods on Weddings Organized by Wedding Planning Firms in Nairobi County; Kenyatta University: Nairobi, Kenya, 2015. [Google Scholar]
- Damanpour, F. Organizational size and innovation. Organ. Stud. 1992, 13, 375–402. [Google Scholar] [CrossRef]
- Camisón-Zornoza, C.; Lapiedra-Alcamí, R.; Segarra-Ciprés, M.; Boronat-Navarro, M. A meta-analysis of innovation and organizational size. Organ. Stud. 2004, 25, 331–361. [Google Scholar] [CrossRef]
- Van de Vrande, V.; De Jong, J.P.; Vanhaverbeke, W.; De Rochemont, M. Open innovation in SMEs: Trends, motives and management challenges. Technovation 2009, 29, 423–437. [Google Scholar] [CrossRef]
- Edwards, T.; Delbridge, R.; Munday, M. Understanding innovation in small and medium-sized enterprises: A process manifest. Technovation 2005, 25, 1119–1127. [Google Scholar] [CrossRef]
- Barrett, P.; Sexton, M. Innovation in small, project-based construction firms. Br. J. Manag. 2006, 17, 331–346. [Google Scholar] [CrossRef]
- Lukas, B.A.; Hult, G.T.M.; Ferrell, O. A theoretical perspective of the antecedents and consequences of organizational learning in marketing channels. J. Bus. Res. 1996, 36, 233–244. [Google Scholar] [CrossRef]
- Calantone, R.J.; Cavusgil, S.T.; Zhao, Y. Learning orientation, firm innovation capability, and firm performance. Ind. Mark. Manag. 2002, 31, 515–524. [Google Scholar] [CrossRef]
- Lawson, B.; Petersen, K.J.; Cousins, P.D.; Handfield, R.B. Knowledge sharing in interorganizational product development teams: The effect of formal and informal socialization mechanisms. J. Prod. Innov. Manag. 2009, 26, 156–172. [Google Scholar] [CrossRef]
- Love, J.H.; Roper, S. Location and network effects on innovation success: Evidence for UK, German and Irish manufacturing plants. Res. Policy 2001, 30, 643–661. [Google Scholar] [CrossRef]
- Tan, J. Innovation and risk-taking in a transitional economy: A comparative study of Chinese managers and entrepreneurs. J. Bus. Ventur. 2001, 16, 359–376. [Google Scholar] [CrossRef]
- Singh, L. Globalization, national innovation systems and response of public policy. Int. J. Technol. Manag. Sustain. Dev. 2004, 3, 215–232. [Google Scholar] [CrossRef][Green Version]
- Liu, Y.S.; Zhao, X.F.; Liao, Y.P. Market structure, ownership structure, and performance of China’s construction industry. J. Constr. Eng. Manag. 2012, 139, 852–857. [Google Scholar] [CrossRef]
- Gordon, G.G. Industry determinants of organizational culture. Acad. Manag. Rev. 1991, 16, 396–415. [Google Scholar] [CrossRef]
- Abbot, C.; Jeong, K.; Allen, S. The economic motivation for innovation in small construction companies. Constr. Innov. 2006, 6, 187–196. [Google Scholar] [CrossRef]
- Al-Ghaith, W.; Sanzogni, L.; Sandhu, K. Factors influencing the adoption and usage of online services in Saudi Arabia. Electron. J. Inf. Syst. Dev. Ctries. 2010, 40, 102–125. [Google Scholar] [CrossRef]
- Bresnen, M.; Marshall, N. Motivation, commitment and the use of incentives in partnerships and alliances. Constr. Manag. Econ. 2000, 18, 587–598. [Google Scholar] [CrossRef]
- Arayici, Y.; Coates, P.; Koskela, L.; Kagioglou, M.; Usher, C.; O’reilly, K. Technology adoption in the BIM implementation for lean architectural practice. Autom. Constr. 2011, 20, 189–195. [Google Scholar] [CrossRef]
- Grandon, E.E.; Pearson, J.M. Electronic commerce adoption: An empirical study of small and medium US businesses. Inf. Manag. 2004, 42, 197–216. [Google Scholar] [CrossRef]
- Brynjolfsson, E.; Hitt, L. Paradox Lost? Firm-Level Evidence on the Returns to Information Systems Spending. Manag. Sci. 1996, 42, 541–558. [Google Scholar] [CrossRef]
- Love, P.E.D.; Irani, Z. An exploratory study of information technology evaluation and benefits management practices of SMEs in the construction industry. Inf. Manag. 2004, 42, 227–242. [Google Scholar] [CrossRef]
- Tan, K.S.; Chong, S.C.; Lin, B.S.; Eze, U.C. Internet-based ICT adoption: Evidence from Malaysian SMEs. Ind. Manag. Data Syst. 2009, 109, 224–244. [Google Scholar] [CrossRef]
- Albar, A.M.; Hoque, M.R. Factors affecting the adoption of information and communication technology in small and medium enterprises: A perspective from rural Saudi Arabia. Inf. Technol. Dev. 2017, 23, 1–24. [Google Scholar] [CrossRef]
- Zekavat, P.R.; Moon, S.; Bernold, L.E. Holonic construction management: Unified framework for ICT-supported process control. J. Manag. Eng. 2014, 31, A4014008. [Google Scholar] [CrossRef]
- Swan, J.; Newell, S.; Scarbrough, H.; Hislop, D. Knowledge management and innovation: Networks and networking. J. Knowl. Manag. 1999, 3, 262–275. [Google Scholar] [CrossRef]
- Peters, G. Evaluating your computer investment strategy. J. Inf. Technol. 1988, 3, 178–188. [Google Scholar] [CrossRef]
- Demmel, J.G.; Askin, R.G. A multiple-objective decision model for the evaluation of advanced manufacturing system technologies. J. Manuf. Syst. 1992, 11, 179–194. [Google Scholar] [CrossRef][Green Version]
- Zahir Irani, P.E. The propagation of technology management taxonomies for evaluating investments in information systems. J. Manag. Inf. Syst. 2000, 17, 161–177. [Google Scholar]
- Guang, B.; Wang, H.L.; Xue, Y. China Construction Industry Informatization Development Report (2016)-General Discussion; China Architechture & Building Press: Beijing, China, 2017. [Google Scholar]
- Jung, Y.; Chin, S.; Kim, K. Informatization index for the construction industry. J. Comput. Civ. Eng. 2004, 18, 267–276. [Google Scholar] [CrossRef]
- Wymenga, P.; Spanikova, V.; Barker, A.; Konings, J.; Canton, E. EU SMEs in 2012: At the Crossroads. Annual Report on Small and Medium-Sized Enterprises in the EU. 2011/12. Ecorys, Rotterdam, September; EU: Brussels, Belgium, 2012. [Google Scholar]
- Badi, S.; Wang, L.S.; Pryke, S. Relationship marketing in Guanxi networks: A social network analysis study of Chinese construction small and medium-sized enterprises. Ind. Mark. Manag. 2017, 60, 204–218. [Google Scholar] [CrossRef]
- Hua, G.B. Applying the strategic alignment model to business and ICT strategies of Singapore’s small and medium-sized architecture, engineering and construction enterprises. Constr. Manag. Econ. 2007, 25, 157–169. [Google Scholar] [CrossRef]
- Rothwell, R. Small firms, innovation and industrial change. Small Bus. Econ. 1989, 1, 51–64. [Google Scholar] [CrossRef]
- Podsakoff, P.M.; Organ, D.W. Self-Reports in Organizational Research: Problems and Prospects. J. Manag. 1986, 12, 531–544. [Google Scholar] [CrossRef]
- Lin, F.-J.; Lin, Y.-H. The effect of network relationship on the performance of SMEs. J. Bus. Res. 2016, 69, 1780–1784. [Google Scholar] [CrossRef]


© 2019 by the authors. Licensee MDPI, Basel, Switzerland. This article is an open access article distributed under the terms and conditions of the Creative Commons Attribution (CC BY) license (http://creativecommons.org/licenses/by/4.0/).