1. Introduction
Port cities are hubs for trade, industry and tourism [
1]. Around 90% of world trade in terms of volume is transported by sea [
2]. Of the world’s 20 economically leading and most competitive cities, 14 are port cities [
3]. Conflicts between the ecological and economic systems are manifested in ports. Maritime transport emits around 940 million tonnes of CO
2 annually and is responsible for about 2.5% of global greenhouse gas emissions [
4]. In Europe, shipping consumed 2 million tetra-joules of energy in 2016 and produced 13% of the transport sectors’ greenhouse gas emissions [
5]. Thus, shipping plays a significant role in climate change. However, the use of ship-to-shore renewable energy and more energy efficient craft could begin to address this problem.
The impact of shipping on the aquatic ecosystem is also an issue. Oil and chemicals are discharged into the water from accidental spills and operational discharges. Biocides are released into the water from toxic chemicals used in antifouling paints. Invasive alien species may be transferred through ballast water and on ship hulls. Waste and sewage are dumped directly into the oceans [
6]. The pollution of the aquatic ecosystem threatens the entire food-chain. The threats posed by shipping are not spread evenly across the oceans, but are concentrated in busy shipping lanes and ports [
6]. However, the use of non-toxic paints, alternatives to ballast water systems, the recycling of sewage and other organic waste from ships may help to ameliorate some of these problems.
Industrial activities in ports also produce ecological problems. Soil contamination, emissions (air-borne and water-borne) from industrial processes and from the onward transportation of goods and materials, pose the greatest ecological threat. However, ports also present an ecological opportunity. Imported waste materials can be reused, recycled and recovered, then exported from ports. Industrial symbiosis may also develop amongst industrial clusters within a port [
3]. Both help to close resource loops and reduce global environmental impact. This circular transition, combining circular economy with industrial symbiosis, is occurring in ports across Europe (e.g., Rotterdam, Ghent, Antwerp).
A shift away from industrial activities in ports, may allow the local ecosystem to recover, if sufficient remediation strategies are in place. However, there will be less opportunity for industrial symbiosis. Post-industrial port landscapes are peppered with contaminated sites and disused infrastructure. Leachates from previous industrial activities may contaminate the water supply. The activities of those living and working in the port also impact on the environment. Households and businesses produce waste, black and grey water, green-house gas emissions. They consume resources—energy, materials water and land—during construction and operational phases. Thus, the conflict between the ecological and economic systems persist.
In this paper we argue that ports are living systems, not simply logistical hubs for the production and movement of resources. Thus, we need to move beyond the application of the circular economy conceptualisation of the port system, towards a more holistic conceptualisation which recognises the port as a living system. Such a conceptualisation places equal emphasis on the restoration of the social, environmental and economic systems which intersect within a port. It recognises the equal importance of systems of provision, lifestyles, social practices and ecological processes (associated with living systems) with supply, demand, production systems and consumption patterns (associated with economic systems).
In this more holistic conceptualisation, circularity refers to the reuse, recycling and recovery of all resources (land, materials, water, infrastructure and energy), alongside the restoration of the natural ecocycles (air, water, soil, flora and fauna) in an urban system. It also refers to the adaptation of urban form and communities to changing needs, thus increasing resilience in the urban system [
7,
8]. Thus, it combines resource looping, with ecological regeneration and urban adaptation to support the waste-free co-evolution of the city.
It permeates all aspects of the urban system, not just the economic system. Adopting such an approach in a post-industrial port setting should create local economic opportunities, whilst restoring the local ecosystem, reducing the consumption of finite resources and production of waste. It should also produce a healthier living environment and greater well-being for those living and working in the port. Over time the port would co-evolve with changing needs, whilst having a reduced global ecological footprint.
These ideas draw from the circular cities conceptualisation [
7,
8] which as argued elsewhere, goes beyond the development of a circular economy in an urban system to the creation of a circular urban system. This theoretical re-framing is particularly pertinent to the urban regeneration process, as it offers a pathway for urban renewal. It also differs from current regeneration processes, as its focus is on using ecological drivers, to produce economic opportunities and social benefits in urban systems [
7]. This contrasts with circular economy, where the drivers are economic. Circular economy may offer a new economic development pathway, but it does not create a pathway for the regeneration of a living port system.
This paper adds to the existing literature on circular economy [
9,
10,
11,
12,
13,
14] and circular economy in cities [
15,
16,
17,
18,
19]. It does so by developing the conceptualisation of a circular regeneration process. It reflects on how such a framing might be applied to a port system—Stockholm Royal Seaport. Using this example, the research explores the dimensions and dynamics of a circular regeneration process. It goes on to explore potential indicators for assessing the “circular capacities” of such a system. Finally, the paper evaluates whether existing sustainability indicators would provide adequate information for monitoring the development of circular capacities in the regeneration process.
2. Method
The research used a case study method to explore the process of circular urban regeneration in Stockholm Royal Seaport (SRSP). SRSP is entering a post-industrial phase, and has suffered a degree of ecological degradation. However, it continues to be a busy commercial port, for local and international passenger traffic. Thus, conflicts between the economic and ecological systems persist. The port is currently in the process of being regenerated. Arguably the approach being adopted is one of circular regeneration.
There were three stages in the research process (
Figure 1). The first stage of the analysis mapped the circular and supporting actions happening in each of the functional sub-systems (i.e., the commercial, industrial and living systems) of the port during the regeneration process. An actions typology was developed for circular regeneration. A mix of secondary data (annual technical reports) and primary data (interviews with key actors operating in SRSP and site visits) was collected. The data was analysed using the typology. The actions in each sub-system were categorised and mapped.
The second stage of analysis sought to understand the dynamics between actions. A mix of secondary data (annual technical reports) and primary data (interviews with key actors operating in SRSP) were analysed to determine the positive (synergistic) and negative (conflicting) relationships between actions. The findings were presented in an influence diagram.
The third stage of the analysis sought to determine a framework for monitoring the development of circular capacities in the regeneration process. This was compared with the framework used for the sustainability monitoring reports produced for SRSP. A gap analysis was completed to identify where new indicators for monitoring the development of circular capacities through the urban regeneration process, were needed.
2.1. Conceptualising Circular Regeneration in Port Systems
The conceptualisation of a circular urban regeneration has developed within an urban ecology framework [
20]. This framing presents the urban system as an artificial ecosystem, in which inter-dependent sub-systems are nested [
21]. The drivers for the regeneration process are ecological. Thus, the circular regeneration process aims to enable the resource efficient, waste-free, ecological regeneration and renewal of the urban ecosystem. Circular regeneration can reduce ecological footprint of the port and could offer a truly sustainable development trajectory. It could enable ports to address directly three key sustainability challenges often overlooked: futurity, inter-generational equity and environmental protection. Indirectly adopting such an approach can also address the health and well-being of those currently living and working in city ports and the creation of sustainable urban economies.
2.1.1. The System
A port ecosystem integrates aquatic and land-based environments. Three functional sub-systems interact within the port: commercial (movement of goods, materials and people); industrial and living systems. These operate across a range of scales, local to international. The port ecosystem metabolises resources and produces waste [
21]. The ecosystem’s carrying capacity is influenced by the rate at which resources are metabolised and waste is assimilated. The slower the rate of resource consumption and the greater the capacity to assimilate waste, the healthier the port ecosystem. Ideally, the circular regeneration process should occur across all the interdependent sub-systems which constitute the port ecosystem.
2.1.2. The Circular Capacities
Three capacities in an ecosystem can reduce resource consumption and waste: looping, regenerative and adaptive capacities. The capacity to use the waste from one process as a resource for another—looping capacity—will reduce the consumption of finite resources and resource wastage [
22]. In a port, closing resource loops will occur at different scales, depending on the functional system. For example, in the commercial and industrial systems, loop closing will probably happen at a global scale (if at all). For the living system, resource looping could occur at the local scale.
The regenerative capacity restores ecosystem services, which enables “waste” to be assimilated and resources to be produced locally [
23,
24,
25]. Eco-system services support nutrient cycling, soil production and flood control. They can produce resources (e.g., energy and food) and regulate urban systems (e.g., carbon sequestration, climate regulation, air and water purification). Ecosystem services are integral for the long-term sustenance and renewal of the ecosystem, environmental regulation, as well as the health of the population [
25,
26]. The loss of these services is becoming increasingly important in stressed urban environments suffering from flooding, heating, pollution, declining biodiversity and soil degradation.
The adaptive capacity of an ecosystem, allows it to dynamically evolve with changing contexts, thus reducing resources consumed and wasted [
27,
28]. Adaptive capacity of an urban system is underpinned by its potential to self-organise and for its socio-technical systems to co-evolve. Self-organization is a key property through which systems self-innovate and self-stabilize in response to changing circumstances. In the context of cities, this includes the rise of new structures, patterns and organizations within an urban system, as a result of interaction between actors and without external coordination [
11]. This is facilitated by flexible physical form and the ability of urban actors to be flexible, learn, experience and adapt. Developing these three capacities will be essential for circular regeneration.
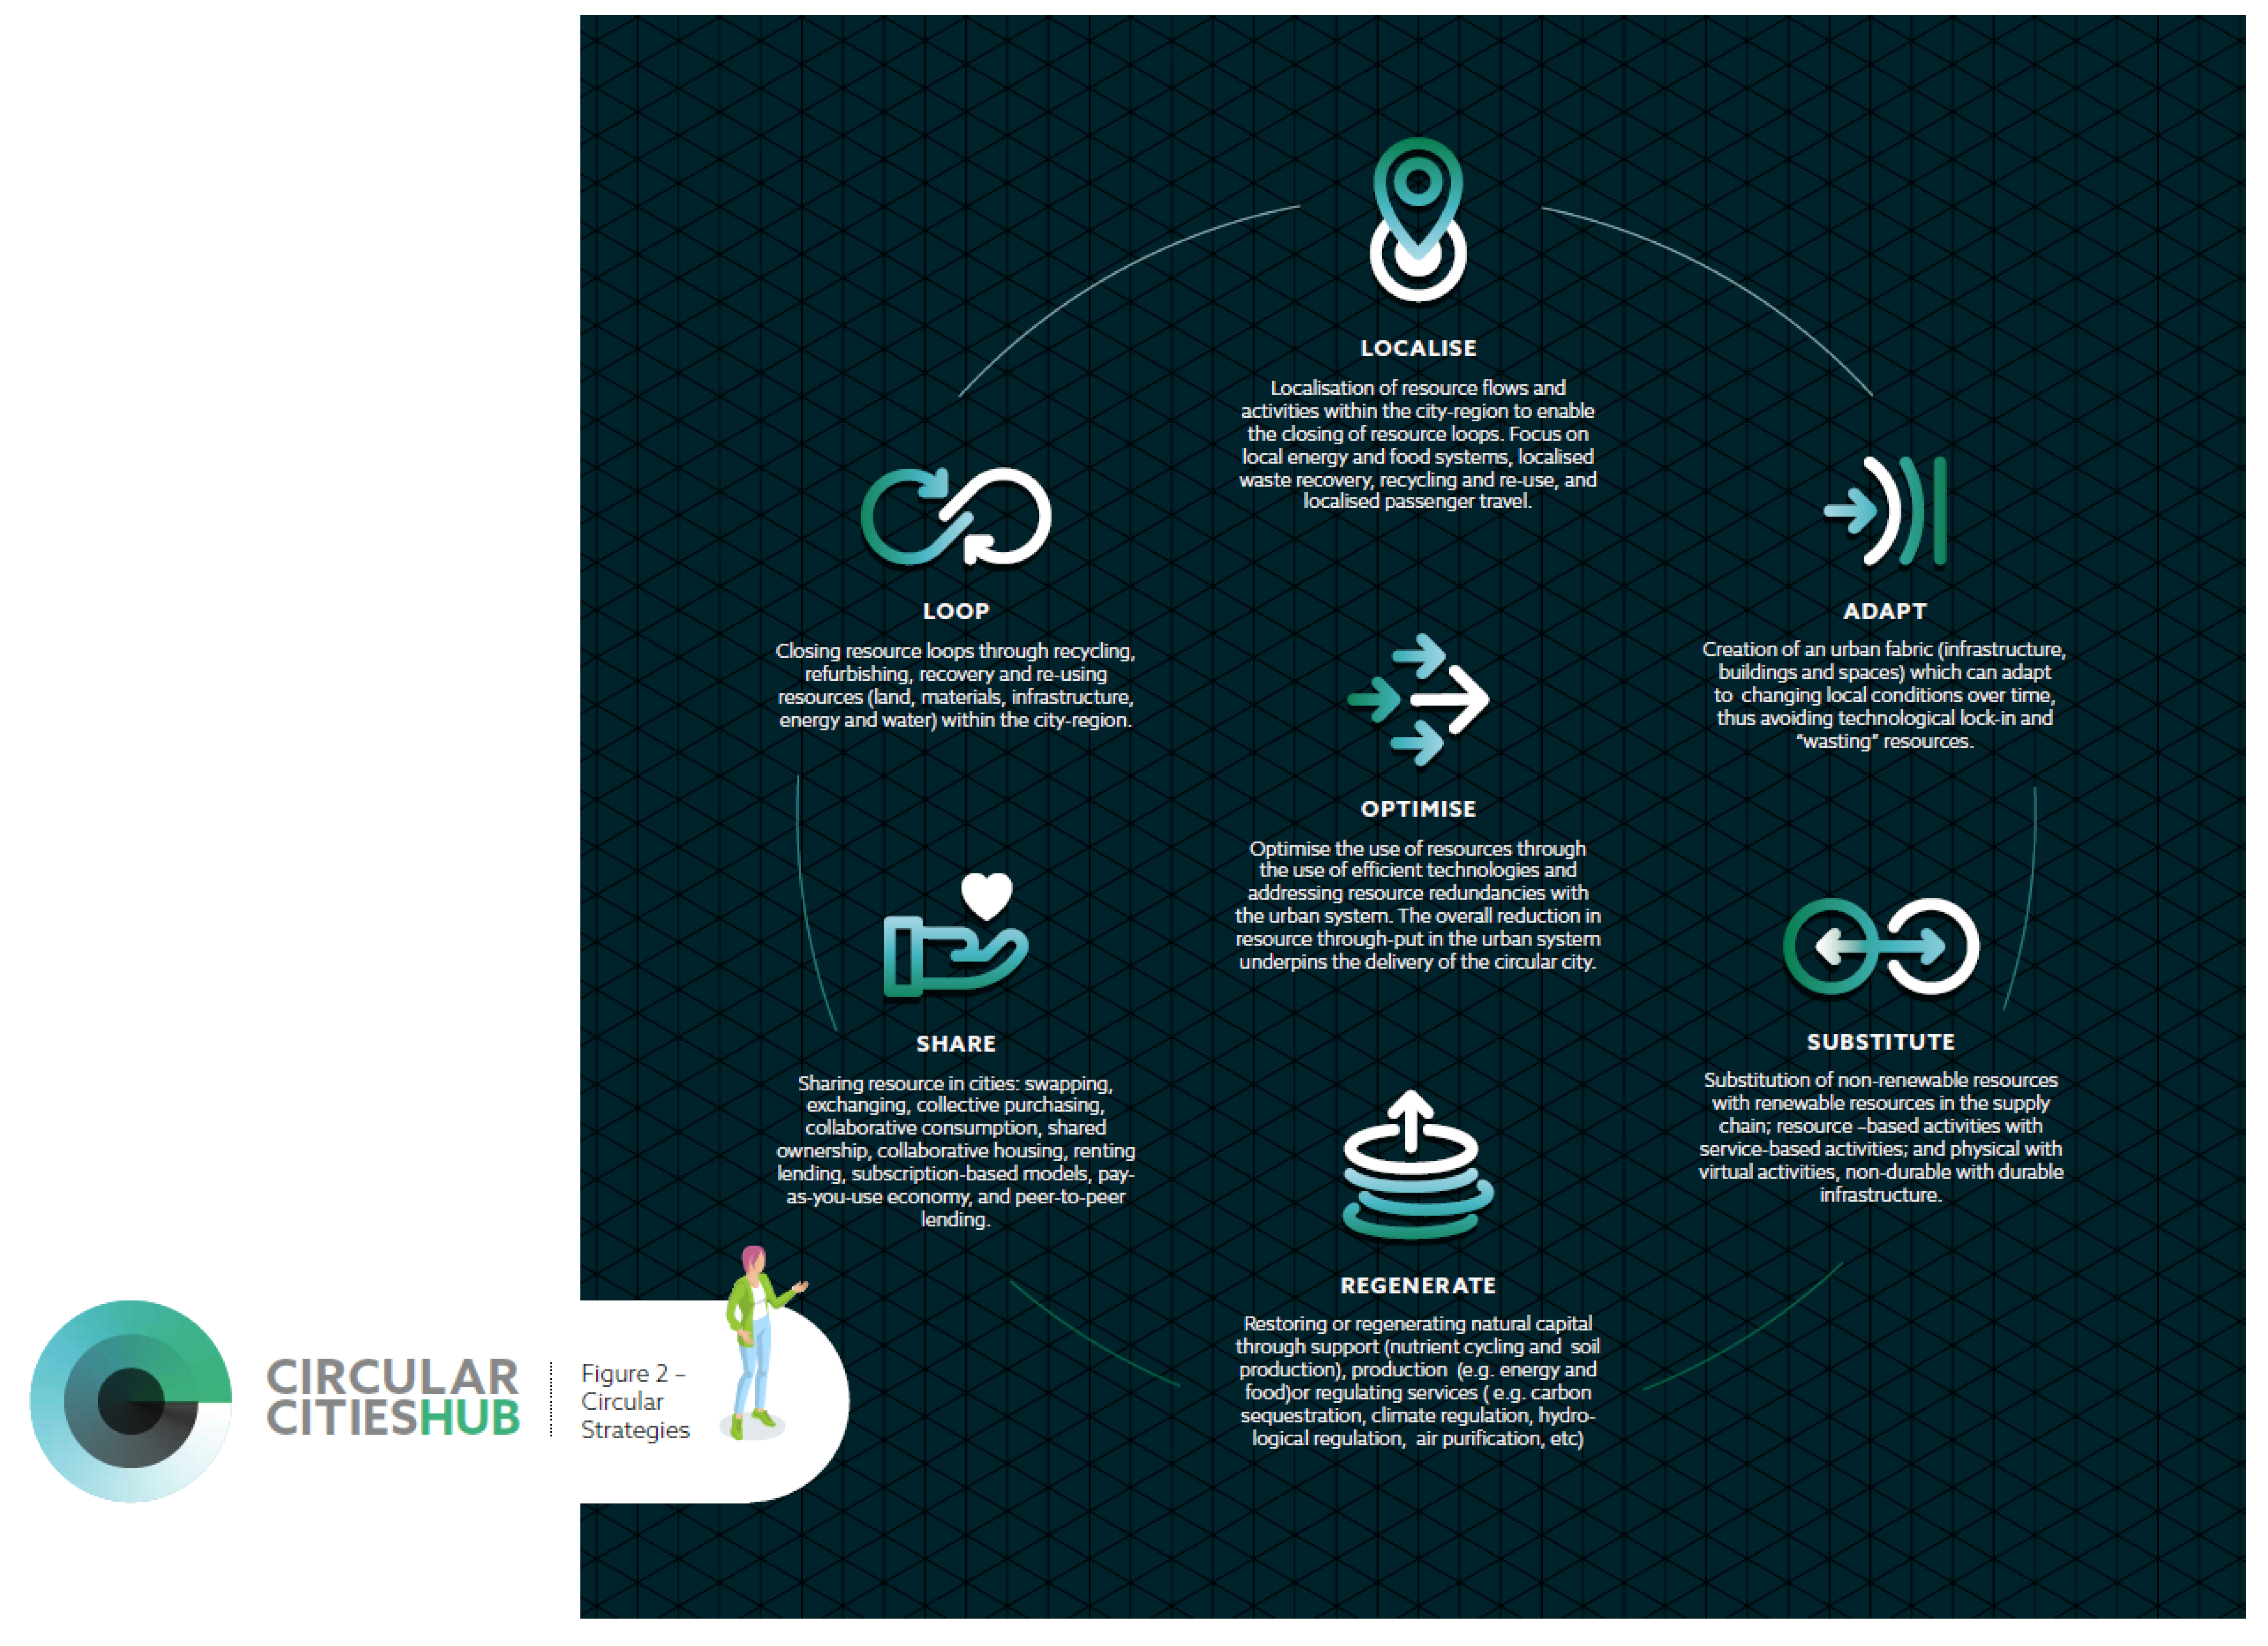
The circular transition in a port will be based on developing the three capacities outlined above. Developing capacities will enable three circular actions which are fundamental to the delivery of circular urban regeneration: looping, ecological regeneration and adaptation. The typology of actions outlined below (
Figure 2) has much in common with, but builds on, those outlined in the RESOLVE model [
11].
2.1.3. Typology of Circular Actions
Looping actions reduce resource wastage by closing resource loops through re-use, recycling, and energy recovery. In ports this could manifest in a variety of ways. For example, material waste is shipped into ports to be processed in remanufacturing and reprocessing plants. Grey- and black-water produced by ships is reused (grey-water) or recycled (black-water). Waste products from industrial and construction processes in the port are reused, recycled or recovered through industrial symbiosis and urban mining.
Ageing and abandoned infrastructure often left behind in the post-industrial landscape, is reused or recycled. Brownfield sites are remediated, contaminated soil is recycled, and the sites re-used for new activities. New developments integrate circular technologies (e.g., for grey-water recycling and rainwater collection, closed-loop energy systems) into urban infrastructure, creating circular systems of provision. Those living in the port may adopt circular practices (e.g., engaging in repair cafes and local swapping platforms) and consume circular products (e.g., shipping containers used as offices or temporary accommodation).
Looping actions offer a range of benefits. They help to reduce finite resource consumption, associated waste and emissions, thus improving the urban living environment and protecting the global ecosystem [
8]. Looping actions increase the efficiency of production processes, which produces economic savings. They can also produce a range of new economic and job opportunities, helping to grow and diversify the local economy [
8,
29,
30].
Ecological regeneration restores the urban ecosystem. It preserves natural capital and essential ecosystem services. Thus, it can produce resources (raw materials, food, clean air and water) and assimilate waste from urban activities. This is operationalised through the inclusion of green infrastructure (e.g., green roofs, green walls, pocket parks, urban farms and forests) and blue infrastructure (e.g., permeable surfaces, reed-beds, retention ponds) into the urban fabric. Blue-green infrastructure may also be used to replace grey-infrastructure, particularly for water management.
The ecological regeneration of the urban system has numerous health and community benefits for those living and working locally. It reduces air, water and noise pollution [
31]; improves physical and mental health [
32,
33,
34] and provides opportunities to bring communities together in healthy outdoor activities (from sport to urban farming). Thus, it can reduce expenditure on negative externalities (health and environmental protection) and increase land and property values [
35,
36].
In ports, this approach may be particularly useful in enabling adaptation to changes in hydrology (flash flooding) and sea-level rise as a result of climate change. It may also reduce noise and air pollution produced by the port and industrial activities. It will help restore brownfield sites, thus supporting ecosystem services (e.g., climate regulation, carbon sequestration, and pollution reduction) and creating green spaces in which those living and working in the port area can relax, play or grow food.
For ports the ecological regeneration of the aquatic ecosystem is also important. It increases biodiversity and provides recreational opportunities. It generates employment opportunities (in recreation, conservation, environmental engineering, landscape design, hydrology, maintenance) and diversifies the economic base [
37,
38]. Local environmental improvements may also attract more tourists to stay in the port area which produces a local economic advantage, although it could also place greater pressure on the local ecosystem.
Ports are subject to the forces of global economic restructuring, which influences the resources (freight and passengers) passing through and industries operating within it. Changes in both will affect port activities, associated infrastructure and spaces. It is important that they can adapt to these changes. Thus, adaptable infrastructure, spaces and citizens will be needed in ports to enable “waste-free renewal” and circular regeneration to be successful.
Adaptive actions build capacity within the urban fabric and communities evolve with changing economic, environmental, demographic, technological and cultural contexts [
39,
40,
41,
42,
43]. This enables the adaptation of infrastructure and urban spaces for new purposes, with minimal resource wastage. Capacity is built through the use of flexible infrastructure and urban form [
41,
42,
43]. Examples include scalable systems (e.g., community energy and water systems); flexible buildings and multi-use spaces; infrastructure which can be disassembled and re-assembled; and re-fitable buildings [
44].
Adaptive urban form will enable infrastructure to re-scale and modify for changing contexts. It will also provide the opportunity for new development trajectories to be tested by pop-up activities [
41,
43]. Adaptive capacity within communities is also needed [
39,
40]. Adaptive capacity is reliant on the flexibility of those living and working in the port, their social networks and ability to learn from experience. Citizen fora, collaborative planning, learning apps, citizen workshops all help to build capacity and willingness to accept change.
2.1.4. Typology of Supporting Actions
A variety of other actions are often adopted to deliver sustainability objectives in cities. These may interact positively or negatively with circular actions. It is important to understand the dynamics of these interactions, in order to determine the best options for delivering circular regeneration. The supporting actions fall into four categories: optimisation, substitution, localisation and sharing.
The consumption of resources and production of waste can be optimised through the use of more efficient production systems, changing lifestyles, social practices and systems of provision. By optimising resource consumption, we reduce the quantity of “wasted” resources which need to be looped or adapted. Resource optimisation might be achieved in ports through the introduction of high density, mixed-use development; smart grid and smart buildings; passive, zero-net energy, zero carbon buildings; decentralised energy and water systems; logistics hubs and mass transit systems. In ports, optimising energy consumption and emissions from transport (shipping and the onward movement of freight and passengers) and from industrial operations would be critical.
The substitution of resources, activities and infrastructure for renewable, durable, virtual, service-based alternatives can also help to reduce resource consumption and wastage in ports. For example, the consumption of finite resources can be substituted with renewable resources (e.g., renewable energy); resource-based activities substituted with service-based activities (e.g., buying clean water rather than waste-water systems); activities requiring movement with virtual activities (e.g., teleworking); non-durable infrastructure substituted with durable infrastructure. This reduces the finite resources consumed and wasted. In ports the substitution of fossil fuels with renewable energy for use in shipping and industry would be key.
The localisation of resource flows reduces energy consumed in transportation and associated emissions. However, it is impossible for port functions to operate on a purely local basis. Ports rely on the global movement of people, raw materials and goods. The industries operating in the port also rely on this global movement. However, for those living in ports, activities may be localised through the provision of local services and employment opportunities.
Resources can be shared in cities across a range of activities, including living (e.g., co-housing, library of things), working (e.g., co-working spaces) and travel (e.g., public transport and vehicle sharing schemes). This reduces resources consumed and wasted per capita. Sharing resources (as with localisation) also helps to build local social capital and increase public engagement. It provides opportunities for learning and self-organising within communities. This in turn enhances the regenerative and adaptive capacity of communities in which sharing happens. Once a port moves into a post-industrial phase, co-living, co-working and vehicle sharing could offer attractive alternatives to its industrial past.
2.2. Dynamics between Actions
In this conceptualisation of circular regeneration, these three circular capacities are intrinsically linked. It is postulated that positive synergies will exist between all three. For example, increasing the regenerative capacity of the urban ecosystem will enable the re-use of grey-water and brownfield sites. It could also enable the urban system to positively adapt to climate change or resource shortages. Looping resources (e.g., recycling or energy recovery from organic waste) may reduce the pressure on ecosystem services, thus helping to ecologically regenerate urban systems. Building adaptive capacity within communities may also increase their engagement in local looping (e.g., repair cafes) and regenerating activities (urban agriculture).
All the supporting actions can have beneficial economic, environmental and social impacts. They may also have the potential to work synergistically with circular actions to reduce finite resource consumption, waste production, creating healthy urban ecosystems. However, the dynamic interactions (both synergies and conflicts) between circular actions, and between circular and supporting actions requires further investigation before a full understanding of the process can be realised. In this exploratory work we begin to ascertain where these dynamic relationships exist, drawing on the example of SRSP.
2.3. Monitoring Framework
In order to determine if the process of circular regeneration has been successfully implemented, we need to develop a framework (or a set of indicators) against which to measure it (
Figure 3). This is a complex problem. Indicators will need to reflect the development of three circular capacities (loop, regenerate, adapt). Ideally indicators should also reflect the various stages in the implementation process: levers for change (policies/plans, regulation, financial incentives, education, social learning, design tools), actions (introduction of new technical systems, processes, services) and outcomes (environmental, social and economic). They should also indicate where the levers, actions and outcomes occur (i.e., which sub-system: commercial, industrial and living sub-systems).
Table 1 below illustrates the kind of indicators which could be used to measure the circular regeneration process.
This framework was used as a guide for categorising the levers, actions and outcomes of the circular regeneration process in SRSP.
3. Stockholm Royal Seaport—Understanding the Port System
Stockholm Royal Seaport (SRSP) is an important hub for the movement of both freight and people. There are three port areas (
Figure 4): Värtahamnen (passenger services) Frihamnen (passenger and freight services) and Loudden (container terminal and oil depot). It is part of the prioritised European transport system TEN-T and a CORE port [
45]. Annually 9.7 million tonnes of freight and 16 million passengers pass through the port [
45]. It is Sweden’s third largest freight port and number one passenger port. It creates 8000 jobs in the region [
45].
Currently 90% of goods arrive in Sweden by sea [
45]. However, in Stockholm Royal Sea Port there will be a shift from freight to passenger services (ferries and cruise liners), when the freight terminal moves to Norvikudden [
45]. Tourism has grown strongly in Sweden, thus it is expected international cruise traffic will increase in the SRSP, compensating for the loss of freight. The metropolitan area of Stockholm is spread across 14 islands (part of the Stockholm Archipelago). Thus, public waterborne transport is also prioritised in the Stockholm region. Thus, it is expected that local ferry services will increase [
45].
3.1. Problems Affecting the Port
SRSP covers an area of 236 ha [
47]. The land is owned by the City of Stockholm and is very close to the city centre (3.5 km). It is well connected by bus networks. However, it is a site in need of regeneration. The decline in industrial activities and freight services in Stockholm Royal Seaport has resulted in a significant reduction in economic activity on site [
48]. However, there are some industrial functions which continue to thrive (e.g., cement industry) alongside the commercial functions (ferry and cruise services).
Nevertheless, industries have closed (e.g., the gasworks) leaving brownfield sites in need of decontamination and regeneration. Closure of these activities have resulted in job loss and economic deprivation amongst those communities remaining on the site [
48]. For example, Hjorthagen is a deprived community where livelihoods were lost when the gasworks closed (in 2010). Alongside the need to regenerate the port, the Stockholm region is suffering from an undersupply of housing, particularly affordable housing [
49]. Potentially the site provides an opportunity to address these problems.
SRSP benefits from good access to water and green space, to the east is the Baltic and to the north and west is the Royal National City Park. However, both land-based and aquatic environments have been degraded by industrial (contaminated land and disused infrastructure) and commercial (emissions and waste water produced by vessels) activities [
45]. Finally, Stockholm has been suffering increasingly with problems of flash-flooding [
48]. This is also a problem in SRSP [
48]. In summary, the regeneration of SRSP should encourage ecological regeneration; new economic activities; skills training, jobs and services for existing communities; provision of affordable housing; reuse of infrastructure and brownfield sites; and tackle flooding.
3.2. The Regeneration Plan
The plan is to regenerate the site over a 20-year period (
Figure 5). It aims to develop and integrate a liveable city district, with industrial and commercial functions. It also aims to connect the city district with the rest of Stockholm, enabling walking and cycling [
47]. When complete, 12,000 new apartments, 35,000 work spaces and 135,000 m
2 of commercial space will be constructed on lands which were used for port operations and other industry [
47]. It is hoped that the redevelopment will produce 30,000 jobs in port-related operations, financial services, media, start-ups, and the relocation of cultural services [
36]. The remaining port operations will be modernised. The container port and oil facilities will be moved from Loudden to Norvikudden. Housing will be built in its place.
Stockholm Royal Seaport aims to be fossil fuel free by 2030. This will result in a reduction of 36,000 tons of carbon dioxide per annum compared to business-as-usual. This will be achieved through the development of energy efficient buildings (new build energy requirements 55 kWh m2/year for residential buildings) and smart grid; the use and production of renewable energy onsite (developers must install solar PV to cover 10–20% of building electricity need); waste management (zero waste to landfill target and the automated waste management system reduces energy use by 75–80%); traffic and mobility management (the modal split should include 70% of work-related trips by public transport) and resource-efficient production. The new development will integrate the closed-loop system (which provides district heating, vacuum waste collection and biogas for cooking) with low carbon transport (e.g., biogas buses, metro, tram, ferry, new cycle and pedestrian paths and car share schemes).
The plan is to move progressively towards the fossil-fuel-free target over the 20-year period. For example, the energy provider (Fortum) operating the closed-loop system will gradually increase the renewable content of the system to replace the fossil fuels used [
48]. Currently the system uses biofuels (37%), waste incineration (31%) and fossil fuels (32%) [
49]. Fortum plans to increase the quantity of woodchip (biofuel) imported into Värtahamnen, to reduce the use of fossil fuels in the future [
45]. This will be complemented by the solar technologies installed on all new buildings.
The port also aims to be climate-adapted to rising temperatures, sea and groundwater levels as well as increased precipitation [
45]. This goal will be achieved by raising ground levels on site and using local storm-water management provided by blue and green infrastructure integrated into the development [
47]. A Green Space Index will be applied to all new development, which identifies the optimal planting regimes, for regulating ecosystem services for storm-water management, biodiversity and recreational purposes [
47].
The City of Stockholm is investing 130 million euros in the project [
48]. It is responsible for land remediation and infrastructure (e.g., streets, public spaces, cycle paths, bridges and park). It is also responsible for public engagement in the regeneration process [
48]. The public have been engaged in the planning process through a digital dialogue; an onsite open house, focus groups with selected audiences (e.g., business owners and young people) and the sustainable kids’ forum [
47]. A collaborative planning approach engaging developers and service providers at an early stage in the development process (before the design competitions) has created a more integrated approach to provision and enabled the delivery of the stringent environmental targets set for the site [
48].
The City of Stockholm is also involved in the port redevelopment, work on Norra Länken (the Northern Link motorway connecting the port to the airport and the rest of Sweden) and planning the Spårväg City tramline. The biggest costs for the city are cleaning polluted soil, compensating and evacuating affected stakeholders in the area, as well as groundwork and infrastructure [
48]. Originally, all the land was owned by City of Stockholm. However, it is slowly being sold to private developers on the condition that development complies with the environmental programme and targets set [
48]. Given the value of the site, no further financing incentives were required to attract private developers. However, the resulting property prices are high, which is creating a real problem for the delivery of affordable housing [
48].
The Stockholm Royal Seaport is becoming an exemplar for sustainable urban development [
50]. It is an urban experiment. It has developed a number of innovative tools and ways of working. These have been tested, monitored and evaluated. The knowledge generated by the experiment is being shared with those delivering projects within the city, but also with other municipalities and an international audience. The urban development project is also active on social media sites. Since 2017, other urban development projects run by the City of Stockholm have adopted some tools and processes developed in SRSP (e.g., green index, mobility index, REFLOW, collaborative planning). Stockholm Royal Sea Port has received 27,000 visitors since 2010 [
46].
4. A Circular Approach to Regeneration in SRSP
An analysis of the activities (comparing the activities documented with the typology of circular actions developed from [
8]) in SRSP showed that a circular approach to the regeneration of a port system has been adopted. Circular actions are being applied to the commercial, industrial and living functions (
Table 2).
4.1. Looping Actions
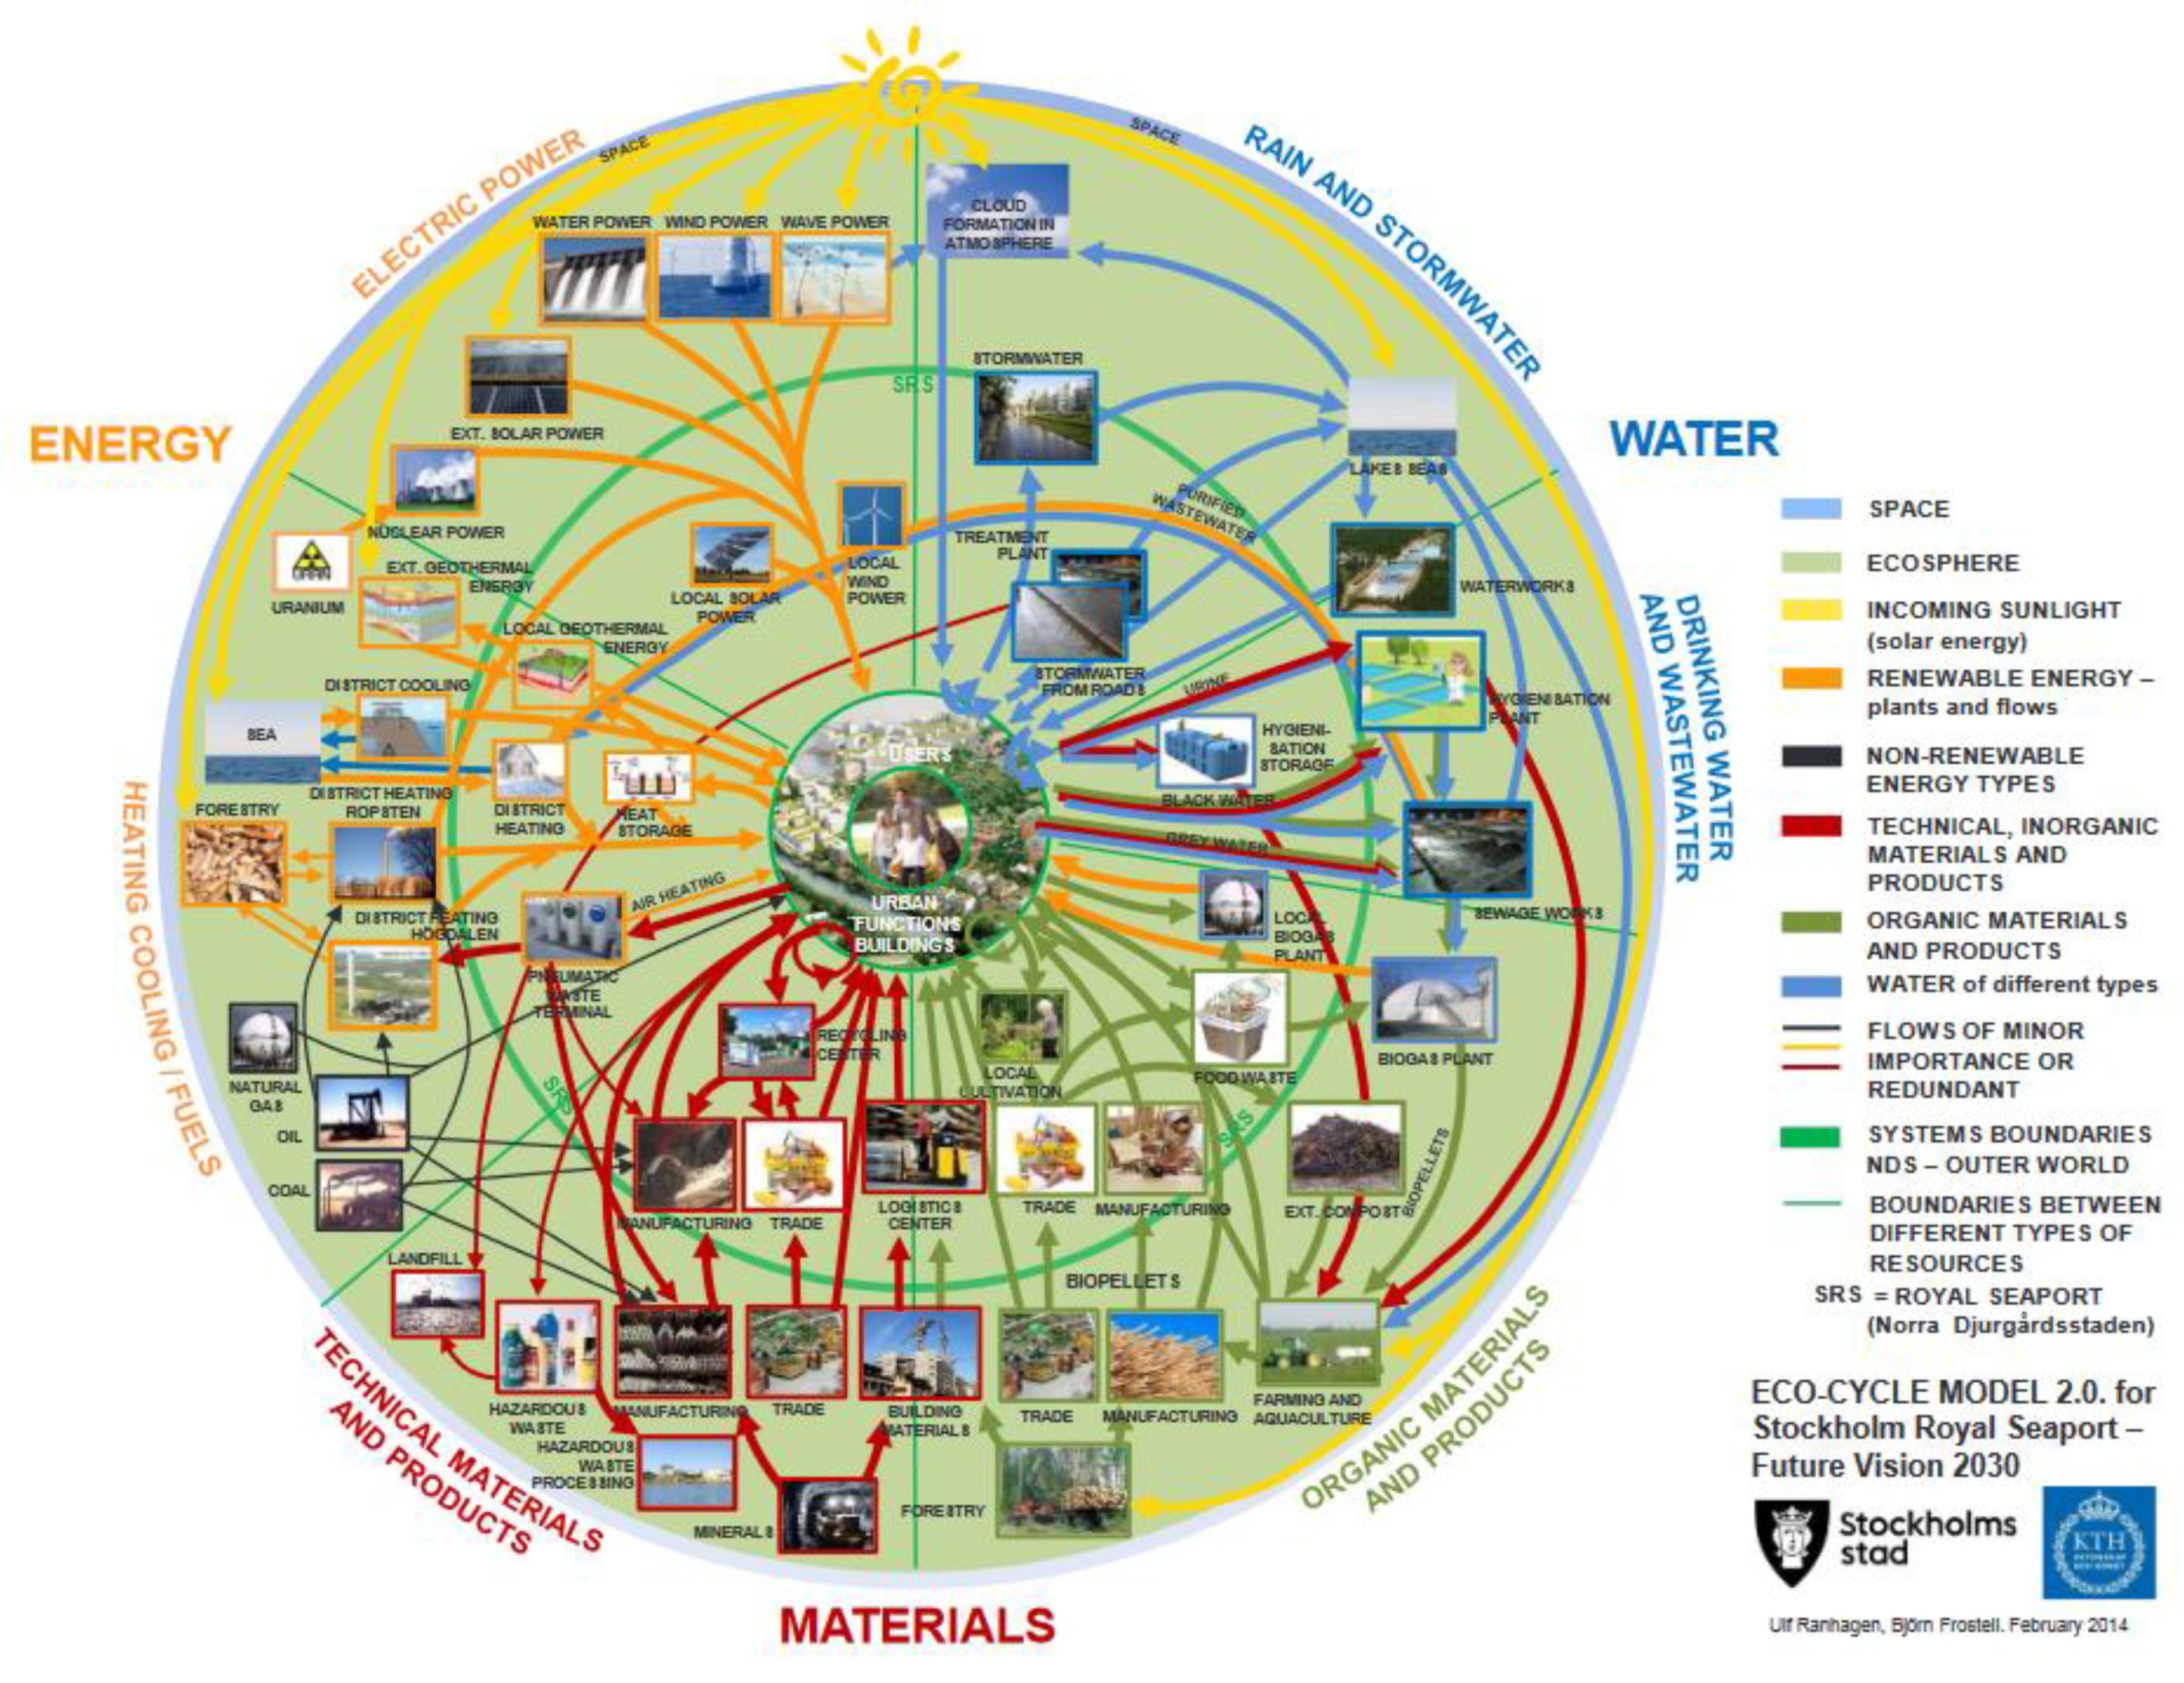
A closed-loop (waste-to-energy) system operates across the port (which forms part of a larger more complex looping model known as Ecocycles II,
Figure 6). The closed-loop system recovers biogas for cooking, biofuel for buses, compost for agriculture from the processing of organic household waste (sewage and food waste). It also generates heat and electricity from the combustion of inorganic household waste. Organic waste produced on ships and from the maintenance of green spaces in the seaport and national park are also used to feed the system. This reduces the amount of waste going to landfill. It provides an energy alternative to fossil fuels. It creates compost which can substitute for fertilizers made with petrochemicals. It reduces the damage to the aquatic environment, the eutrophication of water-ways, caused by the release of waste-water into the harbour. A grey-water reuse system has also been established as part of Ecocycles II. The system stores storm-water in retention ponds or caverns, which limits flash-flooding in SRSP. Later it is reused for watering vegetation in the port.
The city has also promoted circular construction and management processes in SRSP [
46]. One example is the minimisation of construction waste, by re-using materials on site. A second example is treating and recycling garden and park waste within the port to produce compost and biofuel. The third example is the treatment of contaminated soil for re-use on site. All three localise looping actions, thus reducing the need for transport.
Another example involves the remediation and reuse of caverns in Hjorthagsberget [
46]. These caverns were previously used for storing naphtha (which is flammable in contact with air). Once cleaned the caverns will become a garage (for 1200 cars). The cleaning (recycling) process involves filling the caverns with water, then introducing archaea microbes to break down the naphtha. The waste products from the process (water, CO
2 and compost) are harmless. This purification method will also be used in future remediation projects in the port (e.g., the caverns in Loudden where storm-water or biofuel will be stored).
The knowledge that is built in the port around circular construction and management processes is communicated to key actors: industry, government and the public. A lifecycle analysis tool developed by the Swedish Environmental Research Institute is being tested on site by developers [
46]. This should help to reduce resource consumption and waste in the construction process. The REFLOW model, based on Ecocycles II, visualises the ports hidden resource flows and demonstrates how these interact with local, regional and global flows of energy, water and materials. The tool is available online and is used to inform those living in or visiting the port area about resource flows and looping actions [
46].
The waste-water from vessels (black and grey-water) creates the second biggest environmental challenge for the port [
45]. Waste-water can be offloaded at all quay berths in Stockholm. Since the 1990s the vessels operating routine scheduled services have offloaded their waste-water in port. Today, 98% of the waste-water generated by ferry passengers and 80% of the waste-water generated by international cruise ships is offloaded in port. The waste-water is recycled to produce fertilizer and biogas [
45]. This reduces eutrophication caused by the release of nitrogen, phosphorous and potassium into the aquatic environment. The port authority also requires the solid waste from ships to be separated [
45]. This enables the port authority to feed the waste generated into the closed-loop system operating in the area to produce electricity, heat, biofuel (for public buses), biogas for cooking and fertilizers.
These actions create a cleaner, safer and healthier living environment for those working and residing in the port. They reduce the wastage of resources and avoid the environmental and economic costs of landfill, pollution and flooding. Circular actions will also generate jobs, for example in waste collection and separation; energy generation and distribution; production and redistribution of compost and biofuel; soil and cavern decontamination; systems monitoring; and training operatives [
48]. However, opportunities for industrial symbiosis, remanufacturing, reprocessing, recycling and reuse of waste materials/goods are under-developed in the port.
4.2. Regenerative Actions
The ecological regeneration of the site is extremely important. Green and blue infrastructure will be integrated across the port, to restore the land-based and aquatic ecosystems as well as reinforce the identity of the port [
46]. It will also create a healthy and attractive living environment. The introduction of blue-green infrastructure into the port will generate jobs associated with maintenance, conservation and recreational activities [
48]. It will offer a more attractive environment for tourists, which could generate further job opportunities in hotels, retail and catering [
48].
Green rooves, courtyards and tree-planting has been integrated into new and existing development. It is estimated that green rooves and green courtyards will cover 14,000 and 28,000 m
2 respectively when complete [
47]. The city plans that residents will have good access to parks and areas with high recreational and conservation values. The development plan requires that 100% of apartments have access to parks or natural environment within 200 m [
47], which has mental and physical health benefits.
Green infrastructure will be connected across the site and link with the national park and the waterfront. Green areas will be designed to be multifunctional to cope with future climate change, including storm-water management, to contribute to biodiversity and create good habitats [
47]. Gardening and urban agriculture will help return the city’s nutrients to the soil. Vegetation will also reduce noise and air pollution within the port, which has health benefits. The green infrastructure provides a dispersal network for oak-dependent species, pollinators and amphibians [
47]. This will increase biodiversity.
Blue infrastructure has also been integrated into the port. The aim is to reduce the impact of flash-flooding, which is a major problem [
47]. A mixture of permeable surfaces and retention ponds are being used. Storm-water runoff from streets and pavements is led to the surfaces of the planting beds by macadam mixed with bio char [
47]. Water is also led to lawns in the urban park, which serve as retention areas [
47]. The bio char is made from Stockholmer’s garden waste and is ideal as a soil conditioner, and for capturing and binding CO
2 from the air [
47].
Storm-water retention ponds prevent flash flooding, but they can also be used for watering vegetation and reducing pollution in adjacent waterways. Water bodies are being protected and extended in the port, to strengthen and develop their recreational and conservation values. For example, in Kolkajen, a new island at the mouth of Husarviken creates a water-arena for residents and visitors [
46]. Thus, blue infrastructure protects grey infrastructure and the properties of those living in the port. It also provides opportunities for recreational activities which promotes the health and wellbeing of those living and working in the area.
The Green Space Index (GSI), a planning tool, was developed and tested in Kolkajen and Södra Värtan. It is a tool for calculating eco-efficient space, which rewards a range of ecosystem services. This has enabled developers to test the environmental benefits and economic feasibility of delivering different blue-green solutions for their projects in the port [
48]. It is used by city planners to ensure that adequate blue-green infrastructure is provided in new developments across the port. It has also been integrated into the planning process across the rest of the city [
48].
4.3. Adaptive Actions
The physical planning and urban regeneration of SRSP is characterised by long-term robustness and flexibility [
47]. To make this possible, the area’s zoning plans are flexible enough to accommodate a range of functions and future changes. Public buildings are designed to be multifunctional, to ensure optimal use [
47]. Public spaces are designed for different functions throughout the year. For example, a square could be used as a skating rink in the winter, a farmers’ market in spring and an entertainments venue during the summer.
Public spaces are able to accommodate temporary events and activities, during both the construction period, and when the area is completed. Some pop-up activities have already emerged, including a local market and a pop-up reuse centre [
48]. The pop-up reuse centre enables residents to recycle, repair or swap household items close to their home. It is now travelling around the rest of Stockholm, being used to test and build demand for such a facility [
48].
The urban regeneration process also seeks to adapt existing historic buildings and landscapes, so that they integrate into the future development [
46,
48]. New uses are found for these buildings and landscapes, which reflect todays cultural interests, but preserve a sense of place. For example, to the north of the site is the Gasverket’s (abandoned gas works). It has a unique character and played a major role in the industrial life of the port. One of the gasometers on the site has been replaced by a 90-m high residential building (the same height as the previous structures) and surrounded by a sculpture park [
46]. The area will be used as a cultural venue in the future for concerts and festivals. Thus, it will remain a focal point on the site.
Urban living environments also need to be able to adapt to changing demographic and environmental trends. Thus, the port offers a range of services for all ages [
46,
48]. It also provides accommodation across a range of tenures and sizes [
46,
48]. Thus, households of different sizes, at different life-stages and with varying income levels should be able to live in the port. In reality the apartments are expensive, excluding lower income groups [
48]. The buildings and public spaces in the port have also been climate adapted. This has been achieved though the elevation of buildings and public spaces, blue and green infrastructure [
48].
The adaptive capacity of those living in the port is being developed through their engagement in fora, workshops and resident groups. The public are engaged in decision-making processes [
46,
48]. Public understanding of problems and solutions develops through this engagement and builds support [
46,
48]. It also creates networks through which they can self-organise and learn. In addition, online apps have been developed to engage a wider audience in decision-making processes and providing learning platforms [
46,
48].
4.4. Supportive Actions
Resource use has been optimised through the regeneration of SRSP both in the commercial and living environment. In the port, a target to reduce energy use by 50% over the period 2005–2025 has been set. Indeed, energy consumption has been reduced through the introduction of shore-to-ship electrification and the energetic refurbishment of existing buildings [
45]. In new residential areas, buildings have been designed to be zero energy (69 kWh/sqm). Reductions in energy consumption have been reinforced throughout the site by the introduction of a smart grid.
The development plan supports high density, mixed use development, with good links to bus rapid transit, metro and buses. This also helps to reduce energy consumption and optimises the use of space in the port. The vacuum waste collection system helps to reduce the amount of road trips in the area and the material waste going to landfill. Finally, the construction logistics hub reduces the number of vehicle trips in the port during the construction period [
46,
48].
Two key substitution actions are occurring in the Stockholm Royal Seaport. In the long-term the city aims to move from waste-to-energy and to distributed renewable energy systems in the port [
49]. Thus, developers must install solar PV to cover 10–20% of building electricity need in new developments [
50]. Solar cell arrays can also be found in three port areas. In addition, the Port of Stockholm purchases renewable energy for all its internal operations and for tenant and shipping customers [
45]. Furthermore, the port authority is trying to develop its own renewable supply, using geothermal energy [
45]. Finally, all trucks operating in the port use a fuel with a high renewable content [
45]. Smart grid has enabled the use and generation of distributed renewable energy. It will also help facilitate the use of electric vehicles, alongside the charging infrastructure incorporated into new developments. A modal shift towards cycling, walking and vehicle share has been encouraged through street structure, limited parking provision and green infrastructure [
46,
48].
Localisation of activities is difficult in a port. The commercial port is economically dependent on the movement of passengers across a range of scales. Thus, localisation actions must focus on living functions. The local provision of services and employment opportunities, in combination with the site’s close proximity to the city-centre, encourages the localisation of trips for those living in SRSP [
46,
48]. Construction waste, organic waste and contaminated soil are all reused or recycled on site [
46,
48]. The future aim is for port’s total energy requirement (for the living function) to be generated on site [
46,
48].
Sharing actions in the SRSP are currently rather limited. There is no evidence as yet of co-living or co-working spaces (although there is in other parts of the city). However, there are vehicle and bike-share schemes. There are also communal spaces and grow boxes in residential areas. Swap days have also been organised [
46,
48]. These offer an opportunity to develop sharing actions within the community.
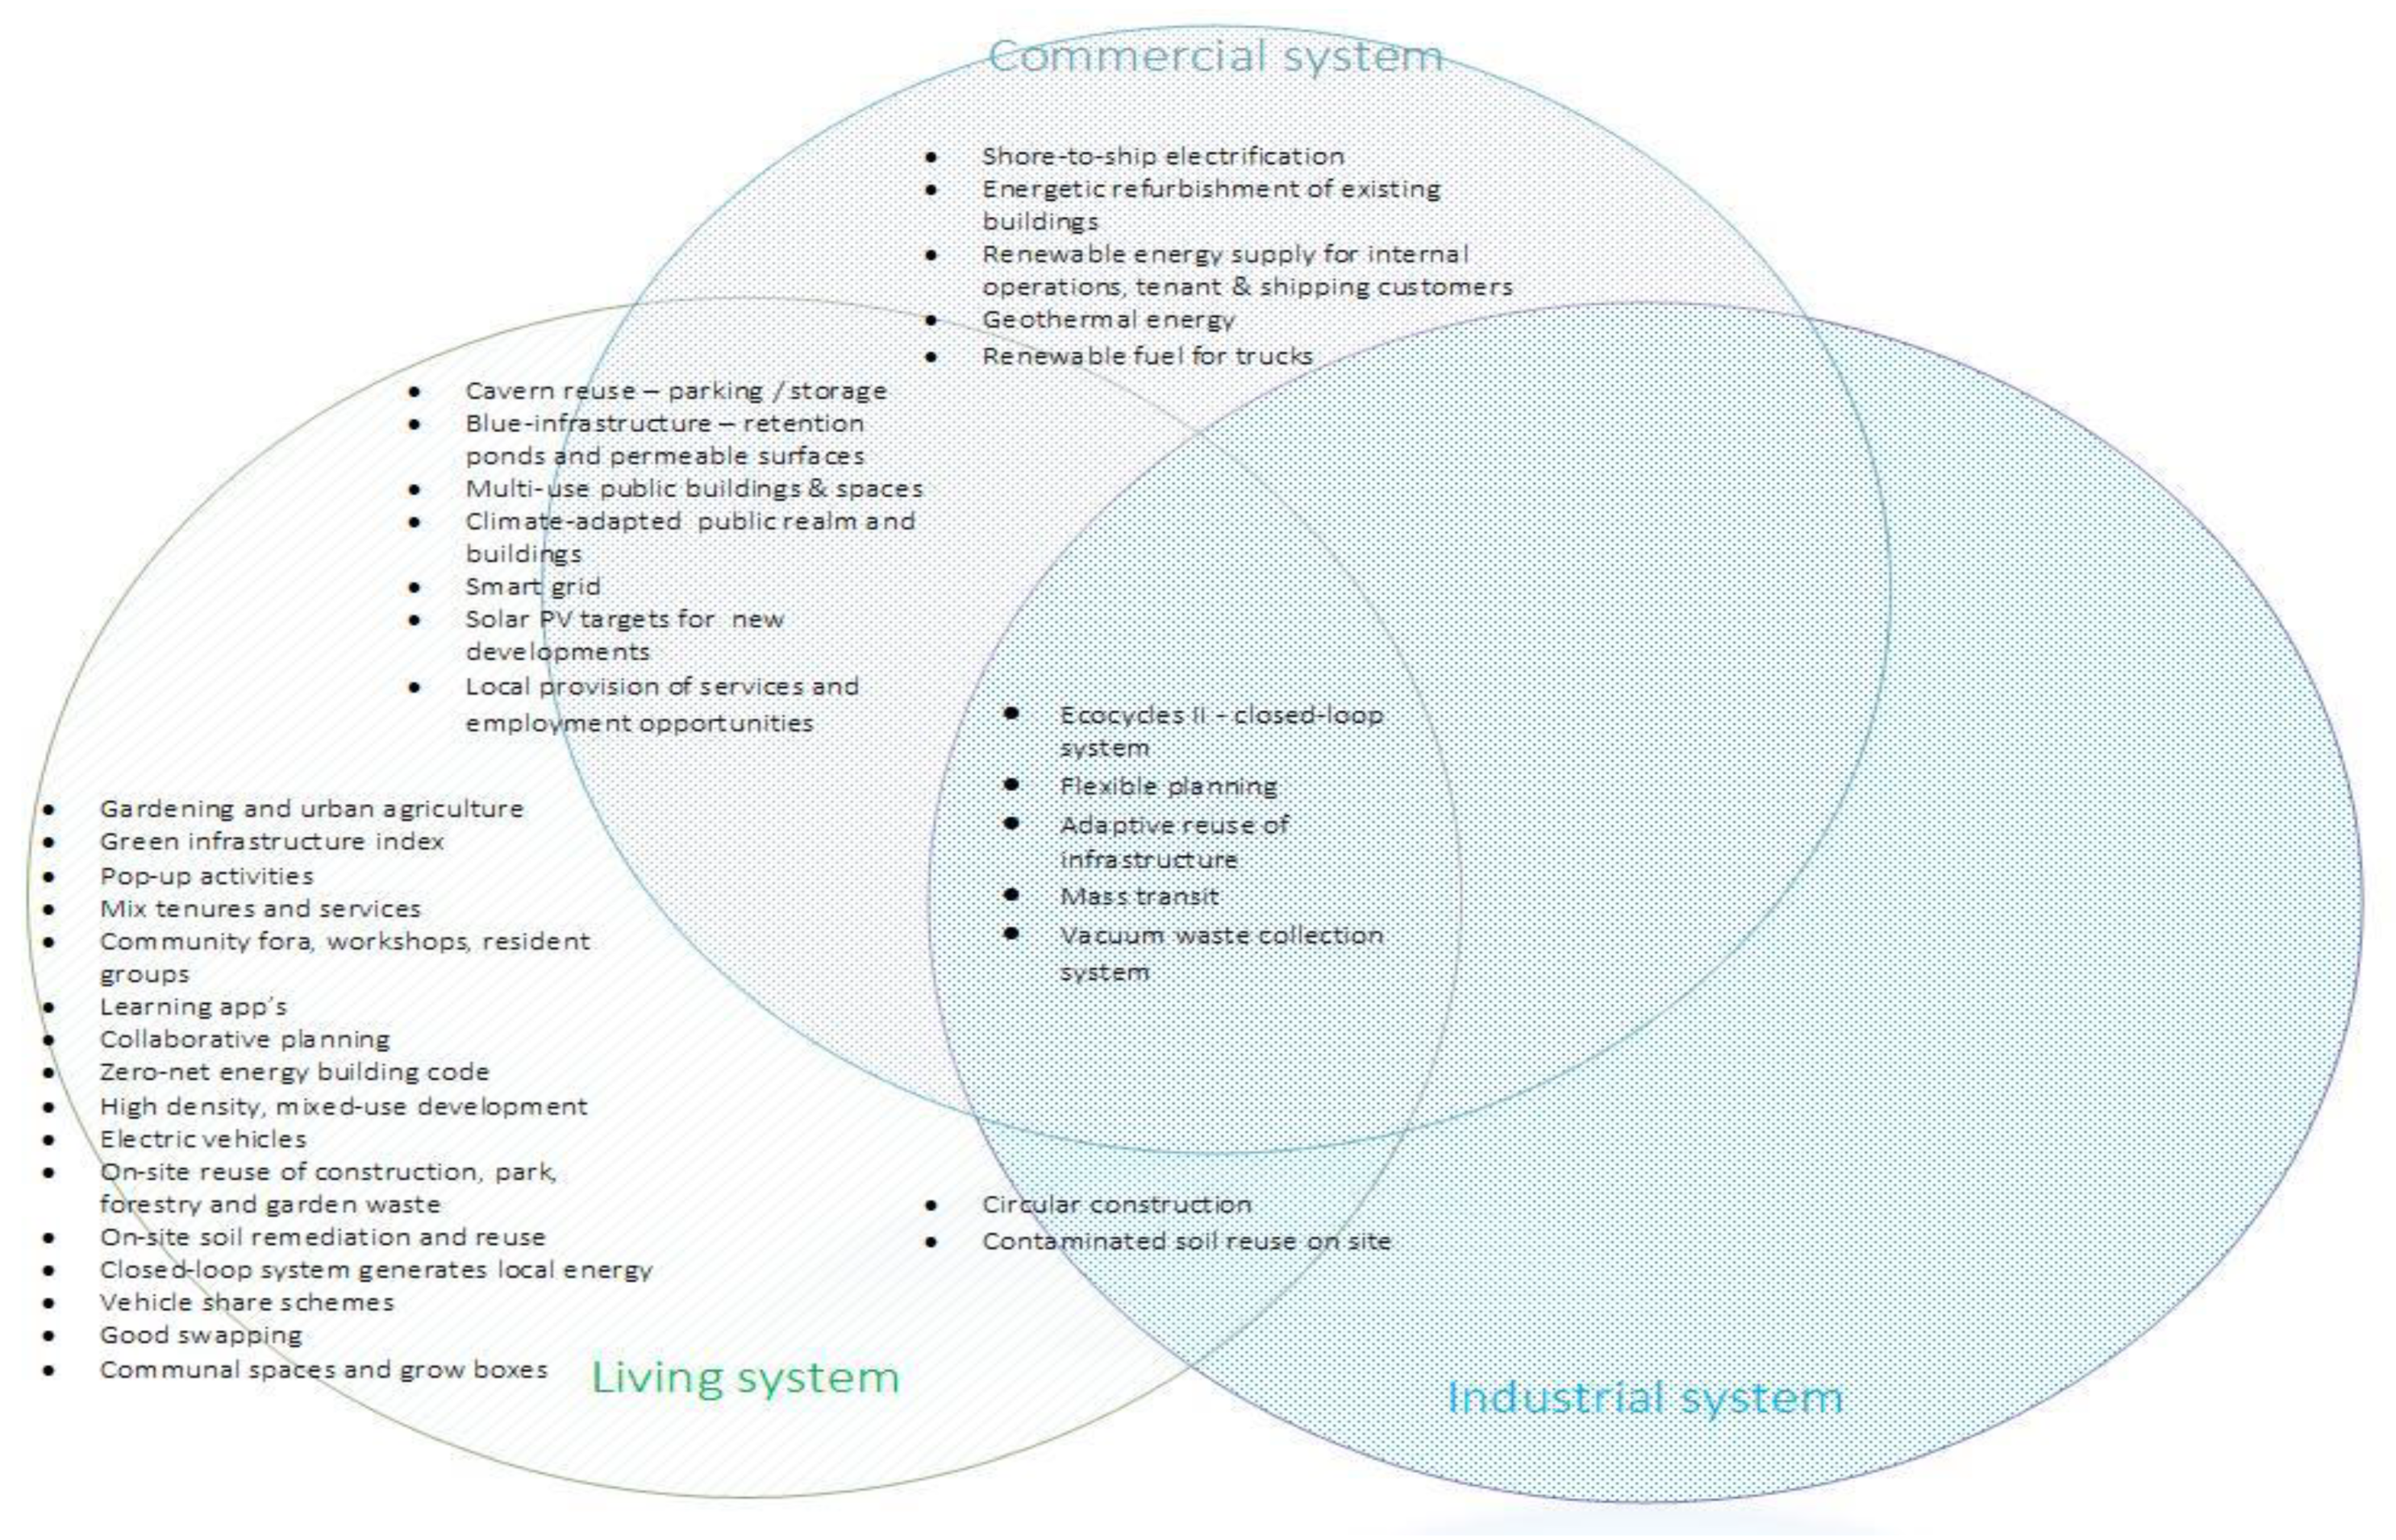
A range of circular and supporting actions have been adopted in the regeneration strategy for the port (
Table 1). The majority of these actions have been taken in the living environment which is currently being constructed (
Figure 7). All three circular actions (loop, ecological regeneration and adapt) have been integrated into the living system. These are reinforced by the four supporting actions; particularly through optimisation and localisation of activities. A significant number of actions have also been adopted in the commercial sub-system. All three circular actions have been implemented, supported by optimisation and substitution.
In the industrial system fewer actions—looping, adaptation and optimisation—have been taken. This is in part because the city has limited control over the existing industrial operations and thus cannot enforce new approaches. New industries entering the site have yet to develop, so it is uncertain what actions they will take. Industrial opportunities for looping—circular economy—such as those outlined in [
3] are unlikely to gain traction. This is because the expansion in manufacturing industry needed to support it, would conflict with the port’s main function as a living environment. However, the new industries (commercial, retail, hospitality, etc.) emerging on site will benefit from adopting the circular systems of provision integrated into the living and port environments. This analysis suggests that different port functions (living, commercial and industrial) will benefit from adopting different combinations of circular and supporting actions.
Actions to enable resource sharing and the localisation of activities do not seem to have gained much traction in SRSP. Much more could be done to encourage co-working and co-living in the seaport, as there is no real conflict between the functions and sharing actions. However, localising activities in a port is more difficult. For the Royal Seaport this problem is compounded by the existence of the Norra Länken which connects the port to the airport and the rest of Sweden. However, the economy of the port, Stockholm and Sweden rely on the international movement of people (in particular). Also localisation of activities is not necessary for circular regeneration (although it is helpful). In the case of a port, it would seem that the focus should be on localising the activities of those living and working in the port, rather than the movement of tourists and freight. In the SRSP this includes localising trips and the local recycling, reuse and recovery of waste (soil, organic waste, refuse, etc.).
Furthermore, the city council and port authority hope to promote learning and cultural exchange amongst those visiting SRSP [
45,
46,
48] Visitors can go to the information centre and have guided tours around the site and learn about the sustainable systems of provision which have been integrated into SRSP. They can also experience circular practices whilst on board the cruise ships and ferries. Circular systems of provision are integrated into the accommodation and services available in SRSP. However, much of the infrastructure which supports these systems is not visible. Nevertheless, experiencing the circular systems of provision (e.g., grey-water recycling and ecocycles heating in hotels; eating at pop-up cafes) and engaging in circular practices (e.g., separating food waste in cafes; displaying the range of recycled products in shops; urban agriculture and upcycling workshops) is essential to promote learning and change in cultural values and behaviour of those living in and visiting the port.
5. The Dynamic Nature of Circular Actions—The Synergies and Conflicts in SRSP
The case study also demonstrates some of the synergies between circular actions (
Figure 8). These synergistic relationships between the three circular actions justify their combination in the circular urban regeneration conceptualisation.
There are positive synergies between regenerating and looping actions in the seaport. For example, waste-water recycling (looping action) removes pollutants causing eutrophication in the local water-ways (regenerative action). Microbial remediation of naphtha (looping action) in the caves enables storm-water storage (regenerative action). Land recycling and soil remediation (looping action) increases potential for green infrastructure to flourish locally (regenerative action). Storm-water captured by blue infrastructure (regenerative action) is reused for watering trees on site (looping action).
There are also positive synergies between regenerative and adaptive actions in the seaport. The provision of green and blue infrastructure (regenerative action) in the seaport helps the environment to adapt to climate change (adaptive action), particularly by reducing flash flooding. Regenerated blue and green spaces (regenerative action) are used for pop-up activities (adaptive action), for example sports and cultural festivals. There are positive synergies between adaptive and looping actions. For example, the adaptive reuse (adaptive action) of underground caverns for car parking was enabled by the microbial remediation of the naphtha stored in the caverns (looping action).
The case study also demonstrates some of the synergies between circular and supporting actions which have emerged in SRSP. For example, localising activities help to support looping actions by reducing costs of transportation. The value of “waste” materials is low, the costs of recycling and transportation can be high. Thus, for reuse or recycling to be economically feasible, “waste materials” must be used locally [
48]. So construction, garden waste and contaminated soil are reused and recycled locally in SRSP. There is also a positive relationship between local activities and adaptation. Local engagement in collaborative planning, community fora and residents’ associations has helped to build adaptive capacity within the local community [
48].
However, conflicts between supporting and circular actions have also emerged in SRSP. For example, optimisation and substitution both reduce the potential for operating waste-to-energy systems (i.e., Ecocycles II). By reducing waste generated within SRSP or increasing renewable energy production we reduce the feasibility of operating the closed-loop system [
48]. Equally, the existence of the district heating system in Stockholm, also reduces the impetus to substitute with renewable energy [
48].
By understanding the dynamics between these actions, we can begin to identify the combination of actions which are more likely to be successfully implemented. In port systems where some actions have already been taken, we can determine additional complementary actions which could be introduced. This provides valuable insight for those integrating circular systems of provision in port environments. However, much more research needs to be done to explore further the dynamics between the actions and test those already identified.
6. Measuring Performance
As an example of best practice, SRSP could provide valuable data for monitoring the circular regeneration process. Using the indicators framework outlined earlier in the paper (
Figure 3 and
Table 1), the investigation sought to determine the data which could be used to monitor the circular regeneration process in SRSP. In
Table 3 we compare the data collected for the sustainability reporting exercise, with the indicators for levers, actions and outcomes of circular regeneration. Some sustainability reporting indicators provided useful data for monitoring the circular regeneration process. For example, for circular construction the city council collected data on the number of people attending circular construction capacity building workshops and reduction of construction waste (outcomes).
However, these findings show that there are many circular activities which are not being monitored in SRSP. In fact, 60% of circular activities identified as taking place by the focus groups and technical reports in SRSP were not reported on. For example, there was no information on cavern reuse; garden and agricultural waste recycling; provision of blue infrastructure; flexible planning, creation of multi-use spaces; educational programmes to support looping, regenerating and adaptation.
Ideally, indicators for circular regeneration should cut across all stages in the implementation process (levers, actions and outcomes). The sustainability indicators devised for SRSP focussed on outcomes. There were no indicators for levers and limited indicators for actions. Yet, for policy-makers it is essential to know what levers for building circular capacity have been implemented and are successful. Equally it is important to have indicators which monitor the actions which have been taken, even before the results of those actions can be monitored. This helps to ascertain, for example, whether developers have provided key infrastructure, services required to support circular urban regeneration and adhered to standards during the construction process.
The indicators used for sustainability reporting in SRSP provide only a limited indication of the environmental, social or economic benefits (outcomes) of adopting a circular regeneration approach. Data on outcomes (benefits/disbenefits) provide a useful political tool for monitoring progress and allocating funds to circular regeneration. Indicators that monitor potential problems generated by adopting this approach, for example social exclusion produced by high property prices, should also be developed. Thus, indicators for all stages of the circular regeneration process require development.
When the data was broken down by sub-system, the gaps were even more stark (
Table 4). It seemed that most of the data had been collected by the local authority for the living system which was currently under development. Data for the industrial and commercial sub-systems was non-existent or sparse. The one exception was the Ecocycles system, which cuts across all sub-systems. Here the energy provider collected useful data to monitor outcomes. The City Council and Port Authority have a responsibility for monitoring and reporting. Thus, more data is available for the commercial and living systems. In both cases, current improvements necessitate performance monitoring. Industrial actors may have similar responsibilities for reporting, depending on the regulatory framework, but this data is not always publicly available. In addition, the system is not currently being transformed and thus there is less need for collecting reporting data.
Finally, it was also apparent that sustainability monitoring largely focussed on actions and outcomes happening on site/locally. Yet many of the outcomes of the circular urban regeneration process will have a bigger influence, a more global effect, which will be difficult to measure. This is particularly true of environmental outcomes (carbon sequestration, air and water pollution, green-house gas emissions).
In sum, sustainability reporting may provide some useful indicators which we can use to monitor the circular regeneration process. However, it seems that indicators which are specifically designed to monitor all the stages of the process (levers, actions and outcomes) across all of the sub-systems operating within a port need to be developed. This may require bodies which would not normally collect or publish data to do so. Nevertheless, this will be essential for monitoring the success of the process, to build support for it, but also to identify the problems that may arise from it.
7. Results and Discussion
This paper developed a theoretical conceptualisation of circular urban regeneration (building on the circular cities concept) and observed its application across three sub-systems in a city port. The case study has allowed us to begin to understand the dynamics between circular and supporting actions, how they relate to each other, the synergies and conflicts. However, more data is needed to explore these dynamic interactions fully.
This research suggests that there are positive synergies between circular actions. All three circular actions appear to support and enhance the other. This begins to build a case for adopting all three actions in combination, as suggested by the circular cities and circular regeneration conceptualisations, to maximise the benefits. Of course this will require more robust testing.
The research also demonstrates that some circular (looping) actions may conflict with supporting actions (optimisation and substitution). This begins to provide an indication of the combination of actions which may work together successfully. It also highlights which actions (localisation in particular) are unlikely to be operable in a port system. Although the research suggests that in a post-industrial context, localisation of actions within the living environment is entirely possible in a port system.
A nascent framework for circular urban regeneration indicators was also developed. This was compared with the data collected for the sustainability reporting exercise in SRSP, to determine whether the data collected could be used to monitor circular urban regeneration. The data collection process appeared to be relatively comprehensive in SRSP. However, it became apparent that only a few of the indicators collected for sustainability reporting, could be utilised for monitoring the circular regeneration process. This was surprising as one would imagine that looping, ecological regeneration and adaptation would underpin a sustainable development process. It was also found that the sustainability monitoring data was not collected for all sub-systems. This was largely as a result of differing reporting responsibilities between actors in SRSP.
This investigation suggests that collecting data which monitors all the stages of the circular urban regeneration process (levers, actions and outcomes) should be incorporated into the sustainability reporting process and that this should be applied to all actors operating within the urban system.
Thus, the scientific originality of the paper comes from the conceptualisation of circular regeneration process. The identification of synergistic relationships between circular actions. The development of a framework for monitoring the process of circular urban regeneration.
8. Conclusions
The case study also highlights some of the challenges facing a circular urban regeneration process in a city port. The first relates to the need to align actor goals in order to implement a circular vision. The second results from the limited control the city has over commercial and industrial functions in the port. The key to aligning actor goals to deliver a circular vision in SRSP is the leverage given by the public ownership of the land and port authority [
38]. However, the political support for this vision and its embodiment in the environmental programme (and targets) for the redevelopment, have also been critical to its successful implementation [
38]. The circular transition has been further leveraged by the value of the city centre site and the potential real estate opportunity it provides. Thus, additional costs generated by novel practices and technologies are factored into the value of real estate on the site. However, this of course creates a problem with housing affordability.
The regeneration process itself, also helped to align actor goals. A very collaborative approach to development has engaged a range of actors (academia, government, port authority, civil society, utilities, developers, industrial, commercial and service providers) in the planning, construction and operation of the development. It has helped to build a greater understanding of the problems facing the port and build consensus around the potential solutions [
38]. The collaborative approach has also increased local knowledge about technical solutions and processes which can be used to deliver the circular actions. It has increased local support for the project [
38].
Local ownership of land in the port and control over onshore port functions, has been critical to the delivery of circular regeneration. Certainly, for ports where the capacities and resources available to the city are less, it is likely to be more difficult to deliver such a transition. In addition, the city council has very little control over the commercial and industrial functions of the port. In this post-industrial phase, when much of the regeneration activity is focused on the living environment, this does not pose a challenge. However, for ports more reliant on the international importation of freight and industry, aligning actor goals and delivering circular regeneration may be more difficult.


