1. Introduction
Free trade is likely to have negative or positive environmental effects due to the effects of scale, technique, and composition [
1]. Moreover, trade also affects the environment via economic growth. Economic growth generally has a negative environmental effect at the first phase of development due to the scale effect of increasing energy consumption. However, it could have a positive environmental effect at the later stage due to the effects of composition and/or technique. The scale effect illustrates that pollution emissions are increasing due to higher economic activities and energy consumption, which is because more emphasis is placed on economic growth rather than pollution control at the initial stage of the development process. Later in the development process, economic growth promotes an increase in the demand for a cleaner environment in order to attain a higher standard of living. For this purpose, dirty production processes are replaced with clean production processes, or with the service sector, which is termed as the composition effect. Moreover, demand for clean technology also increases at the second stage of development. As a result, the effect of technique aids positive environmental effects. In summary, increasing economic growth is responsible for environmental degradation at the earlier stages of the development process, and helps to improve the environment at the later stages. This quadratic effect is known as the environmental Kuznets curve (EKC) hypothesis [
2,
3]. Recent empirical studies have tested and also corroborated the existence of the EKC hypothesis [
4,
5,
6].
The EKC hypothesis has been a workhorse of the environmental literature since trade liberalization became more widespread in the 1980s. Tunisia also introduced trade liberalization in the 1980s to foster economic growth [
7]. This liberalization helped expand its trade with the world at large, and with geographically close trading partners of the European Union (EU). Most Tunisian exports consist of manufactured items. For example, in 2017, 77% of Tunisian exports to the EU were of manufactured items and 41.1% of imports were of energy consumption-oriented items, such as machinery and vehicles [
8]. Furthermore, increasing trade openness also attracts foreign investment. According to the pollution haven hypothesis (PHH) theory, dirty industries in developed countries face more costs due to tight environmental policies, thus they shift their dirty production processes over to the developing world in order to enjoy the advantages of lax environmental policies and a cheap labor force [
9]. On the other hand, the foreign firm could gain positive environmental effects through the implementation of the better and cleaner technology standards of the developed world [
10].
In the energy consumption profile of Tunisia, most energy is utilized by the transport and industry sectors, and around 90% of energy consumption is from fossil fuel sources. Increasing energy demand and depletion of Tunisian oil resources have shifted its status from net oil-exporter to net oil-importer. To protect the environment, Tunisia is trying to control pollution through its National Environmental Control Agency; however, Tunisia was still ranked 58th on the Environmental Performance Index (EPI) in 2018. This shows that increasing economic growth can be responsible for environment degradation. Trade openness has the tendency to contribute to shaping the EKC hypothesis, in any country, because trade openness, generally, has a positive effect on economic growth. On the other hand, trade openness has the potential to aid positive environmental effects if it can change the development practices of countries, in their specialized industries, to that of clean production.
Trade openness is expected to have net negative environmental effects if the scale effect of trade openness is found to be dominant over the technique/composition effects; and net positive environmental effects are expected for an inverse situation. Moreover, trade openness can have asymmetrical effects on pollution emissions, as increasing trade openness does not necessarily have the same sign and magnitude of effect as that of decreasing trade openness. According to Keynes [
11], the increasing trend of any macroeconomic variable turns into a negative trend suddenly and violently, whereas a downward trend does not have the same sharp shift into an upward trend. Secondly, increasing trade increases energy consumption and pollution due to the increasing income level of a country. However, decreasing trade does not necessarily reduce the energy consumption, due to the ratchet effect. The ratchet effect illustrates that when the income level decreases, consumption does not decrease in the same manner [
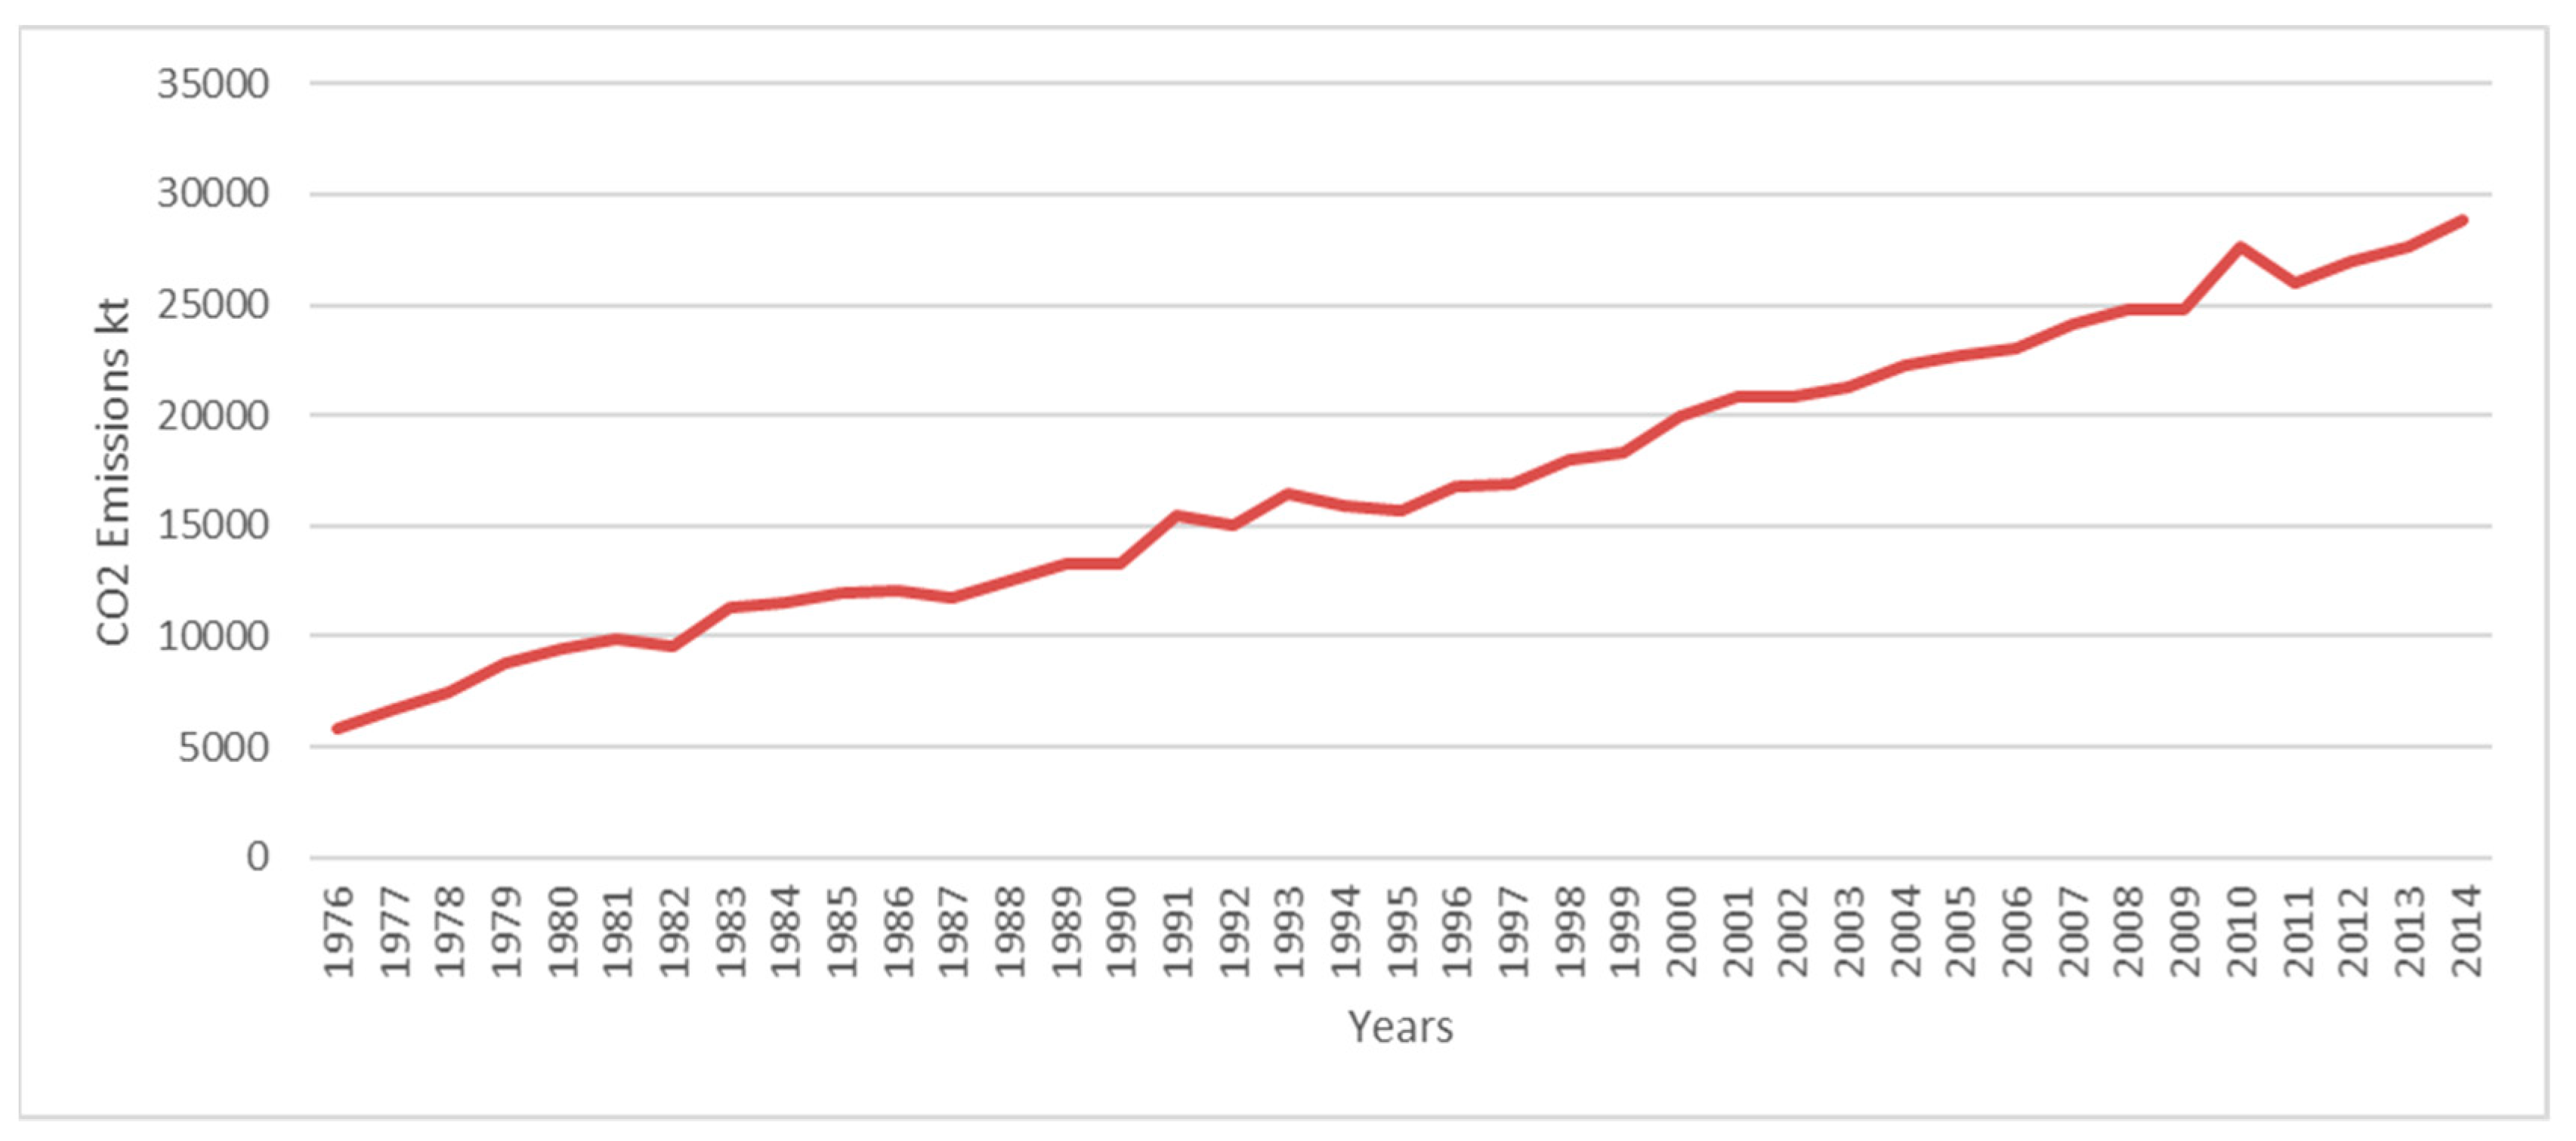
12]. Following these arguments, the asymmetrical effects of increasing and decreasing trade openness on energy consumption and pollution emissions are expected. This fact can also be observed from
Figure 1,
Figure 2 and
Figure 3. The increasing trend of trade openness corresponds with the increasing trend of CO
2 emissions in the majority of the years during the period 1976–2014. However, this positive relationship does not hold in the declining periods of trade openness. In the years 1983, 1985, 1991, 1996–1999, 2002–2003, and 2013–2014, trade openness declined significantly but gross domestic product (GDP) and CO
2 emissions increased sufficiently, instead of declining.
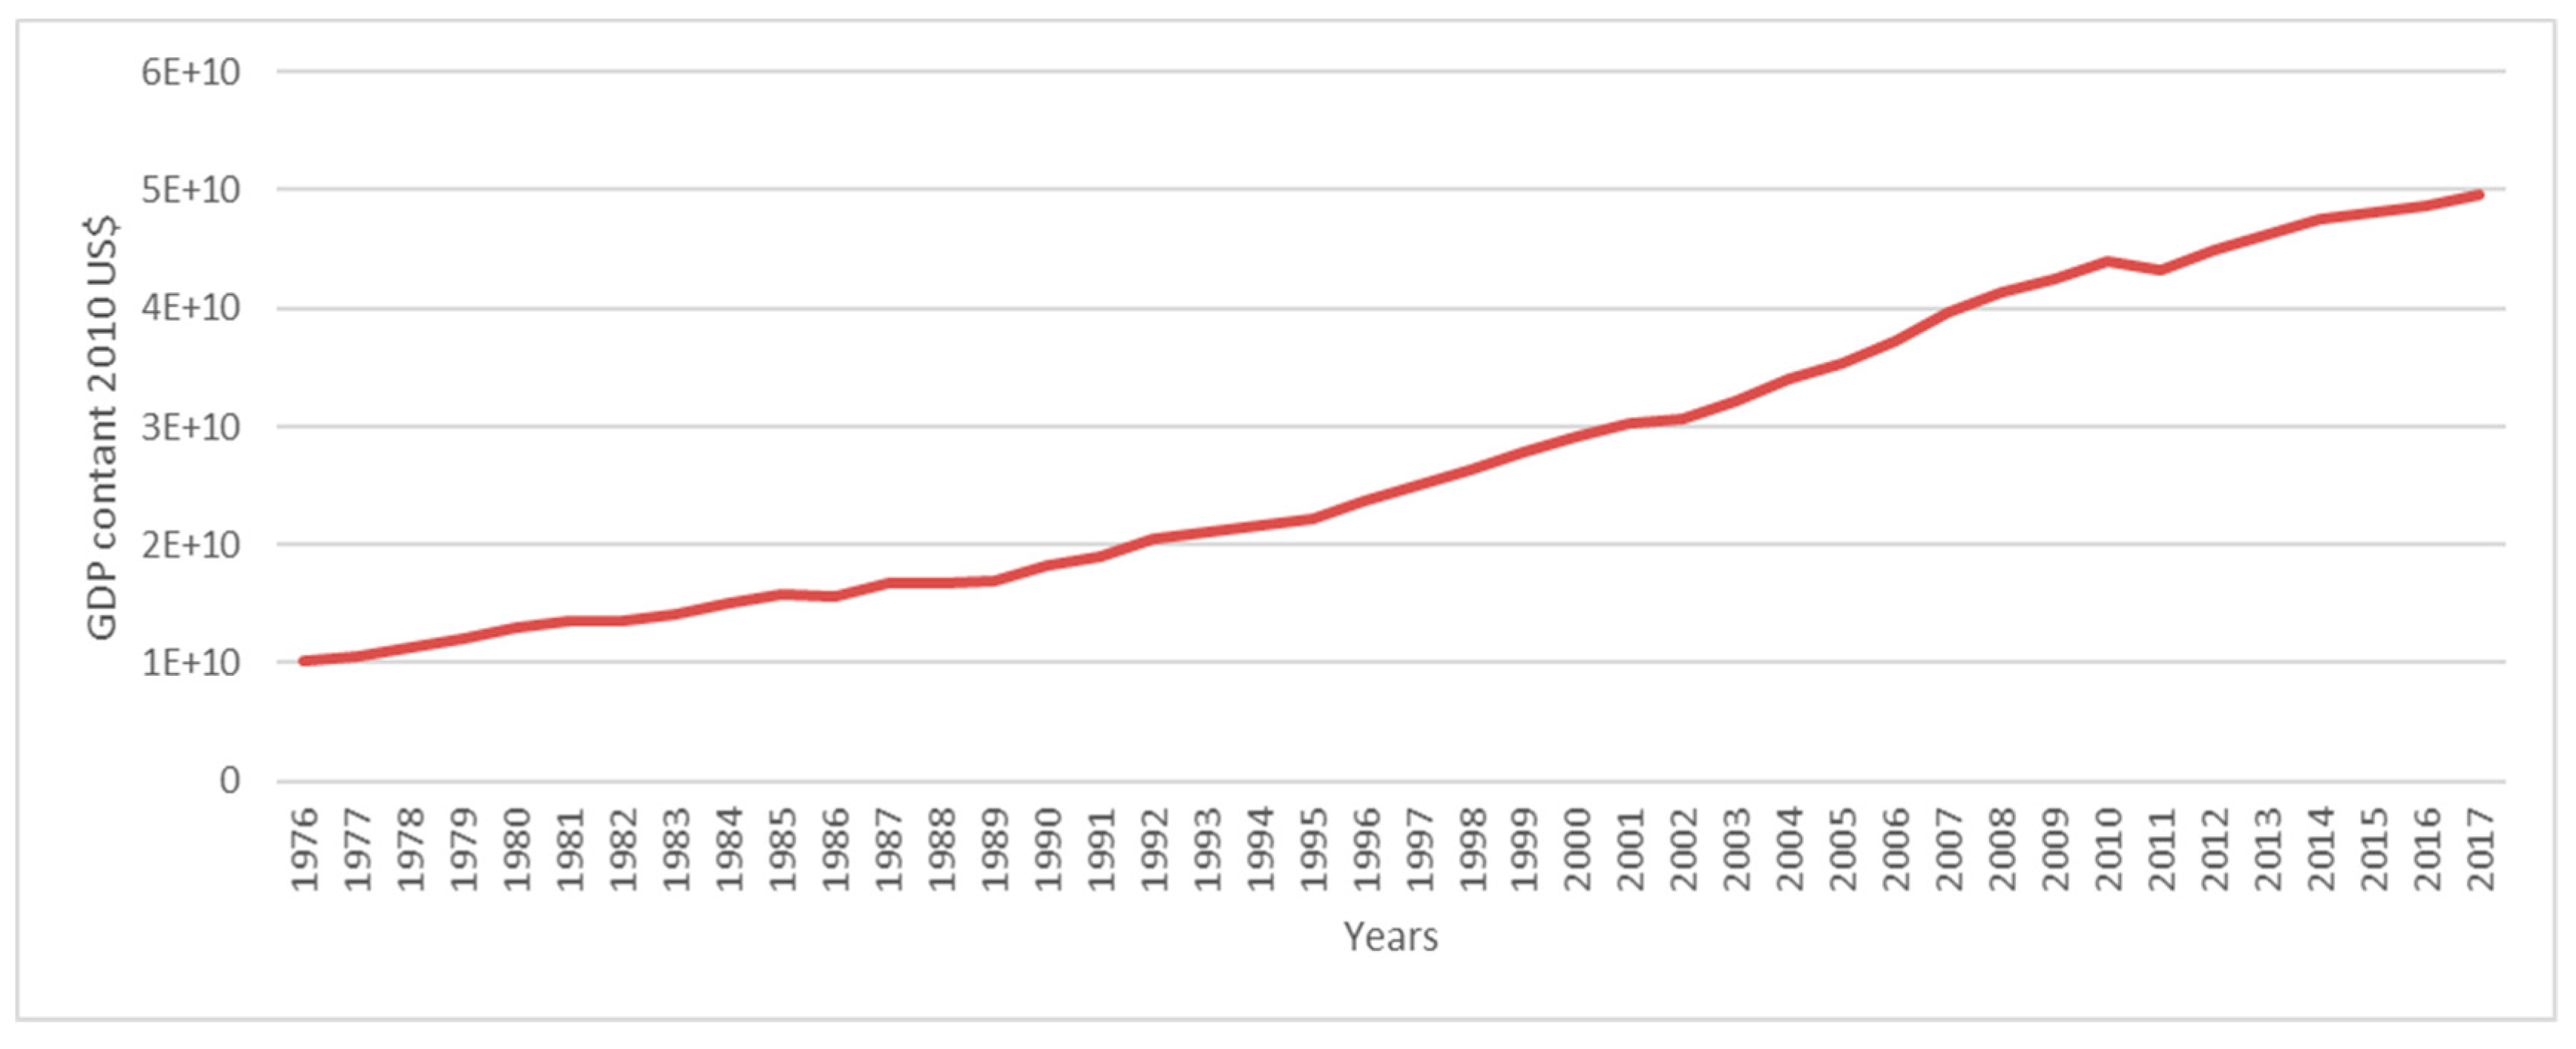
Figure 1,
Figure 2 and
Figure 3 show the positive trends of CO
2 emissions and GDP in the majority of the years studied. A positive relationship could be expected from the co-movements of CO
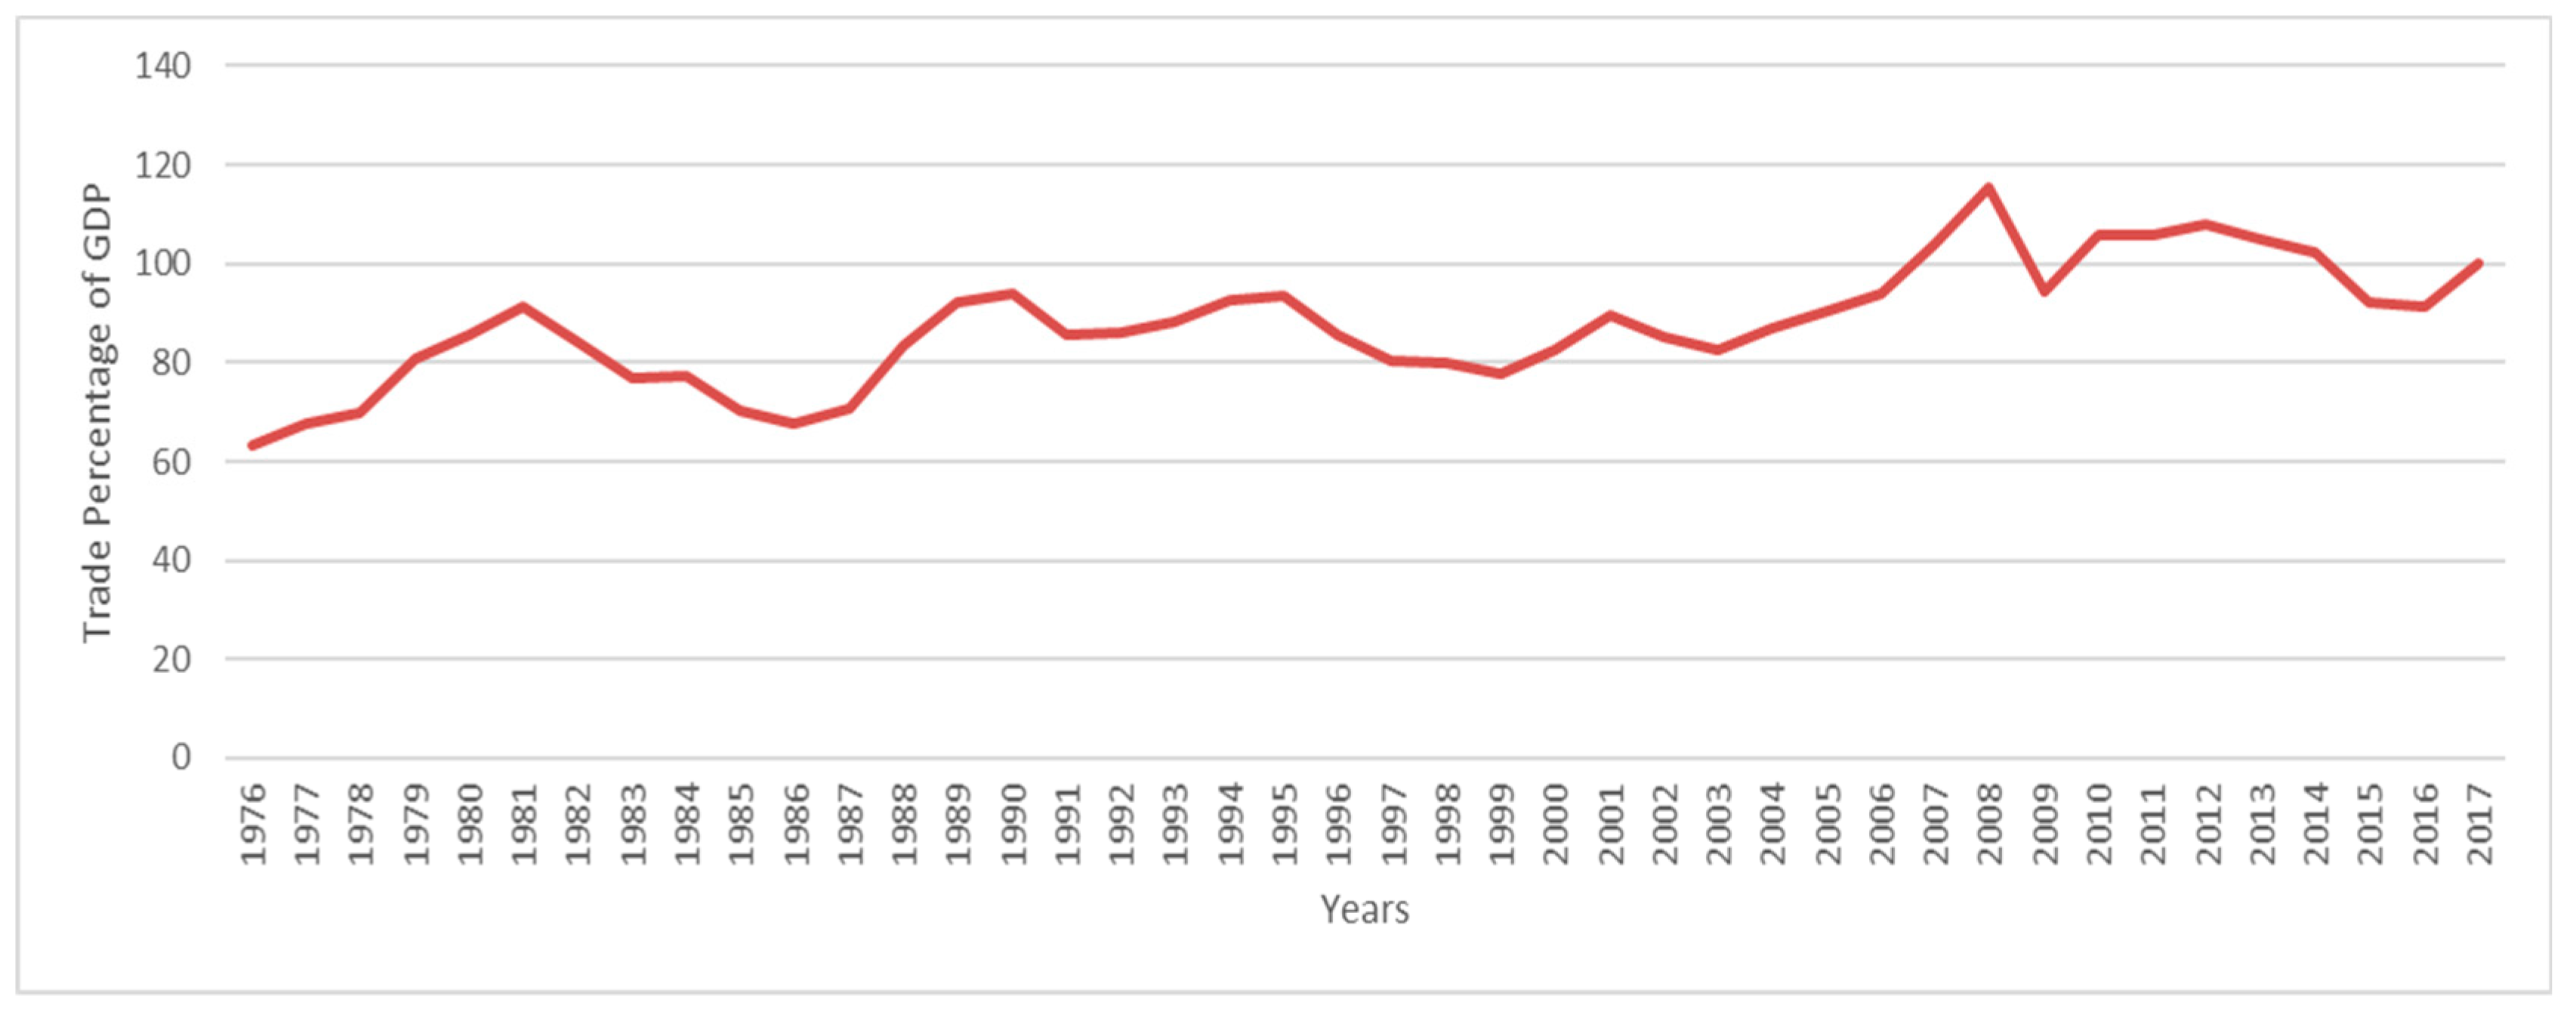
2 emissions and GDP. However,
Figure 2 shows relatively more volatility in the trade openness series (percentage of trade to GDP) in comparison to
Figure 1 and
Figure 3. Furthermore,
Figure 1 and
Figure 2 show that trade openness during the period 1976–2014 coincides with increasing CO
2 emissions, except for in 1987 and 1994. This further corroborates the positive relationship between them. In the same way, this positive relationship can also be observed in decreasing trade openness and decreasing CO
2 emissions in some of the years. However, relatively more evidence of a negative relationship between the two (decreasing trade openness and decreasing CO
2 emissions) can also be observed. Therefore, the direction (positive or negative) of the relationship is not certain from the trends of decreasing trade openness and decreasing CO
2 emissions.
The EKC hypothesis has been tested in the pollution literature in the case of Tunisia with mixed results regarding the relationship between income and CO
2 emissions. For instance, Shahbaz et al. [
13] corroborate an inverted U-shaped relationship between income and CO
2 emissions and validated the EKC hypothesis. Conversely, Sekrafi and Sghaier [
14] found a U-shaped relationship between income and CO
2 emissions. Further, Arouri [
15] and Fodha and Zaghdoud [
16] could not find a quadratic relationship and reported a monotonic effect of income on CO
2 emissions. A possible reason for these different results is the incorporation of an energy consumption variable in the model which generates biases in the relationship of CO
2 emissions and income [
17]. As a result, we investigated the EKC hypothesis without an energy consumption variable in the model. We also tested the effect of trade openness on CO
2 emissions in both symmetry and asymmetry settings. Testing asymmetrical effects is relatively scant in the environment literature and is absent in testing the trade–environment relationship.
Figure 1 and
Figure 2 illustrate the possibility of the asymmetry in the relationship of CO
2 emissions and trade openness. Using an empirical exercise, this research seeks to contribute to the literature by testing whether increasing and decreasing trade openness have symmetrical effects on CO
2 emissions.
2. Literature Review
Some pioneer studies have focused on the testing of the relationship between income and pollution emissions and claimed that trade liberalization is responsible for higher emissions due to a scale effect and can also help to reduce emissions due to composition and/or technique effects. The EKC hypothesis explains that increasing income is responsible for increasing pollution emissions at an earlier stage of growth and helps to improve the environment at later stage of growth. Trade liberalization was responsible for shaping this nonlinear relationship between income and pollution emissions [
2,
3]. Afterwards, the environment literature shifted the focus to the effect of trade openness on pollution emissions.
Table 1 shows the relevant literature summary. Managi et al. [
18] investigated the determinants of different pollution emissions for a mixed panel of the Organization of Economic Cooperation and Development (OECD) and non-OECD countries using the Ordinary Least Square (OLS), Fixed Effects (FE) and Generalized Method of Movement (GMM) methodologies. They found that trade openness has a positive effect on the all investigated emissions. Halicioglu [
19] investigated the EKC hypothesis in Turkey including foreign trade in the model of CO
2 emissions per capita. He found evidence of the EKC hypothesis and also reported the positive effects of energy consumption and foreign trade on CO
2 emissions per capita. Further, Granger causality is found from energy consumption and income to CO
2 emissions per capita but not from foreign trade. Hossain [
20] investigated the Granger causality for nine newly industrialized countries during the period 1971–2007. He found that trade openness is causing CO
2 emissions, economic growth and urbanization. Further, economic growth is also causing CO
2 emissions.
Naranpanawa [
21] applied the cointegration and Granger causality test in the relationship between trade openness and CO
2 emissions in Sri Lanka during the period 1960–2006. He found that trade openness is causing CO
2 emissions, investment and economic growth. Further, he reported that economic growth is causing the investment and investment is causing trade openness. Chebbi et al. [
7] investigated the triangular relationship among trade openness, CO
2 emissions and economic growth in Tunisia during 1961–2005. They reported that trade openness has direct positive effects on CO
2 emissions in the long and short term and has negative indirect effects in the long term. Using the period 1990–2004, Kozul-Wright and Fortunato [
22] investigated the EKC hypothesis for a panel of countries. They found a U-shaped relationship between economic growth and CO
2 emissions. Further, trade openness has a positive effect, while institutional quality and Foreign Direct Investment (FDI) inflows have negative effects on CO
2 emissions. Chang [
23] reported that trade liberalization has negative environmental effects in high corrupt countries and has pleasant environmental effects in less corrupt countries. Further, they found a U-shaped relationship between income and CO
2 emissions in less corrupt countries.
Al-Mulali et al. [
24] worked on the period 1990–2013 for 23 European countries. They found that economic growth and urbanization increase CO
2 emissions, while trade openness helps to reduce CO
2 emissions. Further, they found that some sources of renewable electricity generation have positive environmental effects and the rest have insignificant effects. Ahmed et al. [
25] investigated the monotonic effects of energy consumption, trade openness and income on CO
2 emissions in four newly industrialized countries during the period 1970–2013. They found a positive effect of energy consumption and negative effects of trade openness and income on the CO
2 emissions. In the Granger causality analysis, they reported a unidirectional causality from energy consumption, trade openness and economic growth to CO
2 emissions and from trade openness to energy consumption and economic growth. Hakimi and Hamdi [
26] probed the determinants of CO
2 emissions in Tunisia and Morocco during 1971–2013. They found that FDI, trade openness and capital positively affected CO
2 emissions in both countries’ time series and panel analyses. In the panel causal analyses, they found a bi-directional Granger causality between income and CO
2 emissions and between FDI and CO
2 emissions.
Shahbaz et al. [
27] investigated the effect of trade openness on the CO
2 emissions of 105 countries from 1980 to 2014. In the time series analyses, they found that trade openness positively contributes in the CO
2 emissions of the majority of the investigated countries. However, trade openness has an insignificant effect on CO
2 emissions in the case of Tunisia. Further, the positive effects of trade openness and income on CO
2 emissions are found for the whole panel. Mahmood and Alkhateeb [
28] inspected the EKC hypothesis in Saudi Arabia during the period 1970–2016. They found the existence of the EKC hypothesis and a negative effect of trade on CO
2 emissions. Mahmood et al. [
29] examined the determinants of CO
2 emissions per capita and the EKC hypothesis in Egypt during the period 1990–2014. They found the EKC hypothesis in Egypt and an insignificant effect of trade openness in this case. Further, they found the positive and negative effects of energy consumption and FDI on CO
2 emissions per capita, respectively.
Ignoring trade openness, some literature explored the determinants of energy consumption and CO
2 emissions in the Tunisian economy. For example, Belloumi [
30] found a long-term bidirectional Granger causality between economic growth and energy consumption and a short-term unidirectional Granger causality from energy consumption to economic growth during 1971–2004. Using the period 1971–2012, Achour and Belloumi [
31] reported a short-term unidirectional Granger causality from transport energy consumption to the transport CO
2 emissions and also found many other evidences of Granger causality among transport-related energy consumption, CO
2 emissions, infrastructure and transport value added. In testing the EKC hypothesis for Tunisia, Arouri et al. [
15] reported the existence of the EKC hypothesis for a panel of Middle East and North African (MENA) countries as a whole and most of individual countries as well. In the case of Tunisia, they could not find the EKC hypothesis and reported a monotonic effect of income on CO
2 emissions. In addition, Fodha and Zaghdoud [
16] corroborated the existence of the EKC hypothesis in the relationship of income and SO
2 emissions in Tunisia during 1961–2004, but they could not find the EKC regarding the relationship between economic growth and CO
2 emissions. In the Granger causality analysis, they found that economic growth is causing CO
2 emissions and SO
2 emissions. Extending this research, Shahbaz et al. [
13] re-examined and corroborated the EKC hypothesis in the relationship between CO
2 emissions and income in Tunisia during 1971–2010. Further, they reported that trade openness and energy consumption positively affect CO
2 emissions with low elasticity and energy consumption is causing the CO
2 emissions. Sekrafi and Sghaier [
14] investigated the EKC hypothesis and found the U-shaped relationship between CO
2 emissions and economic growth. Further, they found a negative relationship between the control of corruption and CO
2 emissions. The EKC literature dealing with the Tunisian case reports different conclusions of U-shaped, inverted U-shaped and monotonic relationships between income and CO
2 emissions which is claimed due to the variation of control variables in the model. Therefore, this issue needs further attention.
Mahmood et al. [
32] and Shahbaz et al. [
33] have investigated and corroborated the asymmetrical effects of financial development on CO
2 emissions in the case of Saudi Arabia and Pakistan, respectively. Siddiqui et al. [
34] found the asymmetrical effects of oil price on the stock markets in some Asian countries. Alkhateeb and Mahmood [
35] found the asymmetrical effects of trade openness on energy consumption in Egypt. Hence, the asymmetrical effects of trade openness can also be expected on CO
2 emissions. Assuming symmetrical effects in the presence of asymmetrical effects of any variable can be considered as an omitted variable bias in the model [
36]. Currently, the estimation of asymmetrical effects of trade openness on CO
2 emissions is missing in the environmental literature. Therefore, this present research represents an empirical contribution by hypothesizing the asymmetrical effects of trade openness in the Tunisian CO
2 emission model. Further, we aim to re-investigate the EKC to find the robust turning point because previous Tunisian literature exhibited contradictory results in regard to the relationship between income and CO
2 emissions.
3. Methodology
To model the determinants of CO
2 emissions in Tunisia, we follow the standard methodology of the EKC hypothesis, in which the quadratic effect of income variable is assumed on the pollution emissions. A justification of this quadratic relation is that income has a scale effect on the pollution emissions at the first stage of development due to increasing demand for energy consumption. At the second stage of development, pollution emissions are reduced with further economic growth due to technique and/or composition effects [
2,
3]. The positive effect of the economic growth variable and negative effect of its square are claimed for the existence of the EKC hypothesis. Most of the studies on the EKC hypothesis incorporate energy consumption in the pollution model. However, Jaforullah and King [
17] argued that energy consumption generates a systematic volatility in the estimated coefficients of the model and generates biases in the relationship of CO
2 emissions and income. Therefore, we ignore energy consumption in our model.
The EKC hypothesis has been a workhorse of the environmental literature since the implementation of trade liberalization throughout the world. Therefore, trade helps in shaping the EKC hypothesis [
3]. Tunisia is a door for European countries to enter other African countries and is an attractive place for trade. When conducting environmental research on Tunisia, we cannot ignore trade openness and assume following model:
where
CO2t = Natural logarithm of CO2 emissions in kilo tons;
GDPt = Natural logarithm of gross domestic product in constant 2010 US dollar;
GDPt2 = Square of GDPt;
TOt = Natural logarithm of percentage of trade (sum of exports and imports of goods and services) to the gross domestic product.
Following [
18,
20], TO
t is a proxy of trade openness. All the data in annual time series is sourced from the World Bank [
37] and covers the period 1976–2014. The raw data is available in the
supplementary material. A maximum available period of all hypothesized variables is utilized. Moreover, all variables are used after taking the natural logarithm to capture the elasticity parameters. To test the stationarity of the variables, we utilize the Ng and Perron [
38] test equations:
where
is a de-trended series of
. l is the bandwidth parameter and
is the auto-covariance of the residuals. In Equation (2), the null hypothesis of unit root problem (
) will be tested and its rejection will ensure the stationarity of a series (
). MZ
a, MSB, MZ
t and MPT are modified versions of the Z
a, Sargent–Bhargava (SB), Z
t and P
T tests, respectively, and allow for generalized least square de-trending of the data. These statistics are free of size problems [
38]. Ng and Perron [
38] proposed these tests to apply on the de-trended series mentioned in Equation (2). Due to the de-trending procedure and modified statistics provided in Equations (3)–(6), this test is renowned for its efficiency in a small sample case. So, it is suitable for our small sample. Afterwards, we move towards cointegration analysis to find the long-term relationship in the model. For this purpose, we utilize the Pesaran et al. [
39] methodology which follows the bound testing procedure, assuming level stationary variables for the lower bound and first difference stationary variables for the upper bound. Therefore, it is efficient even in the case of a mixed order of integration. The Auto-Regressive Distributive Lag (ARDL) model of this technique for our hypothesized model of Equation (1) can be expressed as follows:
The estimated effects of all variables in Equation (9) are of a symmetrical nature. Considering the theoretical arguments in favor of asymmetry [
11,
12] and following Shin et al. [
40], we divide a series of TO
t into two separate series of TOP
t and TON
t to test the asymmetrical effects of increasing and decreasing trade openness on CO
2 emissions. TOP
t and TON
t are generated by partial sums of positive and negative changes in TO
t variable, respectively, in the following way:
The Equations (10) and (11) are placed by the TO
t variable in the linear ARDL of Equation (9) to convert it into the non-linear ARDL:
After the selection of optimum lag lengths (mi) in Equation (12) by the Akaike Information Criterion (AIC), we apply the bound testing procedure on the null hypothesis of no cointegration, . A rejection of null hypothesis confirms the existence of an alternative hypothesis of cointegration, . After confirming cointegration, we find the long-term effects through a normalizing procedure applied on the coefficients of lagged-level variables. Further, we replace all the different variables with the error correction term (ECTt−1) and the short-term effects can be discussed with the coefficients of differenced variables thereafter.
4. Results and Discussions
To test the level of integration, we apply the Ng and Perron [
38] test and report the results in
Table 2. The unit root results show that CO2
t, GDP
t, TON
t and TO
t are non-stationary at the level and TOP
t is stationary at the 10% level of significance in all MZa, MZt, MSB and MPT statistics. Further, we apply this test on the first differenced variables and find that all variables are stationary after first differencing. ΔGDP
t, ΔTON
t and TO
t are stationary at the 5% level of significance in all statistics. ΔCO2
t is stationary at the 5% level of significance in MZt and MPT and at the 10% level of significance in MZa and MSB. ΔTOP
t is stationary at the 5% level of significance in MZa, MZt and MPT and at the 10% level of significance in MSB. Overall, one independent variable of the model is level stationary and the rest are first-differenced stationary. Therefore, a mixed order of integration is corroborated. However, we proceed for non-linear ARDL cointegration, which provides efficient results even in this situation.
After integration analyses, we apply a cointegration procedure on both linear and nonlinear ARDL models of Equations (9) and (12), respectively. We utilize a long time period and expect the structural break. To capture the most significant break in the long-term relationship of Equations (9) and (12), we utilize the Bai and Perron [
41] test and find a most significant break in the year 1983. To verify the break point of 1983, we also apply Chow test and the null hypothesis of no-break point is rejected at 1% level of significance with an estimated Wald test value of 36.9669. Therefore, the Chow test accepts the alternative hypothesis of a significant break in the year 1983. A justification for the structural break in the year 1983 in the relationships of CO
2 emissions, trade openness and income can be observed from
Figure 1,
Figure 2 and
Figure 3. In 1983, trade openness declined by 8.6% but CO
2 emissions increased by 18.7% in the same year and GDP also increased by 4.7%. These sharp changes reflect a negative relationship between CO
2 emissions and trade openness, which does not match with the relationship captured by the regression. Therefore, 1983 is justified as a break year in the relationship of the proposed model. Moreover, the country was facing many problems at that time, e.g., an expectation of change in political power, deficit in budget and in balance of trade, very low currency reserves, high government debt and debt cost and the removal of government subsidies on many items.
Table 3 shows the results of both linear and non-linear ARDL after the incorporation of a dummy variable D1983
t of break year. The F-values of both the linear and non-linear ARDL are greater than the upper critical of Kripfganz and Schneider [
42], which confirms the presence of cointegration in both models. The critical bound F-values of [
42] are utilized due to our small sample size. The critical values of Pesaran et al. [
39] are only useful and efficient for large sample sizes. Whereas, Kripfganz and Schneider [
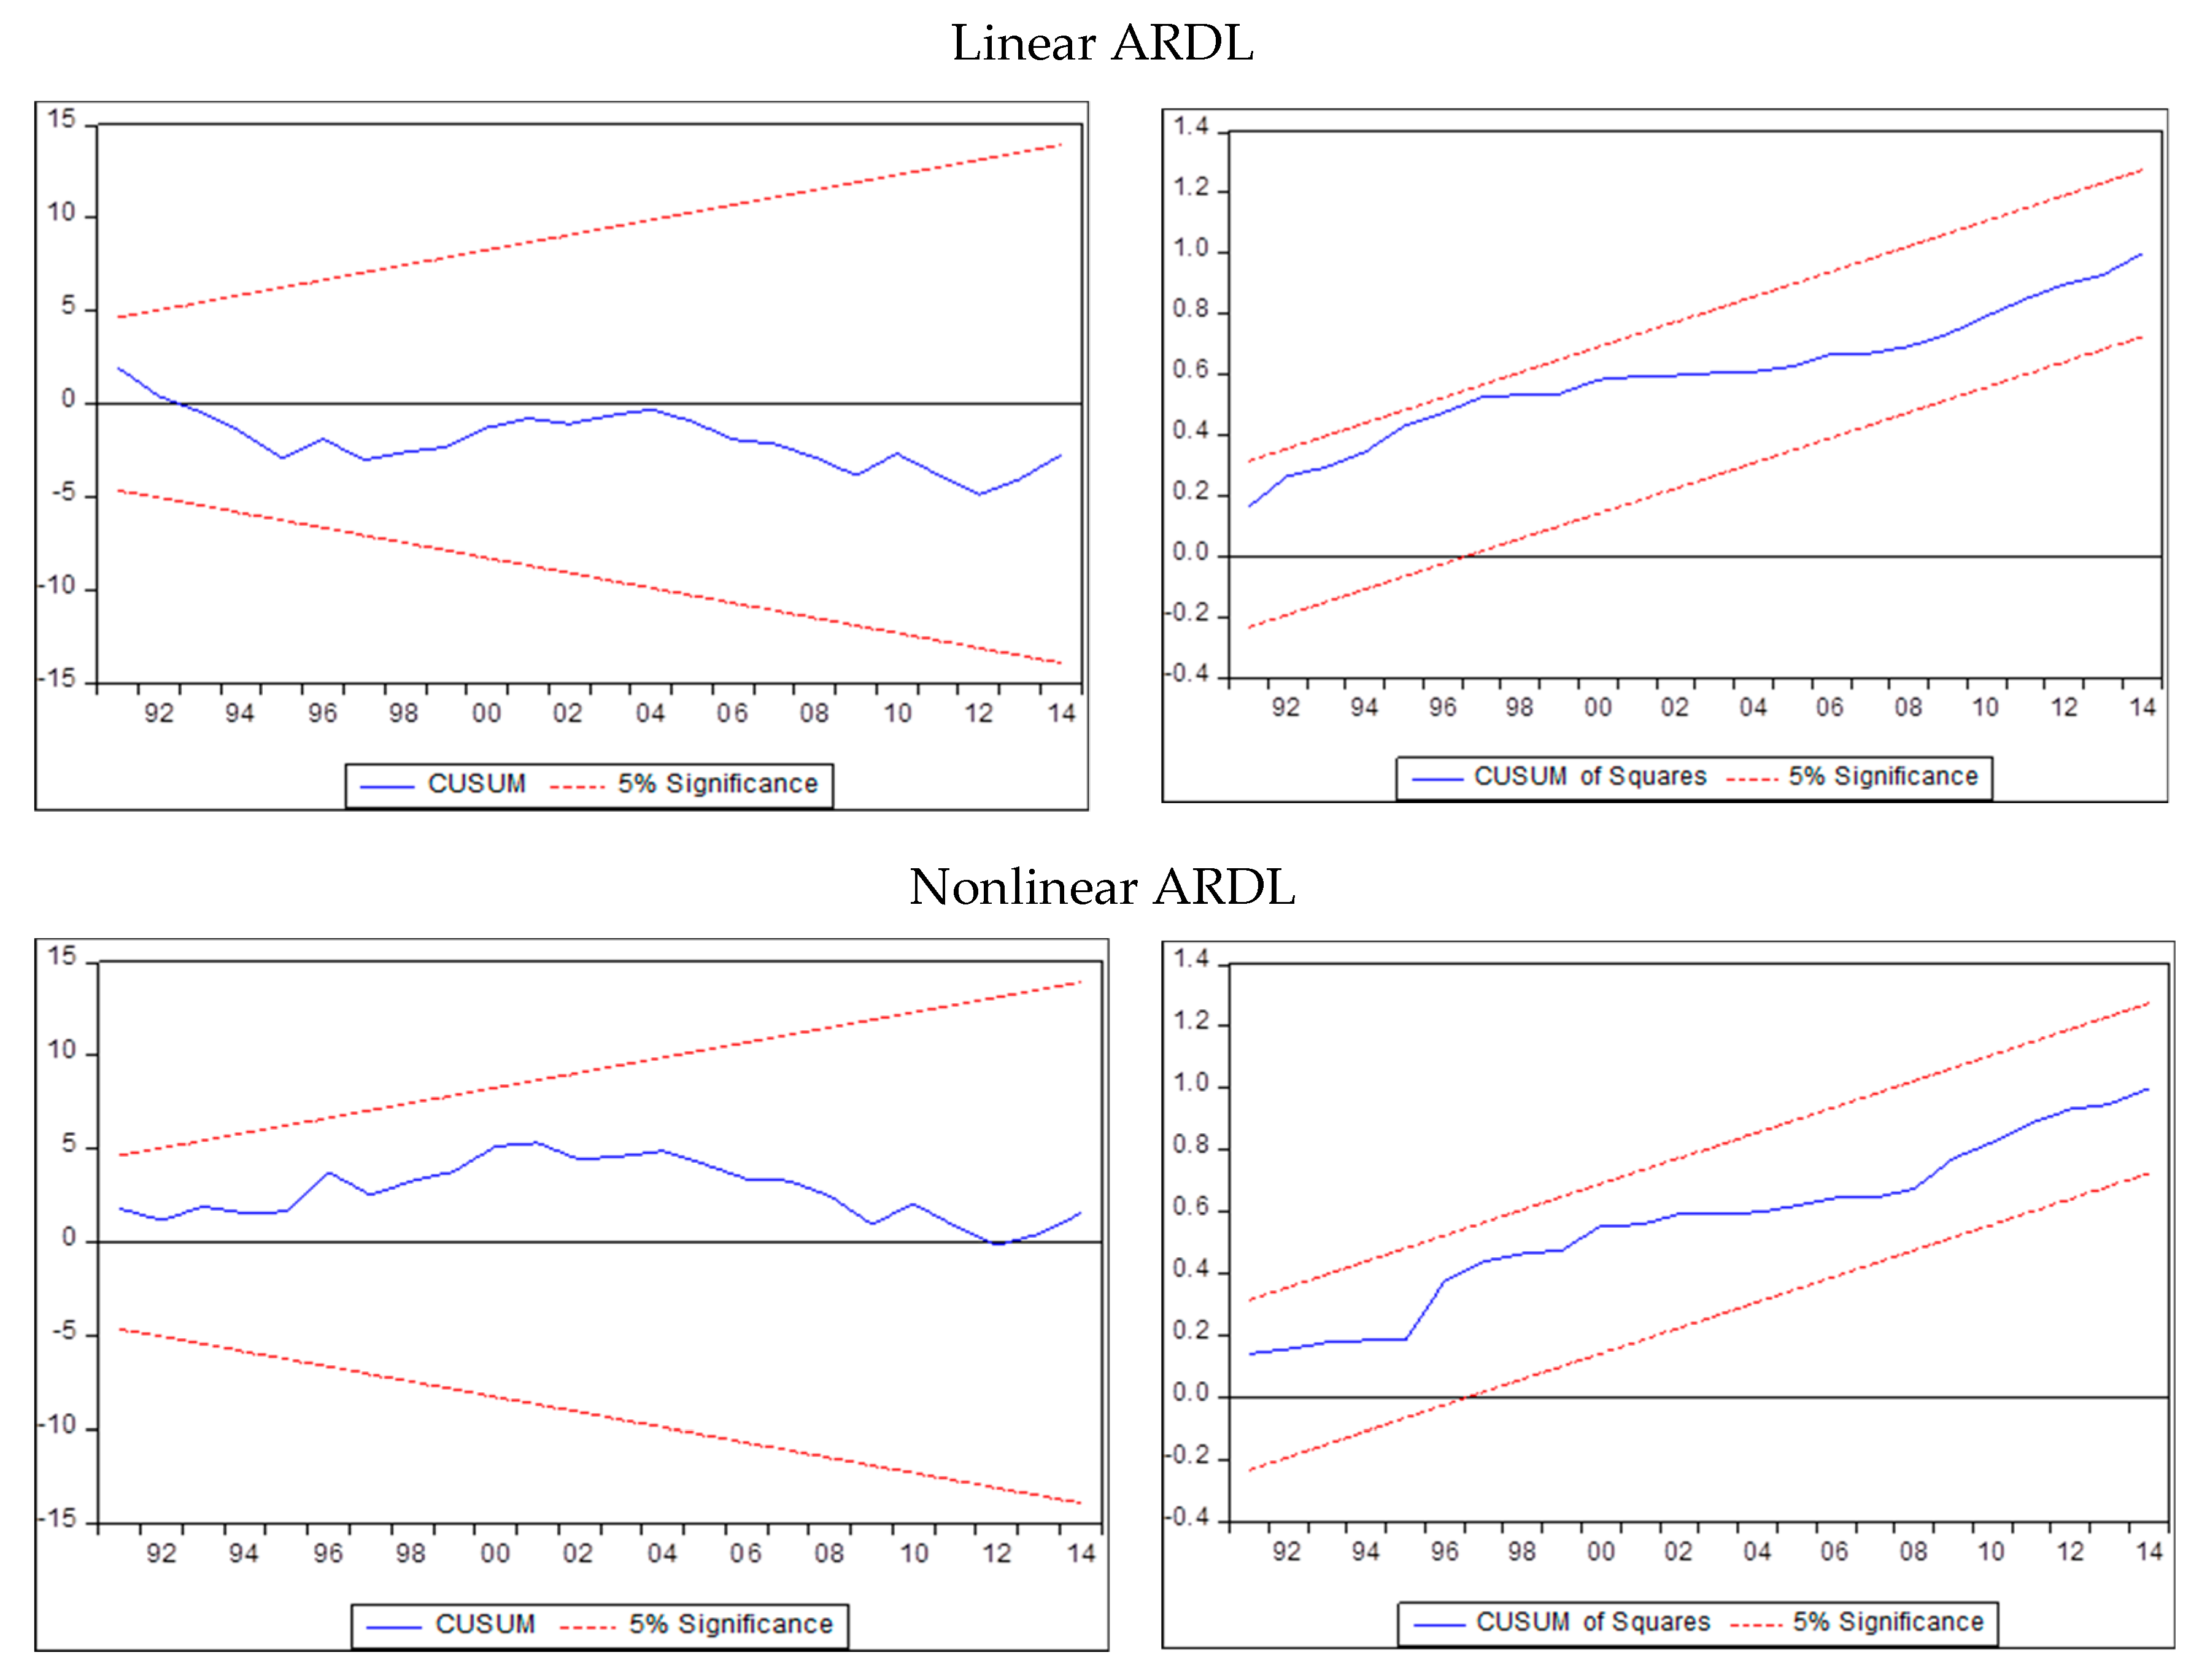
42] provide the efficient critical F-values for all sample sizes including a small sample size. Therefore, these F-values are efficient in our case. The Cumulative Sum (CUSUM) and CUSUM square (CUSUMsq) tests of parameters’ stability in
Figure 4 and diagnostic tests in
Table 3 confirm the robustness of both linear and non-linear ARDL estimates.
We found the positive coefficients of GDP
t and negative coefficients of GDP
t2 in the long-term estimates of both models. Hence, the EKC hypothesis was corroborated in the Tunisian case and this finding matches with the result of Shahbaz et al. [
13] but contradicts the findings of [
14,
15,
16]. Considering the superiority of the non-linear ARDL model, we estimate the turning point of this inverted U-shaped relationship at a GDP of approximately 292.335 billion constant US dollars which has not been achieved yet. Therefore, we claim that Tunisia is at the first stage of the inverted U-shaped relationship and increasing economic growth over the investigated period is harmful for the environment.
The results of trade openness show that TO
t has a positive effect on CO
2 emissions in the linear ARDL model. In the non-linear ARDL model, increasing trade openness (TOP
t) has a positive effect and decreasing trade openness has an insignificant effect. The elasticity of TOP
t confirms that a 1% increase in TOP
t increases CO
2 emissions by approximately 0.19%. The negative environmental effect of increasing trade openness suggests that increasing trade openness is promoting the dirty exporting industry with a high level of pollution. This evidence is also corroborated with the fact that 77% of Tunisian exports are of a manufacturing nature. On the other hand, increasing trade openness is also increasing the demand for emissions-oriented imports. Hence, a negative environmental effect of increasing trade openness has corroborated the existence of PHH in Tunisia. To verify the asymmetry, we applied the Wald test on the H
0 of the symmetrical effect of trade openness and this test rejected the H
0. Hence, the asymmetrical effects of increasing and decreasing trade openness are verified. Moreover, the asymmetrical effects of increasing and decreasing trade openness on CO
2 emissions can also be observed from
Figure 1 and
Figure 2.
Figure 1 and
Figure 2 show that increasing trade openness and increasing CO
2 emissions have co-movement in the same direction. Hence, these figures show a positive relation as per the findings of the nonlinear ARDL estimates. However, a relationship of decreasing trade openness and decreasing CO
2 emissions is not clear in
Figure 1 and
Figure 2. This unclear relationship is corroborated by the estimated insignificant coefficient of TON
t.
The short-term estimates are also reported in
Table 3. The negative coefficients of ECT
t−1 corroborate the short-term relationships in both models. These coefficients also show the speed of convergence from short-term disequilibrium to the long-term equilibrium in the approximately twelve and a half months in the linear ARDL model and in the approximately thirteen months in the nonlinear ARDL model. The positive (negative) coefficients of ΔGDP
t−1 (ΔGDP
t−12) confirm the existence of the EKC hypothesis with a one-year lag in both models. Trade openness has a positive and significant effect on CO
2 emissions in the linear ARDL model. In the nonlinear ARDL model, ΔTOP
t has a positive and significant effect on CO
2 emissions and the effect of ΔTON
t is found to be insignificant. The null hypothesis of the symmetrical effects of trade openness has been tested by the Wald test and asymmetry has also been proved in the short term.


