Article

Sustainability of Leverage Levels in Response to Shocks in Equity Prices: Islamic Finance as a Socially Responsible Investment

by
Hafezali Iqbal Hussain
1,
Janusz Grabara
2,*,
Mohd Shahril Ahmad Razimi
3 and
Saeed Pahlevan Sharif
1
1
Taylor’s Business School, Taylor’s University, 1 Jalan Taylors, Subang Jaya 47500, Selangor, Malaysia
2
The Management Faculty, Czestochowa University of Technology, 42-201 Czestochowa, Poland
3
Islamic Business School, Universiti Utara Malaysia, Sintok 06010, Kedah, Malaysia
*
Author to whom correspondence should be addressed.
Sustainability 2019, 11(12), 3260; https://doi.org/10.3390/su11123260
Submission received: 18 May 2019 / Revised: 3 June 2019 / Accepted: 4 June 2019 / Published: 13 June 2019
(This article belongs to the Special Issue Social and New Technology Challenges of Sustainable Business)

Abstract

:
This study looks at how firms react to shocks in equity prices based on a classification which arises from social pressures rather than the financial objective of maximizing shareholders’ wealth. In order to meet the objective of the study, a sample of Malaysian firms from the period of 2003 to 2018 was utilized to evaluate the relationship between market and book debt ratios based on a social distinction. The study is based on the theoretical expectation that managers are inclined to adjust book debt ratios to converge with market debt values which arise from changes in equity values over time. We introduce a unique institutional setting into the relationship which is readily observable in the Malaysian capital market given the existence of Shari’ah and non-Shari’ah compliant company classifications on the stock exchange (Bursa Malaysia), as screened by the Securities Commission. The classification forms the basis for distinguishing Socially Responsible Investment options for investors. The findings reveal the existence of asymmetries in how both categories of firms adjust towards shocks in equity prices. The findings document that both compliant and non-compliant firms decrease book debt ratios in line with increases in firms’ equity values. Compliant firms, on the other hand, are more likely to increase book debt ratios during periods of decreases in equity values. Non-compliant firms do not significantly alter book debt ratios during periods of declining equity prices. The findings indicate that whilst firms tend to decrease debt levels in the presence of future growth potential, the response is asymmetric during periods of suppression of share prices. Thus, the screening of compliant versus non-compliant firms allows investors to distinguish sustainable firms in the long run, which further allows diversification when holding socially responsible investment portfolios. Our conclusions have wide reaching implications on a global scale for the development of sustainable capital markets.

1. Introduction

The area of capital structure has received widespread attention in the literature of corporate finance. There has been some consensus in the literature that both measures of debt levels; namely the book and market leverage are inter-related, and thus, are of concern to managers [1]. However, given that equity values tend to change due to fluctuations in share prices and returns, there would be a gap between both measures. The literature documents that firms do not necessarily respond to shocks in equity prices by changing the book values of their debt as it would lead to an observable deviation during differing periods of rises and falls in share prices [2].
The current study proposes to offer a distinctive perspective on the relationship between market and book leverage ratios by examining the impact of Shari’ah compliance on the divergence between both values. The notion is based on the differing styles of the managers of both categories of firms, as well as the potential for differing preferences for debt policy [3].
The notion of Shari’ah compliance can be considered as a subset of socially responsible investments (SRI) [4] which have grown immensely in the post 2007/08 crisis, since which time investors have been taking into consideration non-financial aspects of their investment portfolios such as ethical and governance issues, environmental concerns as well as social impacts. These considerations are also part and parcel of the screening process of Shari’ah compliance [5]. Shari’ah screening methodologies go further to exclude firms which are highly levered, involved in businesses with elements of uncertainty as well as gambling [3]. The screening methodologies employed are in order to ensure the sustainability of investors’ portfolios which allows solid investments paired with the aim of minimising risks [6,7]. Thus, the current study provides a unique insight into financing behaviour based on the nature of compliance and classifications which arise from social pressures rather than pure financial objective of wealth maximisation. To evaluate specific responses brought about by the impact of changes in equity values, this study examines the differing conditions in market prices which lead to changes in book debt. The model of the study differentiates potential conditions which drive firms to balance the deviation between the two measures. Also, the study further documents the resulting changes and their impact on the speed of adjustment.
In order to analyse the adjustment of book debt to changes in equity prices, this study utilises a set of unbalanced panel data of Malaysian firms from the period of 2003 to 2018. The rationale for selecting Malaysian firms as the sample is based on the lack of studies examining target adjustment behaviour for book debt in response to changes in equity values for developing markets. Moreover, our empirical priors indicate that there remains contention in the capital structure policies of developing markets [8]. This study provides the opportunity to analyse the relative adjustment for a developing market where transaction costs are known to be high [8]. Furthermore, as of the end of 2018, more than 70% of the listed companies in Malaysia were classified as Shari’ah compliant (as defined by the Securities Commission of Malaysia), Malaysia provides a unique institutional setting for this study where book debt adjustments by compliant versus non-compliant firms can be compared. Also, Malaysian capital market remains one of the most advanced Shari’ah compliant markets in the world given that Malaysia is at the forefront of Islamic finance [9]. In addition, the literature documents that Shari’ah compliant firms are able to raise debt financing at cheaper costs given the captive markets observed in Malaysian capital markets [10,11]. Further contention can also be found in a recent study where the nature of compliance restricts firms’ ability to borrow, which in turn acts as an impediment to adjusting to target levels [12].
The results of the current study indicate both compliant and non-compliant firms adjust book debt ratios in response to changes in equity values. Increases in equity prices result in a lower market leverage ratio relative to book ratios. The results show that firms’ adjustment of book debt to market ratios to be at 10% on average so that non-compliant firms tend to adjust at more rapid rates (14%) relative to their counterparts (8%) indicating differences in dynamics of transaction costs for both set of firms.
In contrast, the results indicate that firms do not significantly adjust book leverage levels in response to reductions in equity prices which leads to drops in market leverage levels. The findings are consistent with the literature where firms reduce target leverage levels in-line with preserving debt capacity to fund future growth opportunities [13]. Further analysis reveals an interesting observation where such behaviour is prevalent amongst Shari’ah compliant firms, whilst non-compliant firms tend to adjust book leverage levels in line with declining equity values.
Our asymmetric findings confirm that the results are not spurious or arising from mechanical mean reversion in methodological limitations, as suggested in the literature [14]. Also, as an additional measure of robustness, we implement random simulation tests to validate the findings and show that the results are not spurious [15,16].
To further understand the approach utilised by compliant versus non-compliant firms in order to reduce the deviation from book to market leverage levels, we evaluate financing choices based on the segregation proposed by Chang and Dasgupta (2009) [17]. The sample firms are classified based on the relative extent of deviation and then subsequent security issues are evaluated. Our findings indicate that both categories of firms tend to opt for equity issues if book values are higher than market values. However, compliant firms are less likely to retire debt in such situations. On the other hand, when market leverage is greater than book leverage, compliant firms are more likely to make significant changes to book debt ratio. Both categories of firms are equally likely to reduce reliance on equities during these periods.
This study makes several contributions to the literature which have important implications. Our findings suggest that firms in a developing market such as Malaysia tend to adjust book leverage ratios in response to increases in equity values. The effect is more profound for non-compliant firms than compliant firms. Thus, increases in market valuations tend to flow to book values to a greater extent in non-compliant firms relative to their compliant counterparts. Decreases in equity prices induce in a similar response for compliant firms but less likely for non-compliant firms. The findings indicate differing managerial views on leverage policies for both categories of firms, and thus support the findings iterated by Naz et al. 2017 [7]. In addition, compliant firms’ motives for debt issues and the respective market interpretation are different relative to their non-compliant counterparts suggesting that these firms tend to be more sustainable i.e., less susceptible to fluctuations in equity markets [18]. Thus, such firms are in-line with the objectives of SRI funds [19] and provide opportunities for diversification for fund managers and investors guided by SRI principles [20,21]. The asymmetric response observed partially supports the findings of past studies in developed markets [2]. However, the nature of compliance tends to moderate the responses by managers. The findings further indicate that both measures are partially interdependent.
The rest of the paper is organised in the following manner. Section 2 provides a discussion on the literature linking changes in market values to equity and its implication on changes in book debt ratios. Moreover, this section discusses the distinction of Shari’ah compliance and non-compliance and its commonalities with SRI classifications. Furthermore, the screening based on the criteria set by the Securities Commission of Malaysia and its implications on financing decisions are discussed. Section 3 describes the methodology applied, data and sample selection process. Section 4 reports the results of the analysis which captures how firms respond to changes in equity prices via adjustments in book ratios. The analysis is also further subjected to a set of randomised tests to validate the findings as a measure of robustness. Results from this section are also subjected to additional tests to account for shocks in the economy as well as to account for firm cyclicality in order to test validity of the findings. Finally, Section 5 concludes the study with a discussion of the main contributions and implications, which improves our understanding of dynamic financing choices in responses to shocks in equity prices as well as the sustainability of debt financing across firms in a developing capital market.

2. Literature Review

The literature on studies examining capital structure of firms stems from the irrelevance hypothesis [22]. The hypothesis which was stated based on the perfect capital market assumptions asserts that firm value has no impact on financing decisions. Relaxing the assumption of the absence of corporate taxes, tax deductibility of interest payments increases firm value and thus creates an incentive to maximum debt financing [23]. Relaxation of further assumptions which accounts for personal taxes, bankruptcy costs and other market imperfections provides a disincentive for firms resorting to debt financing [24]. The benefits versus costs of debt would ultimately lead to firms opting for an optimal level of debt which is the central notion behind the trade-off theory of capital structure [25].
The trade-off theory predicts that firms would balance the potential benefits of debt arising from tax savings as discussed above as well as the use of debt to act as a disciplining tool in order to reach optimal financial leverage. The optimal point is reached when the marginal benefits of further increases in debt equals its marginal costs. The main purpose of the current study is to evaluate the managerial responses to changes in equity prices in balancing the benefits and costs of debt financing. This provides the rationale for evaluating the changes brought about by managerial financing decisions and its implications on the sustainability of the firms, given that debt financing introduces elements of risk into the firm.

2.1. Impact of Changes in Equity Prices on Leverage Levels

There are two main measures utilized to evaluate firms’ use of debt. The first is known as book debt, and is often defined as total debt divided by book value of assets. The second measure, market leverage, is often of interest to practitioners and is measured as debt scaled by market value of assets. Both measures have been extensively used in the literature to assess the impact of leverage on firm values (see Parsons and Titman (2009) [26] for a more extensive review). The literature has documented that although both measures tend to have high degrees of correlation, changes in equity prices would lead to divergence across these two measures [27]. This has attracted researchers’ attention to managers’ responses to shocks in equity prices despite the interdependence of the two measures.
The first view iterated by Welch (2004) [2] argues that managers tend to ignore changes in equity prices and thus would not alter leverage levels as a response. As a result, shocks in equity prices would result in a divergence between book and market measures of leverage. Thus, market measures of capital structure tend to vary in-line with fluctuations in stock prices. Indeed, the deviation between both measures is derived from the notion that firm value can be estimated from the combination of the value of assets that are already owned by the firm as well as discounting value of growth opportunities arising from ownership of these assets [28]. Therefore, the present value of benefits arising from ownership of these assets are based on the options arising from the ownership of these assets which allows firms to make future investments.
The second view is based on the model proposed by Myers (1997) [28] in which assets already owned are based on the book value figures reported on balance sheets, whilst the present value of benefits is proxied by market value of assets, which captures the potential for future investment options. Ferris et al. (2018) [27] found that shocks in equity prices do indeed induce managers to alter book value of debt. Thus, the potential changes in the value of the future investment options can be estimated based on the changes in equity prices. An increase in the future investment options would increase equities which in turn suppress market leverage measures given that debt is scaled by the market value of assets which captures the corresponding increases and vice versa. This would inadvertently drive firms to reduce the amount of debt in subsequent periods to support their future growth options.

2.2. Islamic Finance and Socially Responsible Investment

Shari’ah compliant firms are companies that integrate Islamic values and their core activities are expected to be in compliance with Shari’ah principles. This contrasts the financial objective of maximizing risk adjusted returns based on the traditional view of investing strategy. However, the notion of compliance is in line with SRI where investors tend to focus on ethical considerations as well as promoting the agenda of social-welfare [29,30]. These firms appeal to investors who in addition to seeking satisfactory returns, would like to consider social returns in terms of the benefits arising from their investments to society and parallel to their beliefs. Investors’ demand has fueled the rapid growth in the number of firms classified as compliant and, in the meantime, has led institutional players to devote more funds for these products which in turn has increased institutional funds demand for such securities.
The overwhelming focal point of Islamic finance has been mainly on equities similar to SRIs. The focus of Islamic equity is derived from the prohibition of obtaining financing from interest bearing instruments and based on the principle of equitable risk sharing. Both SRI and compliance with Shari’ah principles (foundations of screening methods in Islamic finance) require screening which prohibits involvement in certain activities deemed as immoral such as gambling, speculation, weapons production, alcohol, pornography and tobacco industries [20,31]. Indeed, both approaches are based on considering the social and ethical benefits that the firm delivers to the community [4]. In such investments, investors can incorporate their moral standards in their portfolios which provides an additional market force acting as a disciplining tool to manage corporate behavior [32]. This is exhibited where firms with excessive leverage and risk-taking behavior are excluded from both screening approaches [33]. Further evidence on the potential convergence between Islamic finance and SRI investments is based on the similar guiding principle of corporate social responsibility which allows harmonization of corporate objectives with the aim of achieving sustainable outcomes for all stakeholders from the social, economic and environmental perspective in the medium and long-term [34].
Equities listed on Bursa Malaysia are screened for compliance to a set of principles based on the demand by domestic as well as international investors. This is evidenced by the fact that about 70% of the listed companies were classified as compliant by the end of 2016 [33]. In addition, foreign ownership of Malaysian equities ranges about 20% to 40% [35]. Empirical findings in the literature have further documented that Shari’ah compliant equities in comparison with their conventional counterparts while match their returns during non-crisis periods, they tend to outperform them during crisis periods [6]. Thus, the nature of equities market in Malaysia which remains at the forefront of Islamic finance on a global scale draws parallels to the conclusion that such social demands arising from socially responsible investing provides an additional disciplining tool for managing corporate behavior and free-market forces.

3. Methodology

The main objective of the current study is to evaluate the link between market and book leverage ratios for compliant and non-compliant firms. This is accomplished by examining whether firms alter their book leverage levels in line with the changes in market leverage. Thus, the deviation of these two ratios are affected by changes in the market value of a firm’s equity. Changes in equity values lead to immediate changes in market ratios whilst book ratios are expected to change gradually via the issuance of new securities.
In order to estimate the difference between the market and book leverage ratios and the speed of the adjustment for firms, the current study adopts a single stage model. The approach is based on the reformulation of the partial adjustment model which is intended to measure the rate at which managers change book values of leverage in-line with market prices of equity which determines firm value [27]. Based on the reformulation of the partial adjustment model proposed, the difference between the market and book ratios is modelled as follows [27]:
B L i t B L i t 1 = α ( M L i t 1 B L i t 1 ) + γ X i t 1 + ε i t
where B L i t B L i t 1 measures the change in book leverage in year t to t−1 for firm i, whilst M L i t 1 B L i t 1 captures the deviation of market measures relative to book measures at year t−1 for firm i, as a consequence of changes in equity values. α is the coefficient of interest which measures the speed of adjustment for firms after taking into account changes in market valuation of equities. γ is a vector of control variables identified in Table 1 below. The approach allows us to counter the potential for mechanical mean reversion as well as potential bias in overestimating the speed of adjustment as highlighted in the literature [14]. The model is further expanded to control for shocks to the economy where GDP growth is negative (shocks) and cyclical firms (cyclical) and is expressed as follows:
B L i t B L i t 1 = α ( M L i t 1 B L i t 1 ) + α s h o c k s ( M L i t 1 B L i t 1 ) s h o c k s D + γ X i t 1 + α c y c l i c a l ( M L i t 1 B L i t 1 ) c y c l i c a l D + ε i t
Cyclical firms are classified based on the top 30th percentile of earnings volatility as it is a common measure of firms’ pro-cyclicality behavior evidenced in the literature [36]. Given that the objective of this study is to estimate the difference in response to changes in market leverage ratios, the study examines the adjustment behavior depending on whether the difference between market and book ratios are positive or negative. Thus, the difference is calculated for each firm. A negative difference would indicate that market value of the firms is higher than its book value (i.e., market leverage is lower than book leverage). Divergently, firms with a market value lower than book value would have a positive difference. In order to account for these differences, the base model from Equation (1) is thus modified as follows:
B L i t B L i t 1 = α ( M L i t 1 B L i t 1 ) + α n e g a t i v e   ( M L i t 1 B L i t 1 ) n e g a t i v e   D + γ X i t 1 + ε i t
where n e g a t i v e D is a dummy that captures the contrasting negative difference when market leverage is lower than book leverage. The dummy is measured at time t−1. In order to address the potential for endogeneity issues, our estimations utilise a 2-step system GMM dynamic model [37].

Sample Selection and Definition of Variables

The selection of the sample for this study includes all firms available in the Datastream Thomson Reuters database for the period of 2003 to 2018. The pre-2003 period is excluded as the list of compliant companies compiled by the Securities Commission of Malaysia is only available since 2003. The current study utilizes unbalanced panel data to maximize number of observations and generalization of the results [38]. Moreover, using dynamic panel data methods this study only includes firms that are listed for a minimum of 3 years continuously. Also, financial firms due to their unique capital requirements are excluded from the sample [39]. Furthermore, firm-years with missing variables are dropped from the analysis. The final sample comprises of 863 firms with a total of 10,408 firm-year observations. The selection and definition of regressors as control variables is further guided by the literature. Definition of variables are reported in Table 1.
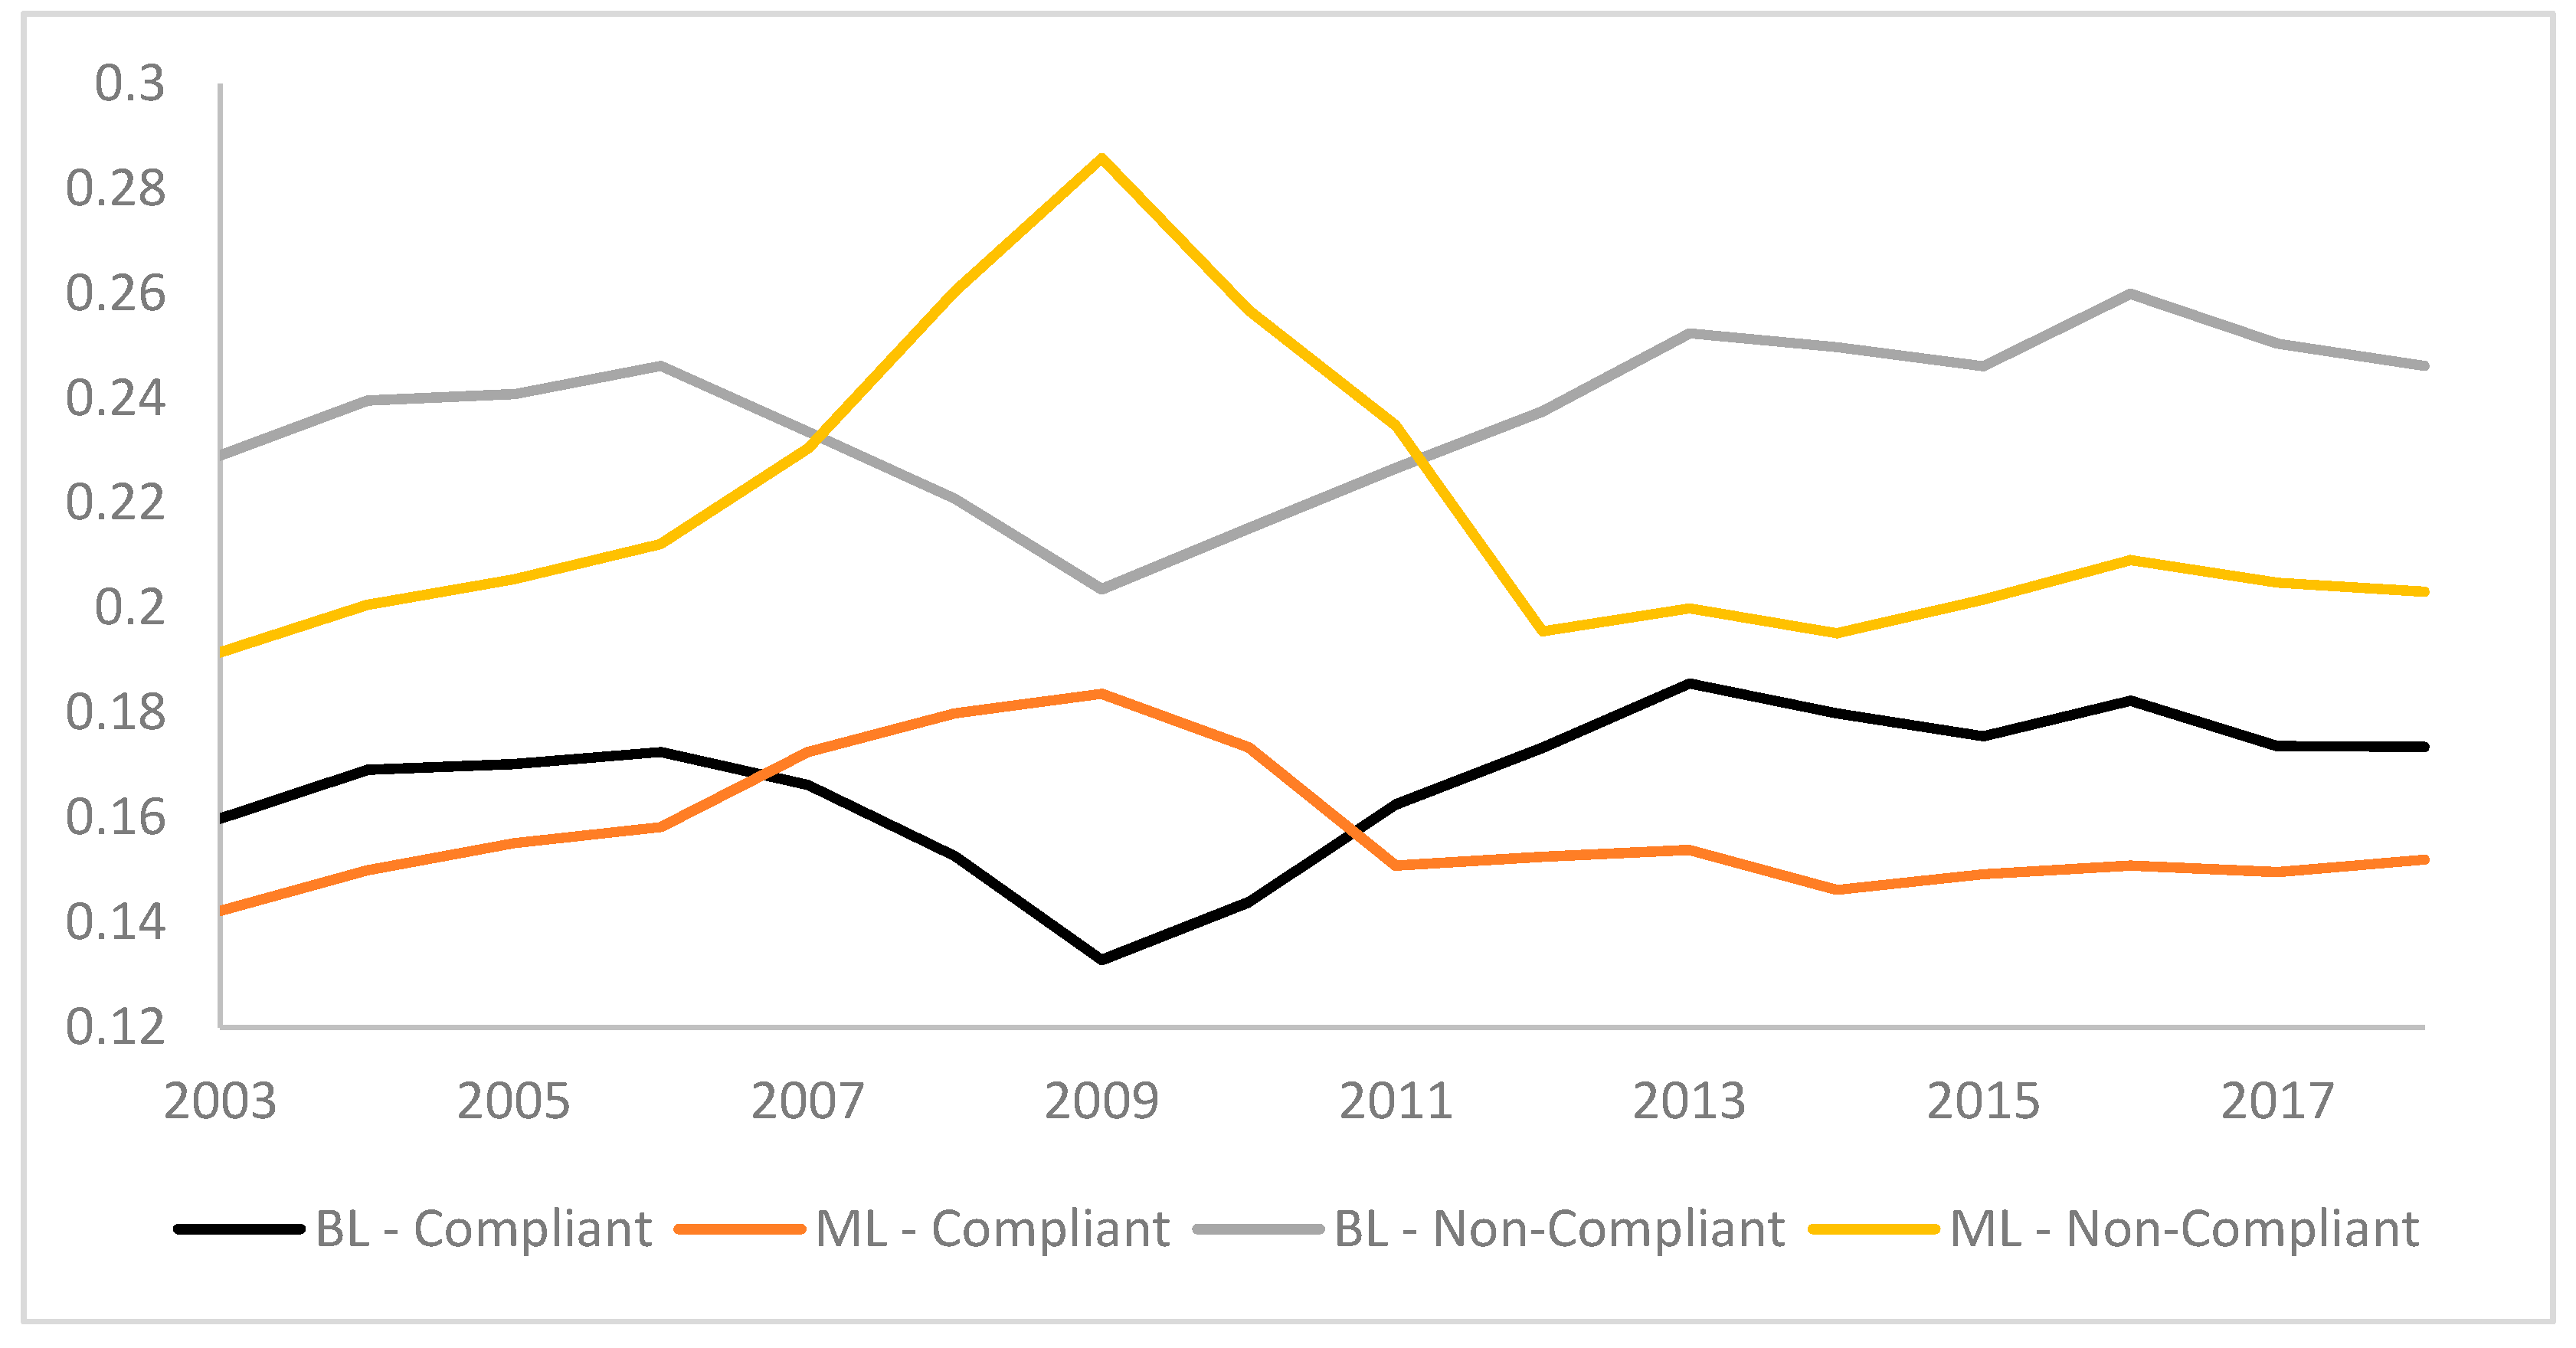
Table 2 shows the descriptive statistics of the sample. The results show that compliant firms tend to hold lower levels of debt relative to their non-compliant counterparts based on both measures. This could be attributed to the limitation placed on borrowing from conventional sources of financing [34]. A similar situation is observed in the industry figures. Compliant firms tend to be less profitable which could plausibly be attributed to the restriction on certain business activities which are deemed immoral such as weapons and defense sectors, gambling, as well as non-halal and alcohol related activities. These firms also show to have higher levels of tangible assets yet are relatively smaller which provides an indication on the requirement to have ‘underlying assets’ for financial transactions as promoted by compliance requirements [40].

4. Empirical Results and Discussion

4.1. Trend Analysis and Panel Causality Test

The initial analysis in this study is based on the patterns recorded for book and market leverage of compliant and non-compliant firms. The trends are shown in Figure 1 which plots the mean values for the sample period between 2003 and 2018. Consistent with the findings in developed markets, it is observed that both measures of leverage move in contrasts during periods of share price suppression i.e., recession and somewhat in tandem during other periods [41].
In order to further analyses the difference between both measures, trends for mean and median difference between both measures are shown in Figure 2. The co-movement is more evident when measuring the difference. The plots indicate that market leverage ratios are only greater than book ratios during the period of recession given the decline in equity prices which mirrors findings in the literature [27]. The mean (as well as the median) difference is more evident for non-Shari’ah compliant firms, which tends to indicate these categories of firms tend to face greater levels of volatility in market valuations. Moreover, during the other periods compliant firms tend to have a smaller difference indicating that market ratios tend to be closer to book ratios. Furthermore, the median difference for compliant companies tend to be closer to zero than their non-compliant counterparts.
As the objective of the study is to estimate the adjustment of book leverage in response to the changes in market leverage, we first conduct a heterogenous panel causality test to detect presence of endogeneity [42]. The results reported in Table 3 confirm the presence of reverse causality, thus confirming the need for GMM estimator to resolve endogeneity concerns.

4.2. Partial Adjustment of Leverage in Response to Shocks in Equity Prices

The main empirical results are reported in Table 4. All regressions control for the correlation between fixed effects and the lagged dependent variable [43]. The significance levels are based on the correction for finite sample bias [44].
Column 1 reports the results from Equation (1) which measures the degree of change in book leverage due to the changes in market leverage for all firms. The coefficient is expected to be significant if firms do indeed adjust book leverage ratios to reflect changes in market values. The speed of adjustment is estimated to be about 10% per year, indicating that current differences arise due to the firms’ adjustments to book leverage ratios in the subsequent year. Columns 2 and 3 report the results for compliant and non-compliant firms. The rate of the adjustment tends to be statistically different for both categories of firms as evidenced by the z-stat, measuring the difference for the coefficient [45,46]. We find that non-compliant firms tend to adjust at faster rates, indicating that managers of these firms tend to be more concerned with changing values of equity. A plausible explanation could be that compliant firms tend to have debt which is asset backed, hence, reducing the need to adjust book levels immediately to match market values [9]. This does point towards a more sustainable source of financing which reduces volatility levels.
The results reported in columns 1 to 3 are based on a joint hypothesis where it is assumed that the model correctly measures the speed of the adjustment as well as classification of the firms into compliant and non-compliant status. Thus, the results have the tendency to be spurious [17]. In order to provide robustness to the findings as well as reject the alternative hypothesis, a random simulation of classification of firms into compliant and non-compliant status is conducted. The average coefficients and p-values of a coin-toss simulation with 500 replications are reported in columns 5 and 6 [15,16]. The results indicate that the adjustment rate does not differ significantly when selection for compliance is randomised. Therefore, the findings in columns 2 and 3 are not spurious.
The model is further expanded to account for potential shocks in the economy. The results are shown in Table 5. Columns 1 to 3 of panel A report the results for regressing the model in Equation (2) with a dummy variable for years with negative growth included as defined by the World Bank (https://data.worldbank.org/indicator/NY.GDP.MKTP.KD.ZG?locations=MY). Coincidently, there is only one year where negative growth is recorded (i.e., in 2009).
The results indicate that the adjustment rate is reduced by 8.64% for all firms. Non-compliant firms record a reduction of 10.91% whilst compliant firms record a smaller reduction of 4.26%. The 6 points difference is economically as well as statistically significant at 1% as indicated by the Z-stat in Panel A. This validates our notion of compliant firms as opting for sustainable sources of debt financing (backed by real assets) where the reduction recorded is lower indicating that temporary shocks in the economy would not cause managers to reduce the extent of borrowing as a precautionary measure to prevent and manage financial distress. The results further point towards lower levels of financial distress costs for compliant firms which supports the notion of compliant firms’ borrowing from sustainable sources of financing. The findings are in-line with the literature indicating that compliant firms tend to be more sustainable financially [47].
In addition, columns 1 to 3 of Panel B, provide the results when the cyclical dummy is activated. Initial results in column 1 confirm the findings in Ferris et al. (2018) [27] where cyclical firms tend to have a greater reduction in the rate of adjustment. The authors argue that during shocks, equity values of such firms tend to reduce drastically and thus consequently leads to a mechanical increase in their market leverage ratios. It can be argued that these firms would tend to have greater earning levels during boom periods but be more vulnerable during shocks in the economy. Therefore, such firms tend to reduce book leverage ratios in order to reduce the potential for financial distress. Columns 2 and 3 provide an interesting observation, i.e., that non-compliant firms tend to record a greater level of reduction relative to their compliant counterparts. The findings also suggest that compliant firms tend to be more sustainable in nature, as these firms tend to have a higher degree of earnings quality [48], and hence, are less susceptible to shocks in equity values, as evidenced by significantly lower levels of reduction in book leverage ratios. Thus, non-compliant firms are more focused on redeeming debt instruments to lower the book debt ratio. Columns 1 to 3 of Panel C report the fully extended model. The results do not differ qualitatively from the limited models.
Changes in book leverage can further be attributed to perception of investors on the value and corresponding riskiness of a firm. An increase in valuation of a firm’s equity would automatically lead to a mechanical decrease in the market leverage ratio. Thus, the current study aims to evaluate the corresponding reaction by firms based on the nature of compliance. The examination in this study is segregated by whether the market leverage is greater than the book leverage ratio (denoted as positive) or vice versa (i.e., hence denoted as negative). The results for regressing Equation (3) are reported in Table 6.
The first three columns capture the effect when the difference is negative. Similar to Ferris et al. (2018) [27], a significant asymmetric response is recorded for both types of difference (positive versus negative). Overall, the adjustment rate is about 24%. Shocks in the economy and firm cyclicality dampens the adjustment observed. Second and third columns indicate that non-compliant firms tend to adjust at more rapid rates relative to their compliant firms. Consistent with the expectations from the earlier results, the dampening effect is reduced for compliant firms and strengthened for non-compliant firms. This indicates that the book leverage ratios of compliant firms tend to record slower levels of adjustment comparatively to their non-compliant counterparts as a result of changes in market valuations. Therefore, whilst the asymmetric response mirrors the findings in developed markets, compliant firms tend to exhibit lower levels of asymmetry suggesting a more sustainable level of debt. This is in-line with the requirement of debt to be backed by underlying assets for compliant firms and thus is less likely to be influenced by fluctuations in market valuations of firms [49].
The asymmetric response could, in theory, be influenced by the deviation from target leverage levels [2]. Firms which are above (below) their target levels would be more inclined to reduce (increase) book debt ratios when market leverage ratios reduce (increase) and vice versa. This notion is examined and reported in columns 4 to 6 in Table 6. Following Ferris et al. (2018) [27] we segregate firms which are over-levered and under-levered based on the industry median average. However, the results are only reported for over-levered firms as being below target levels would only strengthen the findings rather than intuitively work against them. The results for under-levered firms are available upon request. Columns 4 to 6 report the figures for over-levered firms. The findings provide a similar pattern of asymmetry so that firms tend to adjust at more rapid rates when their market leverage ratio is lower than book ratios. Analysing the nature of compliance further validates our findings above. The results concur the findings from columns 1 to 3. Thus, the results across columns 1 to 6 confirm our findings, i.e., that compliant firms are less inclined to increase book leverage in reaction to shocks in equity prices, despite changes in investors’ perception or cost of deviating from target levels.

4.3. Deliberate versus Random Financing Choices

The literature provides criticism of partial adjustment models for judging financing behavior, given that it is unable to distinguish between deliberate financing choices versus random financing decisions by managers [17]. To provide robustness to our analysis where compliant firms are seen as more resorting to sustainable sources of financing in order to meet the social pressures from the investors, the study further analyses the financing choices when firms’ book leverage ratios exceed that of the market leverage ratio (at period t−1). Under these circumstances, we expect firms to reduce book leverage through three possible options: (1) reducing net debt (negative net debt issued), (2) increasing reliance on equity via net equity issuance or (3) a combination of both. The opposite is expected when firms’ book leverage ratios exceed market leverage ratios. In line with Ferris et al. (2018) [27], we estimate the adjustment between both ratios by excluding firms where ratios are within 2.5%, 5% and 10% of each other. The results are reported in Table 7.
Based on the results presented in Panel A of Table 7, after excluding the 2.5% band, it is observed that non-compliant firms are more likely to reduce net debt issuance, whereas compliant firms are equally likely to increase net equity issuance. Similar results were obtained using differing bands of 5% and 10% as the exclusion criteria. The analysis further confirms the sustainable financing sources by compliant firms indicating a lower degree of fluctuation in book debt ratios in response to changes in market valuations. A plausible explanation would be managers of compliant firms are more likely to capture the benefit of increasing share prices in order to provide additional wealth to current shareholders. For firms where market leverage exceeds book leverage, firms are expected to (1) increase debt issues, (2) reduce reliance on equity financing or (3) a combination of both. The results are reported in Panel B of Table 7. Interestingly, compliant firms are more likely to issue debt, reduce reliance on equity financing, or a combination of both. The results paint a similar picture of sustainable financing choices where compliant firms are able to reduce the difference and adjust at more rapid rates. Thus, it is likely that these firms are opting for more sustainable sources of financing given the social pressure from investors to avoid interest-based borrowing (usury) which appears to be more sustainable. This can be attributed to the nature of the compliant sources of borrowing that tend to be more stable due to the requirement for ‘real asset’ backing [50,51]. The results are similar across the board based on the 5% as well as 10% exclusion criteria.

5. Conclusions and Implications

The current study utilizes a sample of Malaysian firms from the period of 2003 to 2018 to evaluate whether firms’ adjustment of book leverage ratios in response to shocks in equity prices which leads to changes in market leverage based on the distinction of compliance to a set of rules defined as ‘Shari’ah Compliant’ by the Securities Commission of Malaysia. The nature of compliance is derived from societal pressures of providing a means for channeling savings into a more productive use in Malaysian capital market given the rising income levels, as well as high levels of savings. Moreover, institutional players (domestic and foreign) have an appetite for investment in Shari’ah compliant equities, as evidenced by the literature [35]. Compliance to Shari’ah requirements tends to require firms to resort to more sustainable levels of financing, hence leading to differing responses to changes in share prices.
The empirical results show that adjustments in book leverage ratios are asymmetric for compliant to non-compliant firms. It is evident from the results that non-compliant firms tend to reduce book leverage ratios. This is because market leverage ratios are reduced due to increases in share prices. Non-compliant firms are also more exposed to shocks in the economy, as well as the potential for financial distress. Furthermore, our results point towards compliant firms having a higher degree of earnings quality. The bulk of reduction for non-compliant firms tend to be via the redemption of debt whereas compliant firms tend to issue equity during increases in share prices despite their limited adjustment which increases wealth for existing shareholders. This further validates the notion of compliant firms resorting to sustainable sources of financing.
During periods of depreciation in share valuations, market leverages mechanically increase, which would trigger managers to increase book leverage ratios. Compliant firms make some adjustments to increase book leverage ratios whilst non-compliant firms do not adjust during periods of decreasing share prices. Similar to the above findings, the observations point towards a more sustainable source of financing where debt levels for compliant firms tend to be less influenced by changes in equity prices. The nature of compliance requires firms to issue debt which is backed by real-assets rather than issuing debt based on changes in market valuations. The notion is robust to firms’ adjustments to target leverage levels.
The findings have important implications and provide an alternative explanation for capital structure decisions which is influenced by societal pressures rather than purely by the shareholders’ wealth maximization objective. Share price movements tend to influence non-compliant firms and have a limited influence on the book leverage ratio of compliant firms. Thus, our findings provide further insight as well as an alternative explanation which indicates that whilst the results of our empirical priors challenge the notion of leverage adjustment behavior being explained purely by movements in equity prices, our study tends to provide an explanation that includes aspects often ignored in past studies of capital markets. Therefore, our arguments point towards managers reacting with differing managerial styles depending on the investors’ expectations, as well as society, when it is institutionalized via a set of filters instituted by regulatory bodies.

Author Contributions

All authors contributed equally.

Funding

This research received no external funding.

Conflicts of Interest

The authors declare no conflict of interest.

References

  1. DeAngelo, H.; Roll, R. How stable are corporate capital structures? J. Financ. 2015, 70, 373–418. [Google Scholar] [CrossRef]
  2. Welch, I. Capital structure and stock returns. J. Political Econ. 2004, 112, 106132. [Google Scholar] [CrossRef]
  3. Naz, I.; Shah, S.M.A.; Kutan, A.M. Do managers of sharia-compliant firms have distinctive financial styles? J. Int. Financ. Mark. Inst. Money 2017, 46, 174–187. [Google Scholar] [CrossRef]
  4. Charfeddine, L.; Najah, A.; Teulon, F. Socially responsible investing and Islamic funds: New perspectives for portfolio allocation. Res. Int. Bus. Financ. 2016, 36, 351–361. [Google Scholar] [CrossRef]
  5. Hussein, K.; Omran, M. Ethical investment revisited: Evidence from Dow Jones Islamic indexes. J. Invest. 2005, 14, 105–126. [Google Scholar] [CrossRef]
  6. Ho, C.S.F.; Rahman, N.A.A.; Yusuf, N.H.M.; Zamzamin, Z. Performance of global Islamic versus conventional share indices: International evidence. Pac.-Basin Financ. J. 2014, 28, 110–121. [Google Scholar] [CrossRef]
  7. Abdullah, F.; Hassan, T.; Mohamad, S. Investigation of performance of Malaysian Islamic unit trust funds: Comparison with conventional unit trust funds. Manag. Financ. 2007, 33, 142–153. [Google Scholar] [CrossRef]
  8. Haron, R. Capital structure inconclusiveness: Evidence from Malaysia, Thailand and Singapore. Int. J. Manag. Financ. 2014, 10, 23–38. [Google Scholar] [CrossRef]
  9. Wilson, R. Innovation in the structuring of Islamic sukuk securities. Humanomics 2008, 24, 170–181. [Google Scholar] [CrossRef]
  10. Godlewski, C.J.; Turk-Ariss, R.; Weill, L. Sukuk vs. conventional bonds: A stock market perspective. J. Comp. Econ. 2013, 41, 745–761. [Google Scholar] [CrossRef]
  11. Sherif, M.; Erkol, C.T. Sukuk and conventional bonds: Shareholder wealth perspective. J. Islamic Account. Bus. Res. 2017, 8, 347–374. [Google Scholar] [CrossRef]
  12. Alnori, F.; Alqahtani, F. Capital structure and speed of adjustment in non-financial firms: Does sharia compliance matter? Evidence from Saudi Arabia. Emerg. Mark. Rev. 2019, 39, 50–67. [Google Scholar] [CrossRef]
  13. Barclay, M.J.; Morellec, E.; Smith, C.W. On the Debt Capacity of Growth Options. J. Bus. 2006, 79, 37–59. [Google Scholar] [CrossRef]
  14. Chen, L.; Zhao, X. Mechanical mean reversion of leverage ratios. Econ. Lett. 2007, 95, 223–229. [Google Scholar] [CrossRef]
  15. Morris, T.P.; White, I.R.; Crowther, M.J. Using simulation studies to evaluate statistical methods. Stat. Med. 2019, 38, 2074–2102. [Google Scholar] [CrossRef] [PubMed] [Green Version]
  16. Heß, S. Randomization inference with Stata: A guide and software. Stata J. 2017, 17, 630–651. [Google Scholar] [CrossRef]
  17. Chang, X.; Dasgupta, S. Target behavior and financing: How conclusive is the evidence? J. Financ. 2009, 64, 1767–1796. [Google Scholar] [CrossRef]
  18. Alam, N.; Hassan, M.K.; Haque, M.A. Are Islamic bonds different from conventional bonds? International evidence from capital market tests. Borsa Istanb. Rev. 2013, 13, 22–29. [Google Scholar] [CrossRef] [Green Version]
  19. Bello, Z.Y. Socially responsible investing and portfolio diversification. J. Financ. Res. 2005, 28, 41–57. [Google Scholar] [CrossRef]
  20. Wilson, R. Islamic finance and ethical investment. Int. J. Soc. Econ. 1997, 24, 1325–1342. [Google Scholar] [CrossRef]
  21. Hassan, M.K.; Khan, A.N.F.; Ngow, T. Is faith-based investing rewarding? The case for Malaysian Islamic unit trust funds. J. Islamic Account. Bus. Res. 2010, 1, 148–171. [Google Scholar] [CrossRef]
  22. Modigliani, F.; Miller, M.H. The cost of capital, corporation finance and the theory of investment. Am. Econ. Rev. 1958, 48, 261–297. [Google Scholar]
  23. Modigliani, F.; Miller, M.H. Corporate income taxes and the cost of capital: A correction. Am. Econ. Rev. 1963, 53, 433–443. [Google Scholar]
  24. Shyam-Sunder, L.; Myers, S.C. Testing static tradeoff against pecking order models of capital structure. J. Financ. Econ. 1999, 51, 219–244. [Google Scholar] [CrossRef]
  25. Abel, A.B. Optimal debt and profitability in the trade-off theory. J. Financ. 2018, 73, 95–143. [Google Scholar] [CrossRef]
  26. Parsons, C.; Titman, S. Empirical capital structure: A review. Found. Trends Financ. 2009, 3, 1–93. [Google Scholar] [CrossRef]
  27. Ferris, S.P.; Hanousek, J.; Shamshur, A.; Tresl, J. Asymmetries in the firm’s use of debt to changing market values. J. Corp. Financ. 2018, 48, 542–555. [Google Scholar] [CrossRef]
  28. Myers, S.C. Determinants of corporate borrowing. J. Financ. Econ. 1977, 5, 147–175. [Google Scholar] [CrossRef] [Green Version]
  29. Haji, A.A.; Ghazali, N.A.M. The quality and determinants of voluntary disclosures in annual reports of Shari’ah compliant companies in Malaysia. Humanomics 2013, 29, 24–42. [Google Scholar] [CrossRef]
  30. Ul Haque, A.; Kot, S.; Imran, M. The moderating role of environmental disaster in relation to microfinance’s non-financial services and women’s micro-enterprise sustainability. J. Secur. Sustain. Issues 2019, 8, 355–373. [Google Scholar] [CrossRef]
  31. Fowler, S.J.; Hope, C. A critical review of sustainable business indices and their impact. J. Bus. Ethics 2007, 76, 243–252. [Google Scholar] [CrossRef]
  32. Ahmed, A. Global financial crisis: An Islamic finance perspective. Int. J. Islamic Middle East. Financ. Manag. 2010, 3, 306–320. [Google Scholar] [CrossRef]
  33. Abdul Hadi, A.R.; Rehan, R.; Zainudin, Z.; Hussain, H.I. Capital Structure Determinants of Shariah and Non-Shariah Companies at Bursa Malaysia. Opcion 2018, 34, 376–386. [Google Scholar]
  34. Franzoni, S.; Ait Allali, A. Principles of Islamic Finance and Principles of Corporate Social Responsibility: What Convergence? Sustainability 2018, 10, 637. [Google Scholar] [CrossRef]
  35. Jusoh, M.A. Foreign ownership and firm performance: Evidence from Malaysia. Asian J. Account. Gov. 2016, 6, 49–54. [Google Scholar] [CrossRef]
  36. Dang, V.A.; Kim, M.; Shin, Y. Asymmetric adjustment toward optimal capital structure: Evidence from a crisis. Int. Rev. Financ. Anal. 2014, 33, 226–242. [Google Scholar] [CrossRef]
  37. Flannery, M.J.; Hankins, K.W. Estimating dynamic panel models in corporate finance. J. Corp. Financ. 2013, 19, 1–19. [Google Scholar] [CrossRef]
  38. Baltagi, B.H.; Song, S.H. Unbalanced panel data: A survey. Stat. Pap. 2006, 47, 493–523. [Google Scholar] [CrossRef]
  39. Mallisa, M.; Kusuma, H. Capital structure determinants and firms’ performance: Empirical evidence from Thailand, Indonesia and Malaysia. Pol. J. Manag. Stud. 2017, 16, 154–164. [Google Scholar]
  40. Azhar Rosly, S. Shariah parameters reconsidered. Int. J. Islamic Middle East. Financ. Manag. 2010, 3, 132–146. [Google Scholar] [CrossRef]
  41. Halling, M.; Yu, J.; Zechner, J. Leverage dynamics over the business cycle. J. Financ. Econ. 2016, 122, 21–41. [Google Scholar] [CrossRef]
  42. Lopez, L.; Weber, S. Testing for Granger causality in panel data. Stata J. 2018, 17, 972–984. [Google Scholar] [CrossRef]
  43. Hausman, J.A.; Taylor, W.E. Panel data and unobservable individual effects. Econometrica 1981, 49, 1377–1398. [Google Scholar] [CrossRef]
  44. Kiviet, J.; Pleus, M.; Poldermans, R. Accuracy and efficiency of various GMM inference techniques in dynamic micro panel data models. Econometrics 2017, 5, 14. [Google Scholar] [CrossRef]
  45. Clogg, C.C.; Petkova, E.; Haritou, A. Statistical methods for comparing regression coefficients between models. Am. J. Sociol. 1995, 100, 1261–1293. [Google Scholar] [CrossRef]
  46. Paternoster, R.; Brame, R.; Mazerolle, P.; Piquero, A. Using the correct statistical test for the equality of regression coefficients. Criminology 1998, 36, 859–866. [Google Scholar] [CrossRef]
  47. Pok, W.C. Analysis of Syariah quantitative screening norms among Malaysia Syariah-compliant stocks. Invest. Manag. Financ. Innov. 2012, 9, 69–80. [Google Scholar]
  48. Wan Ismail, W.A.; Kamarudin, K.A.; Sarman, S.R. The quality of earnings in Shariah-compliant companies: Evidence from Malaysia. J. Islamic Account. Bus. Res. 2015, 6, 19–41. [Google Scholar] [CrossRef]
  49. Abdel-Khaleq, A.H.; Richardson, C.F. New horizons for Islamic securities: Emerging trends in sukuk offerings. Chic. J. Int. Law 2006, 7, 409. [Google Scholar]
  50. Akram Laldin, M. Islamic financial system: The Malaysian experience and the way forward. Humanomics 2008, 24, 217–238. [Google Scholar] [CrossRef]
  51. Dusuki, A.W. Do equity-based Sukuk structures in Islamic capital markets manifest the objectives of Shariah? J. Financ. Serv. Mark. 2010, 15, 203–214. [Google Scholar] [CrossRef]
Figure 1. Trend of Book and Market Leverage: Comparing Compliant and Non-Compliant Firms.
Sustainability 11 03260 g001
Figure 2. Trend for mean and median difference between market and book leverage: Comparison of compliant and non-compliant firms.
Sustainability 11 03260 g002
Table 1. Definition of Variables.
VariableDefinition
BLTotal debt scaled by book value of total assets
MLTotal debt scaled by market value of equity plus book value of debt
SIZENatural log of net sales at 2003 prices
PROFEarnings Before Interest and Taxes scaled by total assets
VOLStandard deviation of EBIT scaled by total assets for the past 3 years
MTBRatio of the book value of total assets less book value of equity plus the market value of equity to book value of total assets
TANGNet Property, Plant and Equipment scaled by total assets
INDLMedian leverage (book or market) of the industry
BL: Book leverage; ML: Market leverage; SIZE: Firm size; PROF: Firm Profitability; VOL: Earnings volatility; MTB: Market-to-book ratio; TANG: Asset tangibility; INDL: Industry leverage.
Table 2. Univariate comparison of Compliant and Non-Compliant Firms.
Panel A: Comparison of Mean Values
VariableCompliant FirmsNon-compliant FirmsT-values (Absolute)
BL0.16960.23883.08 ***
ML0.15840.21964.33 ***
SIZE16.283318.96252.08 **
PROF0.05060.07373.96 ***
VOL0.08960.03282.99 ***
MTB2.18961.96031.35
TANG0.41060.25633.88 ***
INDBL0.17030.22952.22 **
INDML0.15630.21443.99 **
Panel B: Comparison of Median Values
VariableCompliant FirmsNon-compliant FirmsWilcoxon Z-test
BL0.15280.23993.65 ***
ML0.14860.21984.05 ***
SIZE16.952619.08222.36 **
PROF0.04860.06253.88 ***
VOL0.07250.02633.06 ***
MTB2.14361.93071.53
TANG0.38600.24283.62 ***
INDBL0.15960.21082.48 **
INDML0.14220.21083.92 ***
Significance levels of difference are denoted as ** and *** for 10%, 5% and 1% level, respectively.
Table 3. Testing for heterogenous causality for unbalanced panel data.
Null HypothesisZ-statProb.Causality Observed
BL does not cause SIZE−6.82690.0000Yes
SIZE does not cause BL9.62840.0000Yes
BL does not cause PROF42.45110.0000Yes
PROF does not cause BL25.92180.0000Yes
BL does not cause VOL56.28550.0000Yes
VOL does not cause BL−9.58220.0000Yes
BL does not cause MTB−6.82690.0000Yes
MTB does not cause BL−8.48900.0000Yes
BL does not cause TANG46.89280.0000Yes
TANG does not cause BL−8.56890.0000Yes
BL does not cause INDL6.36280.0000Yes
INDL does not cause BL12.96480.0000Yes
ML does not cause SIZE−8.26550.0000Yes
SIZE does not cause ML11.82420.0000Yes
ML does not cause PROF52.36280.0000Yes
PROF does not cause ML32.56110.0000Yes
ML does not cause VOL92.18930.0000Yes
VOL does not cause ML−9.36080.0000Yes
ML does not cause MTB−9.85180.0000Yes
MTB does not cause ML−11.28620.0000Yes
ML does not cause TANG59.28230.0000Yes
TANG does not cause ML−14.56120.0000Yes
ML does not cause INDL8.35210.0000Yes
INDL does not cause ML16.23550.0000Yes
Table 4. Changes in book leverage in response to shocks in equity prices.
12345
M L i t 1 B L i t 1 0.1025 ***0.0826 ***0.1425 ***0.0989 ***0.1028 ***
(0.0012)(0.0010)(0.0015)(0.0011)(0.0012)
Difference (Z-stat)-4.36 ***1.25
Control VariablesYesYesYesYesYes
Time DummiesYesYesYesYesYes
Industry DummiesYesYesYesYesYes
Significance levels are denoted as *** for 10%, 5% and 1% level, respectively.
Table 5. Accounting for economic shocks and cyclicality of firms.
Panel A: Interaction with Shocks Dummy
123
M L i t 1 B L i t 1 0.1484 ***0.1192 ***0.1922 ***
(0.0018)(0.0015)(0.0021)
Difference (Z-Stat)-3.85 ***
M L i t 1 B L i t 1   * shocks−0.0864 ***−0.0426 ***−0.1091 ***
(0.0024)(0.0019)(0.0032)
Difference (Z-Stat)-6.90 ***
Control VariablesYesYesYes
Control Variables * shocksYesYesYes
Time DummiesYesYesYes
Industry DummiesYesYesYes
Panel B: Interaction with Cyclical Dummy
123
M L i t 1 B L i t 1 0.1825 ***0.1682 ***0.2451 ***
(0.0020)(0.0019)(0.0026)
Difference (Z-Stat)-3.26 ***
M L i t 1 B L i t 1   * cyclical−0.5425 ***−0.3868 ***−0.6825 **
(0.1528)(0.0965)(0.1829)
Difference (Z-Stat)-8.25 ***
Control VariablesYesYesYes
Control Variables * cyclicalYesYesYes
Time DummiesYesYesYes
Industry DummiesYesYesYes
Panel C: Interaction with Shocks and Cyclical Dummy
123
M L i t 1 B L i t 1 0.2196 ***0.1529 ***0.2562 ***
(0.0023)(0.0018)(0.0031)
Difference (Z-Stat)-3.08 ***
M L i t 1 B L i t 1   * shocks−0.0925 ***−0.0438 ***−0.1120 ***
(0.0026)(0.0018)(0.0042)
Difference (Z-Stat)-6.56 ***
M L i t 1 B L i t 1   * cyclical−0.5528 ***−0.3892 ***−0.6933 ***
(0.1626)(0.0969)(0.1922)
Difference (Z-Stat)-8.62 ***
Control VariablesYesYesYes
Control Variables * shocksYesYesYes
Control Variables * cyclicalYesYesYes
Time DummiesYesYesYes
Industry DummiesYesYesYes
Significance levels are denoted as *, ** and *** for 10%, 5% and 1% level, respectively.
Table 6. Controlling for the impact of changes in investor perceptions and deviation from target leverage.
123456
M L i t 1 B L i t 1 0.02150.02650.00860.03960.03080.0204
(0.0189)(0.0235)(0.0126)(0.0256)(0.0211)(0.0652)
-0.89-1.25
M L i t 1 B L i t 1 * negative0.2386 ***0.2063 ***0.3086 ***0.3846 ***0.2962 ***0.5236 ***
(0.0145)(0.0121)(0.0237)(0.0298)(0.0184)(0.0483)
Difference (Z-Stat)-5.58 ***-6.35 ***
M L i t 1 B L i t 1 * shocks−0.0836 ***−0.0596 ***−0.1425 ***−0.1028 ***−0.0628 ***−0.1828 ***
(0.0161)(0.0125)(0.0163)(0.0195)(0.0125)(0.0324)
Difference (Z-Stat)-5.26 ***-5.95 ***
M L i t 1 B L i t 1 * cyclical−0.6284 ***−0.5725 ***−0.7236 ***−0.6928 ***−0.6011 ***−0.8162 ***
(0.1628)(0.1521)(0.2035)(0.2399)(0.1526)(0.2426)
Difference (Z-Stat)-6.28 ***-6.09 ***
Control VariablesYesYesYesYesYesYes
Control Variables * shocksYesYesYesYesYesYes
Control Variables * cyclicalYesYesYesYesYesYes
Time DummiesYesYesYesYesYesYes
Industry DummiesYesYesYesYesYesYes
Significance levels of difference are denoted as * and *** for 10%, 5% and 1% level, respectively.
Table 7. Distinguishing deliberate versus random financing choices.
2.50%5.00%10.00%
Measure123456
Panel A: Market Leverage is lower than Book Leverage
Net Debt Reduction28.36%56.35%27.95%56.44%27.65%55.96%
Difference (Z-Stat)42.86 ***43.05 ***43.86 ***
Increase Equity Issue53.52%54.22%53.29%53.66%52.96%51.98%
Difference (Z-Stat)1.281.351.32
Both35.96%74.48%35.48%74.36%34.68%73.99%
Difference (Z-Stat)69.95 ***70.56 ***70.99 ***
Panel B: Market Leverage is greater than Book Leverage
Net Debt Increase58.26%35.36%56.96%32.30%50.35%29.61%
Difference (Z-Stat)56.29 ***56.95 **58.92 ***
Net Equity Reduction22.26%21.96%20.88%19.52%18.26%18.68%
Difference (Z-Stat)0.950.350.26
Both38.28%26.42%35.20%22.96%31.68%20.99%
Difference (Z-Stat)32.56 ***33.68 ***29.55 ***
Significance levels of difference are denoted as ** and *** for 10%, 5% and 1% level, respectively.

