Scenario-Based Extreme Flood Risk of Residential Buildings and Household Properties in Shanghai

 ,
,  ,
,
Abstract
:1. Introduction
2. Data and Methods
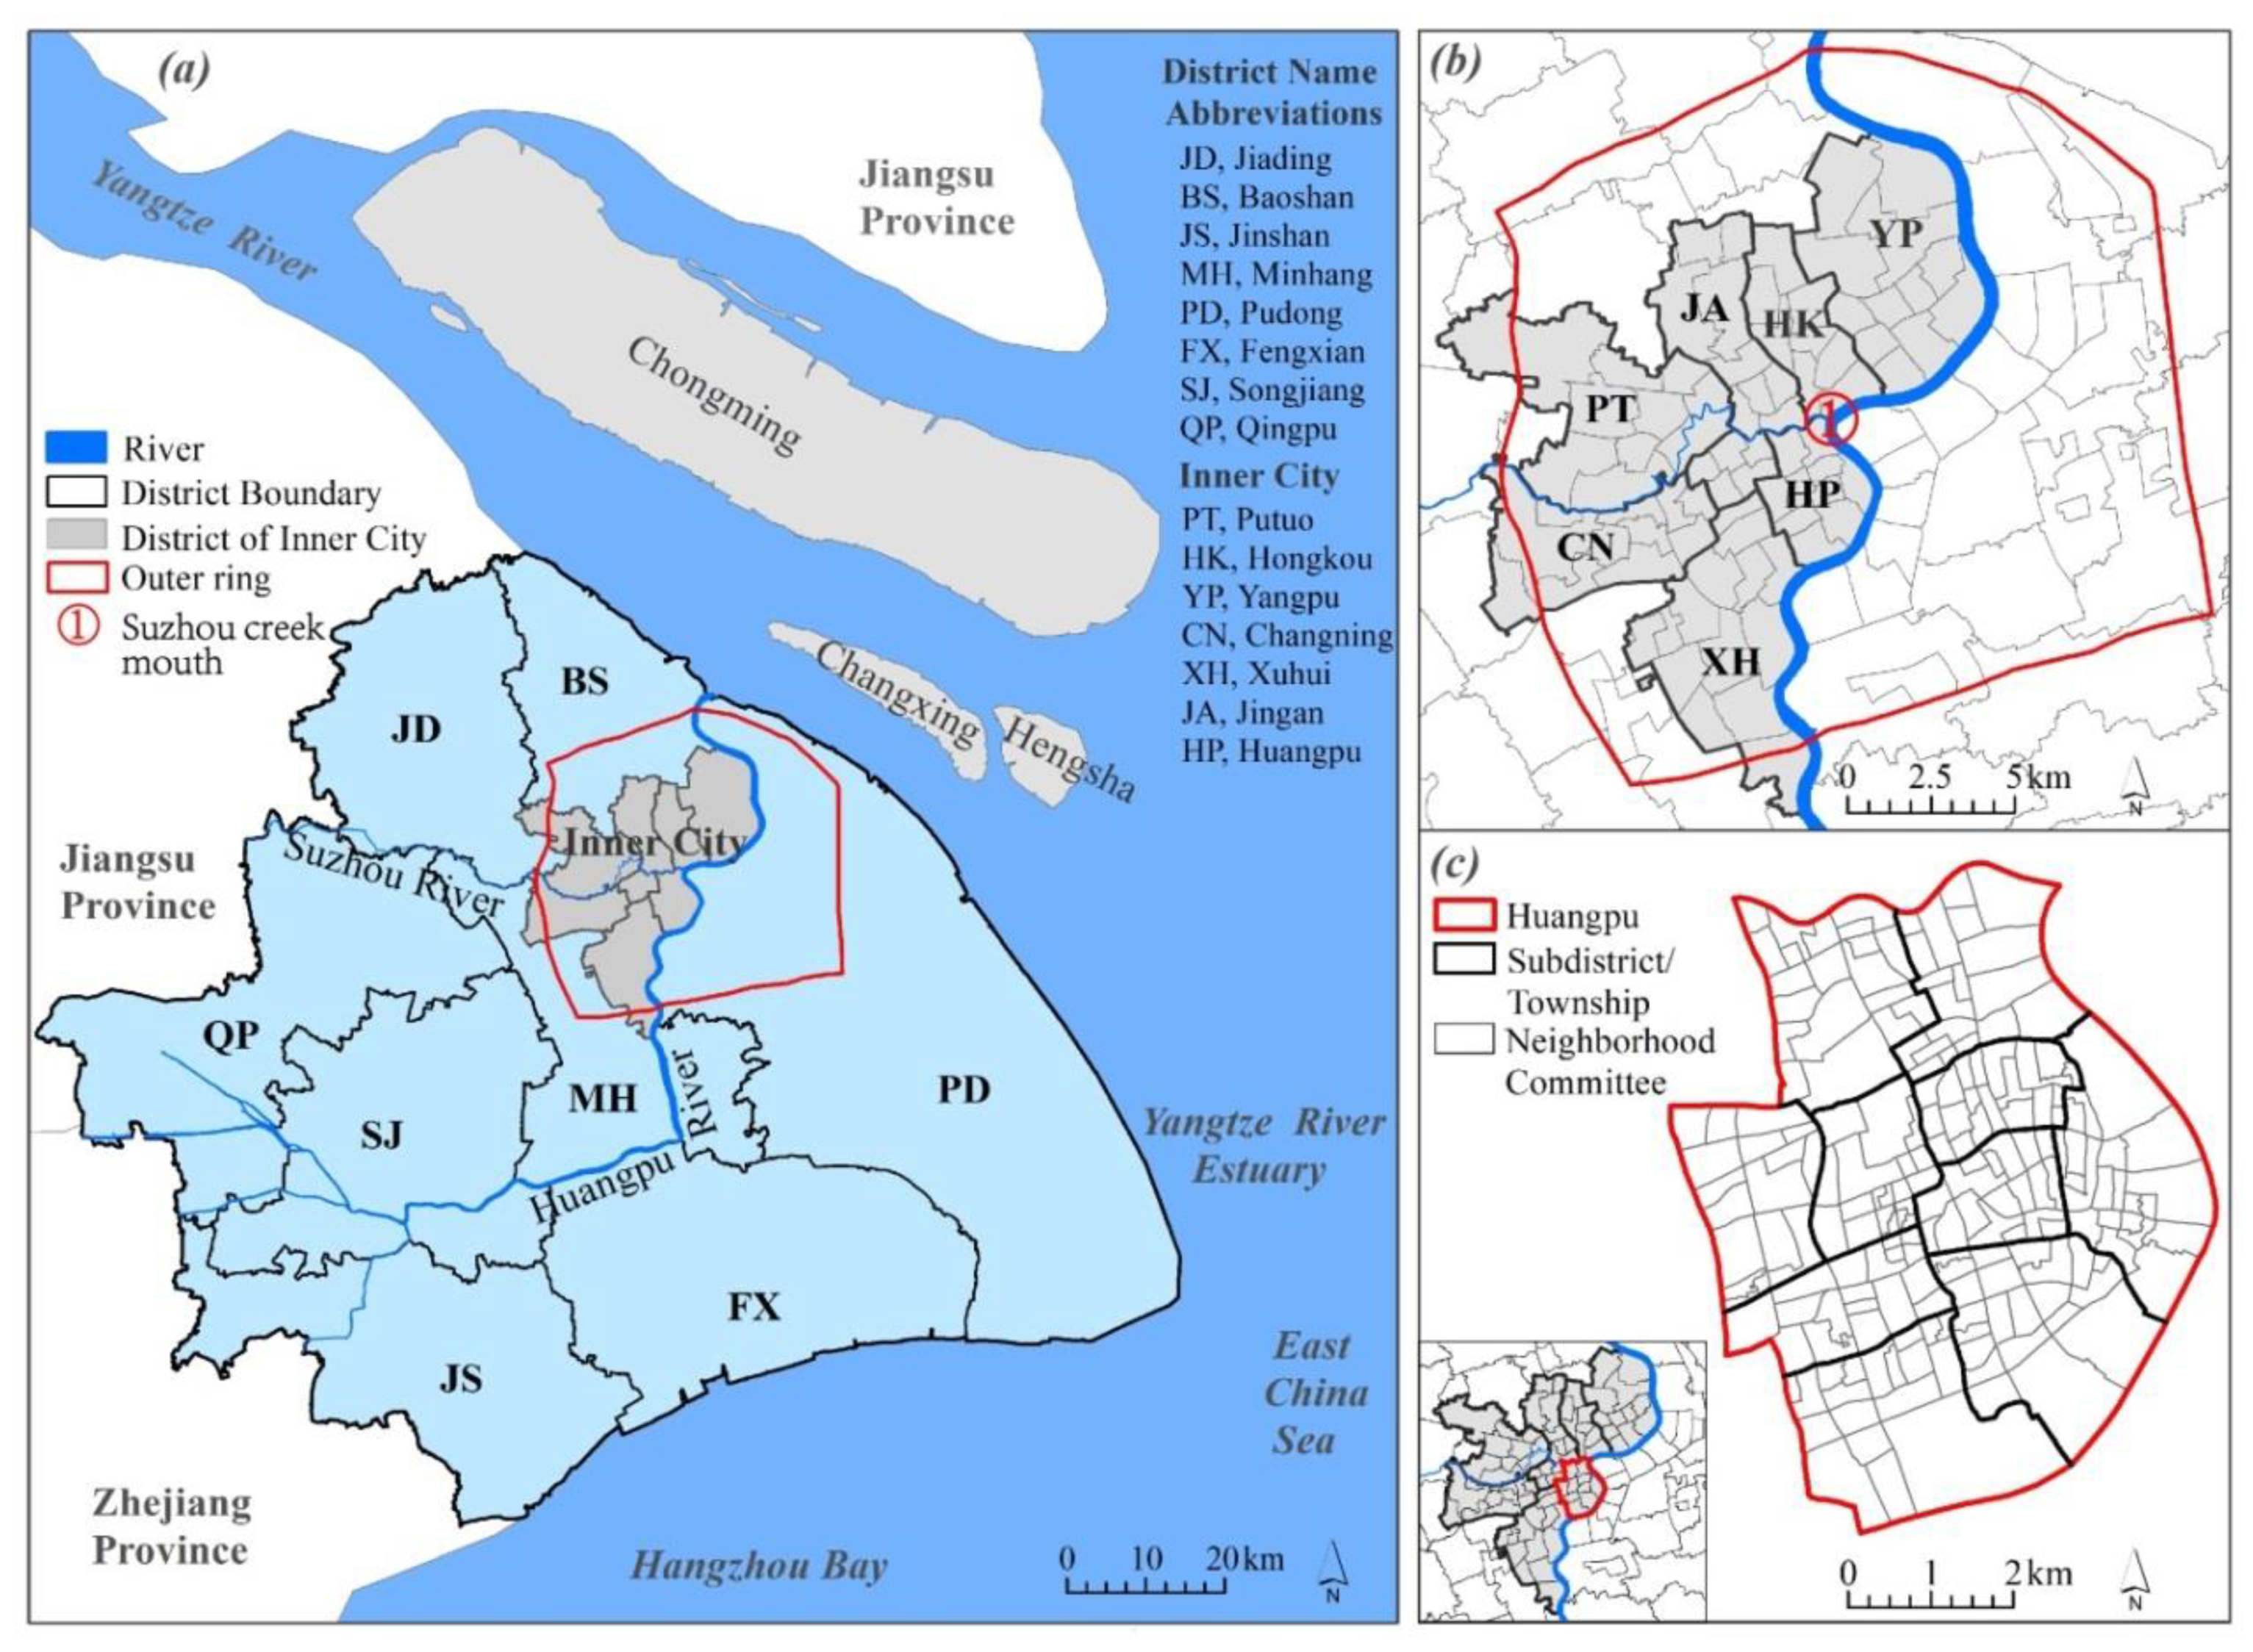
2.1. Study Area
2.2. Data
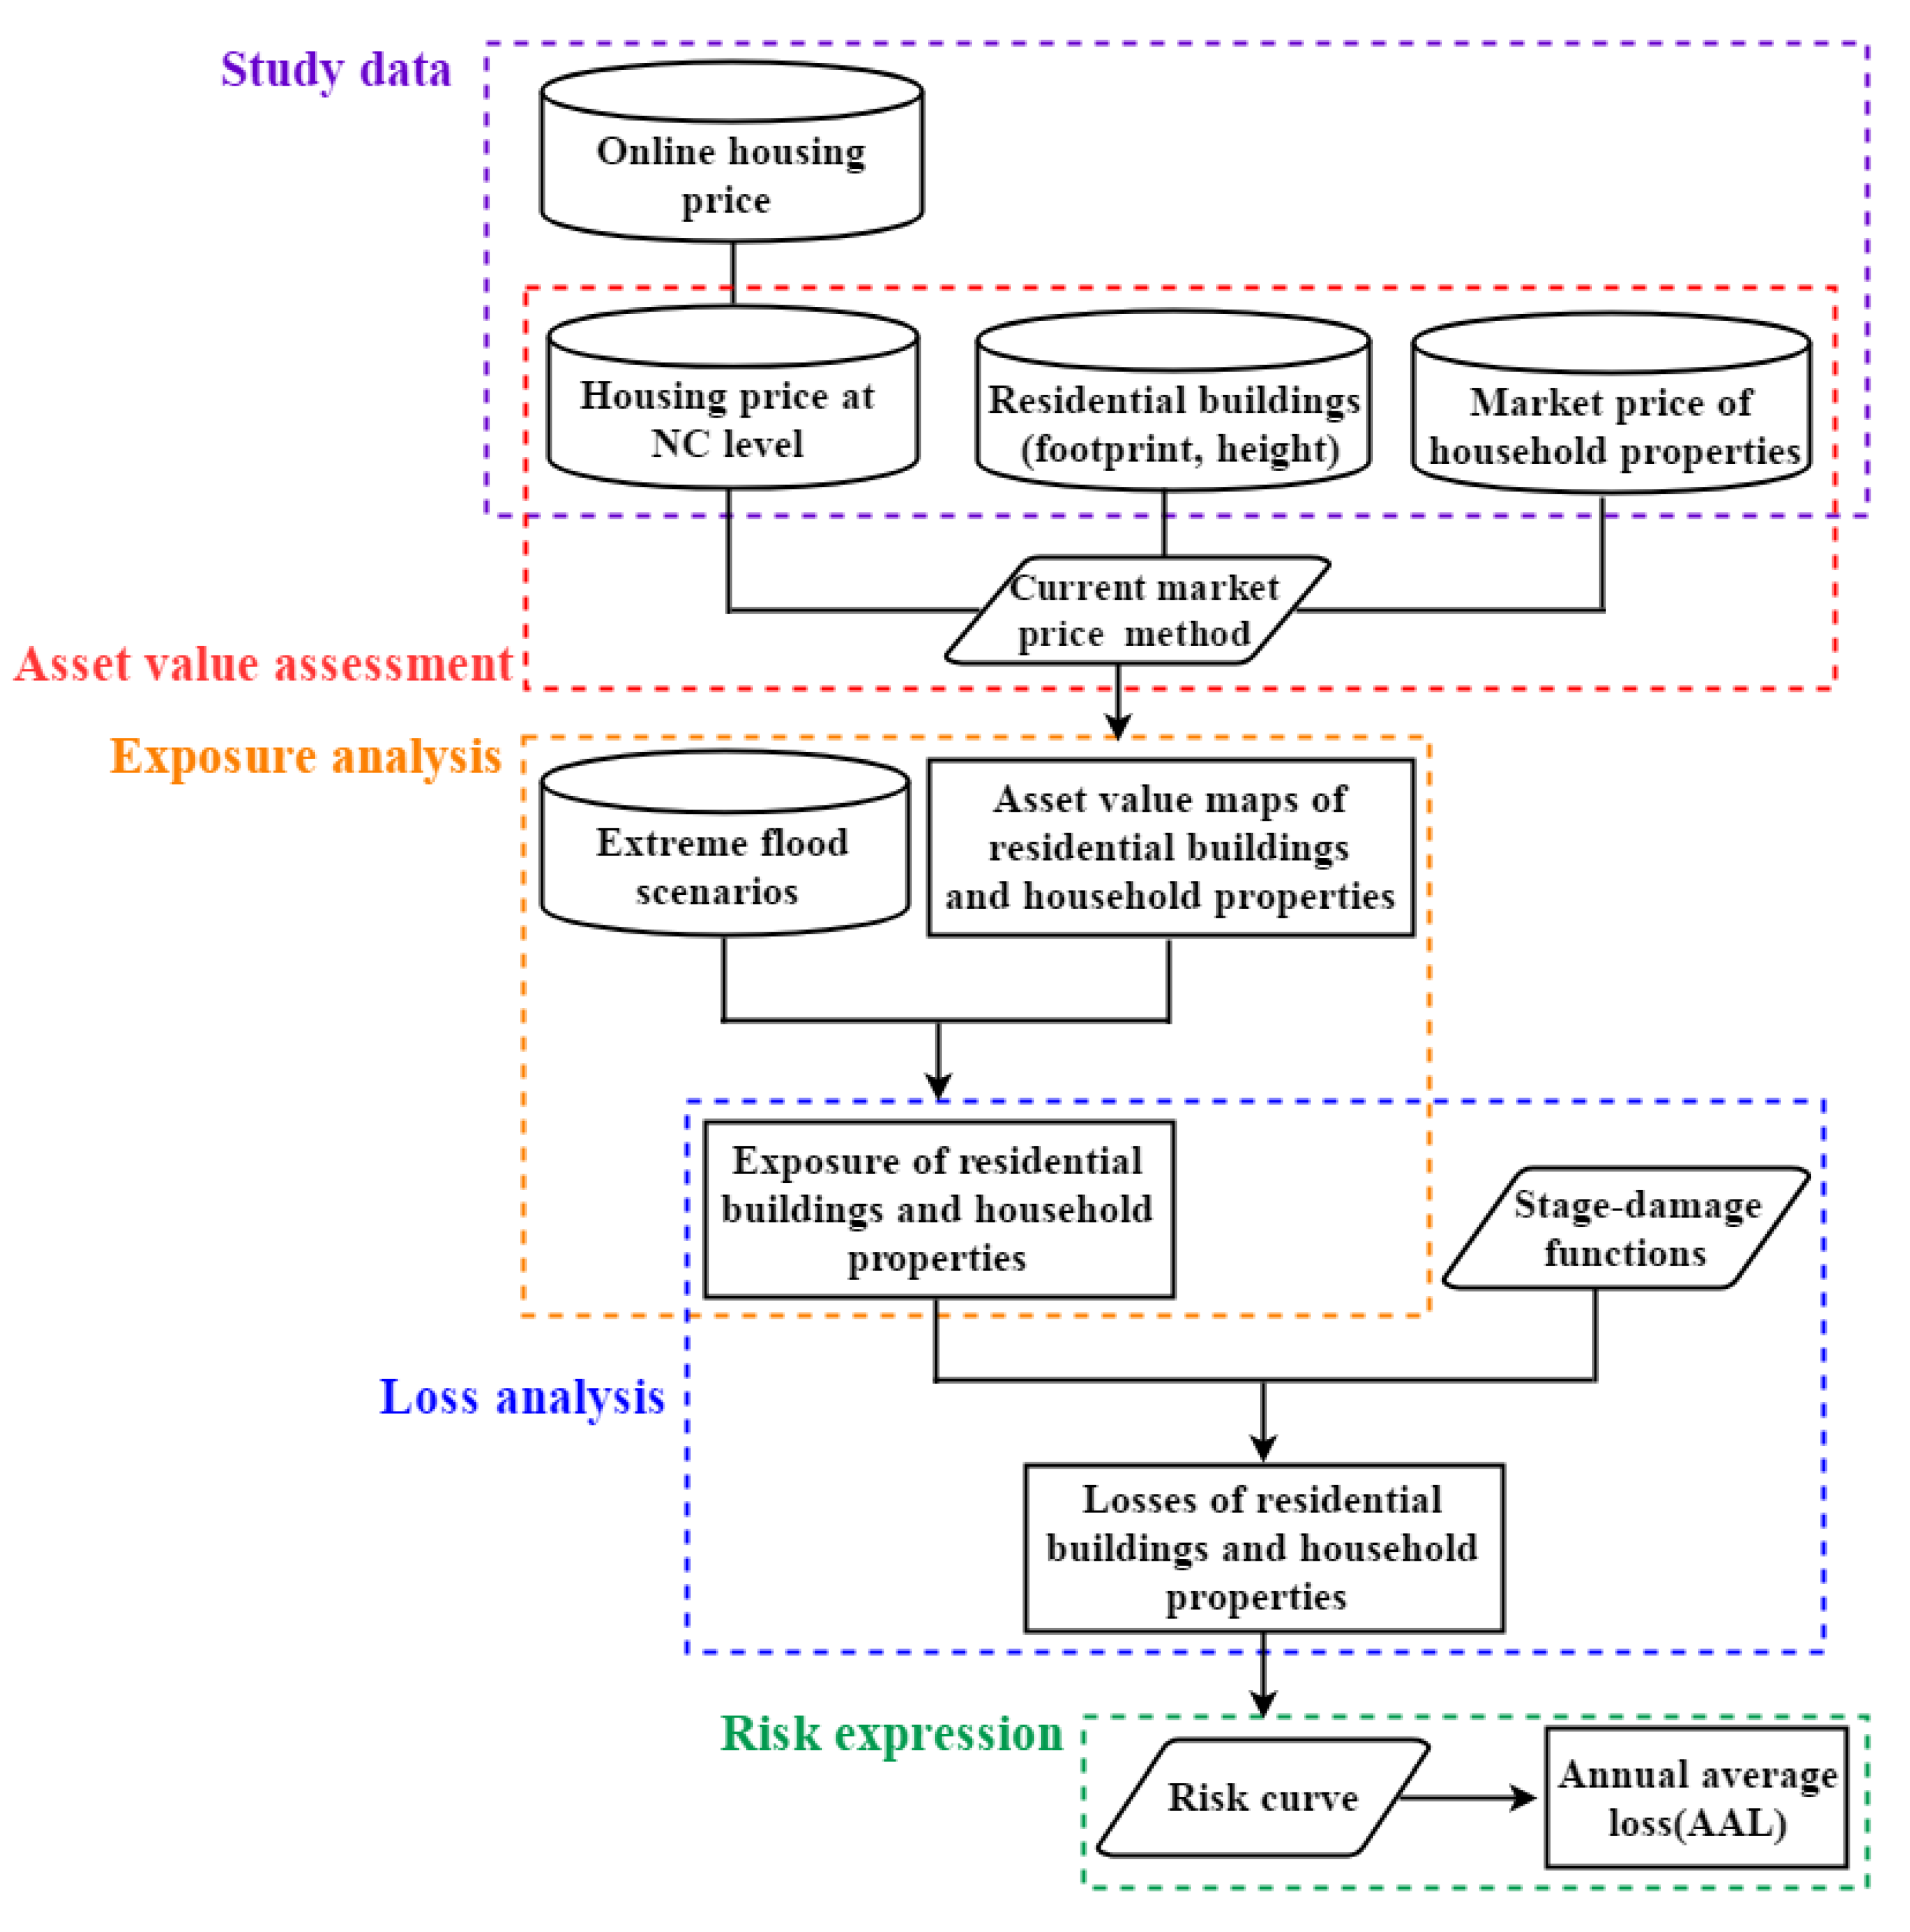
2.3. Methods
2.3.1. Asset Value Analysis of Household Properties
2.3.2. Exposure Analysis
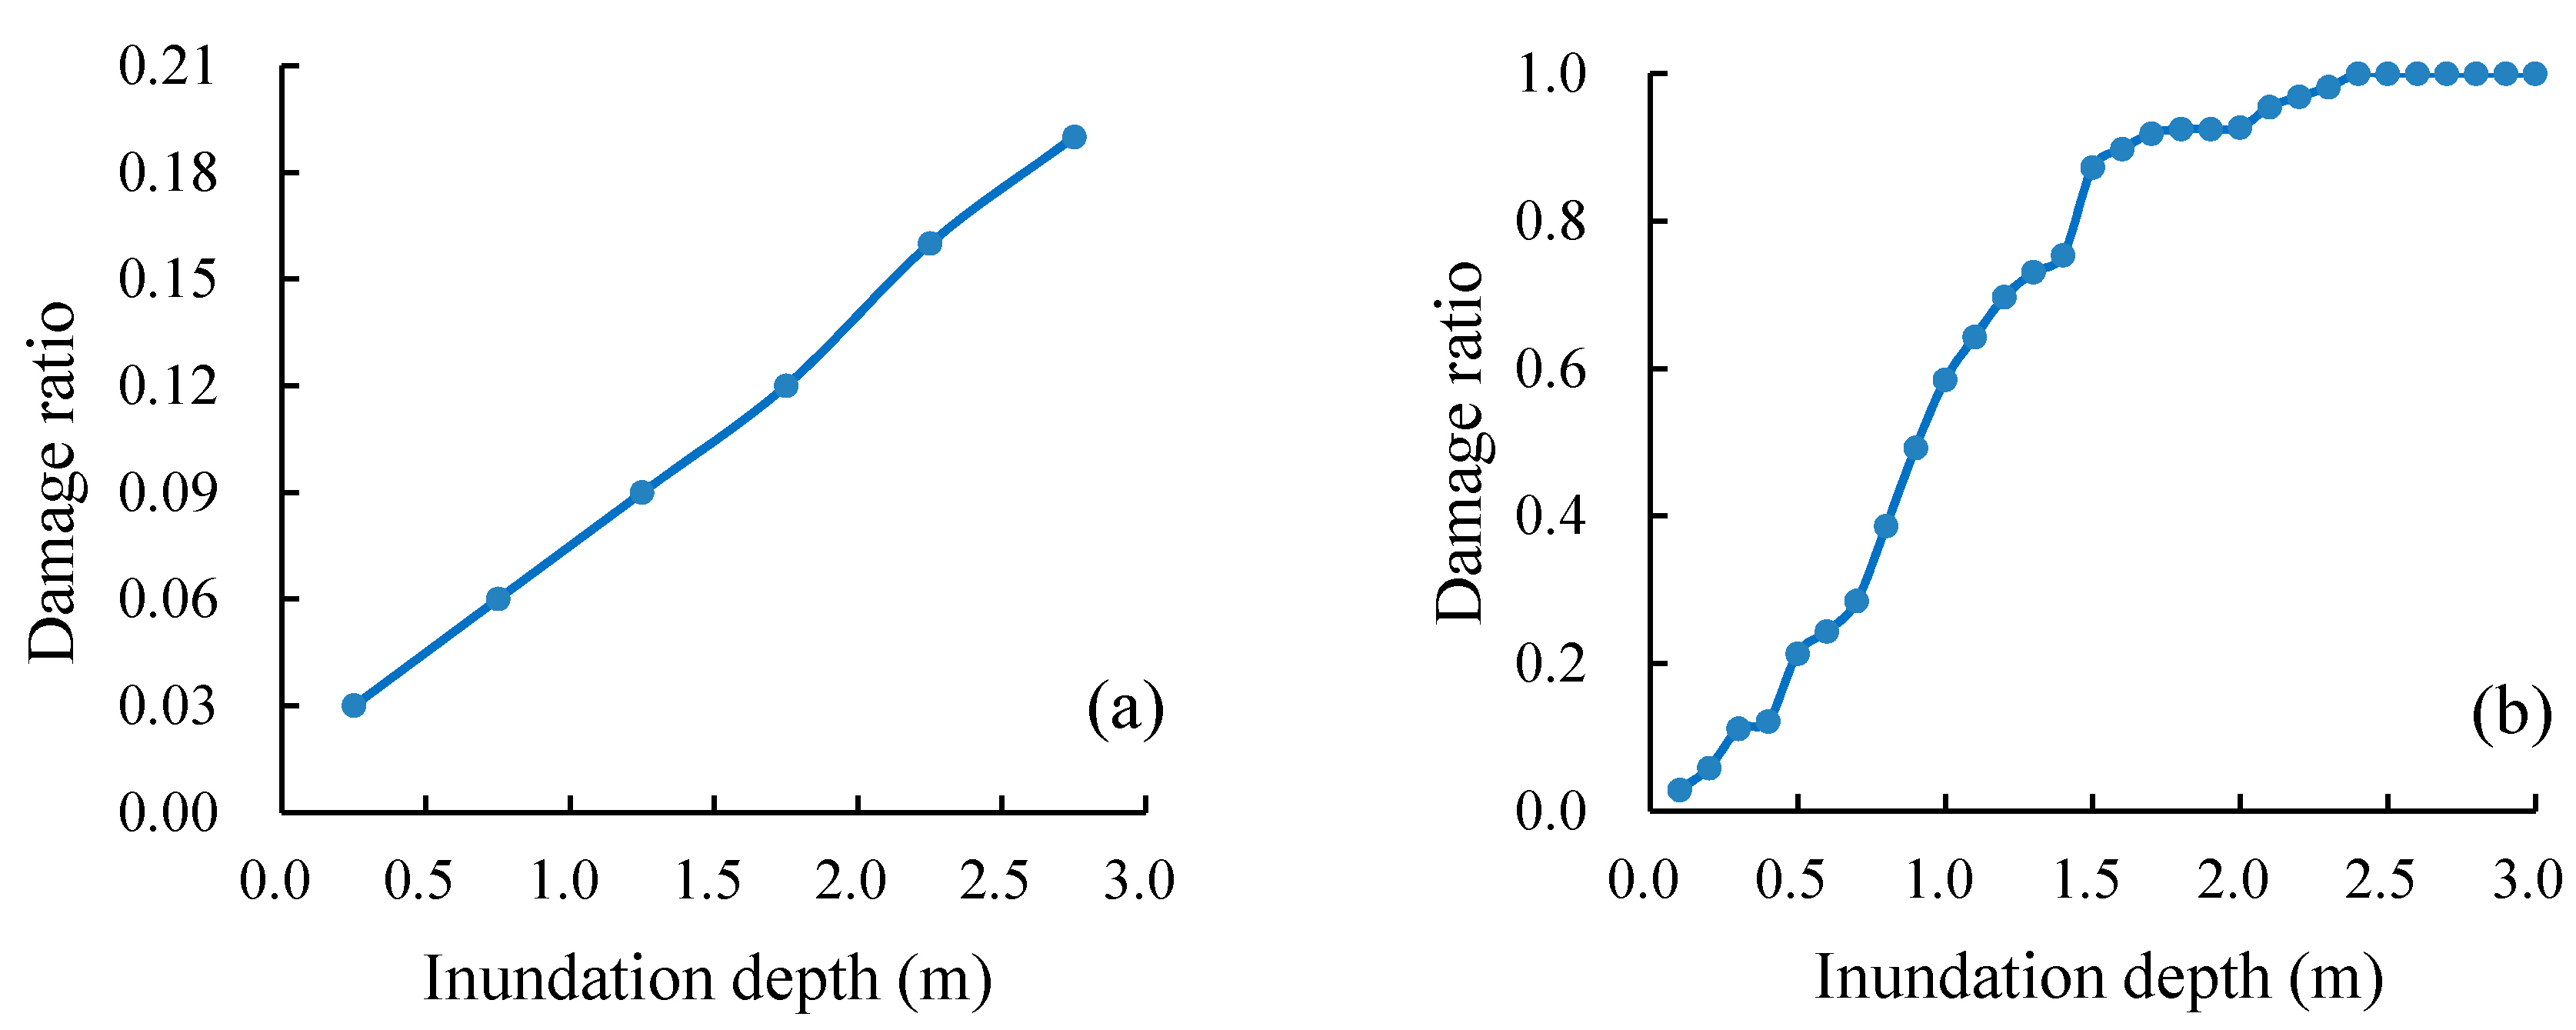
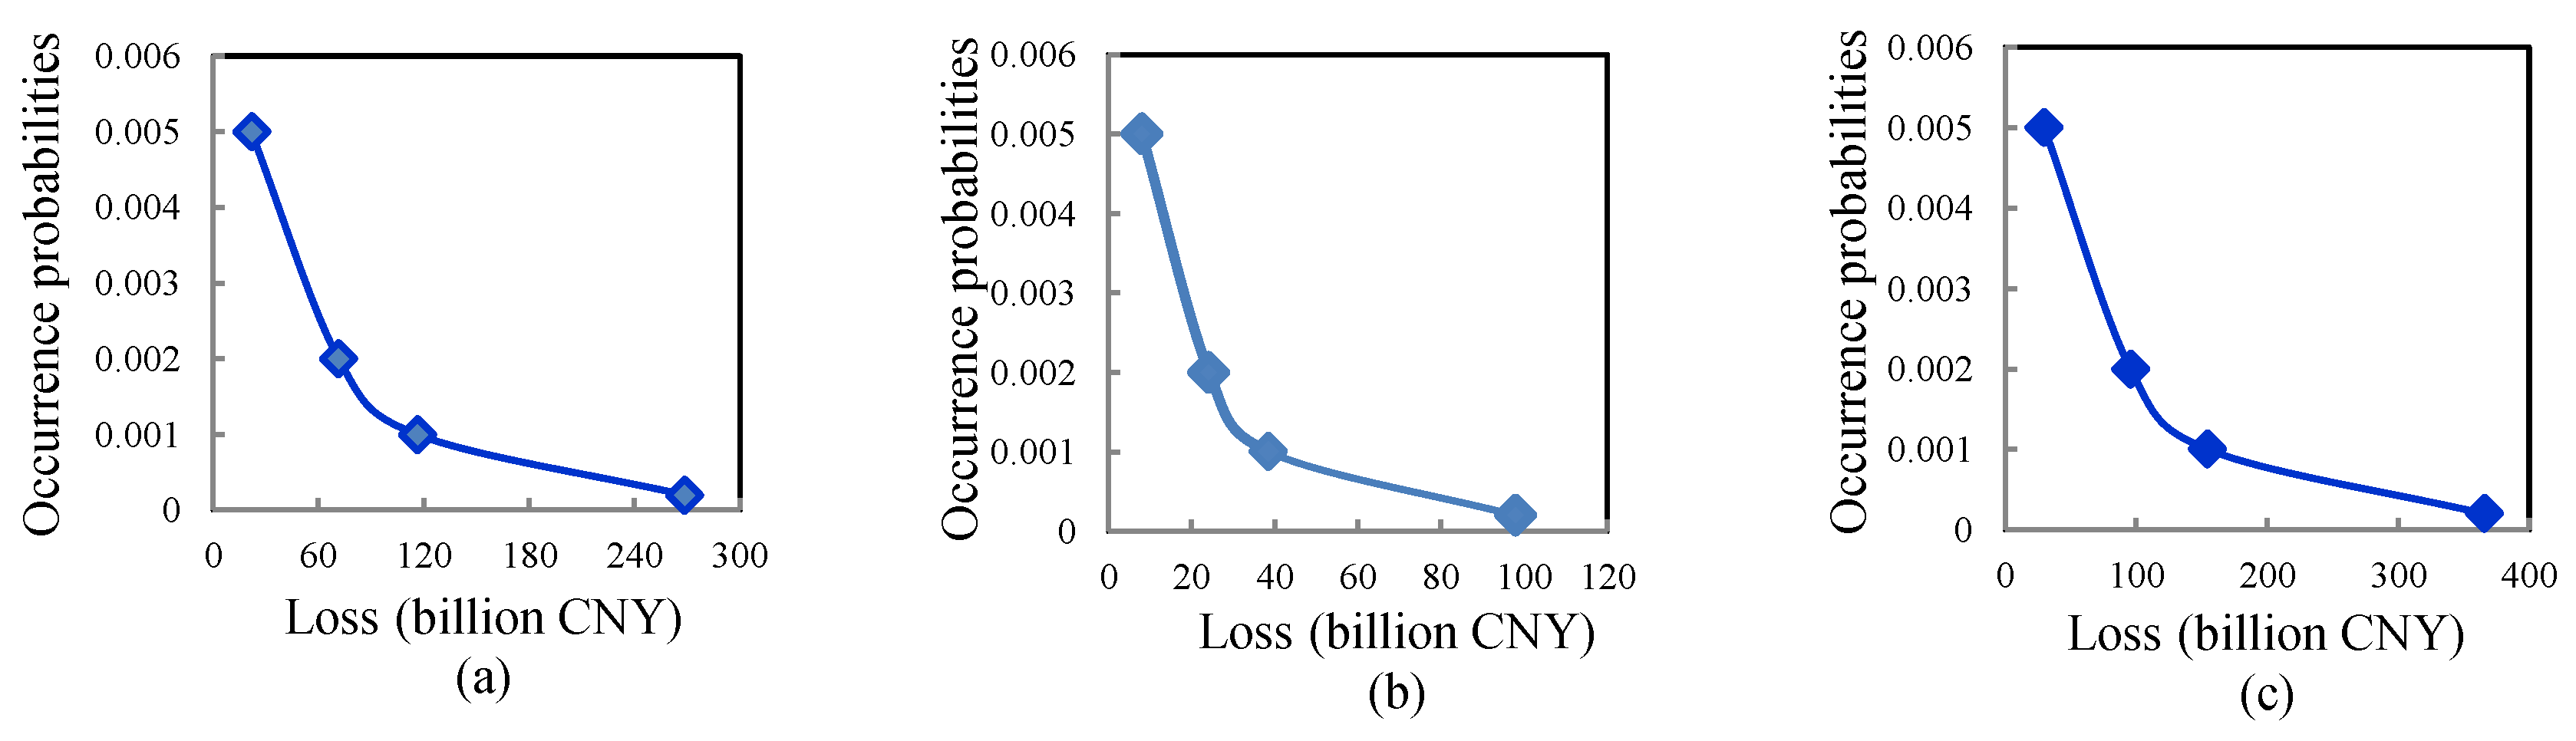
2.3.3. Loss Analysis
Loss Analysis of Residential Buildings
Loss Analysis of Household Properties
2.3.4. Risk Expression
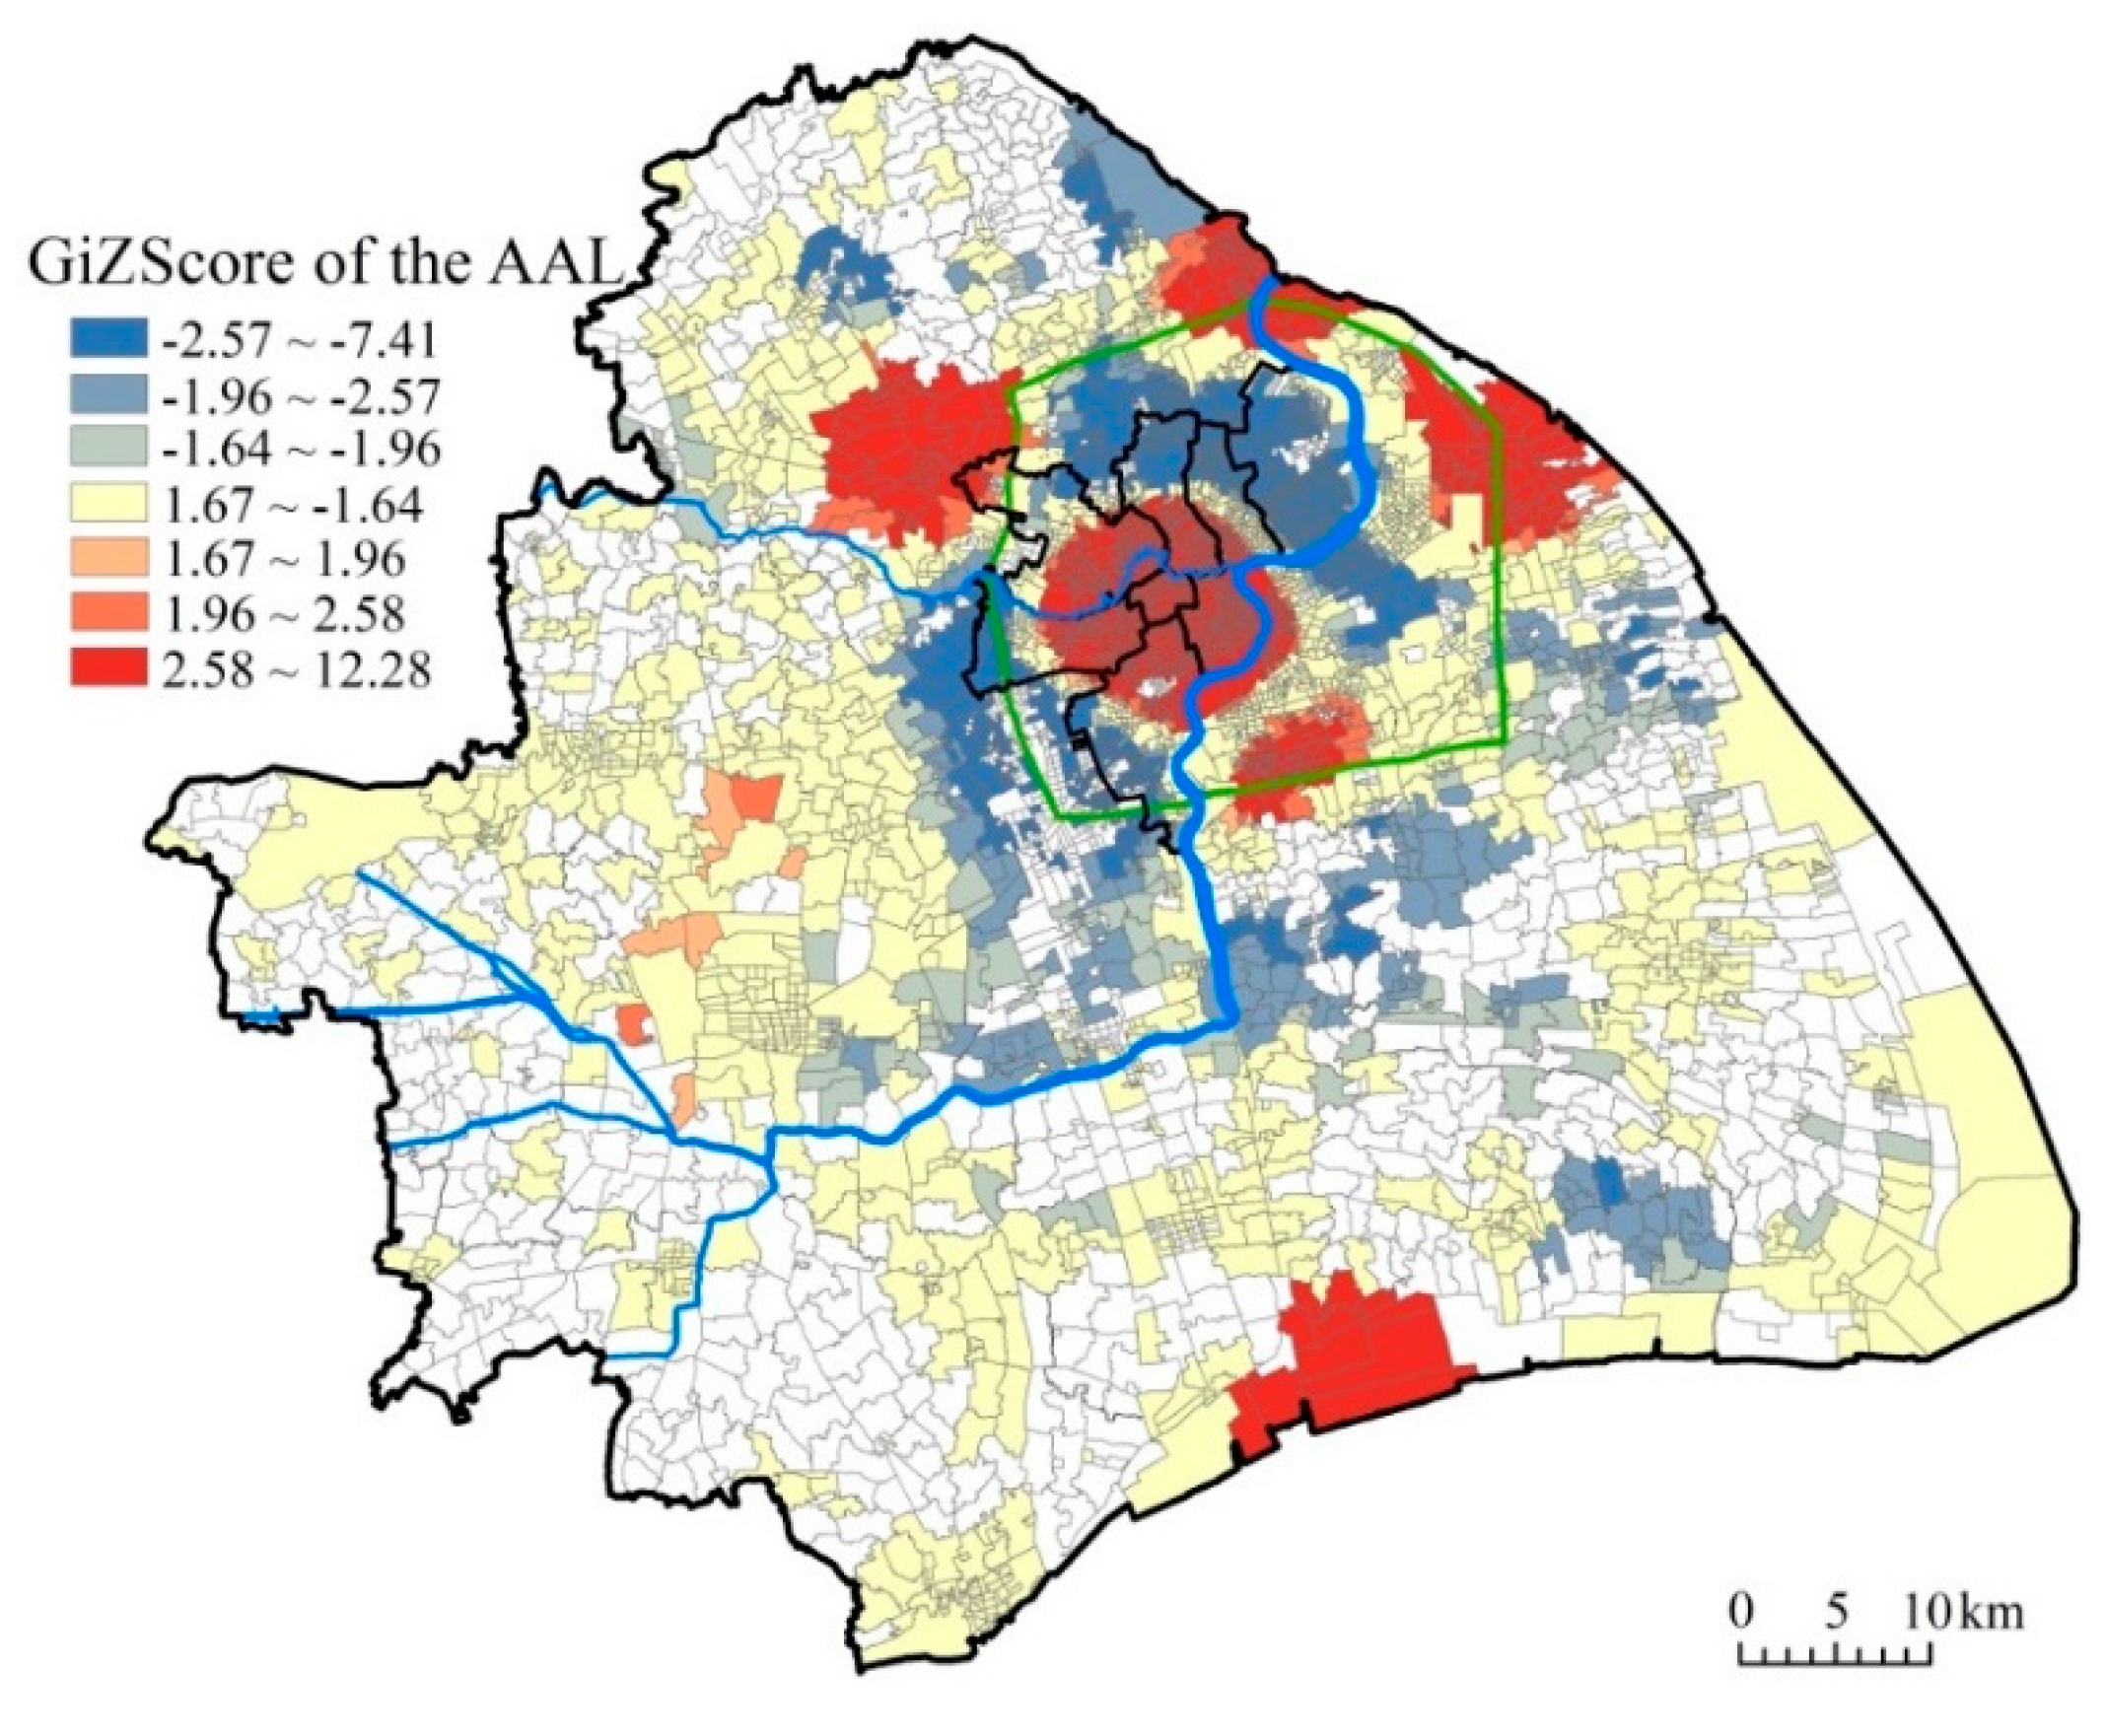
2.3.5. Spatial Pattern Identification
3. Results and Discussion
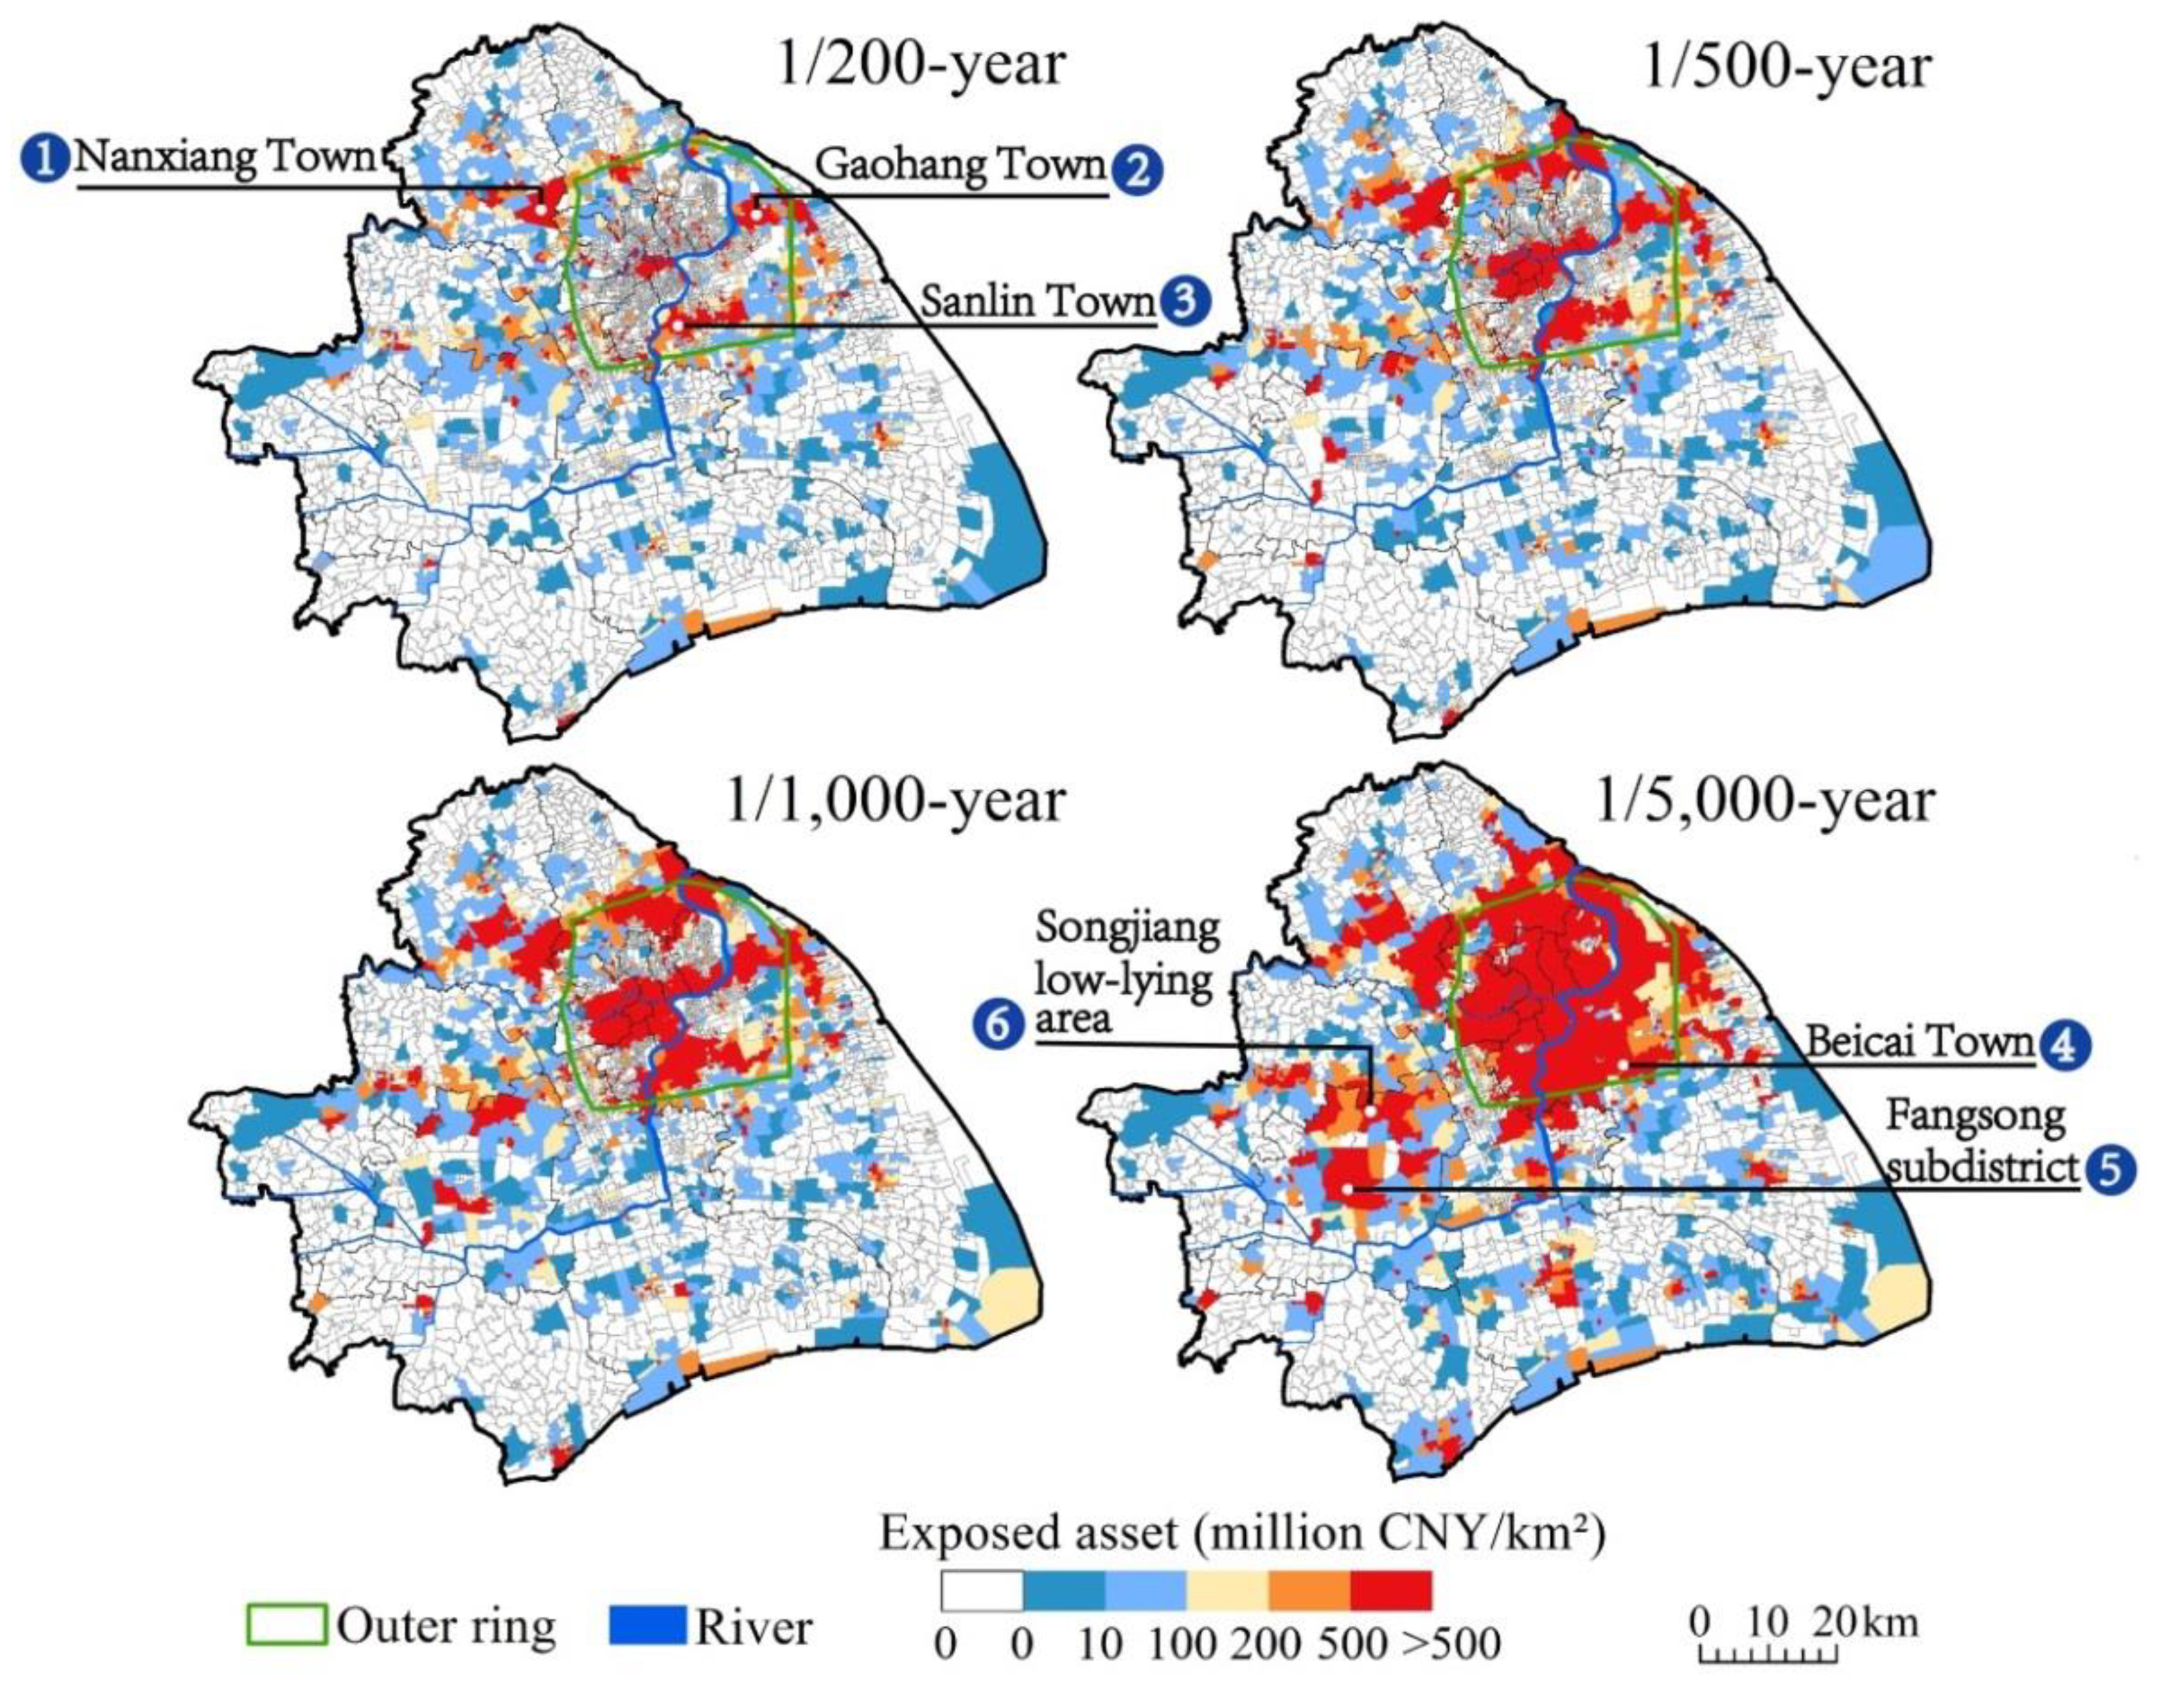
3.1. Exposure of Residential Buildings and Household Properties
3.2. Losses of Residential Buildings and Household Properties
3.3. Risk and Its Spatial Pattern
3.3.1. Risk Expression
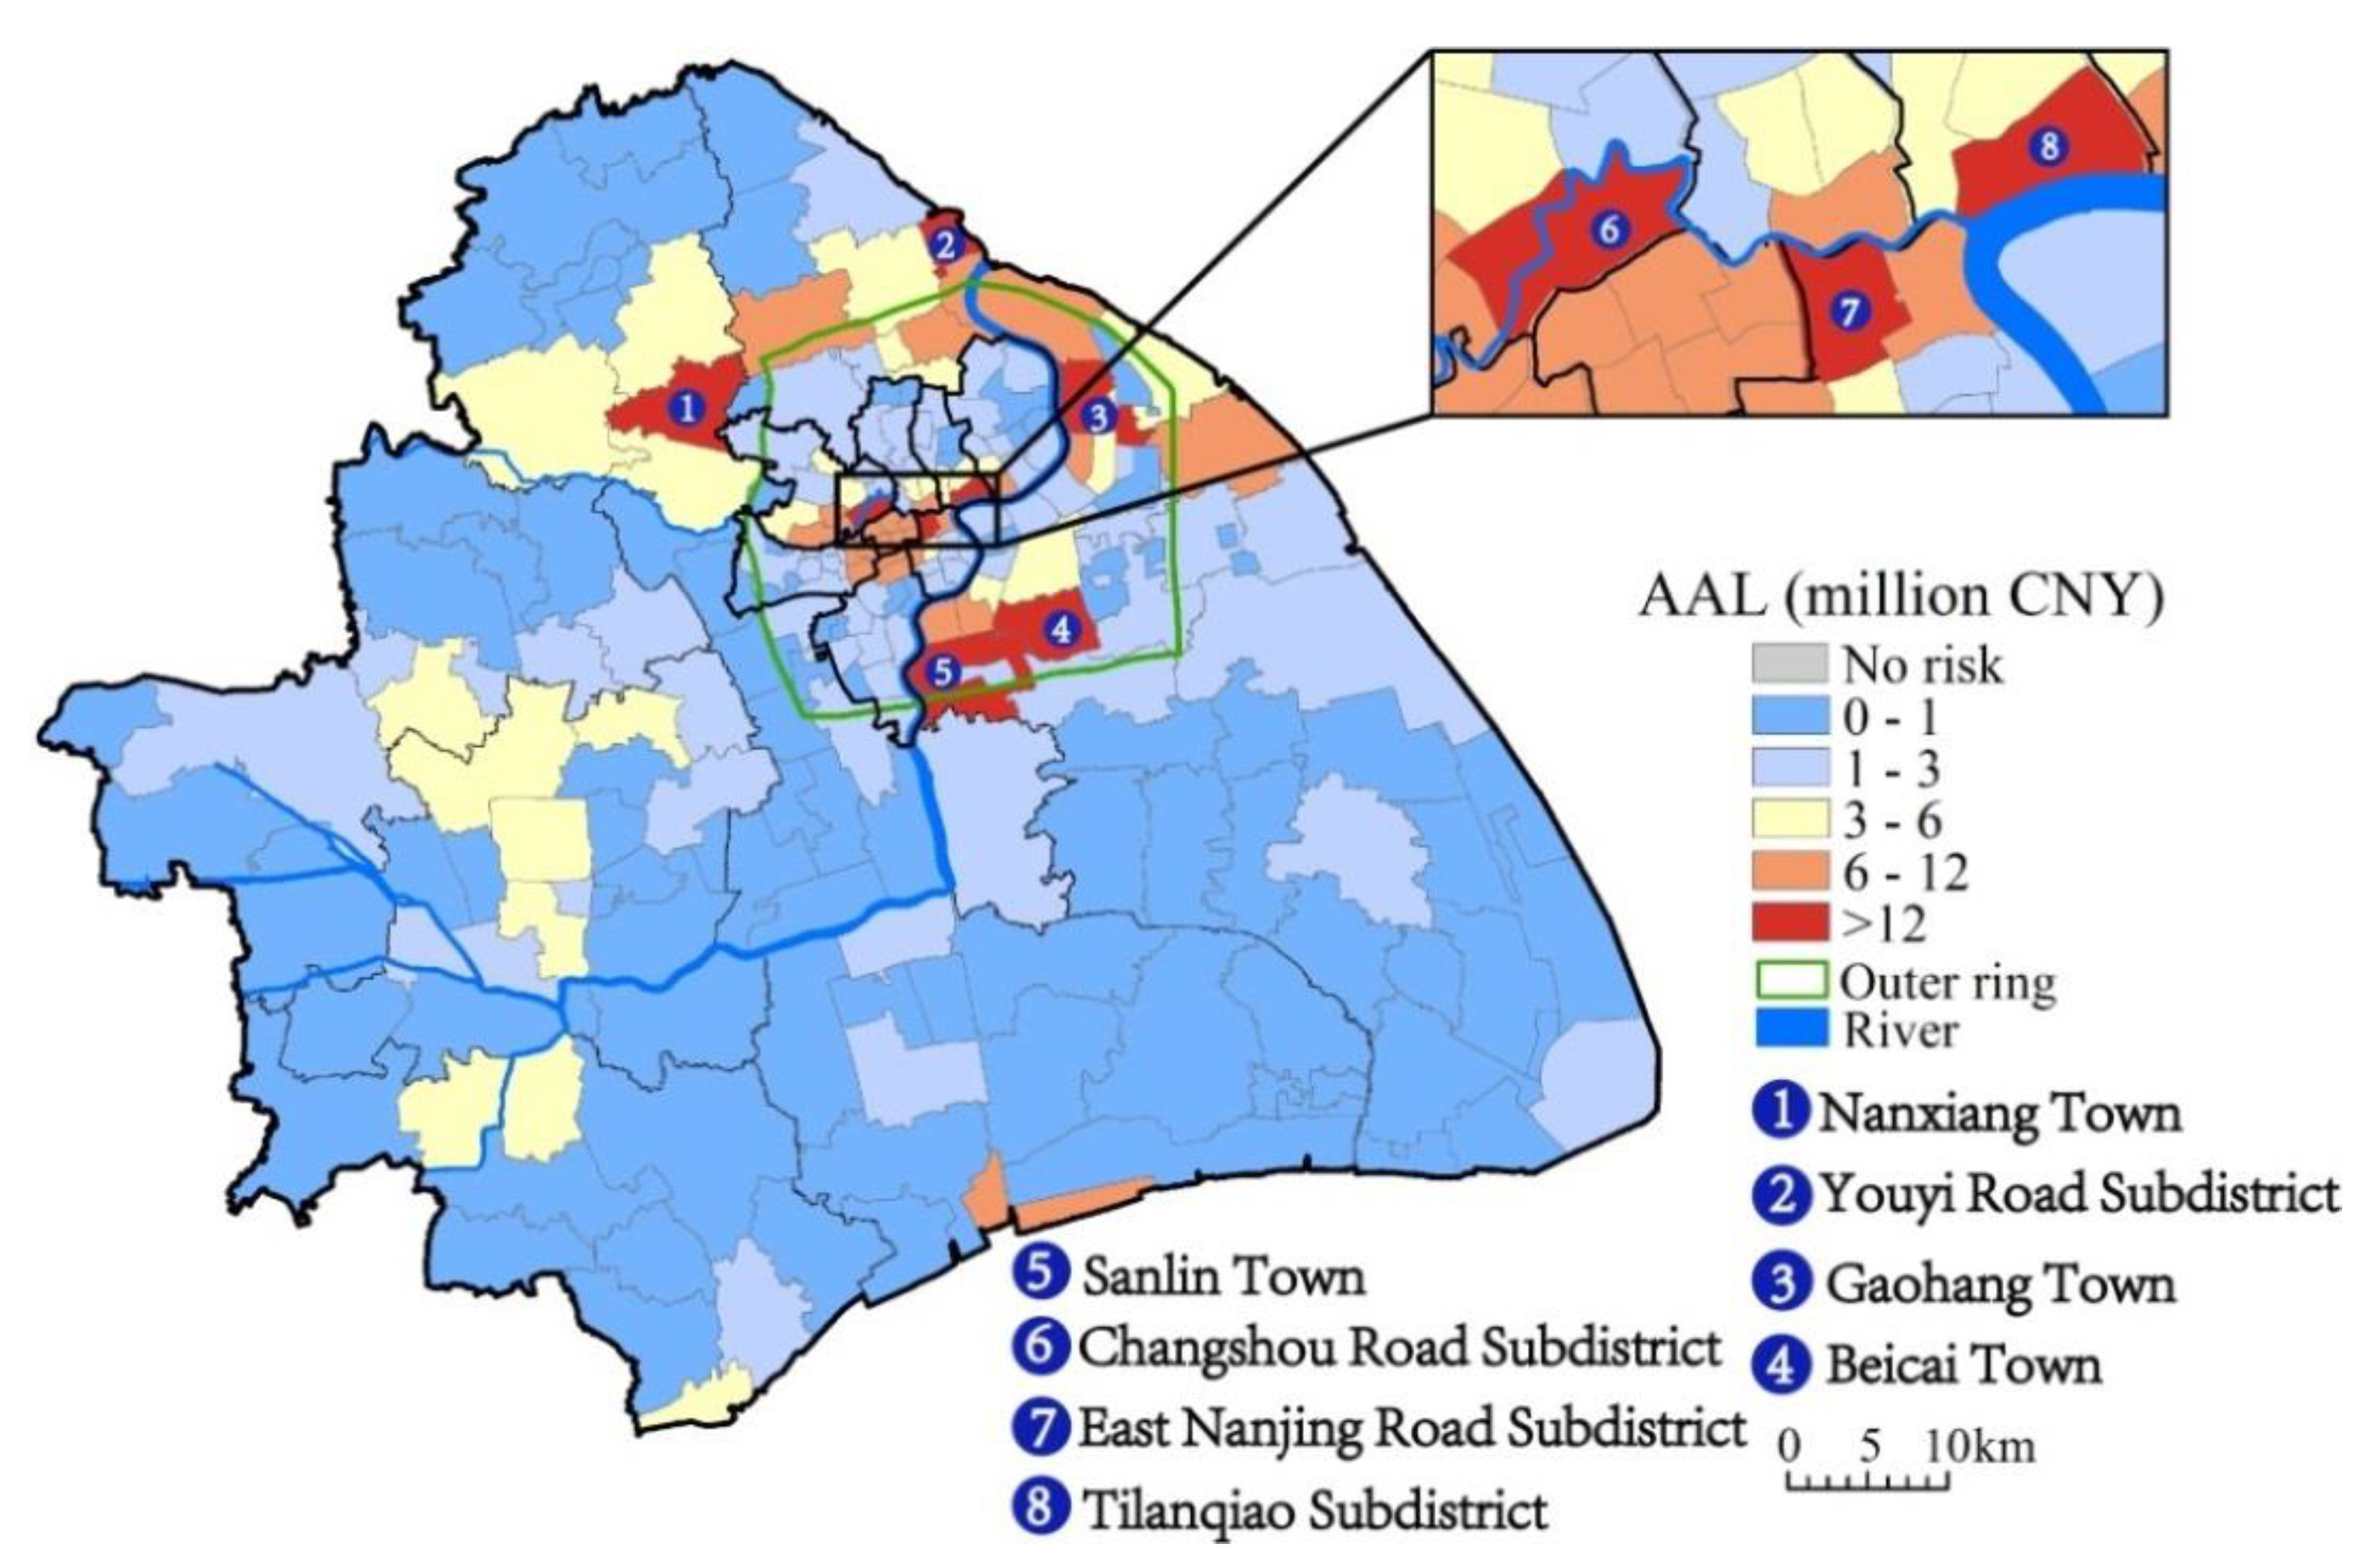
3.3.2. Spatial Pattern of the AAL
3.4. Discussion
4. Conclusions
- (1)
- The spatial patterns of exposure and losses for residential buildings and household properties are similar, and characterized as a rapid increase in the extent and amount of exposure and losses with return periods. For 1/5000-year, two contiguous inundation areas are formed, namely, the main urban area and the Songjiang low-lying area in west Shanghai. The exposure of household properties is an order of magnitude smaller than that of residential buildings, but the loss of household properties accounts for about 27% of the total losses, indicating that household properties are much more vulnerable to flooding.
- (2)
- The inundated residential building area caused by 1/200-year and 1/5000-year events increases from 24.9 km2 to 162.4 km2, and the total loss of residential buildings and household properties escalate from 29.7 billion CNY (4.4 billion USD) to 366.0 billion CNY (54.4 billion USD), with widespread impact throughout Shanghai city.
- (3)
- The AAL of residential buildings and household properties in Shanghai is 590 million CNY/year (87.4 million USD/year), and several hot spots of extreme flood risk are distributed around the main urban area and on the northern bank of the Hangzhou Bay. Pudong is most vulnerable to extreme flooding, where the exposure and AAL for the residential buildings and household properties covers more than 25% of the total in Shanghai. The inner city is also highly threatened by extreme flooding, with an AAL accounting for 49% of the total; in particular, the central city is a most important hot spot of extreme flood risk. Subdistricts/towns and neighborhood committees with the maximum risks are mainly concentrated in the Pudong, Jiading, Baoshan Districts and the inner city. The above administrative divisions and areas are especially required to strengthen flood resilience.
Author Contributions
Funding
Conflicts of Interest
References
- Ke, Q. Flood Risk Analysis for Metropolitan Areas: A Case Study for Shanghai. Ph.D. Thesis, Delft University of Technolog, Delft, The Netherlands, 2014. [Google Scholar]
- Wang, J.; Yi, S.; Li, M.Y.; Wang, L.; Song, C.C. Effects of sea level rise, land subsidence, bathymetric change and typhoon tracks on storm flooding in the coastal areas of Shanghai. Sci. Total Environ. 2018, 621, 228–234. [Google Scholar] [CrossRef] [PubMed]
- Swiss Reinsurance Company Ltd. Mind the Risk: A Global Ranking of Cities under Threat from Natural Disasters; Swiss Reinsurance Company Ltd.: Zurich, Switzerland, 2013; pp. 1–38. [Google Scholar]
- Wang, J.; Gao, W.; Xu, S.Y.; Yu, L.Z. Evaluation of the combined risk of sea level rise, land subsidence, and storm surges on the coastal areas of Shanghai, China. Clim. Chang. 2012, 115, 537–558. [Google Scholar] [CrossRef]
- Xian, S.Y.; Yin, J.; Lin, N.; Oppenheimer, M. Influence of risk factors and past events on flood resilience in coastal megacities: Comparative analysis of NYC and Shanghai. Sci. Total Environ. 2018, 610–611, 1251–1261. [Google Scholar] [CrossRef]
- Xu, S.Y.; Wang, J.; Shi, C.; Yan, J.P. Research of the natural disaster risk on coastal cities. Acta Geogr. Sin. 2006, 61, 127–138. (In Chinese) [Google Scholar] [CrossRef]
- Yin, J.; Yu, D.P.; Wilby, R. Modelling the impact of land subsidence on urban pluvial flooding: A case study of downtown Shanghai, China. Sci. Total Environ. 2016, 544, 744–753. [Google Scholar] [CrossRef] [PubMed] [Green Version]
- Yin, J.; Yu, D.P.; Yin, Z.E.; Wang, J.; Xu, S.Y. Multiple scenario analyses of Huangpu River flooding using a 1D/2D coupled flood inundation model. Nat. Hazards 2013, 66, 577–589. [Google Scholar] [CrossRef]
- Cheng, H.Q.; Chen, J.Y.; Chen, Z.J.; Ruan, R.L.; Xu, G.Q.; Zeng, G.; Zhu, J.R.; Dai, Z.J.; Chen, X.Y.; Gu, S.H. Mapping sea level rise behavior in an Estuarine Delta System: A case study along the Shanghai coast. Engineering 2018, 4, 156–163. [Google Scholar] [CrossRef]
- Yin, J.; Yu, D.P.; Yin, Z.E.; Wang, J.; Xu, S.Y. Modelling the combined impacts of sea-level rise and land subsidence on storm tides induced flooding of the Huangpu River in Shanghai, China. Clim. Chang. 2013, 119, 919–932. [Google Scholar] [CrossRef]
- Hallegatte, S.; Green, C.; Nicholls, R.J.; Corfee-Morlot, J. Future flood losses in major coastal cities. Nat. Clim. Chang. 2013, 3, 802. [Google Scholar] [CrossRef]
- Wang, J.; Xu, S.Y.; Ye, M.W.; Huang, J. The MIKE model application to overtopping risk assessment of seawalls and levees in Shanghai. Int. J. Disaster Risk Sci. 2011, 2, 32–42. [Google Scholar] [CrossRef] [Green Version]
- Nicholls, R.J.; Reeder, T.; Brown, S.; Haigh, I.D. The risks of sea-level rise for coastal cities. In Climate Change: A Risk Assessment; King, D., Schrag, D., Zhou, D.D., Qi, Y., Ghosh, A., Eds.; Center for Science and Policy: Cambridge, UK, 2015; pp. 94–98. [Google Scholar]
- Shi, Y. The vulnerability assessment of residences in rainstorm waterlogging in cities: A case study of shanghai. J. Catastrophol. 2015, 30, 94–98. (In Chinese) [Google Scholar]
- Yin, J.; Yu, D.P.; Yin, Z.E.; Wang, J.; Xu, S.Y. Modelling the anthropogenic impacts on fluvial flood risks in a coastal mega-city: A scenario-based case study in Shanghai, China. Landsc. Urban Plan. 2015, 136, 144–155. [Google Scholar] [CrossRef]
- Wang, C.X.; Du, S.Q.; Wen, J.H.; Zhang, M.; Gu, H.H.; Shi, Y.; Xu, H. Analyzing explanatory factors of urban pluvial floods in Shanghai using geographically weighted regression. Stoch. Env. Res. Risk A 2017, 31, 1777–1790. [Google Scholar] [CrossRef]
- Gu, H.H.; Du, S.Q.; Liao, B.G.; Wen, J.H.; Wang, C.X.; Chen, R.S.; Bo, C. A hierarchical pattern of urban social vulnerability in Shanghai, China and its implications for risk management. Suatain. Cities Soc. 2018, 41, 170–179. [Google Scholar] [CrossRef]
- Quan, R.S. Research on Risk Assessment of Rainstorm Waterlogging Disaster in Typical City. Ph.D. Thesis, East China Normal University, Shanghai, China, 2012. (In Chinese). [Google Scholar]
- Wen, J.H.; Huang, H.; Chen, K.; Ye, X.L.; Hu, H.Z.; Hua, Z.Y. Probabilistic community-based typhoon disaster risk assessment: A case of Fululi community, Shanghai. Sci. Geogr. Sin. 2012, 32, 348–355. (In Chinese) [Google Scholar] [CrossRef]
- Yin, Z.E.; Yin, J.; Xu, S.Y.; Wen, J.H. Community-based scenario modelling and disaster risk assessment of urban rainstorm waterlogging. J. Geogr. Sci. 2011, 21, 274–284. [Google Scholar] [CrossRef]
- Aerts, J.C.J.H.; Lin, N.; Wouter Botzen, W.J.; Emanuel, K.; De Moel, H. Low-probability flood risk modeling for New York City. Risk Anal. 2013, 33, 772–788. [Google Scholar] [CrossRef]
- Huang, X.L.; Li, X.D.; Wen, J.H.; Li, W.J.; Du, S.Q. Measuring the economic losses and ripple effects of Shanghai automobile firms under extreme flood scenarios. Geogr. Res. 2017, 36, 1801–1816. (In Chinese) [Google Scholar] [CrossRef]
- Li, W.J.; Wen, J.H.; Xu, B.; Li, X.D.; Du, S.Q. Integrated assessment of economic losses in manufacturing industry in Shanghai metropolitan area under an extreme storm flood scenario. Sustainability 2018, 11, 126. [Google Scholar] [CrossRef]
- Liu, K.C. An estimation for the probable maximum typhoon surges in Shanghai Harbour. Coast. Eng. 1984, 3, 19–29. (In Chinese) [Google Scholar]
- Zhu, Y.S. Analysis and Management of Flood Risk (Tide) Safety Risk in Shanghai. Available online: http://jhe.ches.org.cn/jhe/ch/reader/view_html.aspx?file_no=2002080021 (accessed on 6 June 2019). (In Chinese).
- Bermúdez, M.; Zischg, A.P. Sensitivity of flood loss estimates to building representation and flow depth attribution methods in micro-scale flood modelling. Nat. Hazards 2018, 92, 1633–1648. [Google Scholar] [CrossRef] [Green Version]
- Federal Office for Water and Geology (FOWG). Bericht über die Hochwasserereignisse 2005; Federal Office for Water and Geology: Bern, Switzerland, 2005. [Google Scholar]
- Federal Office for the Environment (FOEN). EconoMe 4.0. Wirksamkeit und Wirtschaftlichkeit von Schutzmassnahmen gegen Naturgefahren; Federal Office of Environment FOEN: Bern, Switzerland, 2015. [Google Scholar]
- Kreibich, H.; Seifert, I.; Merz, B.; Thieken, A.H. Development of FLEMOcs—A new model for the estimation of flood losses in the commercial sector. Hydrol. Sci. J. 2010, 55, 1302–1314. [Google Scholar] [CrossRef]
- Mosimann, M.; Frossard, L.; Keiler, M.; Weingartner, R.; Zischg, P.A. A robust and transferable model for the prediction of flood losses on household contents. Water 2018, 10, 1596. [Google Scholar] [CrossRef]
- Thieken, A.H.; Müller, M.; Kreibich, H.; Merz, B. Flood damage and influencing factors: New insights from the August 2002 flood in Germany. Water Resour. Res. 2005, 41. [Google Scholar] [CrossRef]
- Shanghai Municipal Statistics Bureau. Shanghai Statistical Yearbook 2017. Available online: http://www.stats-sh.gov.cn/html/sjfb/201801/1001529.html (accessed on 23 April 2019). (In Chinese)
- Shi, Y. Reserch on Vulnerability Assessment of Cities on The Disaster Scenario: A Case of Shanghai City. Ph.D. Thesis, East China Normal University, Shanghai, China, 2010. (In Chinese). [Google Scholar]
- Wu, J.D.; Ye, M.Q.; Xu, W.; Koks, E. Building asset value mapping in support of flood risk assessments: A case study of Shanghai, China. Sustainability 2019, 11, 971. [Google Scholar] [CrossRef]
- Wang, L.Y.; Zhang, M.; Wen, J.H.; Chong, Z.T.; Ye, Q.H.; Ke, Q. Simulation of extreme compound coastal flooding in Shanghai. Adv. Water Sci. 2019. in press (In Chinese) [Google Scholar]
- Global Facility for Disaster Reduction and Recovery (GFDRR). Open Data for Resilience Initiative: Planning an Open Cities Mapping Project; World Bank: Washington, DC, USA, 2015. [Google Scholar]
- Chapi, K.; Singh, V.P.; Shirzadi, A.; Shahabi, H.; Bui, D.T.; Pham, B.T.; Khosravi, K. A novel hybrid artificial intelligence approach for flood susceptibility assessment. Environ. Model. Softw. 2017, 95, 229–245. [Google Scholar] [CrossRef]
- Global Facility for Disaster Reduction and Recovery (GFDRR). Machine Learning for Disaster Risk Management; The World Bank: Washington, DC, USA, 2018. [Google Scholar]
- Tehrany, M.S.; Pradhan, B.; Mansor, S.; Ahmad, N. Flood susceptibility assessment using GIS-based support vector machine model with different kernel types. Catena 2015, 125, 91–101. [Google Scholar] [CrossRef]
- Chen, K.; Shan, X.M.; Huang, Y.Q.; Du, S.Q.; Wen, J.H. Housing price mapping through machine learning and online data-A case study in Shanghai. Int. J. Geo-Inf. 2019. submitted for publication. [Google Scholar]
- Getis, A.; Ord, K. The analysis of spatial association by use of distance statistics. Geogr. Anal. 1992, 24, 189–206. [Google Scholar] [CrossRef]
- Chen, Z.L.; Wang, J.; Liu, M.; Yu, L.Z.; Xu, S.Y. Characteristics of main natural disasters and coping strategies in Shanghai. J. East China Norm. Univ. Nat. Sci. 2008, 5, 116–125. (In Chinese) [Google Scholar] [CrossRef]
- China National Commission for Disaster Reduction. The Standards of Model Community of Integrated Disaster Governace; Office of China National Commission for Disaster Reduction: Beijing, China, 2010.
- Gu, X.X. Review and prospect of flood wall construction on huangpu river in Shanghai in the past 50 years (part I). Shanghai Water 2005, 21, 15–18. (In Chinese) [Google Scholar]
- Yin, J. Study on the Risk Assessment of Typhoon Strom Tide in China Coastal Area. Ph.D. Thesis, East China Normal University, Shanghai, China, 2011. (In Chinese). [Google Scholar]
- Zhang, M.; Townend, I.; Cai, H.; He, J.; Mei, X. The influence of seasonal climate on the morphology of the mouth-bar in the Yangtze Estuary, China. Cont. Shelf Res. 2018, 153, 30–49. [Google Scholar] [CrossRef] [Green Version]
- Zhang, M.; Townend, I.H.; Cai, H.; Zhou, Y. Seasonal variation of tidal prism and energy in the Changjiang River Estuary: A numerical study. Chin. J. Oceanol. Limnol. 2016, 34, 219–230. [Google Scholar] [CrossRef]
- Ke, Q.; Jonkman, S.N.; van Gelder, P.H.A.J.M.; Bricker, J.D. Frequency analysis of storm-surge-induced flooding for the Huangpu River in Shanghai, China. J. Mar. Sci. Eng. 2018, 6, 70. [Google Scholar] [CrossRef]
- Chen, T.Q.; Guestrin, C. XGBoost: A scalable tree boosting system. In Proceedings of the 22nd ACM SIGKDD International Conference on Knowledge Discovery and Data Mining, San Francisco, CA, USA, 13–17 August 2016; pp. 785–794. [Google Scholar]
- Kunreuther, H.; Useem, M. Learning from Catastrophes: Strategies for Reaction and Response; Wharton School Publishing: New York, NY, USA, 2009. [Google Scholar]
- Lamond, J.; Proverbs, D.; Hammond, F. The impact of flooding on the price of residential property: A transactional analysis of the UK Market. Hous. Stud. 2010, 25, 335–356. [Google Scholar] [CrossRef]
- Zhang, Z.G. Research on Rainstorm Waterlogging Risk Assessment of Urban Communities-A Case of Jinsha Community. Ph.D. Thesis, Shanghai Normal University, Shanghai, China, 2014. [Google Scholar]
- Du, S.Q.; Gu, H.H.; Wen, J.H.; Chen, K.; Rompaey, A.V. Detecting flood variations in Shanghai over 1949–2009 with Mann-Kendall tests and a newspaper-based database. Water 2015, 7, 1808–1824. [Google Scholar] [CrossRef]
- Wen, J.H.; Du, S.Q.; Xu, H.; Yan, J.P.; Yao, D.J.; Wang, C.X. Research on flood hazard and risk management in Shanghai. In Proceedings of the 2016 National Forum on Integrated Disaster Risk Management and Sustainable Development Forum, Beijing, China, 10 May 2016; pp. 118–129. (In Chinese). [Google Scholar]
- Moel, H.D.; Aerts, J.C.J.H. Effect of uncertainty in land use, damage models and inundation depth on flood damage estimates. Nat. Hazards 2011, 58, 407–425. [Google Scholar] [CrossRef]
- Moel, H.D.; Bouwer, L.M.; Aerts, J.C.J.H. Uncertainty and sensitivity of flood risk calculations for a dike ring in the south of the Netherlands. Sci. Total Environ. 2014, 473–474, 224–234. [Google Scholar] [CrossRef]
- UNISDR. How to Make Cities More Resilient: A Handbook for Local Government Leaders; United Nations: Geneva, Switzerland, 2017; pp. 30–80. [Google Scholar]
- Syvitski, J.P.M.; Overeem, A.J.K.I.; Hutton, E.W.H.; Hannon, M.T.; Brakenridge, G.R.; Day, J.; Vörösmarty, C.; Saito, Y.; Giosan, L.; Nicholls, R.J. Sinking deltas due to human activities. Nat. Geosci. 2009, 2, 681–686. [Google Scholar] [CrossRef]
- Church, J.A.; Clark, P.U.; Cazenave, A.; Gregory, J.M.; Jevrejeva, S.; Levermann, A.; Merrifield, M.A.; Milne, G.A.; Nerem, R.S.; Nunn, P.D. Sea level change. In Climate Change 2013: The Physical Science Basis; Cambridge University Press: Cambridge, UK; New York, NY, USA, 2013. [Google Scholar]
- Ranger, N.; Reeder, T.; Lowe, J. Addressing ‘deep’ uncertainty over long-term climate in major infrastructure projects: Four innovations of the Thames Estuary 2100 Project. EURO J. Decis. Process. 2013, 1, 233–262. [Google Scholar] [CrossRef]
- The City of New York. A Stronger, More Resilient New York; PlaNYC: New York, NY, USA, 2013; pp. 1–2. [Google Scholar]


| Exposed Asset [Billion CNY] | Return Periods [Years] | |||
|---|---|---|---|---|
| 200 | 500 | 1000 | 5000 | |
| Residential buildings | 668.6 | 1893.6 | 2793.5 | 5871.8 |
| Household properties | 34.9 | 87.4 | 131.0 | 288.6 |
| Total | 703.5 | 1981.0 | 2924.5 | 6160.4 |
| Economic Losses [Billion CNY] | Return Periods [Years] | |||
|---|---|---|---|---|
| 200 | 500 | 1000 | 5000 | |
| Residential buildings | 21.7 | 71.4 | 116.0 | 268.1 |
| Household properties | 8.0 | 24.2 | 38.6 | 97.9 |
| Total | 29.7 | 95.6 | 154.6 | 366.0 |
© 2019 by the authors. Licensee MDPI, Basel, Switzerland. This article is an open access article distributed under the terms and conditions of the Creative Commons Attribution (CC BY) license (http://creativecommons.org/licenses/by/4.0/).
Share and Cite
Shan, X.; Wen, J.; Zhang, M.; Wang, L.; Ke, Q.; Li, W.; Du, S.; Shi, Y.; Chen, K.; Liao, B.; et al. Scenario-Based Extreme Flood Risk of Residential Buildings and Household Properties in Shanghai. Sustainability 2019, 11, 3202. https://doi.org/10.3390/su11113202
Shan X, Wen J, Zhang M, Wang L, Ke Q, Li W, Du S, Shi Y, Chen K, Liao B, et al. Scenario-Based Extreme Flood Risk of Residential Buildings and Household Properties in Shanghai. Sustainability. 2019; 11(11):3202. https://doi.org/10.3390/su11113202
Chicago/Turabian StyleShan, Xinmeng, Jiahong Wen, Min Zhang, Luyang Wang, Qian Ke, Weijiang Li, Shiqiang Du, Yong Shi, Kun Chen, Banggu Liao, and et al. 2019. "Scenario-Based Extreme Flood Risk of Residential Buildings and Household Properties in Shanghai" Sustainability 11, no. 11: 3202. https://doi.org/10.3390/su11113202