Article

Exploring the Relationship between Environmental Impact and Nutrient Content of Sandwiches and Beverages Available in Cafés in a UK University

1
School of Health and Related Research, University of Sheffield, Sheffield S1 4DA, UK
2
Department of Corporate Information and Computing Services, University of Sheffield, Sheffield S10 2FN, UK
3
Department of Geography, University of Sheffield, Sheffield S3 7HQ, UK
4
Food and Nutrition Group, Sheffield Business School, Sheffield Hallam University, Sheffield S1 1WB, UK
*
Author to whom correspondence should be addressed.
Sustainability 2019, 11(11), 3190; https://doi.org/10.3390/su11113190
Submission received: 14 May 2019 / Revised: 3 June 2019 / Accepted: 5 June 2019 / Published: 7 June 2019
(This article belongs to the Special Issue Healthy Sustainable Diets)

Abstract

:
The threat of climate change and population growth has led to calls for the adoption of environmentally sustainable diets; however, concerns have been raised over the nutritional quality of low Greenhouse Gas Emission (GHGE) diets. This study examined the relationship between measures of environmental sustainability and nutrient content of sandwiches and beverages sold in a UK university café. GHGE and Water Footprint Impact Indicator (WFII) values for the ingredients of sandwiches and beverages were used with recipe information to calculate GHGE (gCO2e per portion) and WFIIs (scarcity weighted litres per portion). These estimates were then combined via orthogonal regression to produce a single Environmental Impact Score (EIS); higher scores equate to greater environmental impact. The relationship between EIS and nutrient content was explored using correlation analysis. Sandwiches that contained meat and animal products as well as beverages that contained milk, cocoa, and/or coffee had the highest EIS. EIS was positively associated with the portion size of sandwiches but not the serving size of beverages. EIS was positively correlated with calories, saturated fat, and sodium. However, EIS was also positively correlated with micronutrients: iron, calcium (beverages only), and B12 (beverages only). The choice of smaller or plant-based sandwiches as well as beverages without milk would reduce environmental impact as well as caloric and sodium intake. However, the selection of low impact options may also reduce the intake of nutrients required for good health. This study revealed possible tensions between nutritional quality and environmental sustainability.

1. Introduction

There is growing concern over the environmental impact of food production and consumption. Greenhouse Gas Emissions (GHGE) arise at each stage of the food chain: farming, processing, transport, storage, cooking, and disposal [1]. The agri-food sector accounts for 19–29% of global GHGE [2], the majority of which occur during agricultural production through the application of inorganic fertilisers, fossil fuel use, and methane emissions from ruminant animal production [3]. In addition, current farming methods have other negative environmental impacts, such as biodiversity loss and water use.
Approximately 92% of the global water footprint is attributed to agricultural production [4]. Withdrawal of water from rivers and aquifers for food production can limit water supplies and ecosystem biodiversity. Excessive irrigation of farmed land can reduce soil fertility and cause fertilizer runoff, which pollutes water systems [5]. The globalisation of the food system means that much of the food consumed in the UK is produced in countries overseas, such that 63% of the UK’s total water footprint is accounted for by water used in other regions [6]. Such water use is of particular concern in regions where water is scarce [7]. There is also growing pressure on the agro-food industry to reduce water consumption.
However, environmental targets cannot be attained by changes in agricultural practices alone; changes in food consumption patterns are needed [8]. Studies exploring GHGE and water footprints associated with food consumed in the UK have noted that meat and animal products account for the majority of food-related GHGE [9]. Therefore, a reduction in consumption of meat and animal protein, in combination with an increase in the consumption of plant food, has been proposed [10]. Current UK dietary patterns do not meet recommendations for nutritional health, with average intakes of saturated fat, free sugars, and salt above the maximum recommendations; concurrently, average intakes of fibre and some micronutrients fall below minimum recommendations [11]. This nutrient intake profile reflects food consumption patterns weighted towards a higher intake of processed foods and animal products and a low intake of plant foods. Therefore, a shift in dietary patterns has potential to address both health and environmental goals. On the other hand, concerns have been raised over the nutritional quality of diets with low environmental impact [12,13,14]. Low GHGE diets have been associated with lower intakes of calcium, B12, zinc, and iron in some instances. These dietary studies have focused on the nutrient profile of low GHGE diets; water use has not been considered. The consideration of both water use and GHGE will help to gain a better understanding of the broader environmental impact of commonly consumed food.
In 2015, 10.7% of daily energy intake in the UK was from food prepared and consumed outside the home [15]. Frequent consumption of food eaten outside the home is linked to weight gain and unhealthy dietary habits [16]. Catering outlets in the public sector, such as schools and universities, have been proposed as sites to foster more sustainable dietary habits of their employees, students, and visitors [17]. Public health interventions often use canteen settings to encourage healthier food choices with positive behaviour change results [18]. However, data on the implications of environmentally friendly choices on nutrient intakes remain unavailable.
Sandwiches comprise a large proportion of food consumed outside the home in Britain, with four billion pre-packed sandwiches sold in 2018 [19]. Furthermore, out-of-home consumption of non-alcoholic beverages continues to rise, with sales of coffee products alone generating an estimated turnover of £3.2 billion pounds [20]. There has been insufficient research about the environmental impact associated with the consumption of these choices [21,22]. The few studies that have explored the relationship between environmental impact and nutrition have considered the effect on climate [22,23] but have not investigated the impact of fresh water use. The aim of this study was to examine the relationship between the environmental impact (GHGE and water use) and the nutrient content of sandwiches and beverages commonly consumed in cafés in a UK university to explore whether choosing low impact options would affect nutrient intake.

2. Materials and Methods

2.1. Quantifying Product Servings and Ingredients

The study was conducted at the University of Sheffield, which employs 7802 members of staff and has 24,997 full-time students [24]. There are 18 different university-owned food outlets located in different faculties across the campus that vary in size and style, e.g., fast food, high street café, dining hall, and pub. The majority of available food outlets are cafés that sell a selection of hot and cold food in addition to beverage options. This analysis focused on pre-packaged sandwiches (11% of total annual sales for 2014–2015) and beverages (43% of total annual sales for 2014–2015).
Portion size (weight) and constituent ingredient information for all available pre-packaged sandwiches and beverages were obtained. Ingredient information for sandwiches was provided by the supplier Sandwich King (Leeds, UK). Catering staff provided details of the composition of beverages prepared in-house (coffees, smoothies, milk-based beverages, teas). For each beverage type, weights of shots of coffee and the weights (to the nearest gram) of beverage powders (e.g., hot chocolate, frappe latté powder, chai latté powder) were measured using a digital scale (GenWare, model number EK03B-5, Neville PLC, Kent). Three measurements of each beverage were taken and the average calculated. The weight and composition of the pre-packed frozen fruit used in the smoothies was obtained from the supplier’s website. Weight information was obtained from the manufacturers’ labels for pre-packaged beverages (for example, Coca-Cola, Oasis).

2.2. Product Environmental Impact Scores and Nutrient Content

2.2.1. Calculation of Greenhouse Gas Emission Estimates

A database of GHGE estimates of foods commonly consumed in the UK [25] was used to calculate GHGE values for each sandwich. The database provided measures as kgCO2e per 100 g of food, (kg of GHG weighted by global warming potential over a 100-year time frame, with carbon dioxide weighted as 1, methane weighted as 25, and nitrous oxide weighted as 298) per 100 g of food. A detailed explanation as to the derivation of these values is given in the original report by [25]. GHGE estimates for beverages were calculated using three different datasets: Scarborough et al. [25], Tesco Ltd. [26] and Coca-cola [27]. For bottled soft drinks (water, sparkling water, fruit juice), the mean GHGE values for equivalent products available in the Tesco and Coca-Cola datasets were used. A GHGE value for tap water was also estimated from a government document which reports a value of 0.271 gCO2eML-1 [28]. This estimate was used to calculate the impact of water and ice that were ingredients of beverages made in-house. Scarborough’s dataset was derived from life-cycle assessments (LCA) in which the system boundary was the early agricultural phase to the regional distribution centre. The Coca-Cola and Tesco products data were based on life-cycle assessments where the system boundary was from cradle to grave, i.e., from raw material production to waste disposal and recycling. The GHGE for tap water was derived from an LCA study where the system boundary included water source abstraction and conveyance, water treatment, water distribution, water in the home, and wastewater treatment [28].
These GHGE values were converted into gCO2eg−1. The gram weight of each beverage and sandwich component ingredient was multiplied by the GHGE (gCO2eg−1) value for that food. A nearest equivalent was used for foods that were missing from the database; for example, tortilla wraps were calculated as white bread. Ingredients weighing ≤ 1 g were excluded from the calculation. The total GHGE per sandwich portion or beverage serving was calculated from the sum of the constituent ingredient GHGE estimates.

2.2.2. Calculation of Water Footprint Estimates

A database of Water Footprint Impact Indicators (WFII) associated with UK supermarket food products was obtained [29]. These values, measured as scarcity-weighted litres kg−1, are based on the Water Footprint Network data that have been weighted by a water scarcity score according to the country in which they originated. A detailed explanation as to the derivation of these values is given in the original report [29]. There is no WFII data for seafood products provided in this report. Life cycle stages included in the assessment were the raw material production, packaging production, and manufacture of the finished product.
The WFII estimates were converted into scarcity-weighted litres g−1. The gram weight of each sandwich or beverage ingredient was multiplied by the WFII value for the equivalent food product. The nearest equivalent food was used for foods that were missing from the database; for example, iceberg lettuce was calculated as ‘other field veg’. The total water footprint of sandwich per portion or beverage per serving was calculated from the sum of the constituent ingredient WFII estimates.

2.3. Nutrient Data

Nutrient information was obtained from the supplier’s specification for each sandwich portion. Nutrient analysis software NetWISP V4.0 (Tinuviel Software, Warrington, England) was used to calculate the nutritional content of each beverage. This software consolidates the nutrient composition data from UK Office of Public Sector Information (OPSI): McCance and Widdowson’s The Composition of Foods [30].
The weight of each ingredient was inputted as a recipe and the nutrient content of the final beverage was computed for beverages that were made on site. For pre-packaged beverages, the product was found in the NetWISP database, and the serving weight of the product was inputted to calculate the nutritional information for that serving size. When a specific product did not exist in the database, a nearest equivalent was used. Nutrient information for Glaceau water and bottled mineral water were taken from the product labels. It was assumed that beverages were made using whole milk because that was the default option used by caterers to prepare beverages in-house.

2.4. Categorisation of Sandwiches and Beverages

The sandwiches were categorised by filling type: ‘vegetables’, ‘eggs,’ ‘cheese (only)’, ‘fish’, ‘poultry’, ‘pork’, ‘beef’, ‘cheese & meat’ and ‘mixed meat’. The beverages were categorised according to whether they were ‘bottled water’, ‘coffee (milk-based)’, ‘coffee (water-based)’, ‘fruit juice’, ‘other (milk-based)’, ‘smoothie’, ‘soft drink’, ‘tea’. These broad categories were used as labels in the analysis.

2.5. Environmental Impact Score

An environmental impact score (EIS) was then calculated for each item by combining GHGE and WF estimates using Principle Component Analysis (PCA). The PCA used the correlation matrix of the raw standardized GHGE and WF estimates; only a single component was extracted. The relationship between GHGE values and WF values was depicted graphically according to sandwich and beverage type using the orthogonal regression line as a boundary to provide the EIS. EIS data were then plotted against raw data using the ggplot2 plotting system in RStudio Inc. version 1.0.153 (2009–2017).
Spearman’s correlations were used to assess relationships between EIS and nutrient content. Rho values were used to indicate the strength of correlation. A weak correlation was defined as r = 0.1–0.29, a medium correlation as r = 0.30–0.49, and a strong correlation as r = 0.5–1 [31]. SPSS V22.0 (SPSS Statistics, IBM, New York) was used for all statistical analyses.

3. Results

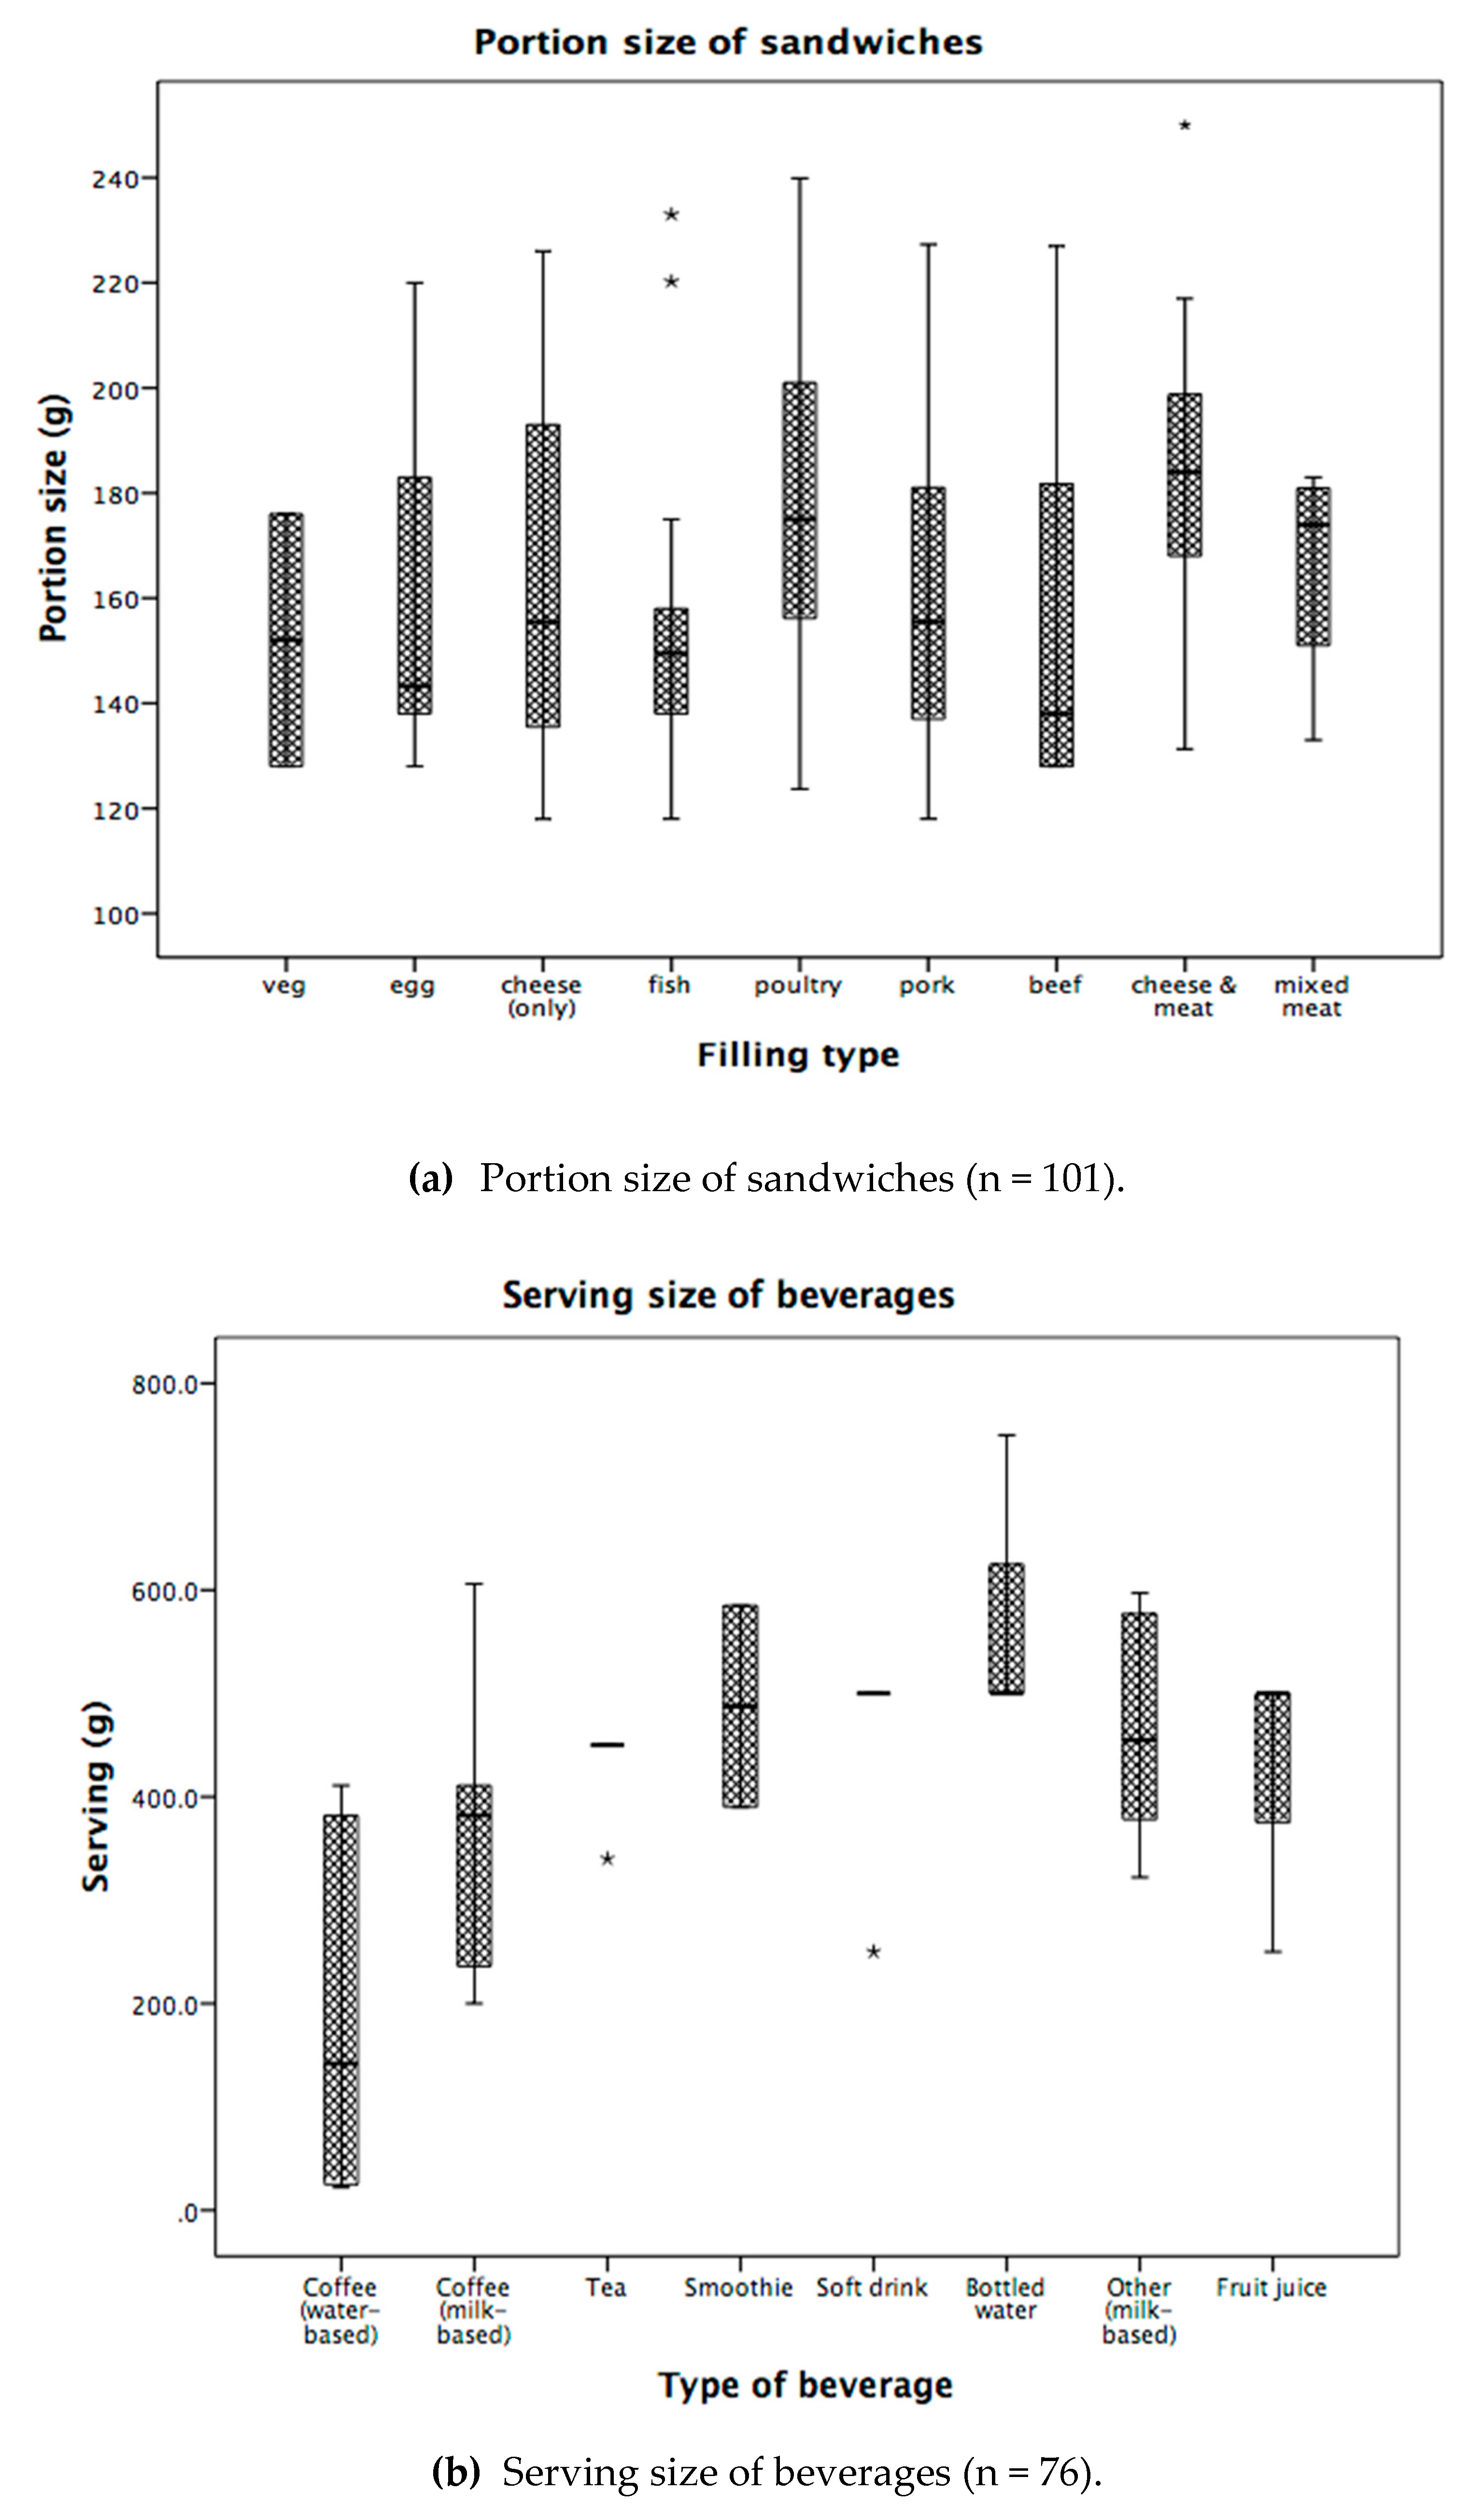
3.1. Sandwich and Beverage Characteristics

Table 1 and Table 2 summarise the energy, nutrient, GHGE, and WFII estimates of sandwiches and beverages by category, respectively.
The mean GHGE estimate of the sandwiches was higher than that of the beverages. The mean WFII estimate of the beverages was greater than that of the sandwiches. See supplementary material for GHGE and WFII data of sandwiches (Table S1) and beverages (Table S2).
There was considerable variation in portion size of the sandwiches (Figure 1a) and serving size of beverages (Figure 1b).

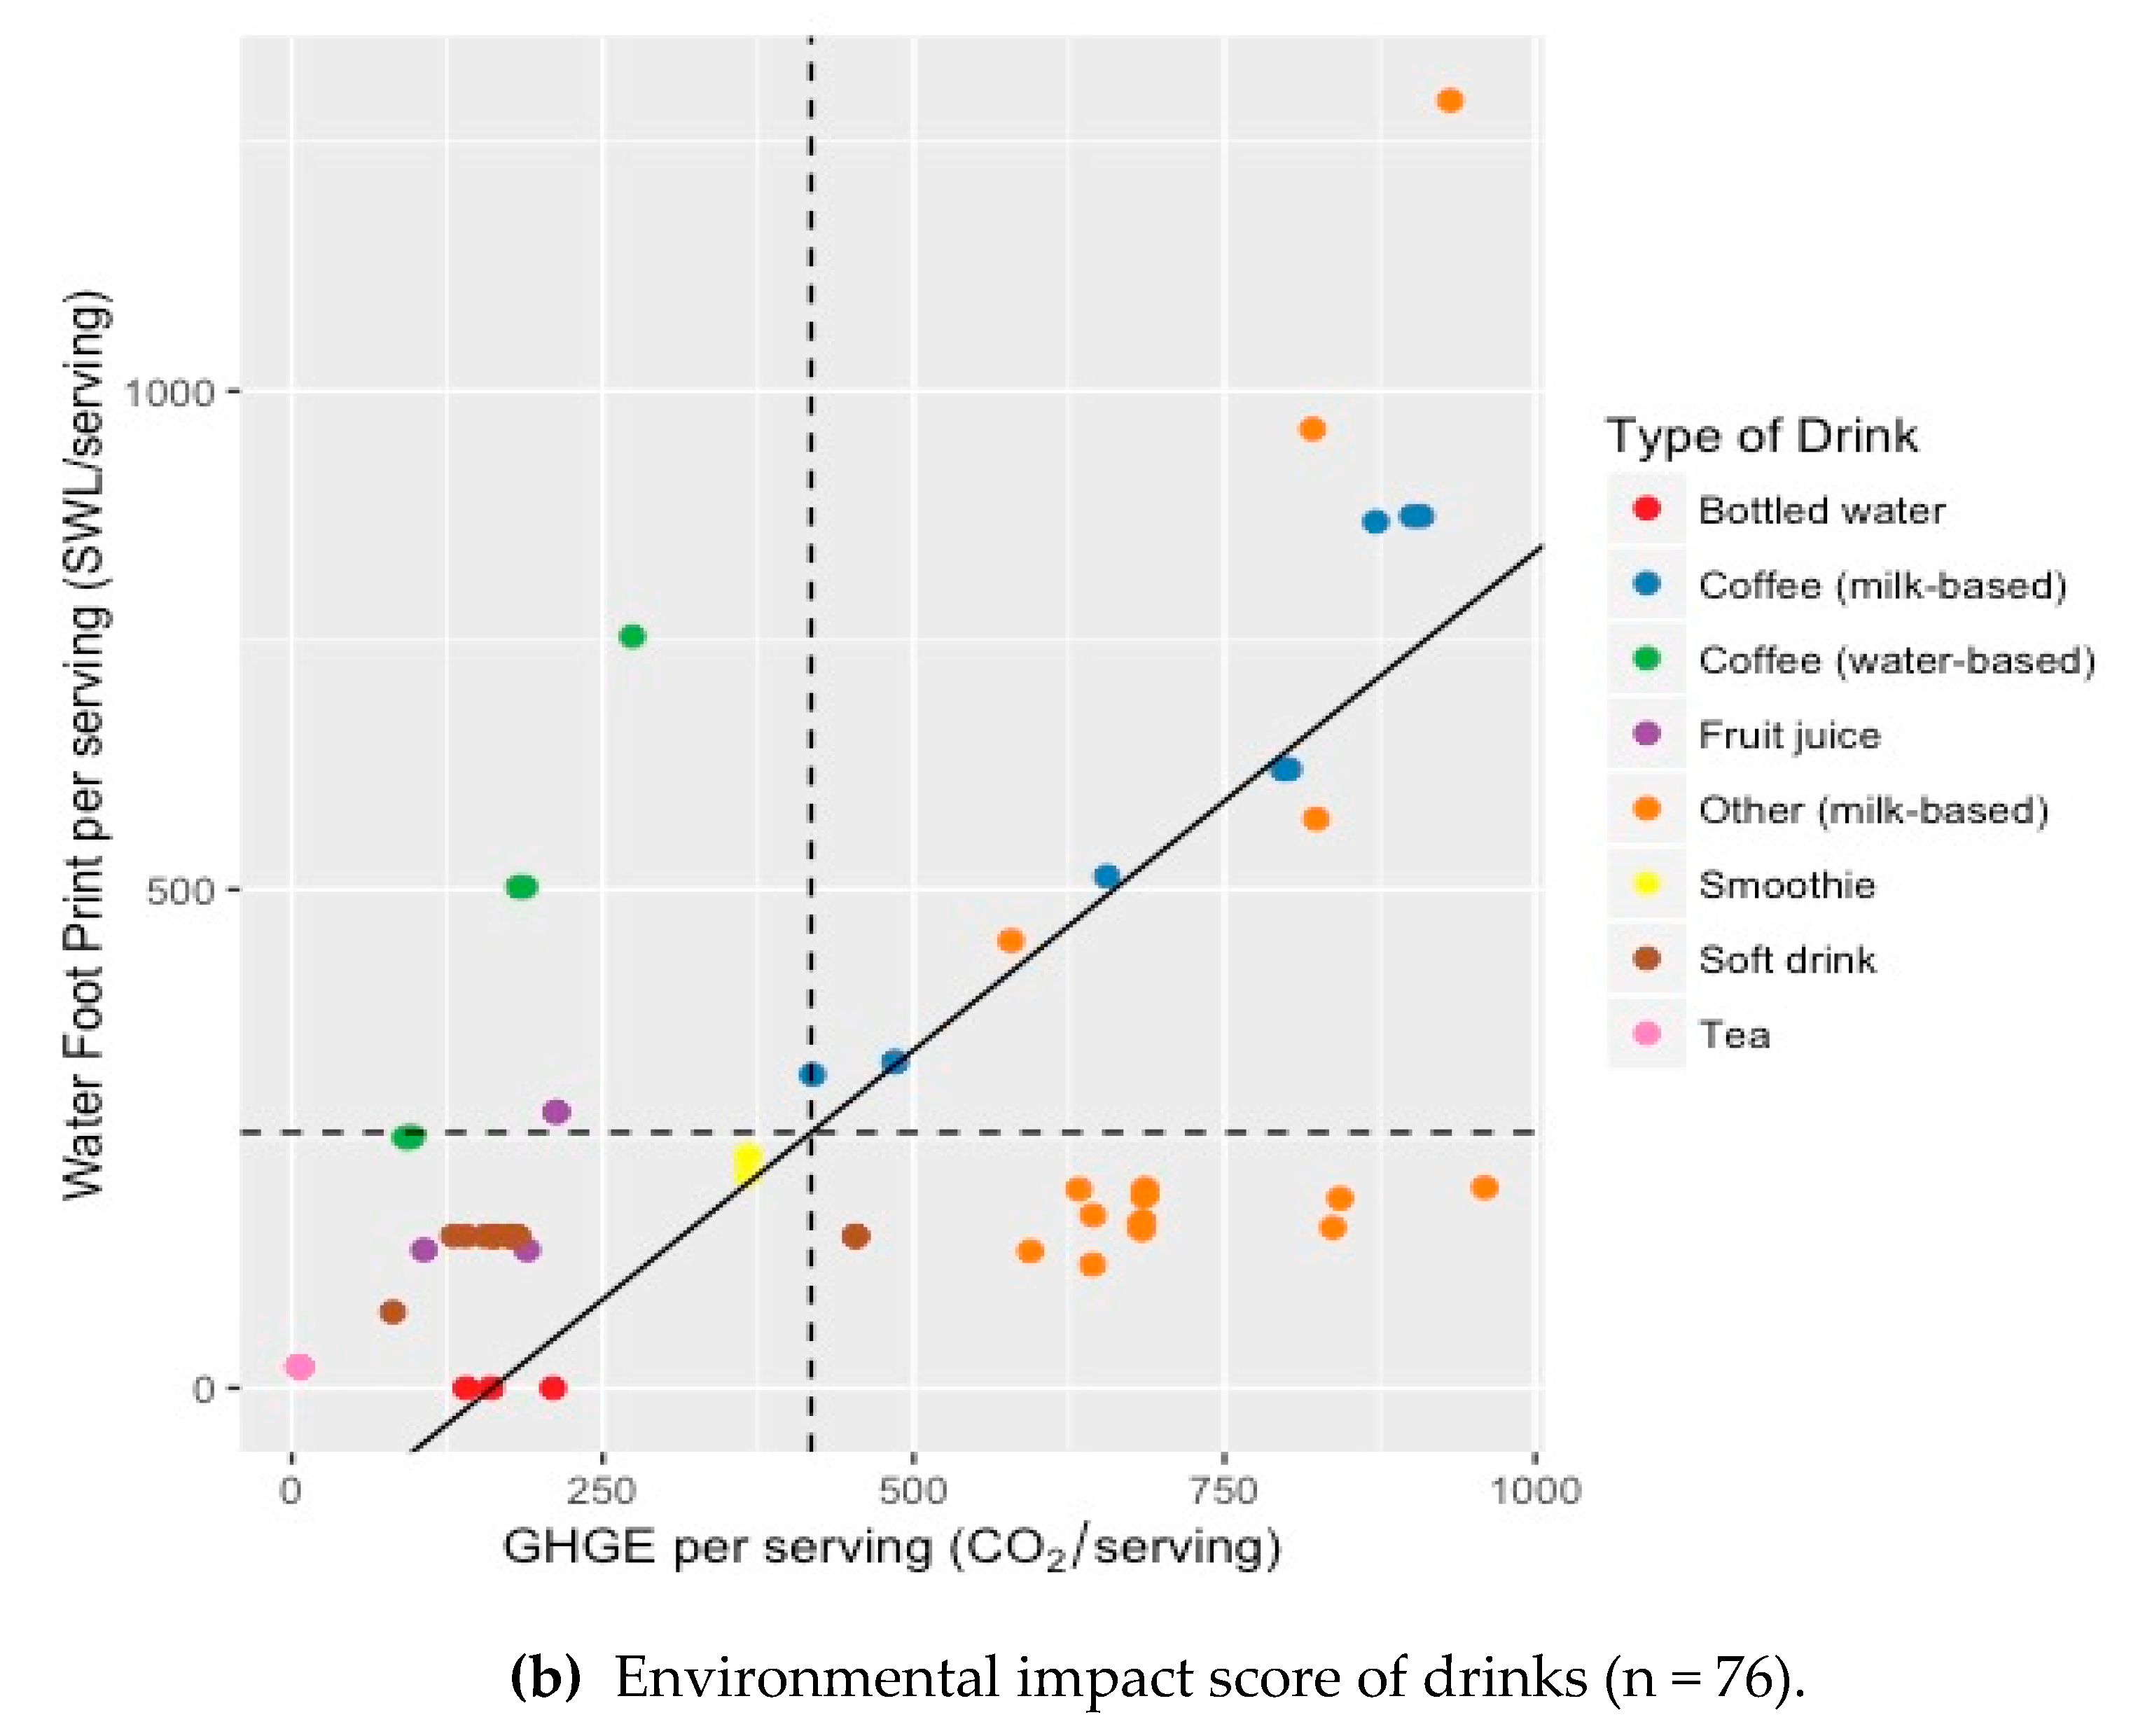
3.2. Environmental Impact of Café Sandwiches and Beverges

Figure 2 shows that there is a positive relationship between GHGE and WFII for sandwiches (a) and beverages (b). The line of the graph represents the first principle component extracted by PCA, i.e., the strongest pattern between these two correlated variables. However, there was considerable residual deviance in both directions, suggesting that one measure cannot be used as a proxy for the other, and that a combined score is required. The dotted horizontal and vertical lines on the graphs represent the mean score for GHGE and WFII. Thus, data points in the top right-hand quarter record high values for both GHGE and WFII. The majority of the values in the top quarter of the sandwich graph are beef-type sandwiches, with the equivalent quarter of the beverages graph comprising largely milk-based beverages. The bottom left-hand quarter of the graphs denote low values for both GHGE and WFII. The majority of points in this quarter on the sandwich graph are vegetable-based sandwiches, with the equivalent quarter of the beverage graph comprising mainly bottled water and teas without milk.

3.3. Relationship between Environmental Impact Score and Nutrient Content

Table 3 reports the relationship between EIS with energy and nutrient content of sandwiches and beverages. The EIS of the sandwiches was strongly correlated with sodium and moderately correlated with calories, protein, carbohydrates, total fat, saturated fat, iron, and non-milk extrinsic sugars (NMES) (all p < 0.001) There was no correlation between EIS and calcium or fibre. The sandwich product specification did not report vitamin B12 content; however, it was assumed that EIS would be correlated with vitamin B12 content because it is only found in animal products. EIS of the beverages was strongly correlated with protein, total fat, saturated fat, sodium, calcium, and vitamin B12 and moderately correlated with carbohydrate and iron (all p < 0.01). There was no statistically significant relationship between EIS and NMES or fibre. EIS was significantly positively associated with sandwich pack weight (g) (rs (101) = 0.44, p < 0.01 but not serving size of beverages (rs (76) = −0.10, p = 0.933).

4. Discussion

This investigation examined the relationship between the environmental impact and nutrient content of popular café food and beverage choices. An EIS, based on GHGE and WFII estimates, was calculated and used to identify café choices with the greatest and lowest environmental impact. Exploration of the relationship between EIS and nutrient content indicates that making a food and beverage café choice with a lower environmental impact could reduce calorie and nutrient intake, which may have implications on health.
The majority of studies exploring dietary change for the environment have focused on a single environmental impact parameter, predominantly GHGE [32]. In this study, we used a novel approach to assess how choice of sandwich and beverage could affect both water use and GHGE. The findings of this study contribute to a broader understanding of the environmental impact of popular food and beverages consumed in the UK. Having a single scoring system helps to simplify the complex interaction among environmental impact parameters and may reduce the number of trade-offs customers would otherwise be presented with at point of purchase. Moreover, we calculated the EIS based on GHGE and WFII estimate per portion, which is potentially the most helpful way to compare the environmental impact of café options. This has been shown to be a more helpful method in comparison with measuring impact by weight (g) or energy (kcal), which can dramatically influence the interpretation of results [23].
Café sandwiches and beverages that contained animal products had the highest EIS. This is consistent with the findings of Chen et al. [33], who measured the GHGE, land, and water use associated with the meals served in a university cafeteria in Canada. Study results found that meals containing beef and cheese had the greatest environment impact; in contrast, the vegan dishes required the least amount of water and land. This is in accordance with the literature that indicates that livestock production carries the highest environmental burden [34,35]. Furthermore, there was a clear gradient in sandwich EIS according to meat type filling, with beef having the greatest impact followed by pork and chicken. This reflects differences in the environmental impacts associated with the production of different livestock types [36,37,38]. The results of this investigation support the conclusion that a reduced intake of meat and animal products, particularly from ruminant animals, is favourable in terms of environmental reasons [39,40,41,42]. It also reaffirms that not all meat is equal in terms of its environmental impact [36,42] and that it is not necessary to avoid all meat choices to reduce the environmental impact of lunchtime meals.
This study has revealed the important contribution that dairy products make to the overall environmental impacts of café food and beverages, which is consistent with the findings of others [33,43]. Chen et al. [33] found food dishes in a university cafeteria containing cheese had an impact between two to 12 times greater than other dishes containing chicken or eggs; chicken or egg dishes had a comparable or lower impact than dishes with plant-based ingredients. Cheese is often used as a substitute for meat, and most of the vegetarian sandwiches available in the university cafés contained cheese. Espinoza-Orais and Azapagic 2018 [21] investigated the carbon footprint of a selection of sandwiches and found that egg sandwiches had a lower GHGE in comparison with sandwiches that contained cheese. These findings are consistent with the results of our study, suggesting that substituting beef and cheese sandwich fillings with lower impact protein sources, such as with chicken or egg, would be more environmentally beneficial.
Choosing café options with a lower environmental impact may incur positive health outcomes by helping to reduce overall intake of calories, sodium, saturated fat, and NMES (sandwiches only), the consumption of which currently exceeds the amount recommended for health [11]. However, EIS was also positively correlated with calcium (beverages only), iron, and vitamin B12 (beverages only), which have important physiological roles in bone strength, oxygen transportation, and DNA synthesis, respectively. Choosing low-impact sandwiches and beverages may also reduce intake of these micronutrients, which could have negative implications for health. Size of sandwich also positively correlated with EIS; accordingly, choosing smaller sandwiches may also reduce nutrient and calorie intake. Size of beverage was not correlated with EIS, which suggests that it is the type of beverage, specifically whether it contains milk, which determines the extent of its environmental impact. There was no relationship between EIS and NMES content of beverages because sugar has a low environmental impact score when compared with milk. Choosing a milk-based beverage over a sugar-sweetened beverage is more advantageous for health but less environmentally friendly. Together, these findings highlight possible tensions between nutritional quality and the environmental sustainability of food choices.
Our results are consistent with other studies, which found that foods and beverages associated with low GHGE contained fewer nutrients whilst foods with higher GHGE were more nutrient dense [22,23,44]. However, unlike Drewnowski et al. 2015 [23], our study revealed a positive correlation between calorie content and EIS, indicating that low-impact choices were less energy dense. This discrepancy may stem from the fact that our study focused on sandwiches and beverages only; Drewnowski et al. 2015 compared a broad range of food groups that have more varied nutrient and energy profiles. This study explored the relationship between environmental impact and nutrient content of a small number of commonly consumed cafe options. It did not measure customers’ dietary intake; therefore, it is not possible to conclude what the individual effect on nutritional intake and health outcomes would be from choosing lower environmental impact options. Nevertheless, our results support the finding that low GHGE diets are associated with increased intakes of NMES and lower intakes of micronutrients, particularly calcium and vitamin B12 [12]. Similarly, self-selected diets that are low in GHGE have been found to contain more free sugars and fewer micronutrients [45]. These studies have only considered the impact on climate. Although our study also accounted for water use, it still supports their conclusion that choosing food with a lower environmental impact may affect nutrient intakes.
Only two environmental impact parameters were included in the calculation of the EIS of café options in this study. Additional impact parameters, such as land use, should be included to better understand the relationship between environmental impact and nutrient content of food. However, comprehensive life-cycle assessment data for specific foods as consumed is limited. Environmental impacts measurements used in this study were derived from multiple LCA studies that had different system boundaries (some of which excluded post farm-gate impacts); therefore, the values calculated are likely to underestimate the environmental impacts of these products. However, of all the life-cycle stages of food, the agricultural phase is known to have the greatest environmental impact. Espinoza-Orias and Azapagic 2018 [21] found that the agricultural production of sandwich ingredients contributes the most (37.3–67.1%) to the total carbon footprint of the sandwich; however, other important phases include the preparation (13.1–24.6%) and refrigeration of the sandwich during the retail stages (12.4–24.2%). Therefore, these data provide a good indication of the relative environmental impacts of café food and beverage options despite the inaccuracy of specific values. It is the ranking of the café choice in relation to each other than has the greatest application in this study. A further limitation is that the dataset used in this study did not include WFII values for fish or seafood. The WFII data for seafood sandwiches are inherently underestimates because they do not include impacts associated with all the components of the sandwich, thus conclusions drawn with respect to seafood sandwiches are made with caution.
For catering establishments to foster healthy and sustainable dietary choices, it is important to identify food and beverages that have both a low environmental cost and are nutritionally optimal for health. They must also take into account factors driving the consumption of these choices, such as taste and convenience. Further studies to examine the effects of choosing low-impact food and beverages on nutrient intakes are warranted. This analysis was specific to the sandwich offered in the cafés under study and the variety of plant-based sandwiches offered was limited. Some plant-based meat alternatives incur considerable environmental impact during their production and could have the same impact as foods with animal products [46]. The majority of café options in this study contained animal products, suggesting that changes in food procurement may be necessary to enable consumers to choose low-impact options. This is consistent with the findings of a survey of UK retail outlets [19]. This study highlights the important role the catering sector has in supporting the shift towards diets that are healthier and more environmentally friendly.

5. Conclusions

In conclusion, we used a novel approach to assess the broader environmental impacts of café sandwich and beverages choices. We found that sandwiches that are plant-based and smaller in size as well as beverages without milk have the lowest impact score. Analysis of the nutrient content of these options has revealed that choosing café options with a lower environmental impact may have health benefits in terms of reducing calorie and sodium intake. However, these sandwich and beverage choices have fewer micronutrients such as iron. Catering establishments ought to procure and promote low environmental impact options that also have a good nutritional profile when striving to implement strategies to support the consumption of healthy and environmentally sustainable choices.

Supplementary Materials

The following are available online at https://www.mdpi.com/2071-1050/11/11/3190/s1, Table S1: Sandwiches (n = 101) listed in ascending order of environmental impact score. Table S2: Beverages (n = 76) listed in ascending order of environmental impact score.

Author Contributions

F.G., J.R., M.H., M.M., M.B. designed the study. F.G. collected the data and performed the calculations. F.G., J.R. analysed the data. F.G., J.R., M.H., M.M., M.B. interpreted the results. F.G. drafted the manuscript. F.G., J.R., M.H., M.M. and M.B. revised the content and approved the manuscript for publication.

Funding

This research and the APC was funded by the Grantham Institute for the Protection of the Environment via the University of Sheffield’s Grantham Centre for Sustainable Futures.

Acknowledgments

We would like to thank the University of Sheffield’s Catering Service for supporting this research. We would like to thank Christian Reynolds for his comments on the final draft of this manuscript.

Conflicts of Interest

The authors declare no conflict of interest. The funders had no role in the design of the study; in the collection, analyses, or interpretation of data; in the writing of the manuscript, or in the decision to publish the results.

References

  1. Garnett, T. Cooking up a Storm. Food, Greenhouse Gas Emissions and Our Changing Climate; Food Climate Research Network: Guildford, UK, 2008. [Google Scholar]
  2. Vermeulen, S.J.; Campbell, B.M.; Ingram, J.S.I. Climate Change and Food Systems. Annu. Rev. Environ. Resour. 2012, 37, 195–222. [Google Scholar] [CrossRef] [Green Version]
  3. Nijdam, D.; Rood, T.; Westhoek, H. The price of protein: Review of land use and carbon footprints from life cycle assessments of animal food products and their substitutes. Food Policy 2012, 37, 760–770. [Google Scholar] [CrossRef]
  4. Hoekstra, A.Y.; Mekonnen, M.M. The water footprint of humanity. Proc. Natl. Acad. Sci. USA 2012, 109, 3232–3237. [Google Scholar] [CrossRef] [PubMed] [Green Version]
  5. FAO. The State of the World’s Land and Water Resources for Food and Agriculture; Food and Agriculture Organization of the United Nations: London, UK, 2011; Volume 54. [CrossRef]
  6. Mekonnen, M.; Hoekstra, A. National Water Footprint Accounts: The Green, Blue and Grey Water Footprint of Production and Consumption; Unesco-IHE Institute for Water Education: Delft, The Netherlands, 2011; Volume 1. [Google Scholar]
  7. UNEP. Water Footprint and Corporate Water Accounting for Resource Efficiency; United Nations Environment Programme (UNEP): Nairobi, Kenya, 2011.
  8. Bajželj, B.; Richards, K.S.; Allwood, J.M.; Smith, P.; Dennis, J.S.; Curmi, E.; Gilligan, C.A. Importance of food-demand management for climate mitigation. Nat. Clim. Chang. 2014, 4, 924–929. [Google Scholar] [CrossRef] [Green Version]
  9. Audsley, E.; Brander, M.; Chatterton, J.C.; Murphy-Bokern, D.; Webster, C.; Williams, A.G. How Low Can We Go? An Assessment of Greenhouse Gas Emissions from the UK Food System and the Scope Reduction by 2050. Report for the WWF and Food Climate Research Network; Cranfield University: Cranfield, UK, 2010. [Google Scholar]
  10. Green Food Project; DEFRA. Sustainable Consumption Report Follow-up to the Green Food Project; The National Archives: London, UK, 2013.
  11. Roberts, C.; Steer, T.; Maplethorpe, N.; Cox, L.; Meadows, S.; Nicholson, S.; Page, P.; Swan, G. National Diet and Nutrition Survey: Results from Years 7 and 8 (combined) of the Rolling Programme (2014/2015–2015/2016). Public Health Engl. 2018, 8, 1–31. [Google Scholar]
  12. Payne, C.L.; Scarborough, P.; Cobiac, L. Do low-carbon-emission diets lead to higher nutritional quality and positive health outcomes? A systematic review of the literature. Public Health Nutr. 2016, 19, 2654–2661. [Google Scholar] [CrossRef] [PubMed]
  13. Vieux, F.; Darmon, N.; Touazi, D.; Soler, L.G. Greenhouse gas emissions of self-selected individual diets in France: Changing the diet structure or consuming less? Ecol. Econ. 2012, 75, 91–101. [Google Scholar] [CrossRef]
  14. Green, R.; Milner, J.; Dangour, A.D.; Haines, A.; Chalabi, Z.; Markandya, A.; Spadaro, J.; Wilkinson, P. The potential to reduce greenhouse gas emissions in the UK through healthy and realistic dietary change. Clim. Chang. 2015, 253–265. [Google Scholar] [CrossRef]
  15. DEFRA. Food Statistics Pocketbook 2016; Department for Environment, Food & Rural Affairs: London, UK, 2016.
  16. Seguin, R.A.; Aggarwal, A.; Vermeylen, F.; Drewnowski, A. Consumption Frequency of Foods Away from Home Linked with Higher Body Mass Index and Lower Fruit and Vegetable Intake among Adults: A Cross-Sectional Study. J. Environ. Public Health 2016, 2016, 3074241. [Google Scholar] [CrossRef]
  17. Wahlen, S.; Heiskanen, E.; Aalto, K. Endorsing Sustainable Food Consumption: Prospects from Public Catering. J. Consum. Policy 2012, 35, 7–21. [Google Scholar] [CrossRef]
  18. Arno, A.; Thomas, S.; Avenell, A.; Forster, M.; Veerman, J.; Barendregt, J.; Vos, T.; Thaler, R.; Sunstein, C.; Blumenthal-Barby, J.; et al. The efficacy of nudge theory strategies in influencing adult dietary behaviour: A systematic review and meta-analysis. BMC Public Health 2016, 16, 676. [Google Scholar] [CrossRef] [PubMed]
  19. Salazar, E.; Marchionne, L.; Breen, M. Sandwiches Unwrapped 2019; The Food Foundation: London, UK, 2019. [Google Scholar]
  20. British Coffee Association. The UK Coffee Market and Its Impact on the Economy. A Report for the British Coffee Association; British Coffee Association: London, UK, 2018. [Google Scholar]
  21. Espinoza-Orias, N.; Azapagic, A. Understanding the impact on climate change of convenience food: Carbon footprint of sandwiches. Sustain. Prod. Consum. 2018, 15, 1–15. [Google Scholar] [CrossRef] [Green Version]
  22. Smedman, A.; Lindmark-Månsson, H.; Drewnowski, A.; Edman, A.K.M. Nutrient density of beverages in relation to climate impact. Food Nutr. Res. 2010, 54, 5170. [Google Scholar] [CrossRef] [PubMed]
  23. Drewnowski, A.; Rehm, C.D.; Martin, A.; Verger, E.O.; Voinnesson, M.; Imbert, P. Energy and nutrient density of foods in relation to their carbon footprint. Am. J. Clin. Nutr. 2015, 101, 184–191. [Google Scholar] [CrossRef] [PubMed]
  24. The University of Sheffield Facts and Figure. Available online: https://www-online.shef.ac.uk/pls/apex/f?p=136:1 (accessed on 6 June 2017).
  25. Scarborough, P.; Appleby, P.N.; Mizdrak, A.; Briggs, A.D.M.; Travis, R.C.; Bradbury, K.E.; Key, T.J. Dietary greenhouse gas emissions of meat-eaters, fish-eaters, vegetarians and vegans in the UK. Clim. Chang. 2014, 179–192. [Google Scholar] [CrossRef] [PubMed]
  26. Tesco Ltd. Product Carbon Footprint Summary; Tesco Ltd.: Welwyn Garden City, UK, 2012. [Google Scholar]
  27. Coca-Cola What’s the Carbon Footprint of Coca-Cola? Available online: http://www.coca-cola.co.uk/packages/sustainability/whats-the-carbon-footprint-of-a-coca-cola (accessed on 20 February 2012).
  28. Reffold, E.; Leighton, F.; Choudhury, F.; Rayner, P.S. Greenhouse Gas Emissions of Water Supply and Demand Management Options; Environment Agency: Bristol, UK, 2008. [Google Scholar]
  29. Fisher, K.; James, K.; Sheane, R.; Nippress, J.; Allen, S.; Cherrualt, J.-Y.; Fishwick, M.; Littlywhite, R.; Sarrouy, C. An Initial Assessment of the Environmental Impact of Grocery Products; Waste and Resources Action Programme: Banbury, UK, 2013. [Google Scholar]
  30. Food Standards Agency; Roe, M.; Finglas, P.M.; Church, S. McCance and Widdowson’s the Composition of Foods, 5th ed.; Royal Society of Chemistry: Cambridge, UK, 2002; ISBN 9780854044283.
  31. Cohen, J. Statistical Power Analysis for the Behavioral Sciences, 2nd ed.; Lawrence Erlbaum Associates Inc.: Abingdon, UK, 1988; ISBN 0-8058-0283-5. [Google Scholar]
  32. Jones, A.D.; Hoey, L.; Blesh, J.; Miller, L.; Green, A.; Shapiro, L.F. A Systematic Review of the Measurement of Sustainable Diets. Adv. Nutr. Int. Rev. J. 2016, 7, 641–664. [Google Scholar] [CrossRef] [Green Version]
  33. Chen, D.M.; Tucker, B.; Badami, M.G.; Ramankutty, N.; Rhemtulla, J.M. A multi-dimensional metric for facilitating sustainable food choices in campus cafeterias. J. Clean. Prod. 2016, 135, 1351–1362. [Google Scholar] [CrossRef]
  34. Steinfeld, H. Livestock’s Long Shadow—Environmental Issues and Options; Food and Agriculture Organization of the United Nations: Rome, Italy, 2006; Volume 3, pp. 1–377.
  35. Gerber, P.J.; Steinfeld, H.; Henderson, B.; Mottet, A.; Opio, C.; Dijkman, J.; Falcucci, A.; Tempio, G. Opportunities, Tackling Climate Change Through Livestock: A Global Assessment of Emissions and Mitigation Opportunities; Food and Agriculture Organization of the United Nations: Rome, Italy, 2013.
  36. De Vries, M.; de Boer, I.J.M. Comparing environmental impacts for livestock products: A review of life cycle assessments. Livest. Sci. 2010, 128, 1–11. [Google Scholar] [CrossRef]
  37. Roy, R.; Beattie-Bowers, J.; Ang, S.M.; Colagiuri, S.; Allman-Farinelli, M. The Effect of Energy Labelling on Menus and a Social Marketing Campaign on Food-Purchasing Behaviours of University Students. BMC Public Health 2016, 16, 727. [Google Scholar] [CrossRef]
  38. Mekonnen, M.M.; Hoekstra, A.Y. The green, blue and grey water footprint of farm animals and animal products. Water Res. 2010, 1, 122. [Google Scholar]
  39. Westhoek, H.; Lesschen, J.P.; Rood, T.; Wagner, S.; De Marco, A.; Murphy-Bokern, D.; Leip, A.; van Grinsven, H.; Sutton, M.A.; Oenema, O. Food choices, health and environment: Effects of cutting Europe’s meat and dairy intake. Glob. Environ. Chang. 2014, 26, 196–205. [Google Scholar] [CrossRef]
  40. Horgan, G.W.; Perrin, A.; Whybrow, S.; Macdiarmid, J.I. Achieving dietary recommendations and reducing greenhouse gas emissions: Modelling diets to minimise the change from current intakes. Int. J. Behav. Nutr. Phys. Act. 2016, 13, 46. [Google Scholar] [CrossRef]
  41. Macdiarmid, J.I.; Kyle, J.; Horgan, G.W.; Loe, J.; Fyfe, C.; Johnstone, A.; McNeill, G. Sustainable diets for the future: Can we contribute to reducing greenhouse gas emissions by eating a healthy diet? Am. J. Clin. Nutr. 2012, 96, 632–639. [Google Scholar] [CrossRef] [PubMed]
  42. Hallström, E.; Röös, E.; Börjesson, P. Sustainable meat consumption: A quantitative analysis of nutritional intake, greenhouse gas emissions and land use from a Swedish perspective. Food Policy 2014, 47, 81–90. [Google Scholar] [CrossRef]
  43. Werner, L.B.; Flysjö, A.; Tholstrup, T. Greenhouse gas emissions of realistic dietary choices in Denmark: The carbon footprint and nutritional value of dairy products. Food Nutr. Res. 2014, 58, 20687. [Google Scholar] [CrossRef]
  44. Masset, G.; Soler, L.-G.; Vieux, F.; Darmon, N. Identifying sustainable foods: The relationship between environmental impact, nutritional quality, and prices of foods representative of the French diet. J. Acad. Nutr. Diet. 2014, 114, 862–869. [Google Scholar] [CrossRef]
  45. Vieux, F.; Soler, L.G.; Touazi, D.; Darmon, N. High nutritional quality is not associated with low greenhouse gas emissions in self-selected diets of French adults. Am. J. Clin. Nutr. 2013, 97, 569–583. [Google Scholar] [CrossRef] [Green Version]
  46. Smetana, S.; Mathys, A.; Knoch, A.; Heinz, V. Meat alternatives: Life cycle assessment of most known meat substitutes. Int. J. Life Cycle Assess. 2015, 20, 1254–1267. [Google Scholar] [CrossRef]
Figure 1. The whiskers indicate the range of non-outliers, the horizontal lines represents the median value, and the shaded boxes represent the interquartile range. The asterisks denote outliers in the sample that were more than 1.5 box widths from the edge of the box. Sandwich outliers: ‘tuna mayonnaise sub sandwich’, ‘tuna mayonnaise & fresh salad ciabatta’, and ‘ham & cheese sub sandwich’. Beverage outliers: regular tea (340 mL), Red Bull can (250 mL).
Sustainability 11 03190 g001
Figure 2. The dashed lined is the median greenhouse gas emission values and scarcity-weighted water footprint impact indicator values. The solid line is the orthogonal regression line, the principle component extracted via Principle Component Analysis (PCA). This accounts for 74% of the variance of the PCA of the sandwiches and 76% of the total variance of the PCA of the beverages.
Sustainability 11 03190 g002aSustainability 11 03190 g002b
Table 1. Mean (standard deviation) energy, nutrient content, Greenhouse Gas Emission, Water Footprint impact indicator estimates of sandwiches by filling type.
Sandwich Categories
Estimates per PortionBeef (n = 7)Cheese & Meat (n = 13)Cheese (Only) (n = 20)Eggs (n = 6)Fish (n = 14)Mixed Meat (n = 4)Pork (n = 12)Poultry (n = 23)Vegetables (n = 2)All Sandwiches (n = 101)
Energy (kJ)1477 (476)2036 (424)1759 (428)1392 (470)1299 (347)1458 (339)1346 (429)1596 (420)1263 (707)1582 (470)
Protein (g)19.0 (3.9)22.4 (3.1)17.7 (3.7)14.1 (3)16.3 (3.8)23.8 (5.0)16.8 (3.0)23.4 (4.2)9.6 (2.1)19.2 (5.0)
Carbohydrate (g)48.2 (19.5)55.9 (22.1)45.5 (18.644.2 (23)41.0 (13.9)37.5 (4.8)41.3 (18.8)49.3 (18.8)42.4 (14.4)46.2 (18.4)
NMES (g)1.1 (1.0)0.7 (0.8)0.6 (1.2)0.3 (0)0.7 (1.1)0.4 (0.2)0.4 (0.2)1.3 (3.0)0.0 (0.0)0.8 (1.6)
Total fat (g)8.7 (2.5)17.3 (6.6)18.3 (4.6)11.0 (2)8.6 (2.9)11.3 (4.5)10.6 (4.6)9.8 (5.4)10.4 (9.8)12.4 (6.0)
Fat of which saturated (g)2.7 (1.0)7.6 (2.8)9.0 (2.3)2.6 (0)1.4 (0.7)2.3 (1.0)2.6 (1.4)2.0 (1.5)2.4 (2.3)4.2 (3.5)
Sodium (mg)1(0)1(0)1 (3)1 (0)1 (0)1 (1)1 (1)1 (0)1 (1)1 (0)
Calcium (mg)134 (72)318 (110)413 (135)171 (91)87 (61)98 (63)125 (79)132 (84)35 (39)203 (156)
Iron (mg)4 (4)6 (5)4 (5)2 (1)4 (5)7 (6)4 (4)7 (5)7 (8)5 (5)
Fiber (g)2.9 (0.7)3.2 (0.6)3.2 (0.9)3.1 (1.1)3.5 (1.3)3.4 (1.2)3.2 (1.2)3.2 (0.9)5.4 (0.1)3.3 (1.0)
GHGE (gCO2e)3403 (643)1110 (682)895 (241)360 (64)359 (66)536 (130)543 (164)465 (111)221 (91)823 (818)
WFII (litres) ✝✝348.8 (59.8)255.2 (114.5)160.7 (83.1)161.1 (33.5)* 144.9 (46.8)273.0 (93.8)260.3 (77.3)224.5 (91.4)46.4 (6.9)212.3 (100.4)
✝✝ Scarcity-weighted. * There are no WFII data for seafood; this value reflects the non-seafood components of these sandwiches.
Table 2. Mean (standard deviation) energy, nutrient content, Greenhouse Gas Emission, Water Footprint impact indicator estimates of beverages by type.
Beverage Categories
Estimates per PortionBottled Water (n = 3)Coffee (Water-Based) (n = 6)Coffee (Milk-Based) (n = 9)Fruit Juice (n = 4)Other (Milk-Based) * (n = 24)Smoothie ** (n = 8)Soft Drink *** (n = 14)Tea **** (n = 8)All Drinks (n = 76)
Energy (kJ)0.0 (0)17 (13)752 (205)667 (196)1421 (207) 2664 (81)403 (369)33 (28)932 (829)
Protein (g)0.0 (0.0)0.4 (0.4)9.1 (2.5)1.8(1.1)12.6 (1.8)2.6 (0.4)0.14 (0.3)0.2 (0.2)5.5 (5.7)
Carbohydrate (g)0.0 (0.0)0.6 (0.5)12.5 (3.4)39 (11.9)38.7 (10.1)159.6 (5.2)27.2 (21.3)0.5 (0.5)37.7(46.0)
NMES (g)0.0 (0.0)0.0 (0.0)0.0 (0.0)39 (11.9)21.53 (10.9)144.9 (0.0)24 (24)0.0 (0.0)28.4 (43.3)
Total fat (g)0.0 (0.0)0.0(0.0)10.6 (2.9)0. 3 (0.2)15.6 (2.1)1.8 (0.0)0.0 (0.0)0.0 (0.0)6.4 (7.3)
Fat of which saturated (g)0.0 (0.0)0.0 (0.0)6.8 (1.8)0.0(0.0)9.9 (1.3)0.3 (0.0)0.0 (0.0)0.0 (0.0)4.0 (4.7)
Sodium (mg)7 (2)0 (1)118 (32)24(19)191 (40)33 (4)26 (18)2 (2)84 (84)
Vitamin B12 (mg)0 (0)0(0)2(1)0 (0)3 (0)0 (0)0(0)0 (0)1 (2)
Calcium (mg)32 (8)6 (5)324 (88)43 (16)437 (66)107 (5)29 (30)6 (5)198 (185)
Iron (mg)0 (0)0 (0)0 (0)1 (1)1 (0)5(0)0.(1)0 (0)1 (1)
Fiber (g)0.0 (0.0)0.0 (0.0)0.0 (0.0)0.5 (0.4)0.6 (1.4)4.8 (2.0)0.0 (0.0)0.0 (0.0)0.7 (1.7)
GHGE (gCO2e)170 (36)154 (74)703 (196)180 (50)716 (97)367 (0)219 (130)6 (0)418 (293)
WFII (litres) ✝✝0.0 (0.0)419.0 (204.9)593.5 (240.2)207.8 (80.0)227.1 (183.1)228.4 (9.0)147.1 (20.4)21.7 (0.0)239.4 (215.1)
* ‘Other milk-based drinks’ include frappe lattés, hot chocolate, mocha, and chi tea. ** ‘Smoothies’ were made using frozen fruit and fruit juice from concentrate. *** ‘Soft drinks’ includes low-calorie soft drinks. **** ‘Tea’ includes fruit tea and black tea served without milk. ✝✝ Scarcity-weighted.
Table 3. Correlation between nutrient content and environmental impact score of cafe sandwiches and beverages.
Nutrients per PortionSpearman’s Correlation Coefficient
SandwichesBeverages
Energy (kJ)0.49 *0.58 *
Protein (g)0.45 *0.83 *
Carbohydrate (g)0.45 *0.35 *
NMES (g)0.44 *0.09
Total fat (g)0.41 *0.79 *
Fat of which saturated (g)0.37 *0.79 *
Sodium (mg)0.67 *0.75 *
Vitamin B12 (mg)No value0.76 *
Calcium (mg)0.150.77 *
Iron (mg)0.44 *0.36 *
Fibre (g)0.080.06
* Statistically significant (p < 0.001). Sandwiches n = 101, Beverages n = 76. NMES, Non-Milk Extrinsic Sugars.

