Article

Performance of an On-Site Wastewater Treatment System Using Reactive Filter Media and a Sequencing Batch Constructed Wetland

Department of Sustainable Development, Environmental Science & Engineering, Division of Water and Environmental Engineering, KTH Royal Institute of Technology, SE-100 44 Stockholm, Sweden
*
Authors to whom correspondence should be addressed.
Sustainability 2019, 11(11), 3172; https://doi.org/10.3390/su11113172
Submission received: 10 May 2019 / Revised: 29 May 2019 / Accepted: 30 May 2019 / Published: 5 June 2019
(This article belongs to the Special Issue Sustainability on Wastewater Treatment and Recycling)

Abstract

:
Many on-site wastewater treatment systems, such as soil treatment systems, are not sustainable in terms of purification efficiency, nutrient recycling potential, and economics. In this case study, a sequencing batch constructed wetland (SBCW) was designed and added after a package treatment plant (PTP) using reactive filter media for phosphorus (P) removal and recycling. The treatment performance of the entire system in the start-up phase and its possible applicability in rural areas were investigated. Raw and treated effluents were sampled during a period of 25 weeks and analyzed for nitrogen, phosphorus, BOD7, and bacteria. Field measurements were made of wastewater flow, electrical conductivity, oxygen, and temperature. The entire system removed total-P and total inorganic nitrogen (TIN) by 83% and 22%, respectively. High salt concentration and very low wastewater temperature were possible reasons for these unexpectedly low P and TIN removal efficiencies. In contrast, removal rates of bacteria (Escherichia coli, enterococci) and organic matter (as BOD) were high, due to filtration in the alkaline medium Polonite® (Ecofiltration Nordic AB, Stockholm, Sweden) and the fine sand used as SBCW substrate. High pH in effluent from the PTP was efficiently reduced to below pH 9 in the SBCW, meeting recommendations by environmental authorities in Sweden. We concluded that treating cold on-site wastewater can impair treatment performance and that technical measures are needed to improve SBCW performance.

Graphical Abstract

1. Introduction

In Sweden, many on-site wastewater treatment systems in rural areas comprise septic tanks with subsequent soil treatment systems (STS). Low phosphorus (P) retention efficiency in STS has been observed [1] and the capability of such systems to remove emerging contaminants has been questioned [2]. Other countries where the STS design is frequently applied are Australia, Canada, USA, Finland, Norway, and rural parts of Europe. As a result of increasingly stringent regulations, especially for sensitive environmental areas, discharge permits that require installation of highly effective on-site treatment systems have been introduced. This has prompted research on the development of low-cost technologies and improved design of package treatment plants (PTP), along with constructed wetlands (CW) and STS such as soil infiltration. Package treatment plants generally comprise sludge removal, aerobic biofiltration, and chemical precipitation of P with alumina or iron compounds. Several commercial companies in the Nordic countries [3], Lithuania [4], and Poland [5] are marketing PTPs where P is precipitated in reactive filter media (RFM). RFM usually consist of Filtralite® (Leca Norge AS, Nordby, Norge), Polonite, or metallurgic slag. Extensive research during the past two decades has confirmed the utility of these filter products for on-site treatment. Many PTPs are designed with the aim of recycling nutrients, particularly P, to agriculture. In the case of Polonite, a system has been developed with P-filter bags that can be replaced when P breakthrough occurs and are transferred to available recycling options. The spent RFM in on-site solutions is not a pure fertilizer that can completely replace commercial fertilizers in agriculture, but it can contribute significantly to soil improvement and plant growth [6].
RFM are generally alkaline [7], which results in filter effluent pH of 9–12.5, at least in the initial months of operation. High pH causes the filter medium to be oversaturated with Ca2+ ions, which could have taken part in P precipitation but are released and lost to the recipient. The environmental authorities may require the pH to be reduced below 9, to eliminate risks to sensitive biota when the recipient is a surface water body. Moreover, a generally limited total nitrogen (total-N) reduction is observed in RFM, with only transformation of inorganic N species, i.e., ammonium nitrogen (NH4-N) to nitrate nitrogen (NO3-N) [8]. Another feature of RFM is that their P sorption capacity is very high in the beginning of filtration and decreases with time and decreasing pH value [9]. When the effluent has reached pH 9, the P concentration is usually around 1 mg L−1, which is the statutory limit applied in Sweden for discharge of treated on-site wastewater to a sensitive receiving water body. However, at pH 9 the RFM has much more capacity to trap P, which should imply prolonged use up to the P breakthrough point. An add-on system is therefore required to save lost Ca2+ ions from the filter media for post-precipitation of P. The PTP systems are generally not constructed for N removal. Post-treatment in a CW or STS could then be a solution to reduce the load of nutrients to water bodies [10]. Besides these services, the add-on system could also be designed to function as a small subsurface dam, storing treated wastewater to be used for irrigation during times of water deficit [11]. Combination of CWs with other treatment technologies has also become a pathway to tackle the individual drawbacks to achieving improved function of the whole system [12].
In this study, we developed and tested an add-on solution intended to increase the sustainability of systems using RFM. We implemented the solution in full-scale on a farm where two family houses are connected to a sewerage system and a single on-site treatment system. Based on previous studies of CWs and STS, we designed a system that technically operates with sequential filling and draining of wastewater, with the aim of overcoming the problems described above. Such technology is applied in indoor wastewater treatment using sequencing batch reactors (SBR), and therefore we named our outdoor system a sequencing batch constructed wetland (SBCW). Similar systems for outdoor use are described in the literature, under the names CW with tidal-flow operation [13], reciprocating wetland [14], and compact constructed wetland (CCW) [15,16]. However, of these, only the last-mentioned has been operated as a large-scale facility. Important criteria for implementing on-site treatment solutions for private houses are land area requirement [17], technology readiness level (TRL), and costs for installation and management. We addressed TRL and costs in the planning of the PTP combined with the SBCW, which is realistic and affordable for owners of such a system. To the best of our knowledge, this is the first time that such a post-treatment system after a PTP has been designed and preliminarily investigated.
Specific objectives of the study were to (i) investigate the overall N and P removal capacity of the entire on-site treatment system, (ii) study the treatment efficiency in relation to physical-chemical conditions, and (iii) evaluate the SBCW as an add-on unit to PTPs and suggest any changes in the design in relation to the results obtained.

2. Materials and Methods

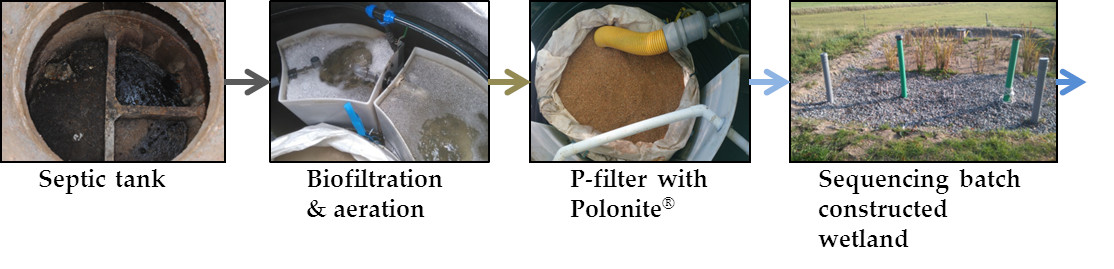
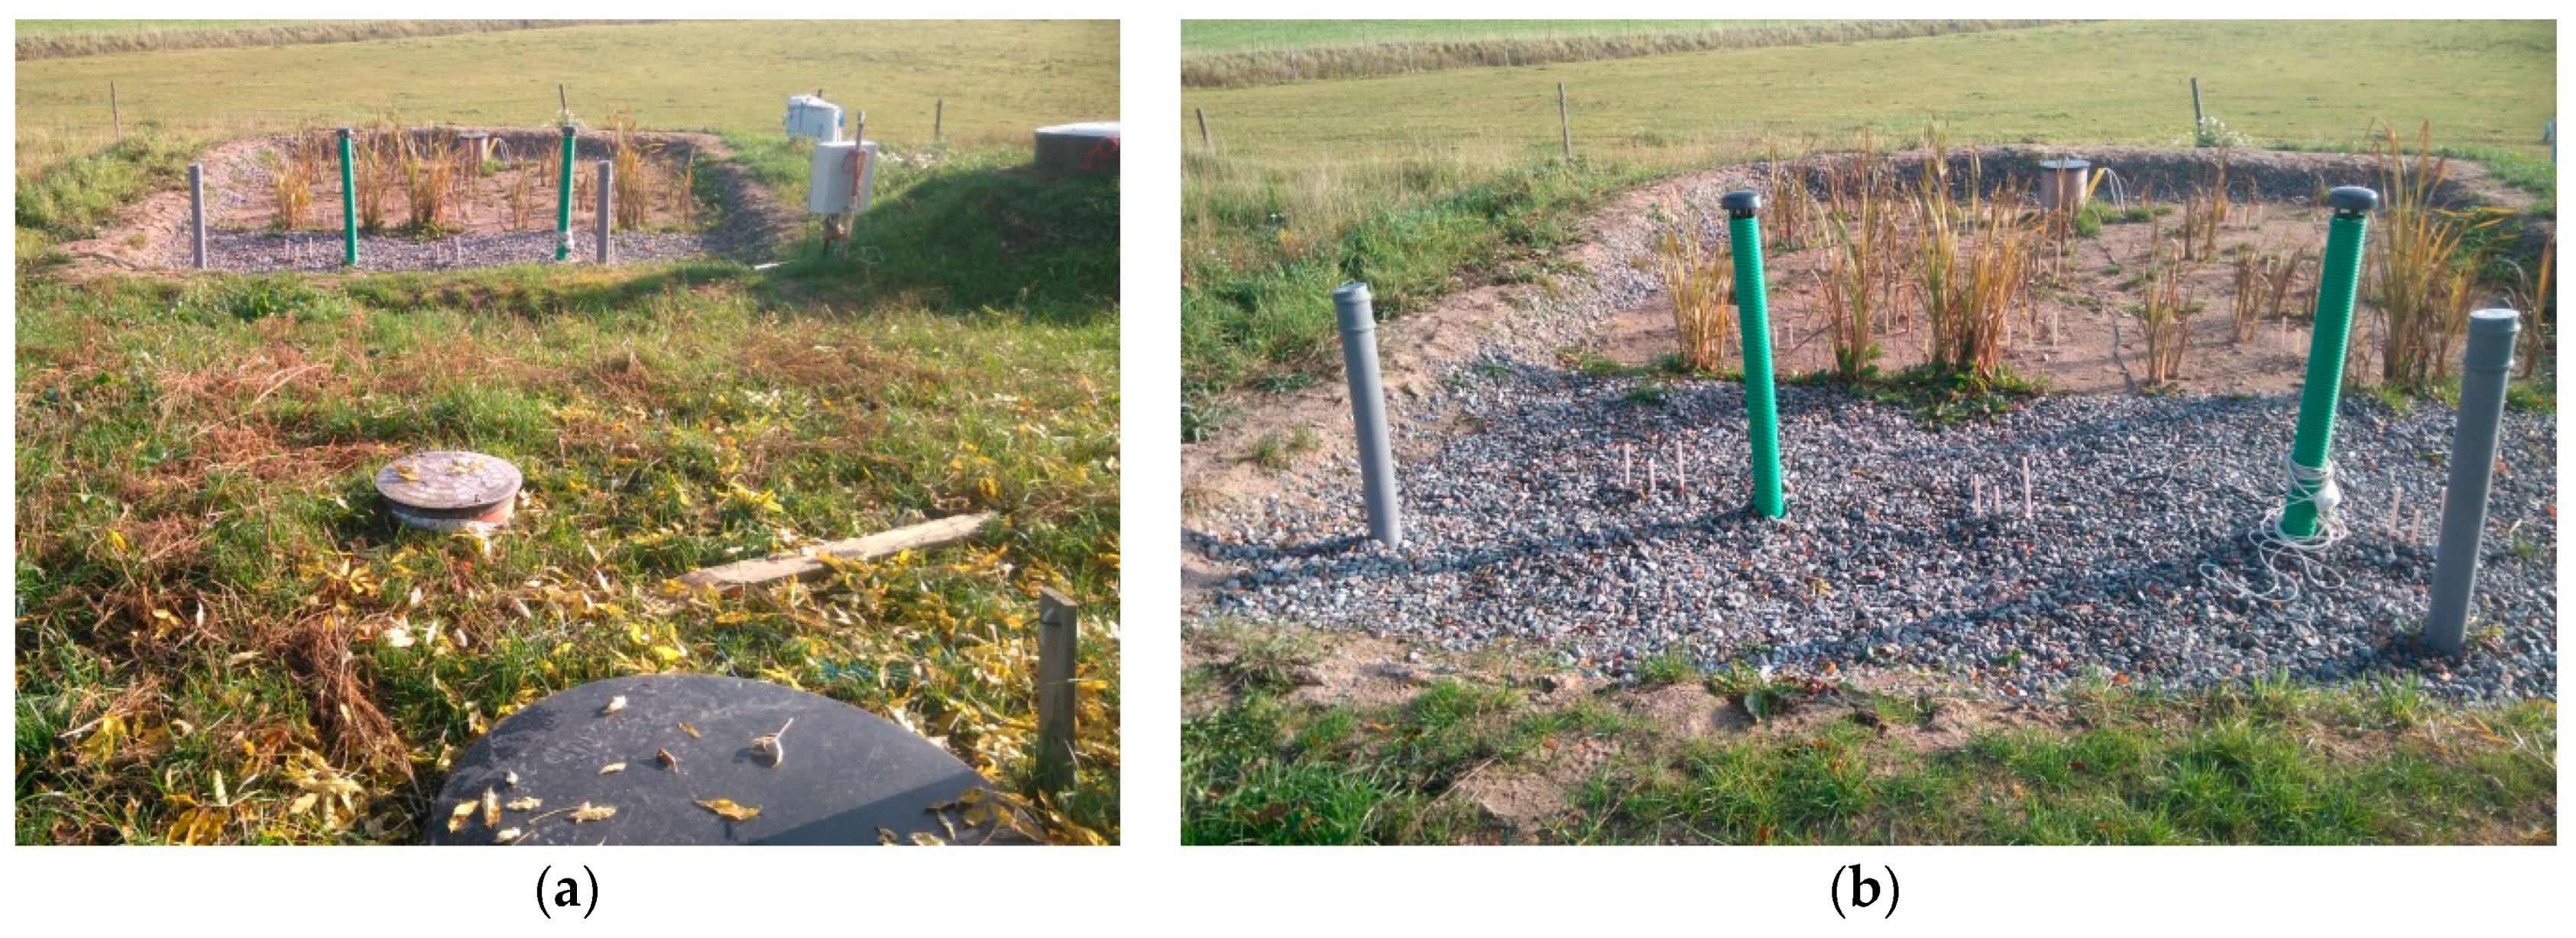
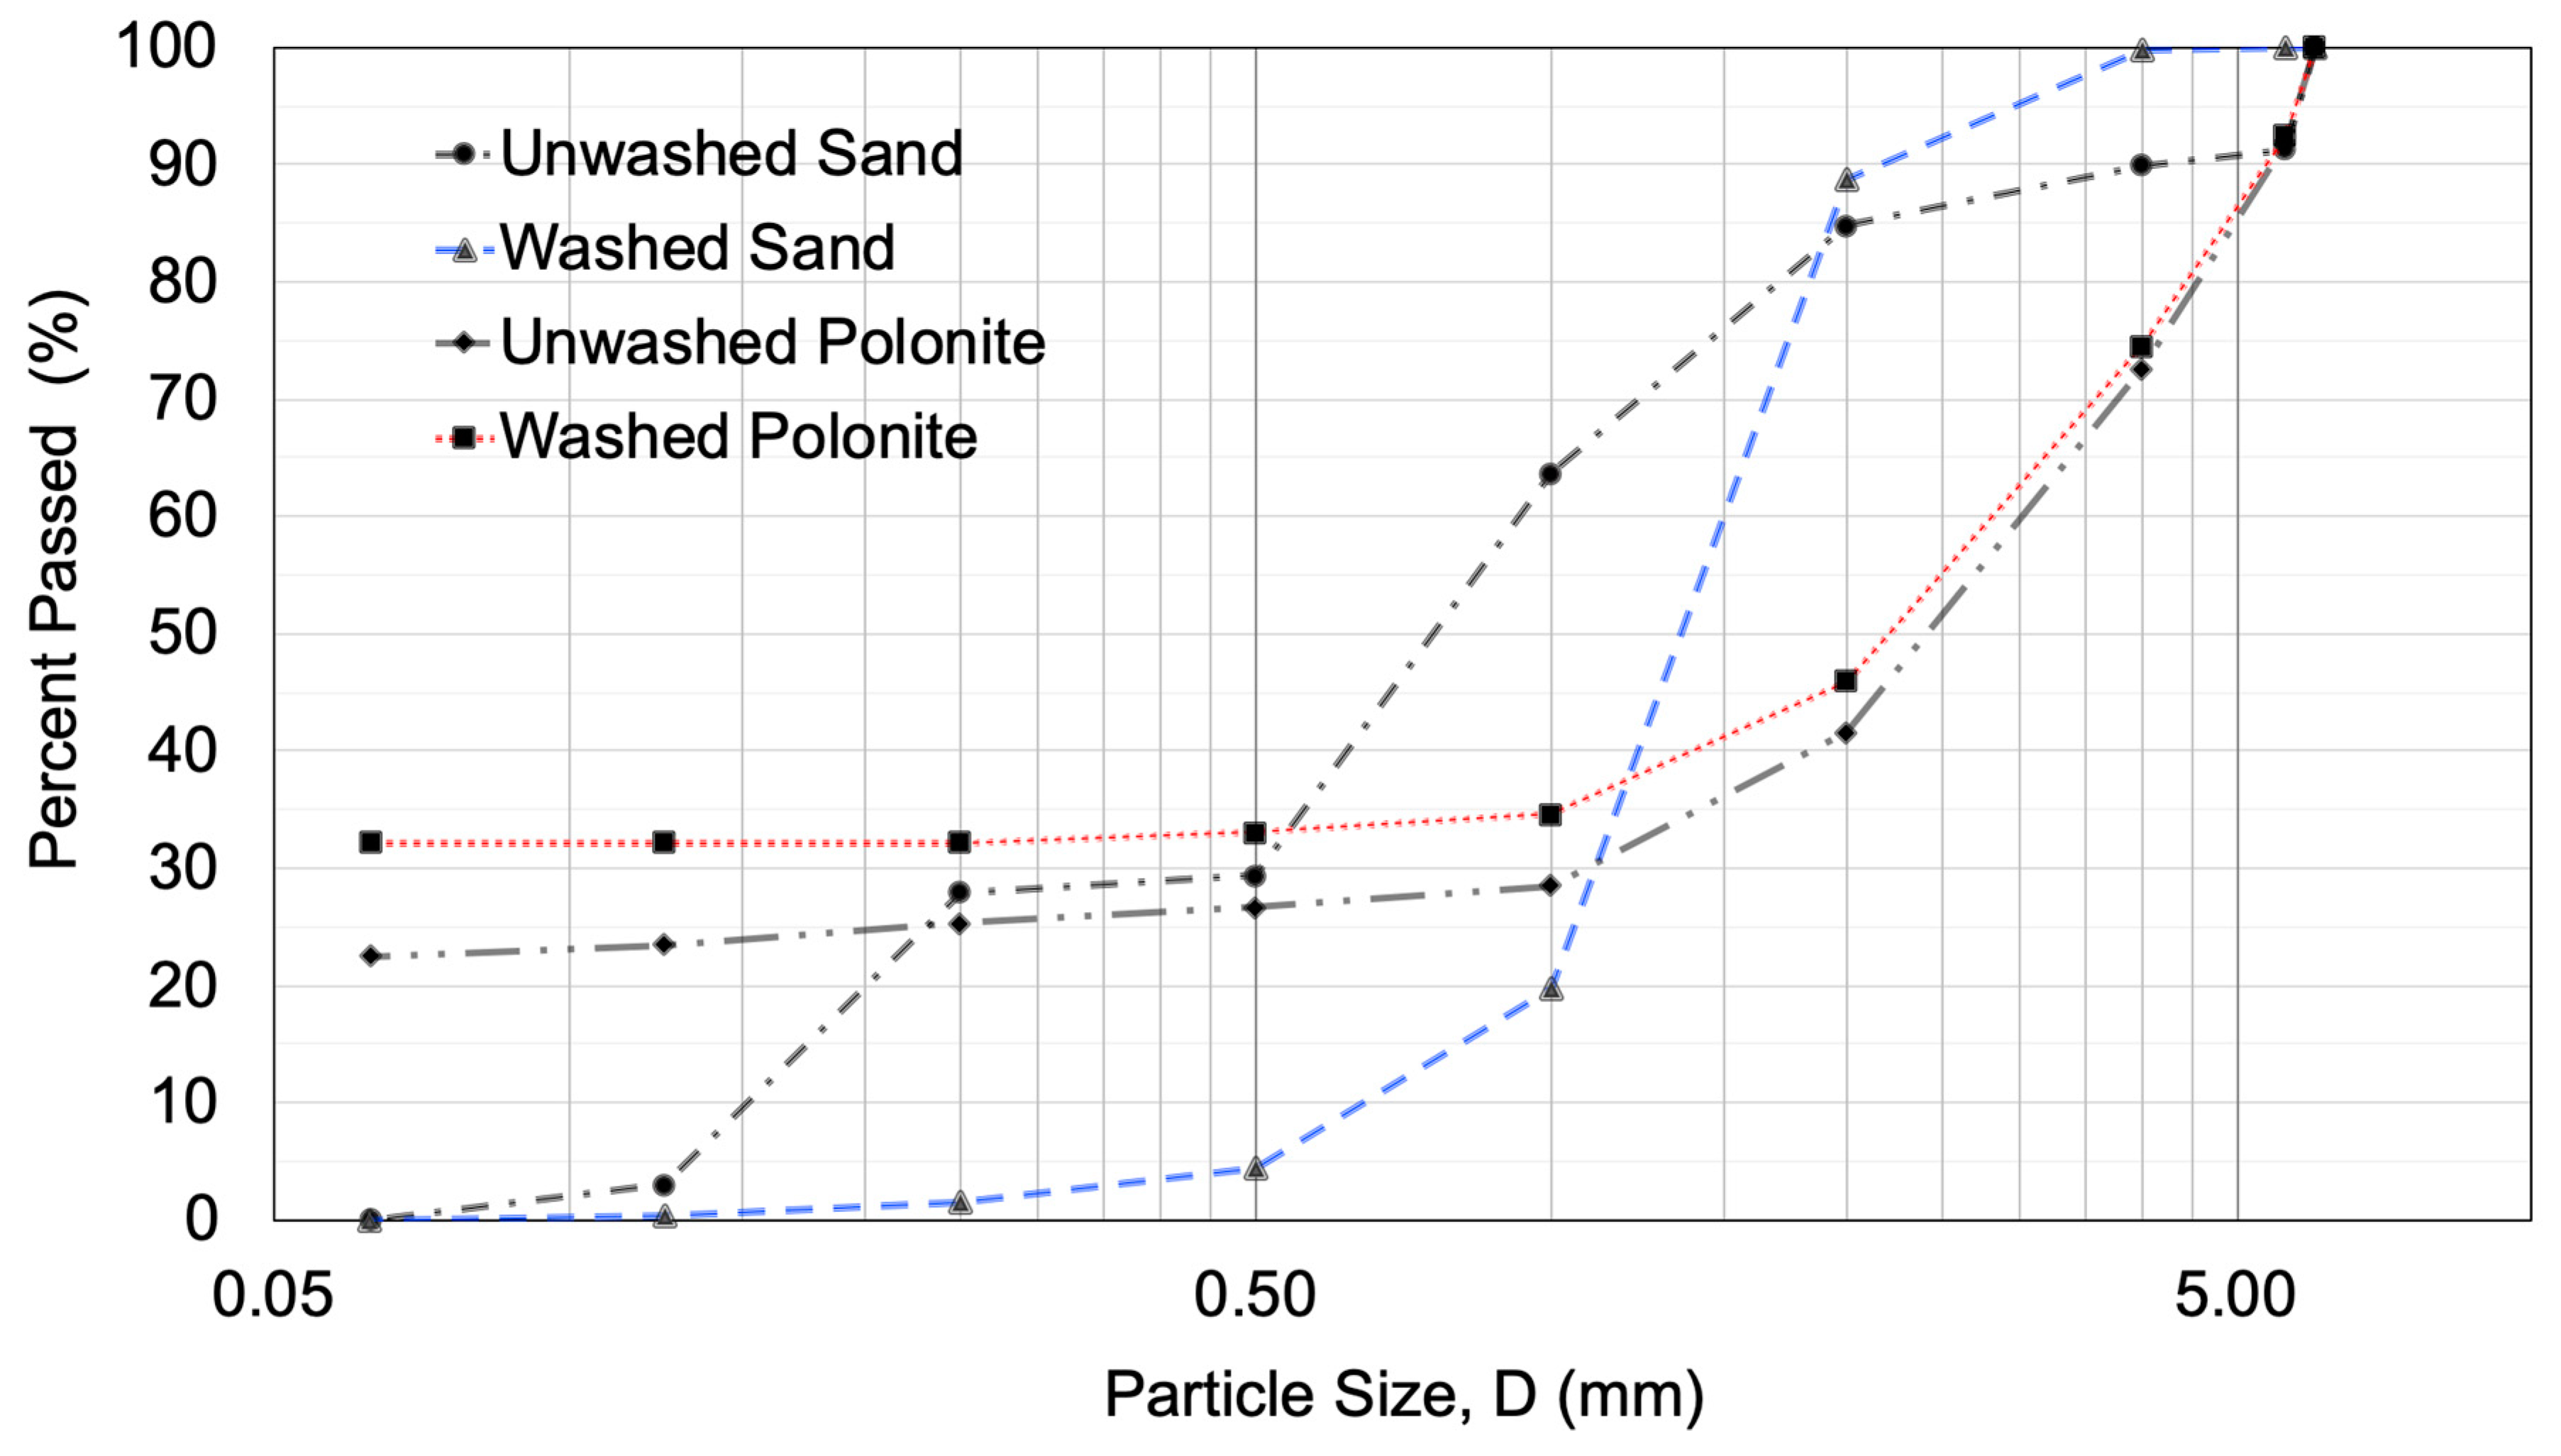
2.1. Study Site and Description of Wastewater Treatment System

The case study site is situated 40 km northwest of Stockholm, Sweden, in an agricultural area where most houses are served by private on-site wastewater treatment and water supply systems. The studied system was upgraded from having only a septic tank with a 40-year-old soil infiltration bed. The engineered system was designed and constructed in autumn 2017 and pre-tested in winter and spring 2018. The start of system monitoring was delayed to June 2018, due to severe winter conditions 2017/2018, and continued until December 2018. The new system consists of four wastewater treatment units: 1) septic tank (not replaced), 2) clarifier tank, 3) PTP comprising aerated biofiltration tanks (BF) plus a P-filter bag, and 4) SBCW for polishing the effluent from the preceding unit and reducing the pH (Figure 1).
The total volume of the septic tank and clarifier tank is 6.5 m3, giving a hydraulic retention time (HRT) of 11 days for the daily wastewater volume produced. The PTP consists of five 100-L biofiltration tanks filled with Bioblok® (EXPO-NET A/S, Hjørring, Denmark) media. Three are continuously aerated in the bottom through air diffusers fed by an air-pump, followed by a P-filter bag filled with 500 kg of the RFM Polonite (Ecofiltration Nordic AB, Stockholm, Sweden). The wastewater is distributed by a pipe to the P-filter bag, flows passively upwards, and leaves by a pipe to enter the next treatment step, the SBCW.
In the SBCW, the wastewater is distributed by perforated pipes (length 10 m, diameter 110 mm) placed 0.15 m deep in a crushed granite bed (16–32 mm) (Figure 1b). The SBCW is 8 m long and 5 m wide, i.e., it covers an area of 40 m2. The effective depth of the sand bed material in the SBCW is 0.6 m, of which 0.2 m is gravel in the bottom layer where the two effluent collection pipes are situated. The bed rests on a 4-mm impermeable plastic liner, forming a waterproof pool. The outlet has a pump well that is connected to the effluent collection pipes. Treated water is pumped to a tile drainage system in the adjacent agricultural field that discharges its water to a ditch. Drainage of the SBCW is managed automatically and starts when the water level is 0.1 m below the soil surface, i.e., the wetland is saturated. The pump, with a capacity of about 75 L min−1, operates for about 35–40 minutes until the flow from the wetland is very low and cannot feed the pump.
The crushed granite (6 m3) and postglacial sand used in the SBCW (28 m3) was obtained from a gravel pit situated 25 km from the study site, to reduce the investment costs. The particle size distribution of the sand is shown in Figure 2. The wetland was planted in autumn 2017 with 24 rhizomes of cattail (Typha latifolia) taken from a stand growing in a ditch close to the site. This species was selected based on its natural occurrence at the construction site and recent findings that it shows better performance in CWs than common reed (Phragmites communis) in terms of N removal [18].
The system was dimensioned for 10 person-equivalents (p.e.), with a maximum daily wastewater flow of 1.6 m3. However, much fewer people lived in the houses during the study period, which resulted in a measured average daily flow of 0.65 m3. The flow was calculated from the numbers of pumping events, the pump capacity, and pumping time. The hydraulic load of the SBCW was calculated to be 16 L m2 d−1.

2.2. Sampling and Water Quality Analyses

Grab samples were taken from the septic tank, the PTP outlet, and the outlet well in the SBCW when water was pumped out of the wetland, which usually occurred every 5–9 days. A few samples for P analyses and pH measurement were also taken at the outlet during pumping, but at varying intervals. Measurements in situ of pH, temperature (°C), electrical conductivity (EC, μS/cm), dissolved oxygen (DO), and redox potential (mV) were performed on each sampling occasion, using a Hach HQ40d Multimeter. Water samples were collected in 100-mL acid-washed polyethylene plastic bottles and brought to the KTH Royal Institute of Technology Water Centre laboratory for further analyses. Water turbidity was instantly measured with a Hach 2100Q portable turbidity meter. Analyses of phosphate-phosphorus (PO4-P), total phosphorus (Total-P), and inorganic nitrogen species (NH4-N, NO3-N, NO2-N) were performed using a SEAL Auto Analyzer (AA3). The samples for PO4-P and N analyses were filtered through 0.45 μm Sartorius filters prior to analysis.
The indicator microbes Escherichia coli and intestinal enterococci were analyzed using the Swedish standard SS-EN ISO 7899-2 method and organic load was analyzed as biological oxygen demand (BOD7). These samples for these analyses, which were taken on three occasions, were immediately delivered to the certified laboratory ALS Scandinavia AB for analysis.

2.3. Analysis of P and N Removal Efficiency

Percentage removal of P (RP) and N (RN, measured as total inorganic nitrogen, TIN) for the whole system, and individually for the PTP (BF, P-filter bag) and SBCW, during the entire study period was calculated as: Rp, Np (%) = (Ci − Ce)/Ci × 100, where Ci and Ce is cumulative influent and effluent concentration, respectively.
The amount of P retained in the PTP (P-filter bag) and in the SBCW was calculated based on the total wastewater flow. The P retention of the units was calculated as: PR (g kg−1) = Wv ·× (Ci − Ce)/m, where Wv is the total measured flow through the system (L), and m is dry mass of the material. Total inorganic nitrogen (TIN) was calculated as the sum of NH4-N, NO2-N, and NO3-N.
The impact of precipitation was considered for the open SBCW. Data were obtained from the meteorological station Vallentuna (belonging to the Swedish Meteorological and Hydrological Institute), situated 19 km from the study site. The period June–September was unusually dry and warm. Snowfall occurred in December, but melted. Only a few rainfall events with more than 10 mm rain occurred during the whole monitoring period. In total, the site received 191 mm precipitation and, with estimated average evapotranspiration of 60% for the period, the total volume that could dilute wastewater entering the SBCW was 3056 L. This was about 3% of the total volume treated during the study period.

2.4. Statistical Analysis

The data obtained from the chemical analyses were statistically analyzed using IBM SPSS statistics version 25 (IBM, 2018, New York, NY, USA) to describe the tendency in data variability and significant effects of various treatment units in the study system. The box plots of mean values were reported to describe the normal distribution of the data and compare the removal performance of the system. A high degree of confidence interval (95%) and p-value (α < 0.05) were employed to describe significant differences between treatment units. The variation in the data was determined using the standard error of mean values.

3. Results

3.1. Overall P, N, BOD, and Bacteria Removal Capacity of the On-site System

The system was operated without breaks and the daily volume wastewater produced was almost constant during the study period, as shown in Figure 3, Figure 4 and Figure 5 and Table 1.

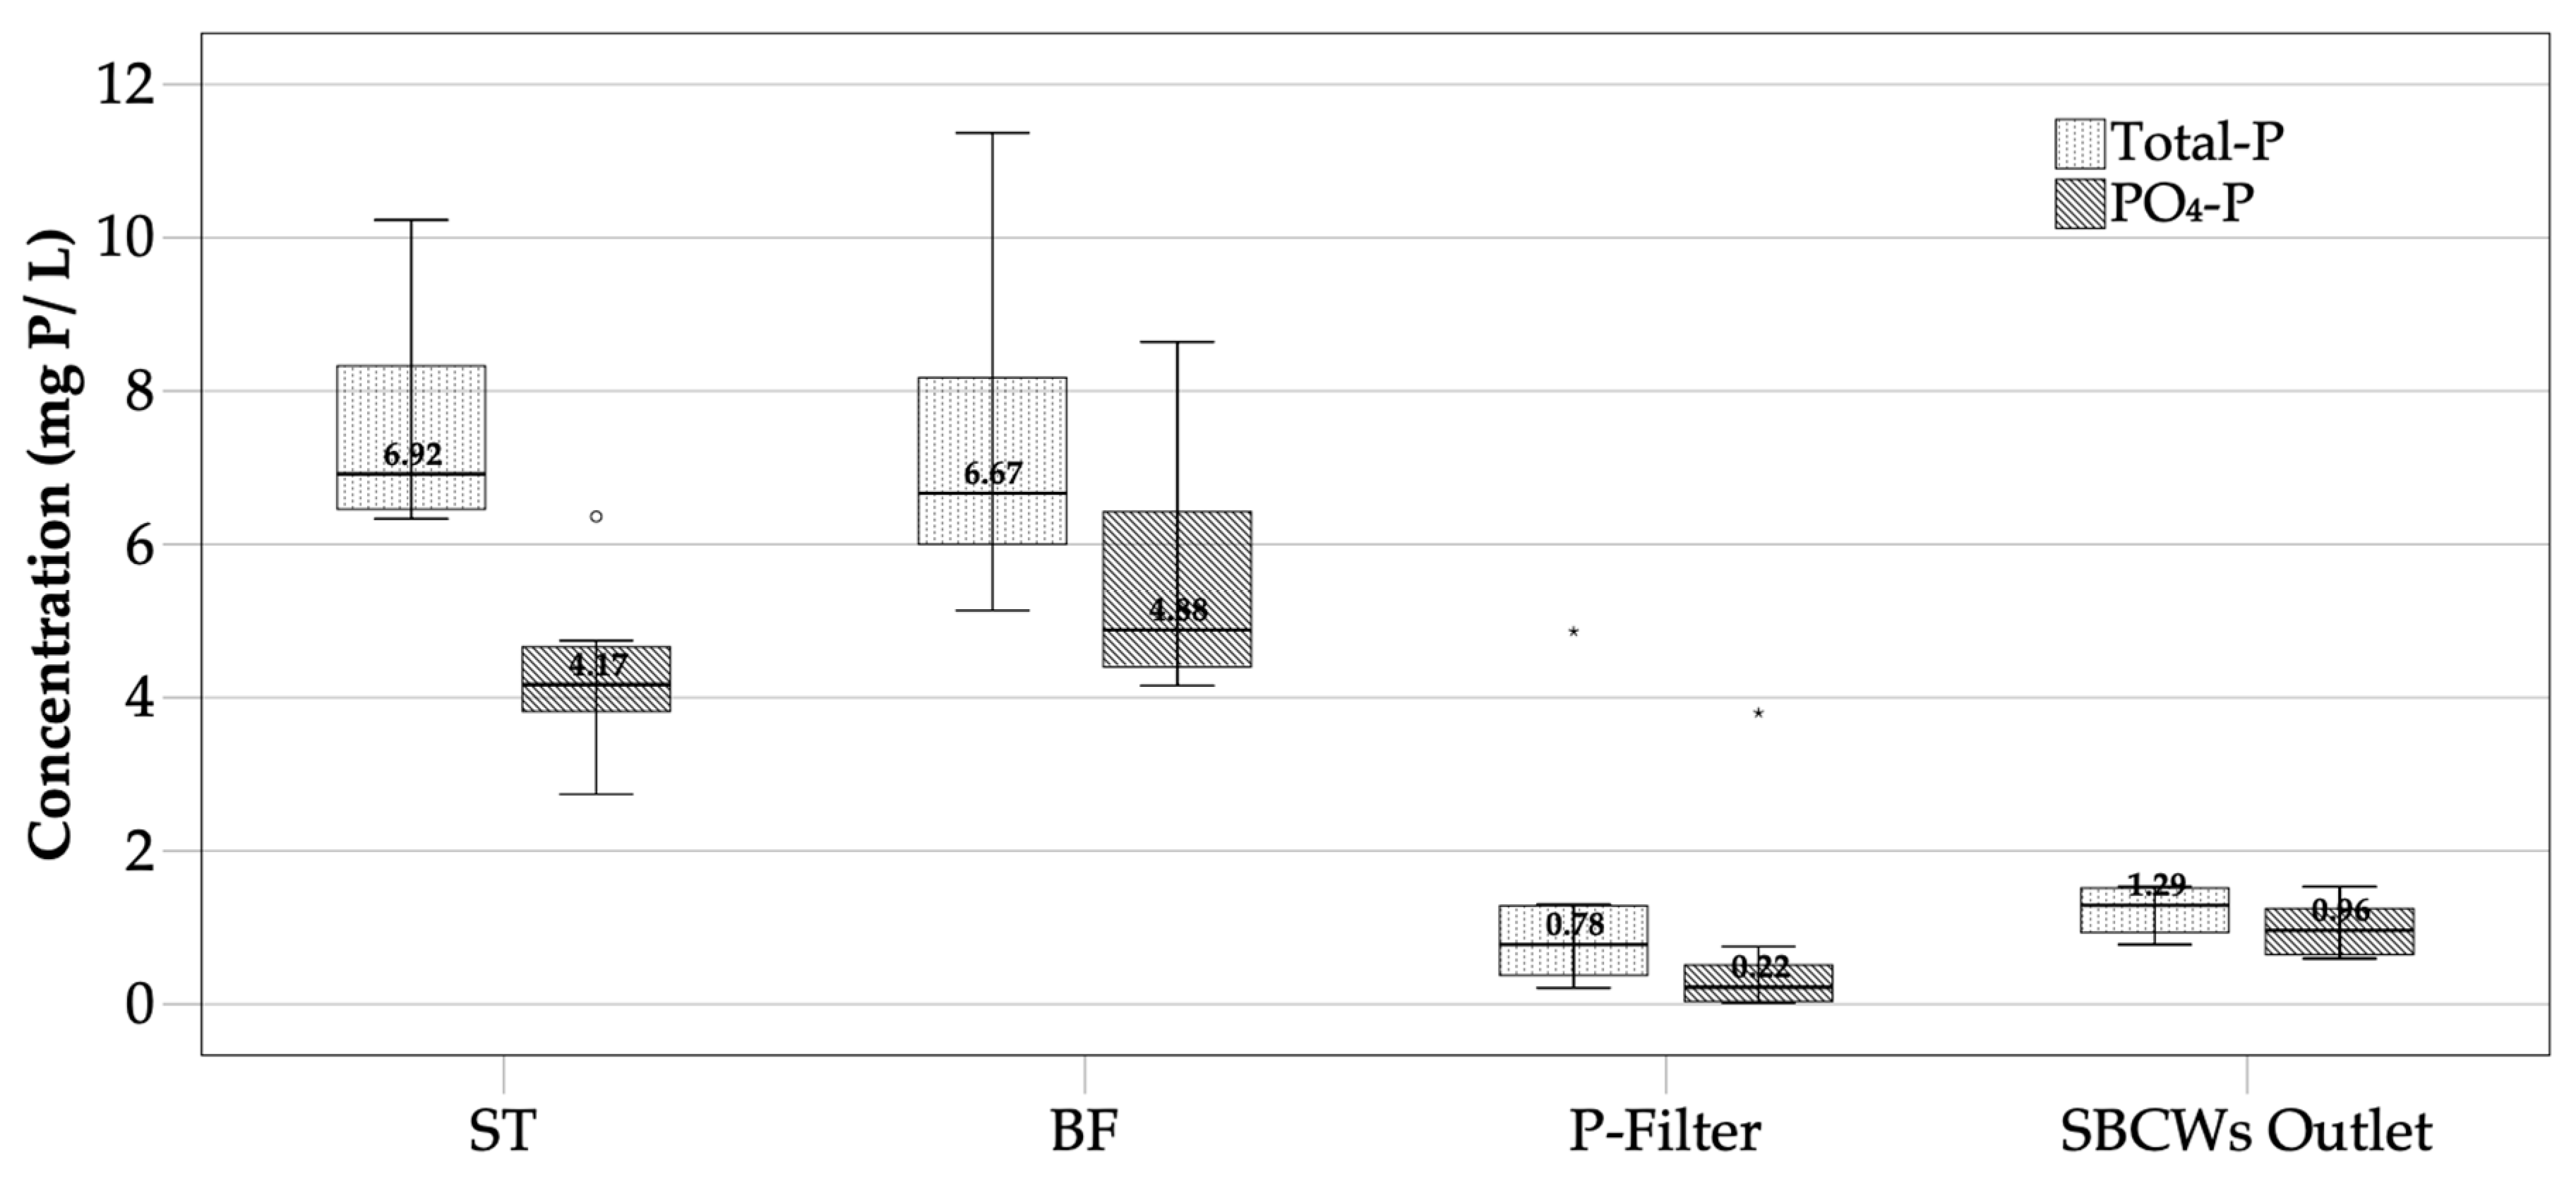
3.1.1. Phosphorus Removal

The influent Total-P concentration showed expected values for on-site wastewater, ranging from 3.9 to 10.2 mg L−1 (mean 6.9 mg L−1) (Figure 3). The BF tanks did not reduce P, but rather transformed particulate-bound P to dissolved PO4-P. The P-filter bag filled with Polonite showed varying removal efficiency with time and started to lose its high P retention capacity by the end of the 25-week study period (Figure 4). However, the Polonite removed 88% of Total-P and 94% of PO4-P that flowed from the BF. The SBCW dampened the Total-P variations measured in the effluent from the P-filter bag, but the mean Total-P concentration was higher in the SBCW effluent than in the P-filter effluent. However, in the effluent leaving the on-site system to the recipient ditch, reactive PO4-P showed an average low concentration of 0.87 mg L−1 (Figure 3). The Total-P concentration in pumped water from the SBCW was slightly higher than in the water collected from the effluent well. The entire system removed 83% of Total-P and 82% of PO4-P.

3.1.2. Nitrogen Removal

The inorganic N forms showed typical average concentrations for wastewater in the septic tank effluent (Figure 5). However, there was great fluctuation in the concentration of NH4-N, with the highest values in July and August and the lowest in October to December. The aerated BF tanks oxidized NH4-N to mainly NO3-N. However, a large share of NH4-N left this system component and entered the P-filter bag (Figure 5). A two-tailed t-test of multiple comparison of the reduction in NH4-N concentration showed no significant difference between the BF and P-filter effluents (p < 0.05). The P-filter in turn increased the average NH4-N concentration from 21 mg L−1 in the influent to 44 mg L−1 in the effluent. The SBCW was able to reduce this NH4-N concentration in the P-filter effluent to an average of 15 mg L−1, by transformation to NO3-N and NO2-N, i.e., a significant increase in NO3-N concentration was measured at the outlet of the SBCW (p > 0.05). The PTP and SBCW together reduced NH4-N and TIN by 74.6% and 22%, respectively.

3.1.3. BOD and Bacteria Removal

The data obtained for BOD7 showed that the water leaving the entire system was cleared of organic matter, to a concentration below 1 mg L−1. This was evident also from the very low concentration of E. coli and enterococci in the effluent. However, by the end of the sampling period in December, the colony-forming units (cfu) values increased noticeably and a slight increase in BOD was also observed.

3.2. Retained P in the On-Site System

The P-filter, containing the reactive medium Polonite, retained 1.21 g Total-P kg-1 during the 25-week study period. The P-filter treatment step released 86.2 g Total-P, none of which was apparently removed in the SBCW since the transport out of it was 96.1 g Total-P. Organic P removal by sludge generation in the septic tank and in the BF tanks was not measured.

3.3. Influence of Physical-Chemical Conditions

3.3.1. Water Temperature

The temperature of the septic tank wastewater decreased continuously from 24 °C in July to 3.9 °C in December (Figure 6). Noticeable differences in temperature started to appear in autumn, where the septic tank effluent had a lower temperature than the influent. At the end of the study period, when outdoor temperature was below −10 °C, the temperature of the SBCW effluent was as low as +2.5 °C, while that in the incoming wastewater was +6.1 °C.

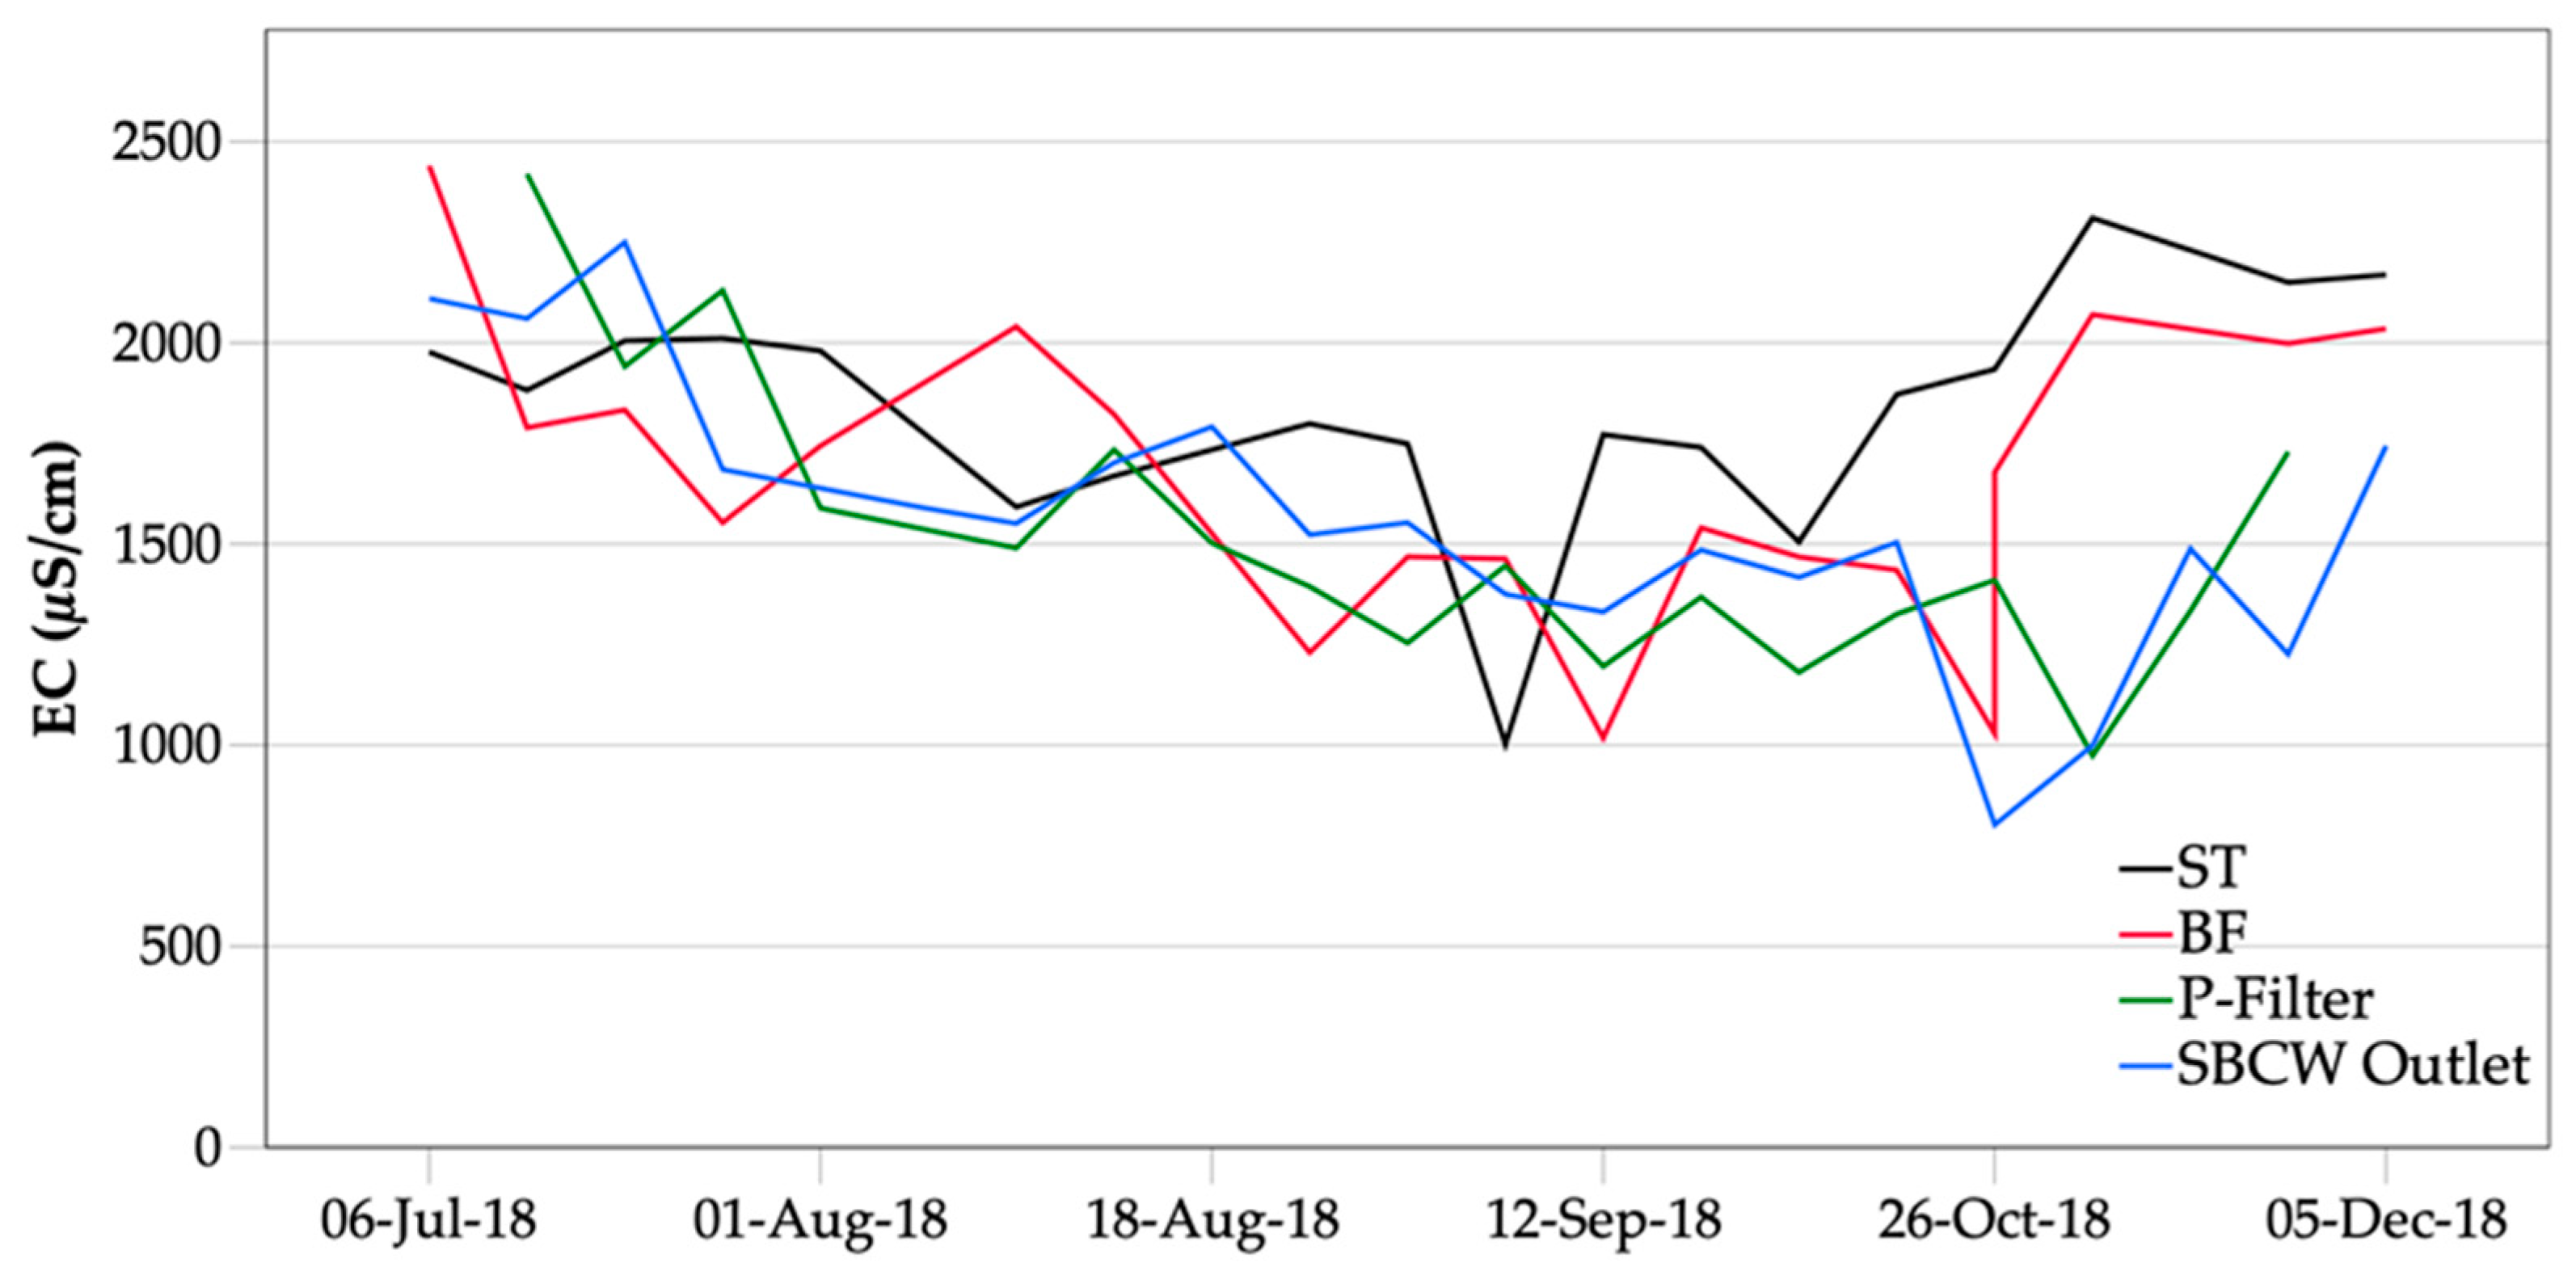
3.3.2. Electrical Conductivity
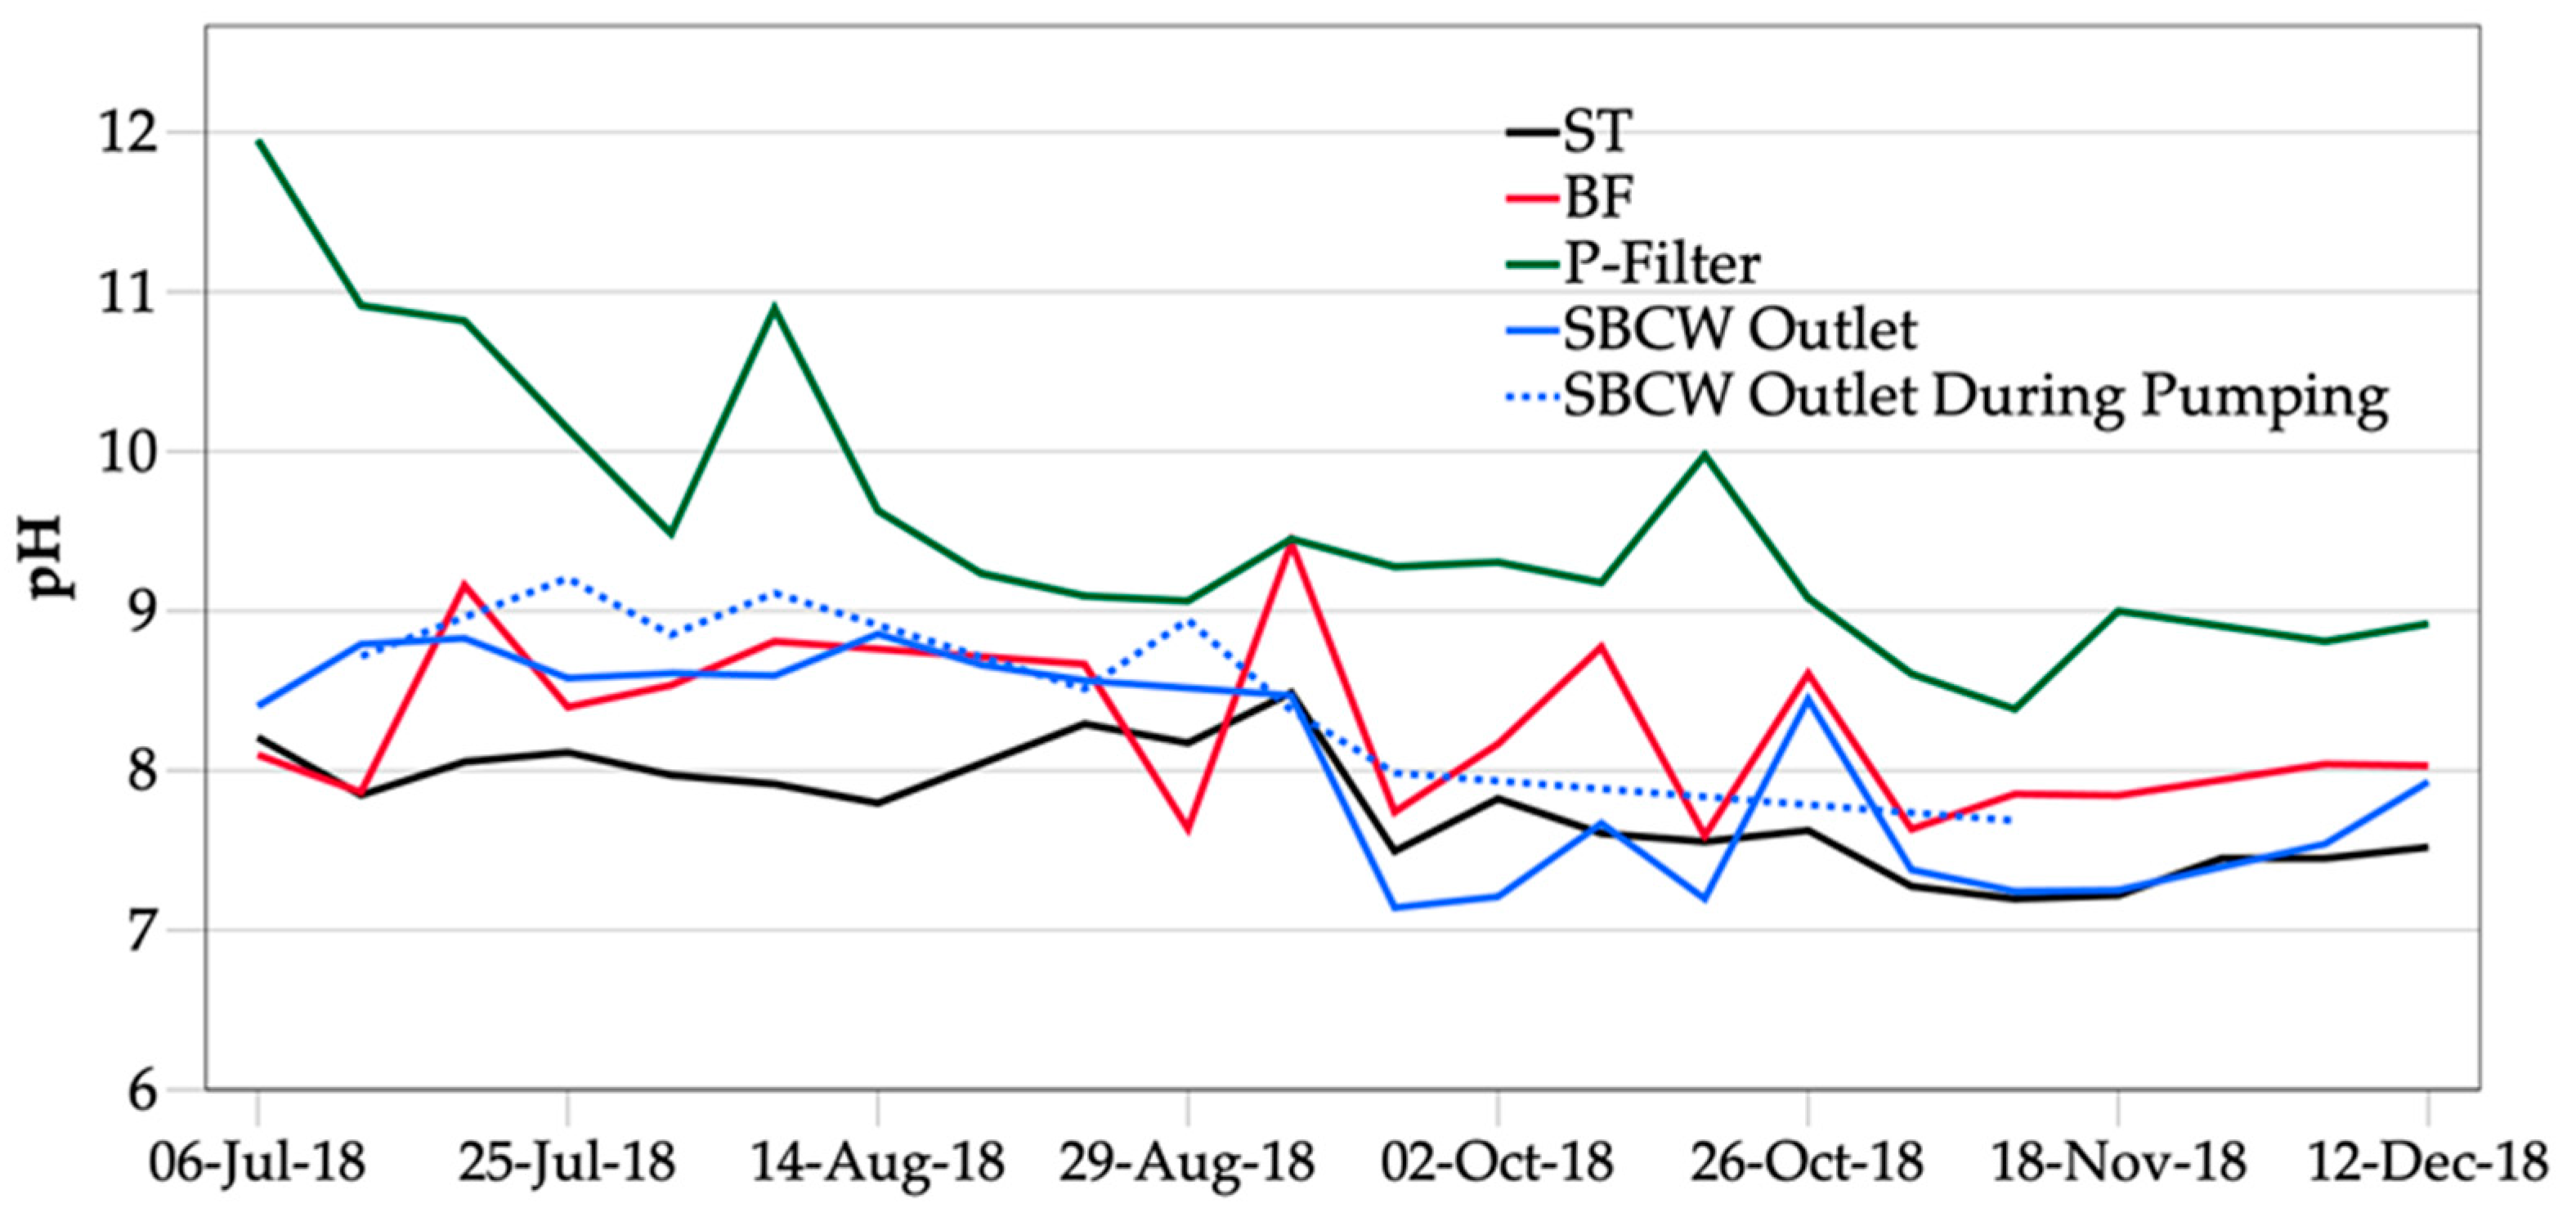
The EC of the influent wastewater varied between 1500 and 2450 μS cm−1 with one occasional exception, where the EC dropped to 1000 μS cm−1 (Figure 7). The difference between EC in the outlet well and the septic tank increased towards the end of the monitoring period, i.e., in autumn and early winter.

3.3.3. pH

The measured data for pH are shown in Figure 8. The water flowing from the P-filter bag showed high pH values throughout the study period, but the values decreasing successively from pH 12 in July to 8.8 in December. Two peaks with increasing pH from the trend-line were observed, but also sudden pH drops. The pH of the influent wastewater showed a decreasing trend from values around 8.3 in summer to close to pH 7 in late autumn. The pH in the system effluent (outlet well) was always below 9 and decreased as the pH of water from the P-filter bag decreased. However, during pumping in July and August, when pH in the effluent from the P-filter bag was above 10, the pH was slightly higher than 9 in the SBCW effluent.

3.3.4. Dissolved Oxygen

Dissolved oxygen showed a constant low concentration, around and below 1 mg L−1, in the septic tank (Figure 9). Data from other sampling points showed varying concentrations, with those from the P-filter bag deviating most, from below 1 mg L−1 to up to 9.5 mg L−1. The DO in the outlet water had an average concentration of 1.8 mg L−1 and increased from September but was still low, reaching a concentration of around 3 mg L−1.

4. Discussion

4.1. Nitrogen and Phosphorus—Transformation, Removal, Retention

The dominant N species in the septic tank effluent, NH4-N, was not completely oxidized to NO3-N in the aerated biofiltration system. The first, second, and fourth tank are aerated. Data were collected only from the fifth tank, where extensive growth of biofilm and sludge generation were observed. The low DO concentrations were probably the reason for the incomplete nitrification, but high EC (Figure 7), caused here by wastewater salinity, can also inhibit the biology of sewage treatment plants [19].
The P-filter with Polonite changed the N concentrations of the wastewater coming from the BF, with NH4-N and NO3-N increasing and decreasing, respectively. Surprisingly, an increase in TIN was observed, which is suggested to be related to accumulation and degradation of lighter sludge flocs flowing out from the BF. A previous investigation using real wastewater and columns operated under unsaturated conditions showed capacity of Polonite to transform NH4-N to NO3-N and even reduce TIN by 17.7% [8]. However, in another study, the reduction was only 11%, although in that case the wastewater was treated in saturated conditions [20]. The very different results obtained in the present study reveal that another factor or combination of factors caused the adverse effects on N transformation and removal in the P-filter bag. Besides the already-mentioned problem of low DO concentrations and sludge flocs, low temperature of the wastewater prevailing for two months must be added to possible reasons for the N removal failure. Temperature was not an issue in the previous column experiments, as they were performed under indoor conditions (20 °C) [8,20], while the wastewater in the P-filter bag in the present study varied between 6 and 20 °C (Figure 6). Domestic wastewater usually has a temperature of about 12 °C when it reaches the municipal treatment plant. The temperature in on-site systems is much lower because of long retention times in sewers and septic tanks that are placed deep in the ground. This calls for a different strategy for storing wastewater, e.g., indoors and via short pipes to the treatment system, which should be placed close to the house.
The P-filter bag filled with Polonite was the unit of the system responsible for the main P removal. This filter material is designed for efficient P sorption [21], replacing conventional coagulants such as polyaluminum chloride and flocculants based on polyacrylamide used in other types of PTPs. The removal efficiency unexpectedly declined rapidly in comparison with the wastewater loading rate and at the end of the 25-week study period it was 89%, which was similar efficiency to that reported for another PTP, but where the wastewater loading was much lower and lasted during a longer period [9]. However, on one occasion in December, when the highest P concentration in the ST effluent was recorded (Figure 4), the removal was 93%. Vidal et al. [22] investigated filters for on-site wastewater treatment and found that eight out of nine P-filters removed between 43 and 99% of Total-P. The influent Total-P concentrations varied in that study, mostly between 7.5 and 14.8 mg L−1, while our study system showed Total-P concentrations ranging from 3.9 to 15.1 mg L−1. A filter with 850 L of Filtralite P reduced Total-P by 61% during a test period of 112 days at a wastewater load of 1 m3 d−1 and a mean influent P concentration of 7.8 mg L−1 [4]. The same material was extensively tested in trials for two to three years and the effluent, including pre-filtration step, showed Total-P concentrations below the effluent limit of 1 mg L−1 [3]. However, the filter beds had volumes between 6 and 40 m3 and an estimated lifetime of the media of 15 years. This means that a treatment bed volume of 2.7 m3 yr−1 is needed to meet the effluent limit. Our studied system used 0.7 m3 of Polonite and it is expected to last for one year with the current dimensioning criteria. In December 2018, when the monitoring period ended, the P concentration showed a clear tendency to increase and remain over 1 mg L−1. However, the increase could be related to very low water temperatures in winter, so better removal can be expected during spring (see discussion in Section 4.2).
The SBCW received treated water from the P-filter bag with Total-P and PO4-P concentrations of 0.78 mg L−1 and 0.28 mg L−1, respectively. The slightly higher average concentration of Total-P, with no significant difference between the P-filter bag and SBCW effluents (p > 0.05) but significantly higher PO4-P concentration (p < 0.05) in water in the outlet well, showed that the SBCW released P stored in the sand medium. Our sampling started after the treatment system had been operating for four months and when the P-filter was temporarily not in use, and it is suggested that organic matter and high concentrations of P reached the SBCW. This contamination was even more visible when water was pumped from the wetland, resulting in increasing Total-P concentrations in the outflow (Figure 3). Constructed wetlands with varying flow directions or soil treatment systems using sand/gravel as media are known to have limited ability to remove P [1,23,24]. The planted Typha in the study system has not yet fully established and therefore can probably not contribute much to P uptake and storage in the plant tissue. However, overall plant efficiency in removing P is not large, accounting for between 10.76 and 34.17% [25], or less than 20% [26]. We measured the stem length of cattail in the SBCW and found significantly decreasing length from the inlet towards the outlet zone (data not shown), which could be related to different concentrations of nutrients being available for plant uptake in the substrate.
Retention of P in the study system was expected in the P-filter and in the SBCW. The P-filter did not approach the saturation point, i.e., Ce = Ci, during the short field measurement period. In fact, it would probably take up to 5 years to reach that point, according to modeling results [27]. Due to the unexpected high organic loading of the RFM in this case (see Section 4.2), it is likely that much less time will elapse until breakthrough. However, the filter bag must usually be replaced every two years because of the strict effluent limits for P in Sweden. High P retention in Polonite has been described in many laboratory investigations [28,29], but there have been only a few studies on treatment systems operated under real conditions [9,22]. Experimental systems studied in the laboratory can be controlled better than those operated in the field, particularly when it comes to flow conditions and quality of the influent wastewater. Large discrepancies in estimated P retention can therefore be observed. The P retention of 1.21 g Total-P kg−1 Polonite obtained in our full-scale system is comparable to that reported for a column experiment with real, untreated ST wastewater, where retention was 1.14 g PO4-P kg−1 Polonite [20]. However, the hydraulic loading in that case was 4.6-fold higher than in our full-scale system and the columns were operated at room temperature. It was extrapolated from the column experiment that 78 m3 of wastewater could be treated in 700 L of Polonite (i.e., P-filter bag) with a removal efficiency of 81% [20]. In the latter case, the retention was only estimated as PO4-P, but the Total-P concentration should then approach approximately the same retention rate as ours for Total-P. The P-filter in the present study treated approximately 111 m3 of wastewater and had PO4-P removal efficiency of 94%. The better removal capacity, despite the much lower water temperatures, was probably related to the lower hydraulic loading and pre-treatment before filtering. However, the P retention was almost the same in both studies, which probably depended on the higher influent P concentration in the column experiment.

4.2. Influence of Physical-Chemical Parameters on Nutrient Removal

There are several physical-chemical conditions that can have affected the mechanisms responsible for removal and/or transformation of nutrients in the on-site system. The role of the BF is to degrade organic matter and oxidize NH4-N, while the Polonite has the primary role of trapping P, and the SBCW the multiple role of transforming NO3-N to atmospheric N2, polishing effluent from the P-filter in terms of P, and reducing the pH to desirable levels below 9.
On-site outdoor systems are generally vulnerable to weather conditions. The processes responsible for N and P removal can be affected by temperature and precipitation. There is consensus among researchers that a low-temperature environment is unfavorable for microbial denitrification, but results concerning P and its dependence on temperature are contradictory [30]. The system in the present study received wastewater through 75-m long underground pipes and it was stored in one large and one small septic tank. The large seasonal temperature difference shown in Figure 6 is then suggested to influence the removal processes in the PTP and SBCW. The N and BOD removal showed a clear decline from summer to winter months. The P removal in the P-filter also showed a decline. Sensitivity of P-binding capacity to temperature has been reported by Herrmann et al. [28], who suggest that it is due to decreased precipitation of calcium phosphates at lower temperature. They found for Polonite a 1.5-fold higher binding capacity at 16.5 °C than at 4.3 °C in a column experiment using secondary-treated wastewater. However, when considering the decline in binding capacity, not only temperature but also the aging process of the filter medium in the PTP must be considered. Successive accumulation of organic matter probably occurred in the filter, observed as low DO levels in the BF tank and in the P-filter effluent (Figure 9). Nilsson et al. [19] showed that organic matter (as total organic carbon, TOC) influences the P sorption capacity of Polonite and the bacteria count. The BOD value was surprisingly low, despite the almost hypoxic water, although it increased towards the end of the study period. The minor plant cover in the SBCW probably did not contribute much to the removal of P and N. However, many investigations have shown that plants contribute significantly to removal of N, with denitrification being one of the most important sinks [26].
The high EC values recorded throughout the field test indicate that the household tap water must have been saline. One sample from the water supply system was therefore analyzed for common elements, including Cl- and Na+, and it was found that the Cl and Na+ concentration was 160 mg L−1 and 134 mg L−1, respectively. On-site wastewater usually has an EC around or below 1000 μS cm−1, but in the present case it regularly showed values over 1500 μS cm−1. Salt inhibition effects can occur in PO4-P removal [31], which will probably shorten the life span of the Polonite RFM. Salt in wastewater is a general and often overlooked problem in on-site treatment systems. It is not only caused by NaCl in the water supply, e.g., it can also be the result of use of water softeners that remove the minerals such as calcium and magnesium that cause water hardness. The concentrated brine water regularly released from the softener is usually discharged to the on-site sewerage and on to the treatment system.
The air temperature was unusually high and precipitation was unusually low during the study period, which could have affected the water balance. We considered dilution to be of minor importance, but the estimated volume of 3056 L that infiltrated could still have changed the active-solid water interface and water chemistry, as reported previously for another on-site system [32].

4.3. The SBCW as a pH Reducer for the Alkaline Effluent and a P Post-Precipitation Step

The RFM Polonite used in our full-scale experiment had an initial pH of 12.2 and a varying pH around 9 to the end of the study period (Figure 8). In effluent water, pH ≥ 9 is considered a critical level for aquatic organisms [33]. The environmental authorities in Sweden, which set regulations for on-site treatment systems, have introduced a rule of thumb that effluents from alkaline P-filters must have pH < 9. The SBCW was able to reduce the high pH effluent from the P-filter to around or below 9 (Figure 8). The gravel and sand used in the SBCW had an initial pH of 7.8, which, in the short term, could help to reduce pH. In the long term, the development of biofilm communities can also help to reduce alkalinity. Gomez et al. [34] showed that a diurnal cycle of 1 to 1.5 pH units occurs in biofilm-colonized systems due to CO2 uptake and release, which is associated with respiration and photosynthesis. Conventional buried sand filters, where wastewater is distributed in the top layer of the sand bed and percolates through the unsaturated sand medium, are known to develop biofilm [35]. In the present study, the sand bed in the SBCW also has top-layer distribution pipes, but the sand becomes successively water-saturated during the filling phase until the draining phase starts. It can be assumed that biofilm develops well under such conditions, but the oxygen supply varies much more than in conventional sand filters.
One reason for constructing the combined system was to establish conditions for post-precipitation of P not bound in the Polonite and which is partly lost simultaneously with Ca2+ and or Ca(OH)2. The calcium products can turn into CaCO3 (calcite) during transport to and in the SBCW, but the calcite growth rates are dependent on the solution stoichiometry [36], which can vary widely in this system. Evidence of growth of calcite has been found for RFMs in column experiments [9,37] and in PTPs using Polonite [38]. However, calcite is less reactive for P binding but the continuous transport out from the P-filter bag will feed the SBCW. Figure 2 shows that Polonite contains fine particles that can be washed out from the P-filter bag but they should be trapped in the SBCW. Over time, this pH-increasing loading of calcite can possibly counteract the desired function of the SBCW as a pH reducer. The present study was too short to observe such an influence and more investigations must be performed during coming years to deliver information on this issue.

4.4. Operation and Design Considerations of the SBCW

Research evaluating filling and draining of CWs has found no treatment advantage [11] and extensive removal of organic matter and NH4-N [39]. During the short period we ran the SBCW, it was evident that bacteria, organic matter (measured as BOD7), and NH4-N were significantly removed. In the absence of fully developed stands of Typha latifolia, denitrification could possibly not be completed, but probably occurred because of the effects of water level fluctuations [40]. Different groups of nitrogen-transforming bacteria (NTB) can be present in different layers of a wetland operated with feed and rest periods [41]. The low temperature in the SBCW during at least two months probably limited the development of NTB, while gas exchange to deeper layers was probably not efficient due to the fine sand used here. Figure 2 showed the difference in particle size distribution for a washed and unwashed sand, where the latter was used in the SBCW. The water-holding capacity was high, since only 3 m3 was easily drained of the theoretical calculated pore volume 9 m3. A part of the remaining pore water probably slowly percolated downwards, where it started to mix with the fresh incoming water from the PTP.
The construction of the SBCW must be reconsidered in terms of placement of drainage pipes and covered insulation. The first reason for this change is based on observations that the drainage in the bottom of the SBCW makes shortcuts for the stored water, so that the entire filled water volume is not in contact with the wetland substrate for a reasonable time. A few samples were taken (data not shown) during pumping of water from the wetland and it was found that the P concentration was much higher, up to 10 minutes compared with that in the water after 30 minutes. The conclusion is that the drainage pipes should be located close to the outlet well and that the pumping must take place in such a way that it corresponds to the inflow of water from the SBCW. In this way, no water from the infiltration part with the gravel bed (see Figure 1) can bypass straight to the pumping well.
The second reason for changing the design concerns the conditions in winter and effects of rain and snow. The distribution pipes are only 0.2 m below the gravel bed surface and water tends to freeze in winter, so a 0.5-m thick soil cover and a waterproof liner should be included in the construction. The liner can divert water from rainfall and snow melt to outside the SBCW. The remaining area of the system will receive natural insulation when the plants grow to form a stand and plant litter accumulates on the bed surface.

5. Conclusions

Sustainable on-site treatment solutions must be developed to replace many of the older types that are still in use and are having undesired effects on water bodies and groundwater. In this study, we investigated the function of a PTP receiving wastewater from a septic tank and proposed an add-on unit to polish its effluent. The entire system showed promising capacity to remove N and P, but several disturbances were observed that should be considered in similar PTPs. Low temperature of the wastewater is an issue in cold-climate regions and high concentrations of salt appeared to have negative effects on the nutrient removal processes. The constructed wetland as an add-on system was not able to remove released P from the PTP, but it significantly enhanced N removal during the start-up phase of 25 weeks. However, the planted stand of cattail had not yet developed, so sand filtration was probably the most important of the removal processes. The sequential filling and draining of wastewater to the system could not exchange the total stored volume during every pumping occasion, due to the water-holding capacity of the fine sand used here. As regards system design, changes in the location of drainage pipes are needed to avoid short-cut flows, which affect contact time with the wetland substrate, and insulation of the infiltration part is needed to avoid freezing or temperature decrease and the influence of precipitation. These measures, in a system with a dense stand of cattail, and monitoring of the system over a longer period, will reveal the real capacity of the engineered system and establish grounds for recommendations on its use.

Author Contributions

R.H. conducted the research (data collection in the field, analysis), participated in engineering the system, reviewed most of the literature, and drafted the first manuscript; G.R. supervised the study, constructed the system, and thoroughly revised the manuscript; A.R. was responsible for chemical analyses, supervised R.H. in the laboratory, and revised the manuscript. All authors approved the final version of this article.

Funding

This research work was financially supported by the Lars Erik Lundberg scholarship foundation by grant number (696881:2017/2018) to Rajabu Hamisi.

Acknowledgments

Many thanks to the owners of the farm where our full-scale experiment was performed, for their genuine hospitality, inviting us for lunches and coffee breaks. Their help with machines and other equipment to prepare the constructed wetland and help with monitoring was of exceptional importance for the project. The assistance from the construction firm Team Wåhlin Mark & Asfalt Aktiebolag is also acknowledged.

Conflicts of Interest

The authors declare no conflict of interest. The funders had no role in the design of the study; in the collection, analyses, or interpretation of data; in the writing of the manuscript; or in the decision to publish the results.

References

  1. Eveborn, D.; Gustafsson, J.P.; Elmefors, E.; Yu, L.; Eriksson, A.K.; Ljung, E.; Renman, G. Phosphorus in soil treatment systems: Accumulation and mobility. Water Res. 2014, 64, 42–52. [Google Scholar] [CrossRef] [PubMed] [Green Version]
  2. Gao, Q.; Blum, K.M.; Gago-Ferrero, P.; Wiberg, K.; Ahrens, L.; Andersson, P.L. Impact of on-site wastewater infiltration systems on organic contaminants in groundwater and recipient waters. Sci. Total Environ. 2019, 651, 1670–1679. [Google Scholar] [CrossRef] [PubMed]
  3. Jenssen, P.D.; Krogstad, T.; Paruch, A.M.; Mæhlum, T.; Adam, K.; Arias, C.A.; Heistad, A.; Jonsson, L.; Hellström, D.; Brix, H.; et al. Filter bed systems treating domestic wastewater in the Nordic countries—Performance and reuse of filter media. Ecol. Eng. 2010, 36, 1651–1659. [Google Scholar] [CrossRef]
  4. Mažeikienė, A. Improving small-scale wastewater treatment plant performance by using a filtering tertiary treatment unit. J. Environ. Manag. 2019, 232, 336–341. [Google Scholar] [CrossRef] [PubMed]
  5. Karczmarczyk, A.; Bus, A.; Baryła, A. Influence of operation time, hydraulic load and drying on phosphate retention capacity of mineral filters treating natural swimming pool water. Ecol. Eng. 2019, 130, 176–183. [Google Scholar] [CrossRef]
  6. Cucarella, V.; Renman, G.; Zaleski, T.; Mazurek, R. Recycling of calcium-silicate material after wastewater filtration to agriculture-Soil condition impact. Ecol. Chem. Eng. S 2012, 19, 373–382. [Google Scholar] [CrossRef]
  7. Vohla, C.; Kõiv, M.; Bavor, H.J.; Chazarenc, F.; Mander, Ü. Filter materials for phosphorus removal from wastewater in treatment wetlands—A review. Ecol. Eng. 2011, 37, 70–89. [Google Scholar] [CrossRef]
  8. Renman, A.; Hylander, L.D.; Renman, G. Transformation and removal of nitrogen in reactive bed filter materials designed for on-site wastewater treatment. Ecol. Eng. 2008, 34, 207–214. [Google Scholar] [CrossRef]
  9. Renman, A.; Renman, G. Long-term phosphate removal by the calcium-silicate material Polonite in wastewater filtration systems. Chemosphere 2010, 79, 659–664. [Google Scholar] [CrossRef]
  10. Healy, M.G.; Rodgers, M.; Mulqueen, J. Treatment of dairy wastewater using constructed wetlands and intermittent sand filters. Bioresour. Technol. 2007, 98, 2268–2281. [Google Scholar] [CrossRef]
  11. House, C.H.; Bergmann, B.A.; Stomp, A.M.; Frederick, D.J. Combining constructed wetlands and aquatic and soil filters for reclamation and reuse of water. Ecol. Eng. 1999, 12, 27–38. [Google Scholar] [CrossRef]
  12. Liu, R.; Zhao, Y.; Doherty, L.; Hu, Y.; Hao, X. A review of incorporation of constructed wetland with other treatment processes. Chem. Eng. J. 2015, 279, 220–230. [Google Scholar] [CrossRef]
  13. Wu, S.; Kuschk, P.; Brix, H.; Vymazal, J.; Dong, R. Development of constructed wetlands in performance intensifications for wastewater treatment: A nitrogen and organic matter targeted review. Water Res. 2014, 57, 40–55. [Google Scholar] [CrossRef] [PubMed]
  14. Nivala, J.; Headley, T.; Wallace, S.; Bernhard, K.; Brix, H.; van Afferden, M.; Müller, R.A. Comparative analysis of constructed wetlands: The design and construction of the ecotechnology research facility in Langenreichenbach, Germany. Ecol. Eng. 2013, 61, 527–543. [Google Scholar] [CrossRef]
  15. Renman, G.; Kietlińska, A. A compact constructed wetland for treatment of landfill leachate. Inter. Ver. Theor. Angew. Limnol. Verhandl. 2000, 27, 629–632. [Google Scholar] [CrossRef]
  16. Kietlińska, A.; Renman, G.; Jannes, S.; Tham, G. Nitrogen removal from landfill leachate using a compact constructed wetland and the effect of chemical pretreatment. J. Environ. Sci. Health 2005, 40, 1493–1506. [Google Scholar] [CrossRef]
  17. Ilyas, H.; Masih, I. Intensification of constructed wetlands for land area reduction: A review. Environ. Sci. Pollut. Res. 2017, 24, 12081–12091. [Google Scholar] [CrossRef]
  18. Paranychianakis, N.V.; Tsiknia, M.; Kalogerakis, N. Pathways regulating the removal of nitrogen in planted and unplanted subsurface flow constructed wetlands. Water Res. 2016, 102, 321–329. [Google Scholar] [CrossRef]
  19. He, H.; Chen, Y.; Li, X.; Cheng, Y.; Yang, C.; Zeng, G. Influence of salinity on microorganisms in activated sludge processes: A review. Int. Biodeterior. Biodegrad. 2017, 119, 520–527. [Google Scholar] [CrossRef]
  20. Nilsson, C.; Lakshmanan, R.; Renman, G.; Rajarao, G.K. Efficacy of reactive mineral-based sorbents for phosphate, bacteria, nitrogen and TOC removal-Column experiment in recirculation batch mode. Water Res. 2013, 47, 5165–5175. [Google Scholar] [CrossRef]
  21. Brogowski, Z.; Renman, G. Characterization of opoka as a basis for its use in wastewater treatment. Pol. J. Environ. Stud. 2004, 13, 15–20. [Google Scholar]
  22. Vidal, B.; Hedström, A.; Herrmann, I. Phosphorus reduction in filters for on-site wastewater treatment. J. Water Process Eng. 2018, 22, 210–217. [Google Scholar] [CrossRef]
  23. Adera, S.; Drizo, A.; Twohig, E.; Jagannathan, K.; Benoit, G. Improving performance of treatment wetlands: Evaluation of supplemental aeration, varying flow direction, and phosphorus removing filters. Water Air Soil Pollut. 2018, 229, 100. [Google Scholar] [CrossRef]
  24. Eveborn, D.; Kong, D.; Gustafsson, J.P. Wastewater treatment by soil infiltration: Long-term phosphorus removal. J. Contamin. Hydrol. 2012, 140, 24–33. [Google Scholar] [CrossRef] [PubMed]
  25. Wu, H.; Zhang, J.; Ngo, H.H.; Guo, W.; Hu, Z.; Liang, S.; Fan, J.; Liu, H. A review on the sustainability of constructed wetlands for wastewater treatment: Design and operation. Bioresour. Technol. 2015, 175, 594–601. [Google Scholar] [CrossRef]
  26. Maltais-Landry, G.; Maranger, R.; Brisson, J.; Chazarenc, F. Nitrogen transformations and retention in planted and artificially aerated constructed wetlands. Water Res. 2009, 43, 535–545. [Google Scholar] [CrossRef] [PubMed]
  27. Hamisi, R.; Renman, G.; Renman, A.; Wörman, A. Modelling Phosphorus Sorption Kinetics and the Longevity of Reactive Filter Materials Used for On-site Wastewater Treatment. Water 2019, 11, 811. [Google Scholar] [CrossRef]
  28. Herrmann, I.; Nordqvist, K.; Hedström, A.; Viklander, M. Effect of temperature on the performance of laboratory-scale phosphorus-removing filter beds in on-site wastewater treatment. Chemosphere 2014, 117, 360–366. [Google Scholar] [CrossRef]
  29. Renman, A. On-Site Wastewater Treatment: Polonite and Other Filter Materials for Removal of Metals, Nitrogen and Phosphorus. Ph.D. Dissertation, KTH Royal Institute of Technology, Stockholm, Sweden, 2008. Available online: http://www.diva-portal.org/smash/get/diva2:14097/FULLTEXT01.pdf (accessed on 10 May 2019).
  30. Wang, M.; Zhang, D.Q.; Dong, J.W.; Tan, S.K. Constructed wetlands for wastewater treatment in cold climate—A review. J. Environ. Sci. 2017, 57, 293–311. [Google Scholar] [CrossRef]
  31. Uygur, A.; Kargı, F. Salt inhibition on biological nutrient removal from saline wastewater in a sequencing batch reactor. Enzyme Microb. Technol. 2004, 34, 313–318. [Google Scholar] [CrossRef]
  32. Eregno, F.E.; Heistad, A. On-site treated wastewater disposal systems—The role of stratified filter medias for reducing the risk of pollution. Environ. Int. 2019, 124, 302–311. [Google Scholar] [CrossRef] [PubMed]
  33. Abel, S.; Akkanen, J. Novel, Activated Carbon-Based Material for in-Situ Remediation of Contaminated Sediments. Environ. Sci. Technol. 2019, 53, 3217–3224. [Google Scholar] [CrossRef] [PubMed] [Green Version]
  34. Gomes, H.I.; Rogerson, M.; Burke, I.T.; Stewart, D.I.; Mayes, W.M. Hydraulic and biotic impacts on neutralisation of high-pH waters. Sci. Total Environ. 2017, 601, 1271–1279. [Google Scholar] [CrossRef] [PubMed]
  35. Kauppinen, A.; Martikainen, K.; Matikka, V.; Veijalainen, A.M.; Pitkänen, T.; Heinonen-Tanski, H.; Miettinen, I.T. Sand filters for removal of microbes and nutrients from wastewater during a one-year pilot study in a cold temperate climate. J. Environ. Manag. 2014, 133, 206–213. [Google Scholar] [CrossRef]
  36. Wolthers, M.; Nehrke, G.; Gustafsson, J.P.; Van Cappellen, P. Calcite growth kinetics: Modeling the effect of solution stoichiometry. Geochim. Cosmochim. Acta 2012, 77, 121–134. [Google Scholar] [CrossRef] [Green Version]
  37. Drizo, A.; Forget, C.; Chapuis, R.P.; Comeau, Y. Phosphorus removal by electric arc furnace steel slag and serpentinite. Water Res. 2006, 40, 1547–1554. [Google Scholar] [CrossRef] [PubMed]
  38. Niska, K.G.; (Skandinavisk Ecotech AB). Personal communication, 12 September 2018.
  39. Sun, G.; Zhao, Y.; Allen, S. Enhanced removal of organic matter and ammoniacal-nitrogen in a column experiment of tidal flow constructed wetland system. J. Biotechnol. 2005, 115, 189–197. [Google Scholar] [CrossRef] [PubMed] [Green Version]
  40. Tanner, C.C.; D’Eugenio, J.; McBride, G.B.; Sukias, J.P.; Thompson, K. Effect of water level fluctuation on nitrogen removal from constructed wetland mesocosms. Ecol. Eng. 1999, 12, 67–92. [Google Scholar] [CrossRef]
  41. Pelissari, C.; Ávila, C.; Trein, C.M.; García, J.; de Armas, R.D.; Sezerino, P.H. Nitrogen transforming bacteria within a full-scale partially saturated vertical subsurface flow constructed wetland treating urban wastewater. Sci. Total Environ. 2017, 574, 390–399. [Google Scholar] [CrossRef] [PubMed] [Green Version]
Figure 1. The on-site treatment system in October 2018, showing (a) the clarifier tank in the foreground, the PTP (package treatment plant) on the mound to the left, and the SBCW (Sequencing batch constructed wetland) in the background; and (b) close-up of the SBCW, where the green and grey pipes are for convective aeration and the gravel bed is the infiltration area, followed by a bed with sand, planted with cattail (Typha latifolia). The outlet pump well is visible at the far end of the sand bed.
Sustainability 11 03172 g001
Figure 2. Particle size distribution of the unwashed sand-gravel material used in the sequencing batch constructed wetland (SBCW) and the unwashed Polonite used in the P-filter bag. The difference between the unwashed and washed fraction indicates the share of fine particles present in the materials.
Sustainability 11 03172 g002
Figure 3. Box-plot showing (data range, quartile range, and mean values, dots indicating outliers) the concentrations of total phosphorus (Total-P) and phosphate-phosphorus (PO4-P) at different sampling points in the on-site system. ST = septic tank, BF = biofiltration tank, SBCW = sequencing batch constructed wetland.
Sustainability 11 03172 g003
Figure 4. Change in total phosphorus (Total-P) concentration in the septic tank (ST), biofiltration tank (BF), P-Filter, and sequencing batch constructed wetland (SBCW) units of the on-site system during the study period.
Sustainability 11 03172 g004
Figure 5. Box-plot showing (data range, quartile range, and mean values, dots indicating outliers) the concentrations of ammonium-nitrogen (NH4-N), nitrate-nitrogen (NO3-N), and nitrite-nitrogen (NO2-N) at different sampling points in the on-site system during the entire study period. Concentrations of NO3-N, NO2-N in the septic tank (ST) effluent were below 1 and 0.05 mg L−1. BF = biofiltration tank, SBCW = sequencing batch constructed wetland.
Sustainability 11 03172 g005
Figure 6. Mean water temperature in the different units of the on-site system. ST = septic tank, BF = biofiltration tank, SBCW = sequencing batch constructed wetland.
Sustainability 11 03172 g006
Figure 7. Change in EC in water flowing out from different units of the on-site system. Values missing for sampling occasion 12 December 2018. ST = septic tank, BF = biofiltration tank, SBCW = sequencing batch constructed wetland.
Sustainability 11 03172 g007
Figure 8. Changes in pH in water flowing out from different units of the on-site system. ST = septic tank, BF = biofiltration tank, SBCW = sequencing batch constructed wetland.
Sustainability 11 03172 g008
Figure 9. Concentration (box plot with data range, quartile range, and mean values) of dissolved oxygen (DO) in water flowing from different units of the on-site system. ST = septic tank, BF = biofiltration tank, SBCW = sequencing batch constructed wetland.
Sustainability 11 03172 g009
Table 1. Occurrence of bacteria and results of BOD measurements in the septic tank, P-filter, and sequencing batch constructed wetland (SBCW) during the study period.
ParameterSeptic TankP-filterSBCW
JulySept.Dec.JulySept.Dec.JulySept.Dec.
BOD7 (mg L−1)91.295.1101.52.12.22.9<1.0<1.02.4
E. coli (cfu/100 mL)790008200096000911135002273
Intestinal enterococci (cfu/100 mL)390003600037000210241205055135

