Developing Sustainable City Indicators for Cambodia through Delphi Processes of Panel Surveys


Abstract
:1. Introduction
2. Materials and Methods
2.1. Method Selection
2.2. Framework Initiation
2.3. Relevant Indicator Selection, Review, and Classification
- (1)
- UN Sustainable Development Goals (SDGs) are a major step forward and an improvement on the Millennium Development Goals (MDGs) [11,85] and agreed in the UN 2030 Agenda for Sustainable Development. The SDGs addressed 17 goals and 169 targets [86,87,88,89]. The goal 11 addressed 10 targets, and its indicators were reviewed in Table 1 in the column ‘SDG 11′ [30,31].
- (2)
- ASEAN Environmentally Sustainable City (ESC) is the initiative of ASEAN, the Association of Southeast Asian Nations (Brunei, Cambodia, Indonesia, Laos, Malaysia, Myanmar, Philippines, Singapore, Thailand, and Vietnam), which was endorsed by the ASEAN Environment Ministers in 2005 in order to pursue environmental sustainability in the rapidly-growing cities of ASEAN [90]. The ESC indicators were reviewed in Table 1 in the column ‘ESC’ [91].
- (3)
- Korean HAN refers to the Korean case study indicators, which were developed by Sang-mi Han and Myeong-hun Lee [92]. This research developed indicators based on the UN Sustainable Development Goal 11 indicators, HABITAT indicators and Korea’s relevant indicators. The developed indicators were reviewed in Table 1 in the column ‘HAN’.
- (4)
- GC refers to the green city development project in Cambodia. The government through its NCSD implemented the project named ‘Green Urban Development Program’ with the support from GGGI and produced the green city strategic planning methodology [9] and green city strategic plan for Phnom Penh 2017 to 2026 [16]. The indicators attached with their sectoral objectives were reviewed in Table 1 in the column ‘GC’ [16].
- (5)
- CC refers to the clean city standard of Cambodia produced by the National Committee for Clean City Assessment in order to monitor and evaluate the cities through a clean city contest every three years. The winning cities will be awarded by the Prime Minister of Cambodia in the following three names ‘Clean City Romduol I, II, and III’ upon the winning score [32,33]. The CC indicators were reviewed in Table 1 in the column ‘CC’ [15].
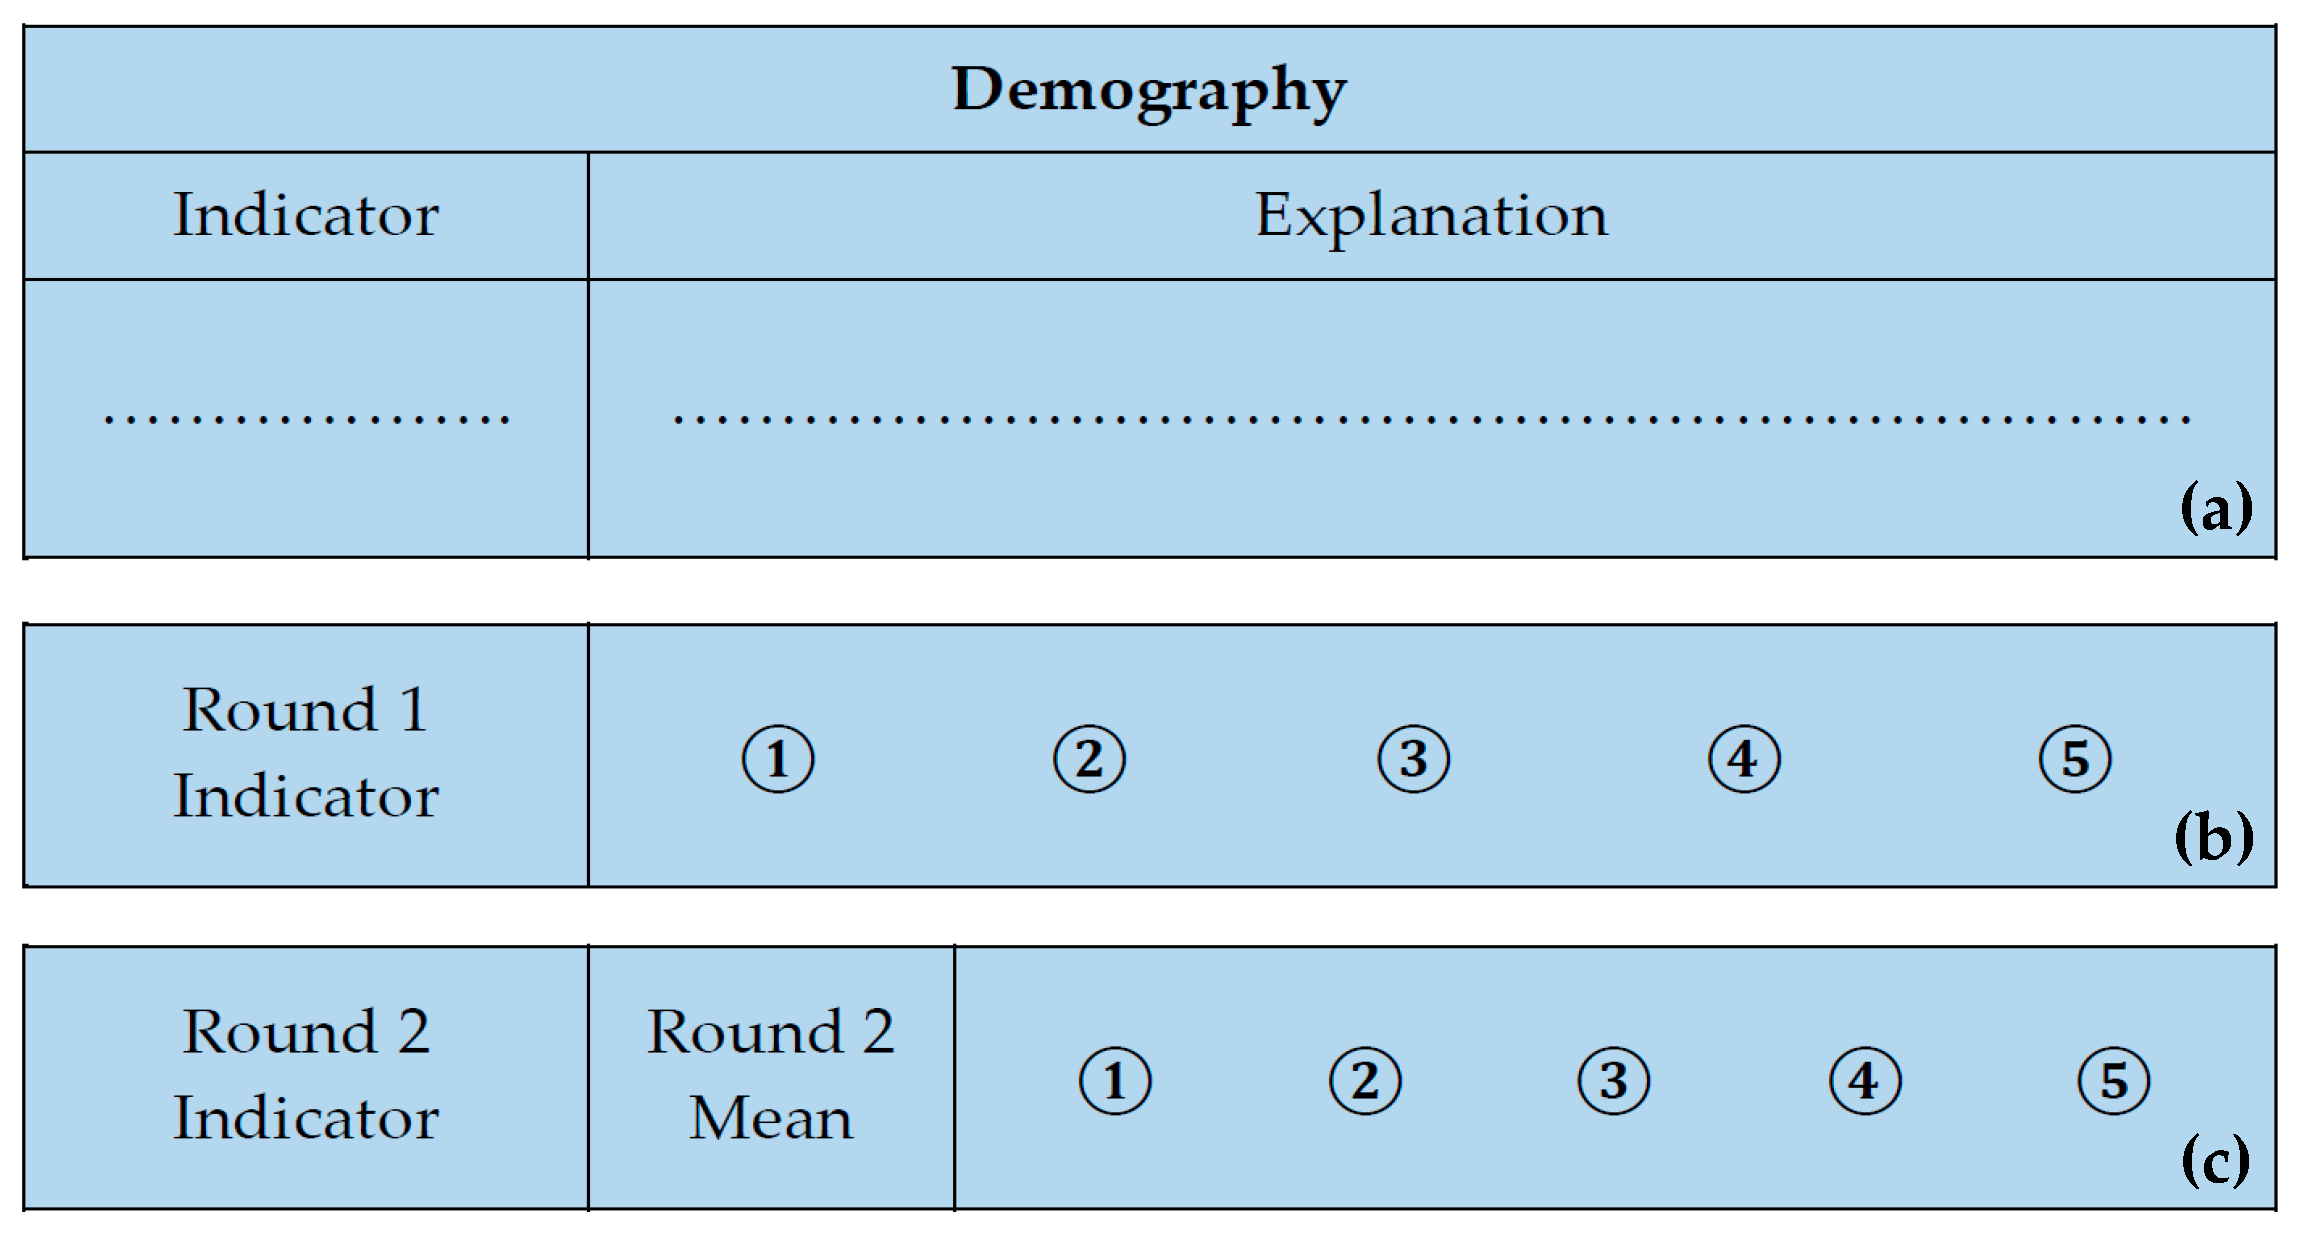
2.4. Questionnaire Development
2.5. Conducting Panel Surveys
2.5.1. Place of Panel Surveys
2.5.2. Panelist Selection, Invitation, and Participation
2.5.3. Panel Survey Processes
2.6. Analyzing Consensus and Investigation
3. Results
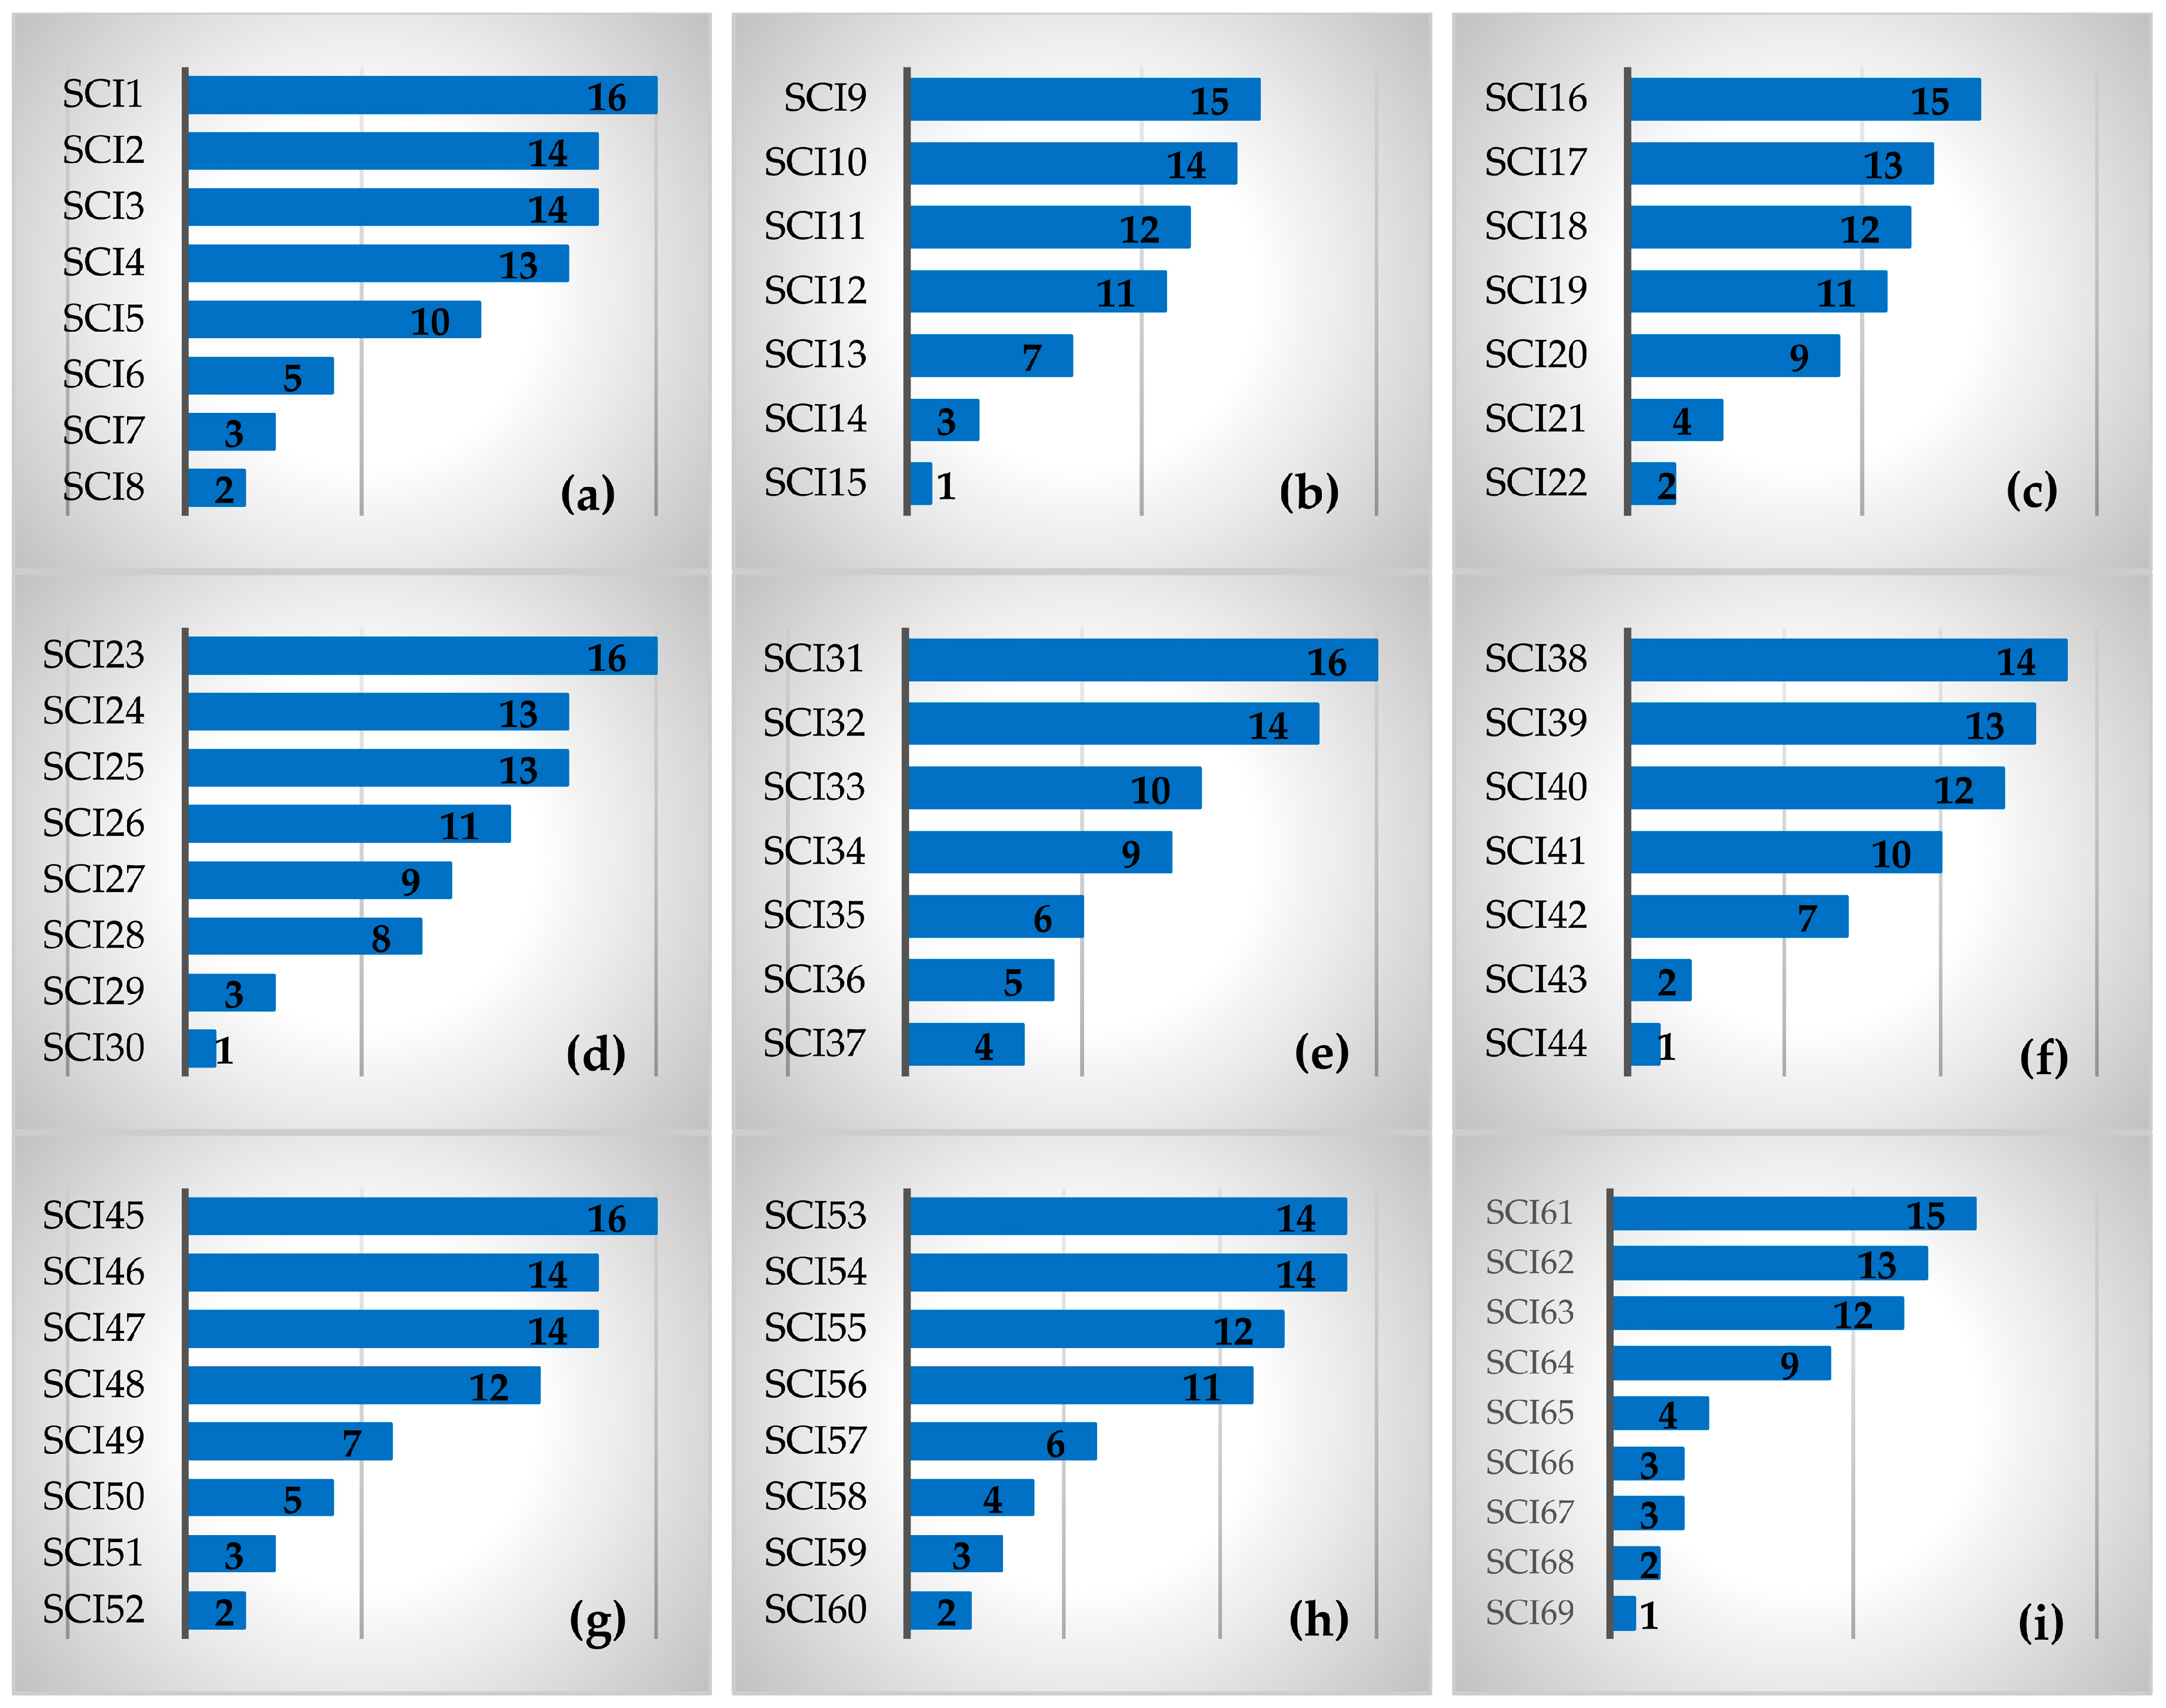
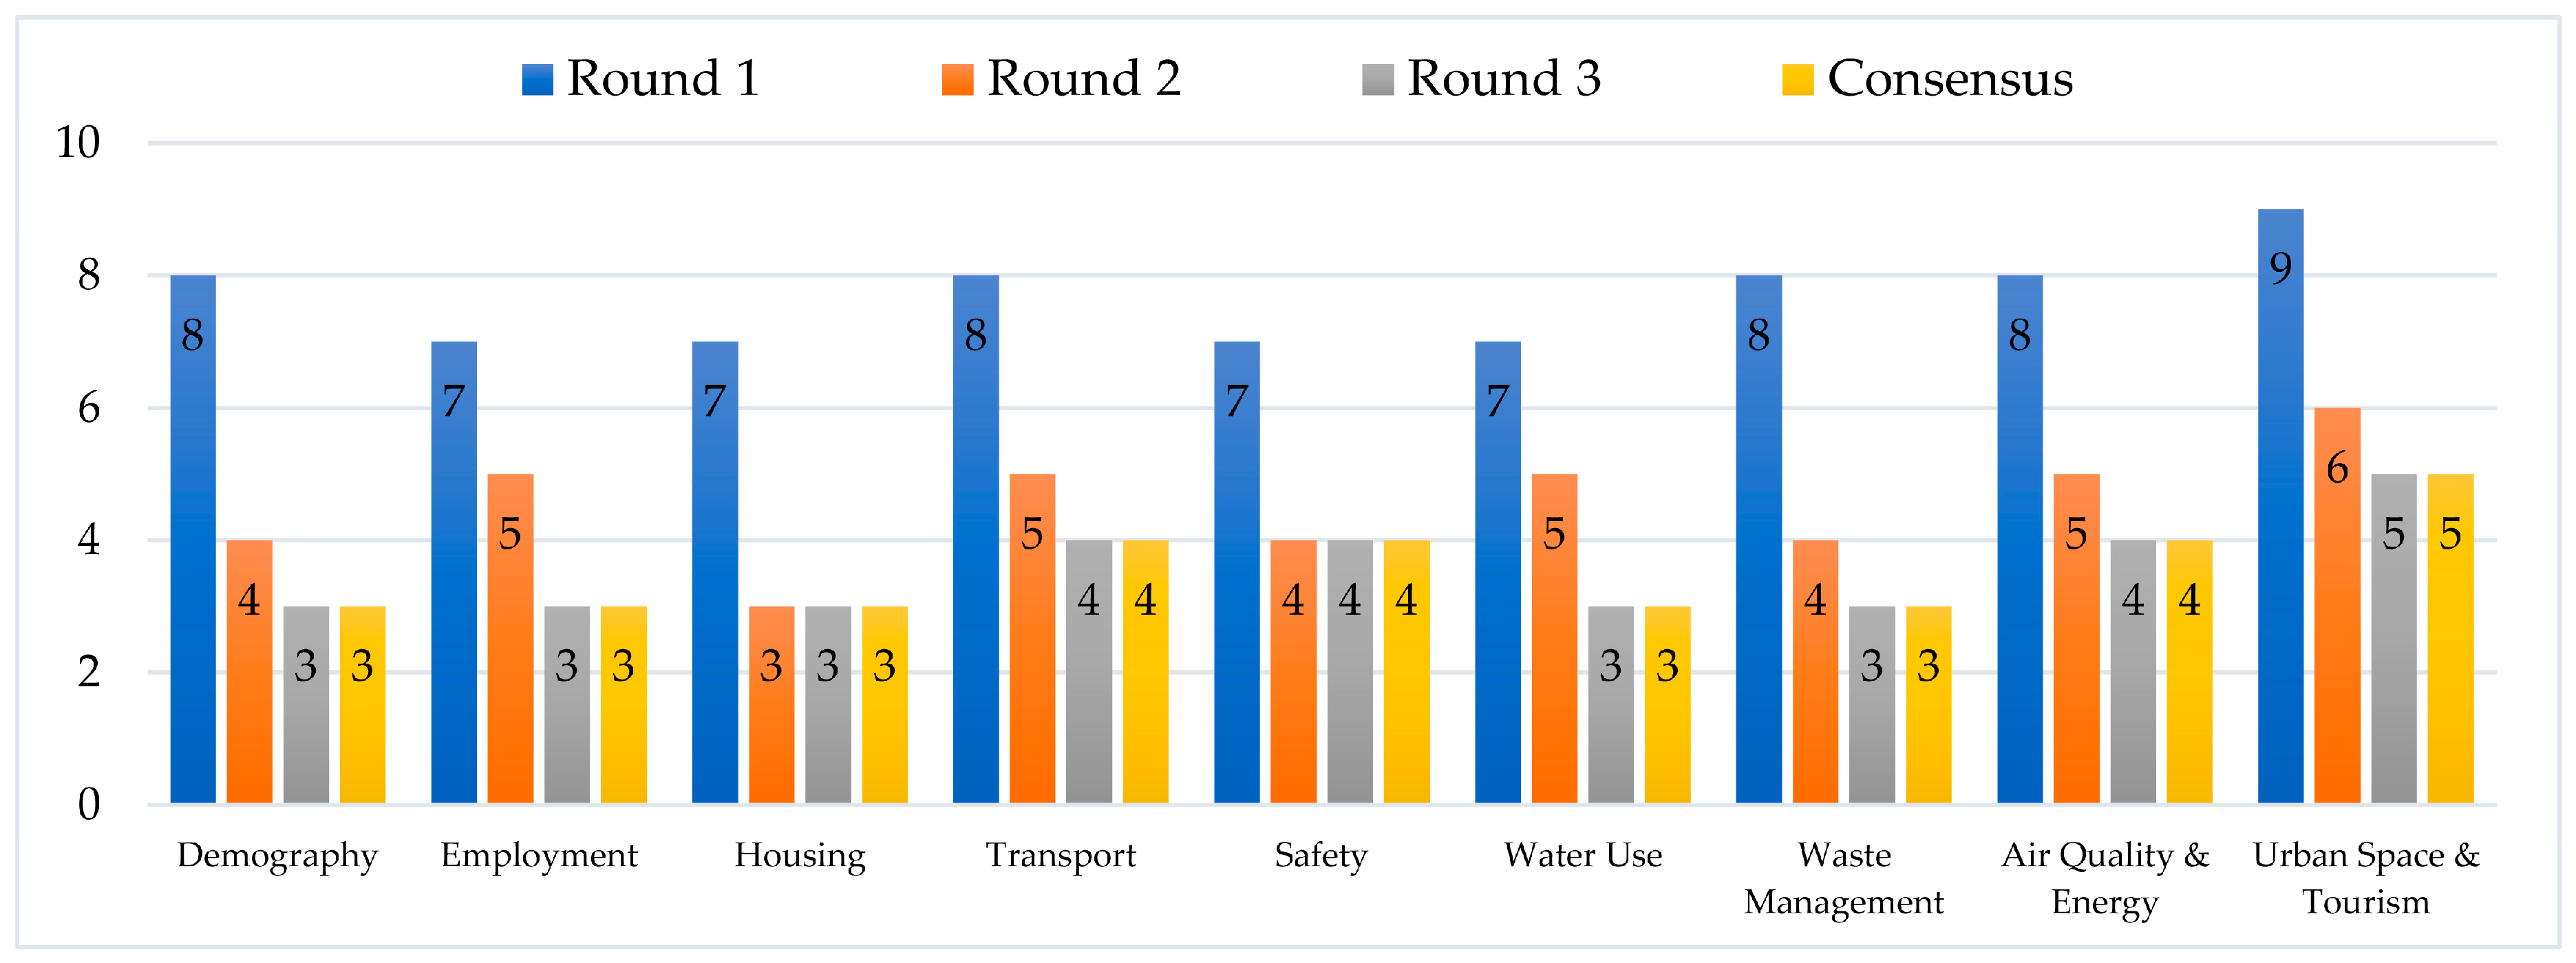
3.1. Indicator Development in Delphi Round 1
3.2. Indicator Pre-Validation in Delphi Round 2
3.3. Indicator Validation in Delphi Round 3
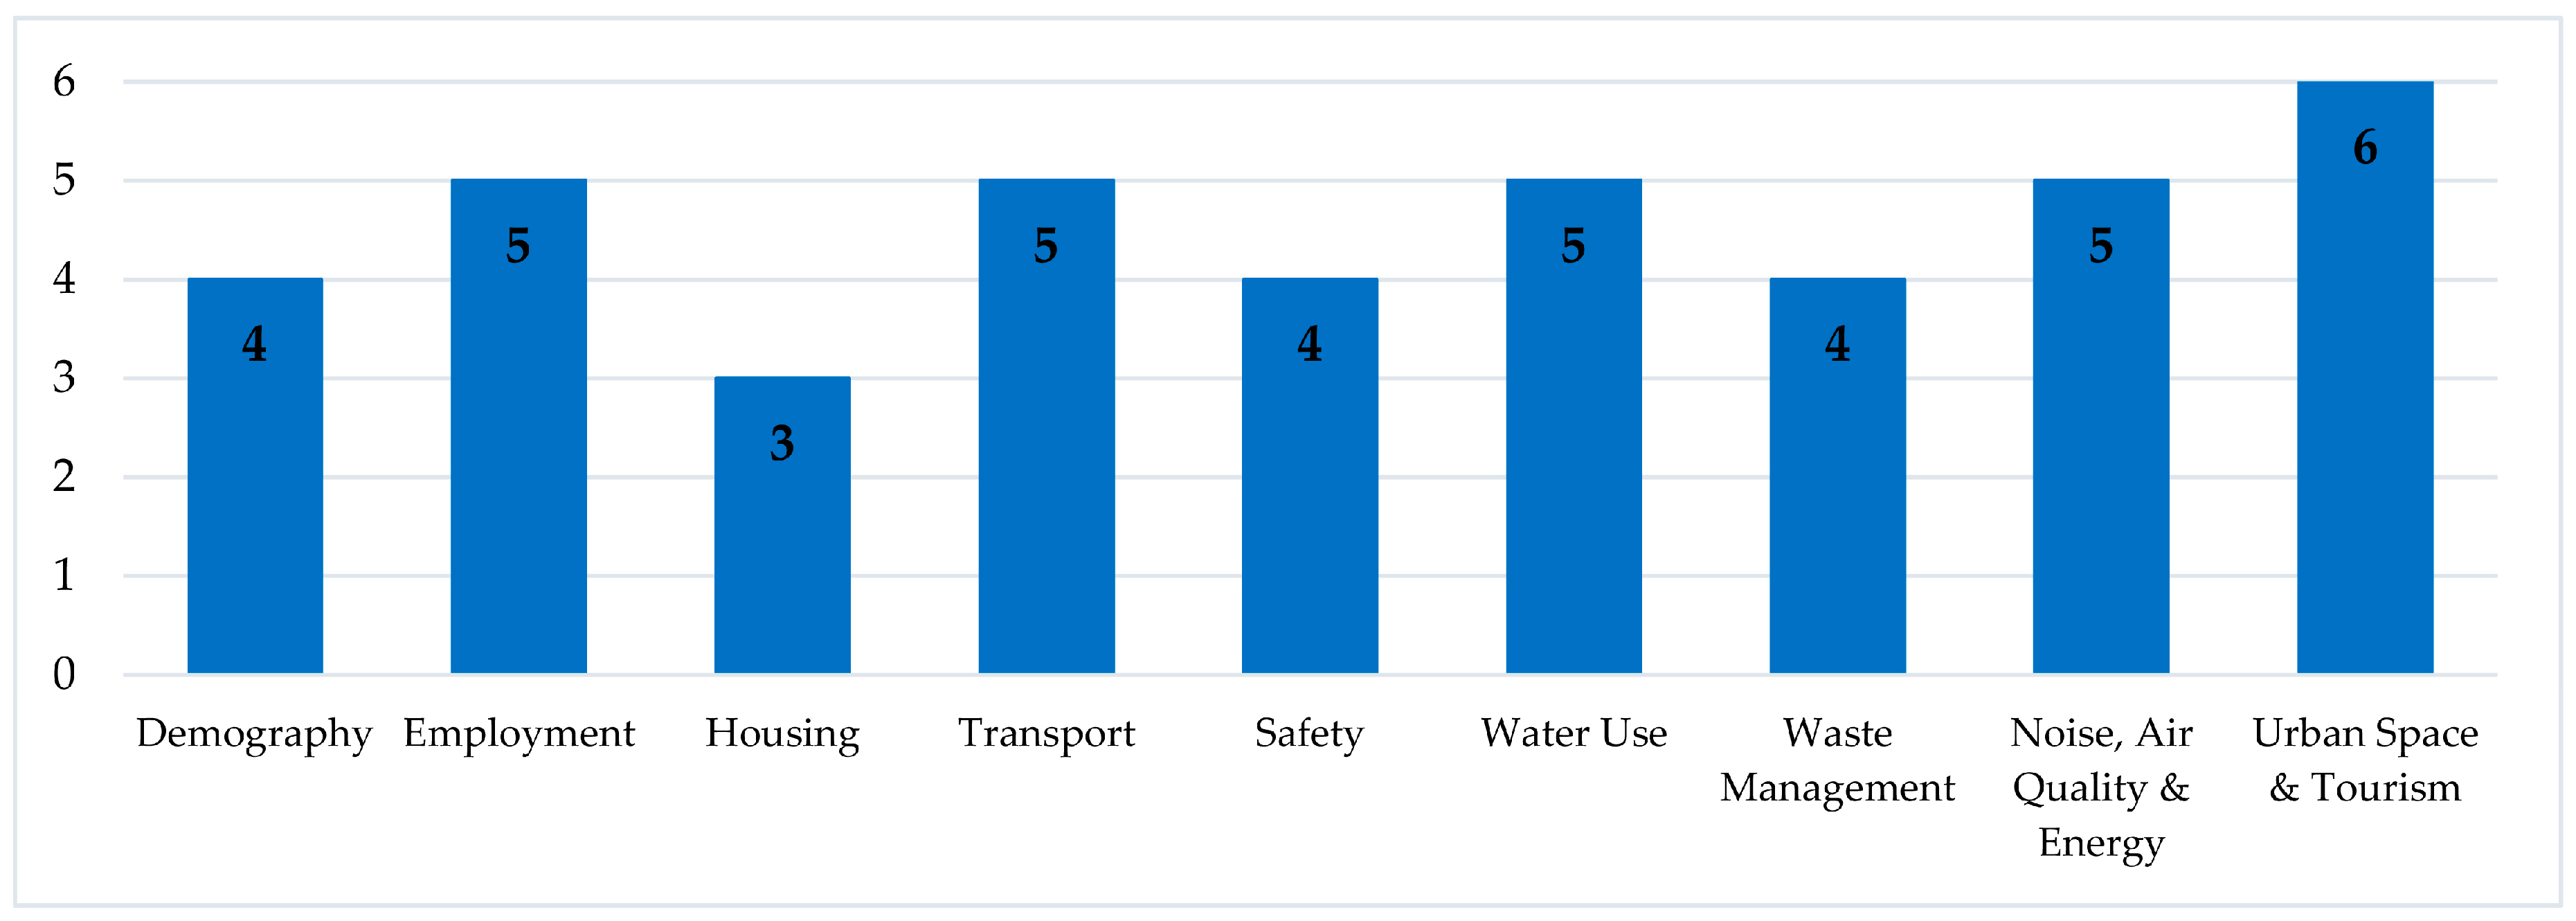
3.4. Consensus Analysis
3.5. Development, Validation, and Consensus
3.6. Correlation of Green and Clean City, UN SDG 11, and Consensus Indicators
4. Discussion
5. Conclusions
Author Contributions
Funding
Acknowledgments
Conflicts of Interest
Appendix A. Delphi Technique

| Section | Explanation |
|---|---|
| Background | Delphi technique was developed during the 1950s by workers at the RAND Corporation while involved in a US Air Force sponsored project [56,57] and it is used as a systematic procedure to evoke expert opinion and usually conducted through a series of questionnaires [58,59,60,61]. It has become a widely used tool for measuring and aiding forecasting and decision making in a variety of disciplines [57,62]. |
| Purposes | Delphi method had been used in many areas and can be used for any purpose requiring the use of committees [58,59,60,61,62]. Based on many studies, Sourani and Sohail (2015) presented Delphi as useful to (a) obtain accurate information that is unavailable, (b) handle complex problems that require more judgmental analysis, (c) define areas where there is considerable uncertainty and/or a lack of agreed knowledge or disagreement, (d) allow for combining fragmentary perspectives into a collective understanding, (e) model a real-world phenomenon involving a range of viewpoints and for which there is little established quantitative evidence, and (f) highlight topics of concern and assess uncertainty in a quantitative manner [63,64,65,66,67,68,69,70,71,72,73,74,75,76,77]. |
| Characteristics | Delphi technique has three main characteristics: (1) Anonymity allows individuals to provide their opinions and judgments through questionnaires; (2) iteration gives opportunity to individuals to change their opinions and judgments; and (3) statistical response provides the previous round opinions and judgments through simple statistical summary (a mean or median value) [56,57,58,59,60,61,62,63]. These characteristics are necessary to define the attributes of the Delphi procedure, although there are numerous ways in which they may be applied [57]. Furthermore, the processes continues for a pre-determined number of rounds or until some predetermined criterion has been met, e.g., reaching consensus (see Figure A1) [63]. |
| Selection of panelists | Delphi technique generally uses expertise panel. Martino (1983) argued that an expert may be defined in broad terms as ‘someone who has special knowledge about the specific subject’ [58] (p. 27). Furthermore, key criteria for selecting the experts to participate in a Delphi process of panel surveys are knowledge; however, criteria of willingness and availability to participate are also important to consider [58,61,78]. This attribute may be considered secondary to the knowledge or degree of expertness [58,63]. |
| Number of panelists | In general, Delphi studies use different sizes of panels [63]. Weidman and colleagues (2011) did not specify the number of experts needed for a Delphi study; however, it is recognized that a minimum appropriate size would include 7 or 8 experts [79]. Mitchell and McGoldrick (1994) argued that the size should be no less than 8 to 10 members [38]. Hallowell and Gambatese (2010) mentioned that most studies incorporated 8 to 16 experts and suggested a minimum of 8 and they also argued that the specific number should be determined by the research characteristics [63,78,80]. |
| Number of rounds | Number of rounds in Delphi studies is varied. Chong and Zin (2010) argued that the number of rounds should be based on the objectives of research [63,81]. Gunhan and Arditi (2005) mentioned that most changes in responses took place in the first two rounds and that little was gained after that [63,82]. Hallowell and Gambatese (2010) presented the advantage of having a three-round Delphi, which facilitates obtaining reasons for outlying responses from Round 2 and reporting these in Round 3; such a process could facilitate the consideration of all options and the attainment of a consensus about the correct value instead of conforming to an incorrect opinion [63,78]. |
| Time consuming | By using a Delphi method to develop the agreed set of economic sustainability criteria that should be addressed in a procumbent strategy, Sourani and Sohail (2015) argued that Delphi could be time-consuming for participating experts because the experts are busy people. With the need for them to respond to several rounds, there is a considerable risk of drop out by some of them. A sufficient number of experts should, therefore, be appointed. Measures to reduce possible fatigue should be considered, including proper research design [63]. |
| Consensus | From a review of a wide range of Delphi studies, it is shown that authors measured consensus in different ways. Jones and Hunter [83] and Hughes [84] argued that the purpose of measuring consensus is to determine the extent to which experts agree about a given issue. Quite commonly, the extent of consensus was measured by the percentages of respondents agreeing on certain answers; for example, Sourani and Sohail [63] argued that based on a 5-point Likert-type scale, the certain criterion can be established based on having 75% or more of the respondents agreeing on giving a ranking that is equal to or above 3. |

Appendix B. Delphi Results and Consensus
| Category | Indicator | Round 1 | Round 2 | Round 3 | Consensus ≥3 and ≥75 % | ||||
|---|---|---|---|---|---|---|---|---|---|
| N | % | Mean | SD | Mean | SD | ||||
| Demography | SCI1 | 16 | 100 | 3.94 | 0.83 | 3.90 | 0.83 | 100.00 | √ |
| SCI2 | 14 | 88 | 3.63 | 0.99 | 2.90 | 0.83 | x | x | |
| SCI3 | 14 | 88 | 3.88 | 0.99 | 4.20 | 0.60 | 100.00 | √ | |
| SCI4 | 13 | 81 | 2.94 | 0.75 | x | x | x | x | |
| SCI5 | 10 | 63 | 2.88 | 0.60 | x | x | x | x | |
| SCI6 | 5 | 31 | 3.81 | 0.88 | 3.60 | 0.92 | 90.00 | √ | |
| SCI7 | 3 | 19 | 2.75 | 0.90 | x | x | x | x | |
| SCI8 | 2 | 13 | 2.88 | 0.86 | x | x | x | x | |
| Employment | SCI9 | 15 | 94 | 3.88 | 0.93 | 4.20 | 0.75 | 100.00 | √ |
| SCI10 | 14 | 88 | 3.75 | 0.75 | 3.50 | 0.81 | 90.00 | √ | |
| SCI11 | 12 | 75 | 3.75 | 1.15 | 2.80 | 0.98 | x | x | |
| SCI12 | 11 | 69 | 4.06 | 0.90 | 4.60 | 0.49 | 100.00 | √ | |
| SCI13 | 7 | 44 | 2.81 | 1.18 | x | x | x | x | |
| SCI14 | 3 | 19 | 2.88 | 1.11 | x | x | x | x | |
| SCI15 | 1 | 6 | 3.44 | 1.17 | 2.90 | 0.83 | x | x | |
| Housing | SCI16 | 15 | 94 | 4.38 | 0.78 | 4.70 | 0.46 | 100.00 | √ |
| SCI17 | 13 | 81 | 3.69 | 0.77 | 3.60 | 0.66 | 100.00 | √ | |
| SCI18 | 12 | 75 | 3.50 | 1.22 | 3.90 | 0.94 | 90.00 | √ | |
| SCI19 | 11 | 69 | 2.94 | 1.09 | x | x | x | x | |
| SCI20 | 9 | 56 | 2.88 | 0.78 | x | x | x | x | |
| SCI21 | 4 | 25 | 2.69 | 0.92 | x | x | x | x | |
| SCI22 | 2 | 13 | 2.94 | 0.83 | x | x | x | x | |
| Transport | SCI23 | 16 | 100 | 4.06 | 0.83 | 3.90 | 1.04 | 90.00 | √ |
| SCI24 | 13 | 81 | 3.75 | 0.90 | 3.80 | 0.60 | 100.00 | √ | |
| SCI25 | 13 | 81 | 4.50 | 0.71 | 4.80 | 0.40 | 100.00 | √ | |
| SCI26 | 11 | 69 | 4.13 | 1.05 | 4.10 | 0.83 | 100.00 | √ | |
| SCI27 | 9 | 56 | 3.94 | 1.14 | 2.90 | 1.04 | x | x | |
| SCI28 | 8 | 50 | 2.94 | 1.03 | x | x | x | x | |
| SCI29 | 3 | 19 | 2.88 | 1.11 | x | x | x | x | |
| SCI30 | 1 | 6 | 2.75 | 1.25 | x | x | x | x | |
| Safety | SCI31 | 16 | 100 | 3.94 | 0.90 | 4.20 | 0.75 | 100.00 | √ |
| SCI32 | 14 | 88 | 3.63 | 0.86 | 3.70 | 0.64 | 100.00 | √ | |
| SCI33 | 10 | 63 | 3.94 | 1.09 | 3.90 | 0.70 | 100.00 | √ | |
| SCI34 | 9 | 56 | 3.63 | 1.05 | 3.50 | 0.67 | 100.00 | √ | |
| SCI35 | 6 | 38 | 2.63 | 0.86 | x | x | x | x | |
| SCI36 | 5 | 31 | 2.94 | 1.03 | x | x | x | x | |
| SCI37 | 4 | 25 | 2.81 | 1.01 | x | x | x | x | |
| Water Use | SCI38 | 14 | 88 | 4.63 | 0.60 | 4.60 | 0.49 | 100.00 | √ |
| SCI39 | 13 | 81 | 2.94 | 1.03 | x | x | x | x | |
| SCI40 | 12 | 75 | 4.00 | 0.94 | 3.90 | 0.70 | 100.00 | √ | |
| SCI41 | 10 | 63 | 4.31 | 0.77 | 4.50 | 0.67 | 100.00 | √ | |
| SCI42 | 7 | 44 | 4.19 | 0.88 | 2.70 | 0.78 | x | x | |
| SCI43 | 2 | 13 | 4.19 | 0.95 | 2.90 | 0.94 | x | x | |
| SCI44 | 1 | 6 | 2.94 | 1.09 | x | x | x | x | |
| Waste Management | SCI45 | 16 | 100 | 4.00 | 1.00 | 4.60 | 0.66 | 100.00 | √ |
| SCI46 | 14 | 88 | 4.25 | 0.75 | 4.10 | 0.83 | 100.00 | √ | |
| SCI47 | 14 | 88 | 4.13 | 0.99 | 2.90 | 0.94 | x | x | |
| SCI48 | 12 | 75 | 3.94 | 0.90 | 4.30 | 0.78 | 100.00 | √ | |
| SCI49 | 7 | 44 | 2.88 | 0.93 | x | x | x | x | |
| SCI50 | 5 | 31 | 2.94 | 1.09 | x | x | x | x | |
| SCI51 | 3 | 19 | 2.94 | 0.90 | x | x | x | x | |
| SCI52 | 2 | 13 | 2.88 | 0.99 | x | x | x | x | |
| Noise, Air Quality and Energy | SCI53 | 14 | 88 | 4.25 | 0.83 | 3.90 | 0.70 | 100.00 | √ |
| SCI54 | 14 | 88 | 4.44 | 0.61 | 4.50 | 0.67 | 100.00 | √ | |
| SCI55 | 12 | 75 | 4.00 | 1.22 | 4.60 | 0.49 | 100.00 | √ | |
| SCI56 | 11 | 69 | 3.94 | 0.83 | 2.80 | 1.08 | x | x | |
| SCI57 | 6 | 38 | 2.94 | 1.30 | x | x | x | x | |
| SCI58 | 4 | 25 | 4.19 | 0.88 | 3.70 | 0.64 | 100.00 | √ | |
| SCI59 | 3 | 19 | 2.94 | 0.97 | x | x | x | x | |
| SCI60 | 2 | 13 | 2.81 | 0.63 | x | x | x | x | |
| Urban Space and Tourism | SCI61 | 15 | 94 | 2.94 | 0.83 | x | x | x | x |
| SCI62 | 13 | 81 | 4.19 | 1.07 | 4.10 | 0.83 | 100.00 | √ | |
| SCI63 | 12 | 75 | 2.69 | 0.58 | x | x | x | x | |
| SCI64 | 9 | 56 | 4.00 | 0.71 | 4.00 | 0.77 | 100.00 | √ | |
| SCI65 | 4 | 25 | 3.06 | 0.75 | 3.70 | 0.90 | 100.00 | √ | |
| SCI66 | 3 | 19 | 3.00 | 0.79 | 2.90 | 1.04 | x | x | |
| SCI67 | 3 | 19 | 4.06 | 0.83 | 4.10 | 0.70 | 100.00 | √ | |
| SCI68 | 2 | 13 | 4.00 | 0.94 | 3.60 | 0.80 | 100.00 | √ | |
| SCI69 | 1 | 6 | 2.63 | 0.70 | x | x | x | x | |
| Category | Indicator | Explanation |
|---|---|---|
| Demography | SCI3: Average of household income | This indicator assesses the economic conditions of households living in the city. It measures household income on average. This measurement can be divided by the specific blocks of the city, such as Krom (village), Sangkat (commune) or Khan (district). |
| SCI1: Population density | This indicator assesses the population density in the city. (Population density is related to population growth and land use planning. In the case of high density, population growth needs to be well managed and land use planning needs to be advanced.) | |
| SCI6: Percentage of the population migrating into the city | This indicator assesses the migration rate into the city per year on average. If the data is not available, the population growth rate can be an alternative indicator. (Highly increasing migration into the cities, especially the capital will be resulting in slums, homeless, jobless, crimes etc.) | |
| Employment | SCI9: Labor force participation rate | This indicator assesses the total population in the labor force both the employed and unemployed population, excluding the housewives and the jobless population who are not looking for work, such as stay-at-home moms, retirees, and students. |
| SCI10: Unemployment rate | This indicator assesses the unemployment rate in the city. (More unemployed workers mean less economic production. The economy with high unemployment has a lower output without a proportional decline in the need for basic consumption. High persistent unemployment can signal serious distress in an economy and even lead to social and political upheaval.) | |
| SCI12: Number of new jobs created per year | This indicator assesses the city government’s efforts in creating new jobs for its residents. It measures the number of new jobs created per year on average. The types and size of new job created are all assessed. (Creating new jobs would be a solution to reduce the unemployment rate in the city.) | |
| Housing | SCI17: Percentage of the population living in slums | This indicator assesses the slum situation in the city. It measures the percentage of the population living in slums or informal settlement compared to the total population in the city. (Slum upgrading and informal settlement prohibition are important for the attractiveness of the city and the improvement in the quality of life. |
| SCI16: Number of low-income housing development projects | This indicator assesses the city government’s efforts in providing affordable housing to its residents. It measures the number of low-income housing development projects, both completed and ongoing projects. The types and size of the projects are also assessed. (Low-income housing development would be a solution to reduce slums and informal settlements.) | |
| SCI18: Percentage of new residential buildings (aged less than 30 years) | This indicator assesses the quality of residential buildings by the percentage of new buildings (aged less than 30 years old) compared to the total residential buildings in the city. It is the opposite indicator of aging residential buildings. If new buildings are much less than old buildings, redevelopment or regeneration is needed in order to improve the housing quality, environment, and image of the city. | |
| Transport | SCI23: Public transport sharing rate | This indicator assesses public transport by the percentage of public transport means compared to the total transport means in the city. (Public transport helps reduce the uses of individual cars which is very significant in reducing traffic congestion and greenhouse gas.) |
| SCI25: Number of initiatives for sidewalk improvement | This indicator assesses the city government’s efforts in improving sidewalks for pedestrians. It measures the number of initiated programs or activities of the city government for improving sidewalks. The types and size of initiated programs or activities are also assessed. | |
| SCI26: Number of public parking lots in the city | This indicator assesses the sufficiency of public parking lots in the city, including the city’s government efforts in enhancing public parking lots. It measures the number of public parking lots in the city by Krom, Sangkat, or Khan. The types and size of the public parking lots are also assessed. | |
| SCI24: Number of initiatives to reduce traffic congestion | This indicator assesses the city government’s efforts in reducing traffic congestion. It measures the number of initiatives of the city government to reduce traffic congestion, such as road infrastructure expansion and improvement, traffic system management, etc. The types and size of the initiatives are also assessed. | |
| Safety | SCI31: Number of measures or initiatives to prevent crimes | This indicator assesses the city government’s efforts in preventing crimes. It measures the number of measures or initiatives of the city government to prevent crimes. The types of initiatives or measures are also assessed. |
| SCI33: Number of initiated programs to protect workers or road users from construction risks | This indicator assesses the city government’s efforts in preventing construction risks. It measures the number of initiated programs to protect construction workers or road users from construction risks. The types and size of the programs are also assessed. | |
| SCI32: Number of facilities to prevent disasters | This indicator assesses the availability of disaster prevention facilities in the city. It measures the number of prevention facilities, such as constructed dams or reservoirs, pumping stations, fire trucks, etc. The types and size of the prevention facilities are also assessed. | |
| SCI34: Percentage of residents using insurance services; number of insurance companies | This indicator assesses the insurance used by the residents in the city, including the services and quality. It measures the percentage of residents using insurance services compared to total population in the city. It also measures the sufficiency of the insurance companies providing services in the city. | |
| Water Use | SCI38: Percentage of households with access to potable water infrastructure | This indicator assesses the potable water supply accessibility in the city. It measures the percentage of households with accessing to potable water supply infrastructure compared to total households in the city. (Potable water is considered in terms of both water security and sanitation.) |
| SCI41: Average of the water consumption rate per person or household | This indicator assesses the level of water consumption in the city. It measures the water consumption rate per person or household per day on average. (It is also to understand the ratio of water consumption compared to the total water supply in the city.) | |
| SCI40: Number of natural or artificial reservoirs in or nearby the city | This indicator assesses the availability of fresh water sources in the city. It measures the number and size of natural or artificial reservoirs in or nearby the city. It is significant to understand the situation of water supply in the city, especially in the dry season (sufficiency or not). | |
| Waste Management | SCI45: Percentage of solid waste regularly collected | This indicator assesses the public organizations in place, especially the city government’s efforts in collecting solid waste. It measures the percentage of households linked to the network that disposes of solid waste compared to the total household in the city. |
| SCI46: Capacity of wastewater treatment plants in the city | This indicator assesses the capacity of the wastewater treatment plants in the city. It measures the capacity of the plants that can treat the amount of wastewater per day comparable to total population in that area. The number and types of plants are also assessed. | |
| SCI48: Number of initiatives to reduce wastes | This indicator assesses the city government’s efforts in reducing wastes. It measures the number of initiated programs or activities to reduce waste, such as the 3R (reduce, reduce and recycle) strategy. The types and size of the programs or activities are also assessed. | |
| Air Quality and Energy | SCI55: Fine dust levels | This indicator assesses the level of fine dust in the city per day or week. It measures the level of PM 2.5 or PM 10. (The measurement of the air quality in the city is very important in order to provide the information about the air quality on time to the residents.) |
| SCI54: Percentage of the urban forest | This indicator assesses the conservation of urban forest. It measures the ratio of conserved forest area compared to the total area of the city. (Urban forests play an important role in reducing the urban heat island effect, providing the canopies, healing human’s feelings etc.) | |
| SCI53: Average of the energy consumption rate per person or household | This indicator assesses the level of energy consumption in the city. It measures the energy consumption rate per person or household per day on average. (This indicator is also important to understand the ratio of energy consumption compared to the total energy supply in the city.) | |
| SCI58: Percentage of renewable energy contributed to the electricity supply | This indicator assesses the use of renewable energy in the city. It measures the percentage of renewable energy contributed to the electricity supply. (It is also to understand the city’s government efforts in promoting renewable energy consumption and production.) | |
| Urban Space and Tourism | SCI62: Number of natural or artificial parks in the city | This indicator assesses the sufficiency of parks in the city. It measures the number of natural or artificial parks in the city. The types and size of the parks are also assessed. (Urban parks are the important public and green spaces in the city, generally used as communal spaces.) |
| SCI67: Number of botanic gardens in the city | This indicator assesses the availability of botanic gardens in the city to promote biodiversity education and tourism. It measures by the number of botanic gardens in the city. The types and size of the gardens are also assessed. (Botanic gardens are generally created to conserve the local biodiversity and present it to the tourists.) | |
| SCI65: Number of conserved cultural, historical, and heritage buildings | This indicator assesses the conservation of cultural, historical, and heritage buildings in the city. It measures the number of the conserved cultural, historical, and heritage buildings in the city. The types and values of buildings are also assessed. | |
| SCI64: Tourism growth rate per year | This indicator assesses the growth of tourism, including the satisfaction of tourists which is also related to the city government’s efforts in attracting tourists. It measures the tourism growth rate per year. (The level of tourists’ satisfaction could also be an important indicator.) | |
| SCI68: Number of playgrounds in the city | This indicator assesses the availability of playgrounds in the city. It measures the number of playgrounds by Krom, Sangkat or Khan. The types and size of the playgrounds are also assessed. (Playgrounds are the popularly public leisure areas, especially for children.) |
References
- Royal Government of Cambodia, MoE. The National Green Growth Roadmap. 2009. Available online: http://www.asialeds.org/sites/default/files/resource/file/Final%20Draft%20Roadmap,%20Feb26-2010.pdf (accessed on 14 February 2019).
- Essam, Y.M.; Shannon, W.; Gary, K. Making Growth Green and Inclusive: The Case of Cambodia; OECD Green Growth Papers; OECD Publishing: Paris, France, 2013; Volume 9. [Google Scholar]
- Cambodian National Assembly. The Law on the Ratification of the Kingdom of Cambodia to the Agreement on the Establishment of the Global Green Growth Institute. 2012. Available online: http://www.national-assembly.org.kh/tv/kh/ViewLawFile.aspx?LawDID=419 (accessed on 14 February 2019).
- GGGI. The Agreement on the Establishment of the Global Green Growth Institute. 2012. Available online: http://gggi.org/site/assets/uploads/2017/10/Agreement-on-the-Establishment-of-the-GGGI.pdf (accessed on 14 February 2019).
- Cambodian Ministry of Royal Palace. The Royal Decree on the Establishment of the National Council on Green Growth; Ministry of Royal Palace: Phnom Penh, Cambodia, 2012.
- Royal Government of Cambodia. The National Policy on Green Growth. 2013. Available online: http://www.greengrowthknowledge.org/national-documents/cambodia-national-policy-green-growth (accessed on 14 February 2019).
- Royal Government of Cambodia. The National Strategic Plan on Green Growth 2013–2030. 2013. Available online: https://policy.asiapacificenergy.org/ru/node/2806 (accessed on 14 January 2019).
- Cambodian Ministry of Royal Palace. The Royal Decree on the Establishment of the National Council for Sustainable Development; Ministry of Royal Palace: Phnom Penh, Cambodia, 2015.
- NCSD; GGGI; ICEM. The Green City Strategic Planning Methodology. 2016. Available online: http://gggi.org/wp-content/uploads/2016/08/Annex-A-AAS1507-REP-006-Final-Green-city-strategic-planning-methodology.pdf (accessed on 14 January 2019).
- Royal Government of Cambodia, NCSD. The Environment and Natural Resources Code of Cambodia: Revised Ninth Draft (Draft 9.1); NCSD: Phnom Penh, Cambodia, 2017.
- United Nations―General Assembly. Transforming Our World: The 2030 Agenda for Sustainable Development; Resolution adopted by the General Assembly; United Nations: New York, NY, USA, 2015. [Google Scholar]
- UN-Habitat. SDG Goal 11 Monitoring Framework. 2016. Available online: http://unhabitat.org/sdg-goal-11-monitoring-framework/ (accessed on 14 February 2019).
- Aapo, H.; Peter, B.; Miimu, A. Comparative analysis of standardized indicators for smart sustainable cities: What indicators and standards to use and when? J. Cities 2019, 89, 141–153. [Google Scholar]
- Jacqueline, M.K.; Danielle, L.P. The urban sustainable development goal: Indicators, complexity and the politics of measuring cities. J. Cities 2017, 63, 92–97. [Google Scholar]
- Royal Government of Cambodia, NCCCA. The Clean City Standard. 2012. Available online: http://www.cambodiacleancity.gov.kh/kh/documents (accessed on 21 January 2019). (In Khmer)
- NCSD; GGGI; ICEM. The Phnom Penh Green City Strategic Plan 2017–2026 and List of Priority Green City Investment Projects for Phnom Penh; NCSD: Phnom Penh, Cambodia, 2016; pp. 11–13. [Google Scholar]
- Baker, J.L.; Kikutake, N.; Lin, S.X.; Johnson, E.C.; Yin, S.; Ou, N. Urban Development in Phnom Penh (English); World Bank Group: Washington, DC, USA, 2017; pp. 40–41. [Google Scholar]
- Erling, H.; Kristin, L.; David, B. Sustainable development: Our common future revisited. J. Glob. Environ. Chang. 2014, 26, 130–139. [Google Scholar]
- Holden, E. Achieving Sustainable Mobility: Everyday and Leisure-Time Travel in the EU; Ashgate: Aldershot, UK, 2007. [Google Scholar]
- Elkington, J. Enter the triple bottom line. In The Triple Bottom Line. Does It All Add Up? Henriques, A., Richardson, J., Eds.; Earthscan: London, UK, 2004; pp. 1–16. [Google Scholar]
- Remigijus, C.; Jolita, R.; Bronislovas, M. The concept of sustainable development and its use for sustainability scenarios. J. Eng. Econ. 2009, 2, 28–37. [Google Scholar]
- Artur, P. How many dimensions does sustainable development have? J. Sustain. Dev. 2008, 16, 81–91. [Google Scholar]
- Georges, A.T.; Juste, R.; Jean, F.L.; Paul, L. Measuring the sustainability of cities: An analysis of the use of local indicators. J. Ecol. Indic. 2010, 10, 407–418. [Google Scholar]
- Winter, M.; Knemeyer, A.M. Exploring the integration of sustainability and supply chain management current state and opportunities for future inquiry. Int. J. Phys. Distrib. Logist. Manag. 2013, 43, 18–38. [Google Scholar] [CrossRef]
- Jonathan, G.; Fu, J.; Yu, G.; Steve, B. The role of supply chain leadership in the learning of sustainable practice: Toward an integrated framework. J. Clean. Prod. 2016, 137, 1458–1469. [Google Scholar]
- UNDP. Sustainability and Equity: A Better Future for All. Human Development Report 2011. Available online: https://papers.ssrn.com/sol3/papers.cfm?abstract_id=2294671 (accessed on 14 February 2019).
- Hák, T.; Janoušková, S.; Moldan, B. Sustainable development goals: A need for relevant indicators. J. Ecol. Indic. 2016, 60, 565–573. [Google Scholar] [CrossRef]
- Robert, C.; Lew, D.; Lorenzo, F.; Enrico, G.; Ida, K.; Lars, F.M.; Kate, E.P.; Kristin, V.R.; Roberto, D.V.; Richard, W. Modelling and measuring sustainable wellbeing in connection with the UN sustainable development goals. J. Ecol. Econ. 2016, 130, 350–355. [Google Scholar]
- Chaitanya, K.; Aromar, R.; Jessica, E.; Holger, K. Getting Started with the SDGs in Cities A Guide for Stakeholders. 2016. Available online: http://unsdsn.org/wp-content/uploads/2016/07/9.1.8.-Cities-SDG-Guide.pdf (accessed on 21 April 2019).
- United Nations. About the Sustainable Development Goals (17 Goals). Available online: https://un.org/sustainabledevelopment/sustainable-development-goals/ (accessed on 11 January 2019).
- UN-Habitat. SDG Goal 11 Monitoring Framework. A Guide to Assist National and Local Governments to Monitor & Report on SDG 11 Indicators. 2016. Available online: https://unhabitat.org/wp-content/uploads/2016/02/SDG-Goal%2011%20Monitoring%20Framework%2025-02-16.pdf (accessed on 21 January 2019).
- Royal Government of Cambodia, NCCCA. Why Clean City Contest? Available online: http://www.cambodiacleancity.gov.kh/kh (accessed on 14 January 2019). (In Khmer)
- Royal Government of Cambodia, NCCCA. The Action Plan 2011–2014. Available online: http://www.cambodiacleancity.gov.kh/kh/documents (accessed on 14 January 2019). (In Khmer)
- Luis, C.D.; Carlos, H.A.; Guilherme, D.; de Castro, N.; Lucca, Z. A multi-criteria approach to sort and rank policies based on Delphi qualitative assessments and ELECTRE TRI: The case of smart grids in Brazil. J. Omega 2018, 76, 100–111. [Google Scholar] [Green Version]
- Mendoza, G.A.; Martins, H. Multi-criteria decision analysis in natural resource management: A critical review of methods and new modelling paradigms. J. For. Ecol. Manag. 2006, 230, 1–22. [Google Scholar] [CrossRef]
- Belton, V.; Stewart, J.T. Multiple Criteria Decision Analysis. An Integrated Approach; Kluwer Academic Publishers: Boston, MA, USA, 2002. [Google Scholar]
- Dyer, J.S. MAUT—Multi attribute utility theory. In Multiple Criteria Decision Analysis: State of the Art Surveys; Springer: New York, NY, USA, 2005; pp. 265–292. [Google Scholar]
- Saaty, T.L. Analytic network process. In Encyclopedia of Operations Research and Management Science; Springer: New York, NY, USA, 2001; pp. 28–35. [Google Scholar]
- Saaty, T. A scaling method for priorities in hierarchical structures. J. Math. Psychol. 1977, 15, 234–281. [Google Scholar] [CrossRef]
- Bana e Costa, C.; Vansnick, J. MACBETH: An interactive path towards the construction of cardinal value functions. Int. Trans. Oper. Res. 1994, 1, 387–500. [Google Scholar] [CrossRef]
- Hwang, C.L.; Yoon, K. Multiple Attribute Decision Making: Methods and Applications; Springer: Heidelberg, Germany, 1981. [Google Scholar]
- Brans, J.P.; Vincke, P. Note—A preference ranking organisation method: The PROMETHEE method for multiple criteria decision-making. Manag. Sci. 1985, 31, 647–656. [Google Scholar] [CrossRef]
- Guarini, M.R.; Battisti, F.; Chiovitti, A. Public initiatives of settlement transformation: A theoretical-methodological approach to selecting tools of multi-criteria decision analysis. Buildings 2018, 8, 1. [Google Scholar] [CrossRef]
- Li, Y.; Thomas, M.A. A multiple criteria decision analysis (MCDA) software selection framework. In Proceedings of the 47th Hawaii International Conference on System Science (HICSS), Waikoloa, HI, USA, 6–9 January 2014; pp. 1084–1094. [Google Scholar]
- Guarini, M.R.; Battisti, F.; Chiovitti, A. A methodology for the selection of multi-criteria decision analysis methods in real estate and land management processes. Sustainability 2018, 10, 507. [Google Scholar] [CrossRef]
- Sepasgozar, S.M.E.; Davis, S. Construction Technology Adoption Cube: An Investigation on Process, Factors, Barriers, Drivers and Decision Makers Using NVivo and AHP Analysis. Buildings 2018, 8, 74. [Google Scholar] [CrossRef]
- Kaspar, R.; Ossadnik, W. Evaluation of AHP software from a management accounting perspective. J. Model. Manag. 2013, 8, 305–319. [Google Scholar]
- Baudry, G.; Macharis, C.; Vallée, T. Range-based multi-actor multi-criteria analysis: A combined method of multi-actor multi-criteria analysis and Monte Carlo simulation to support participatory decision making under uncertainty. Eur. J. Oper. Res. 2018, 264, 257–269. [Google Scholar] [CrossRef]
- Wang, J.-J.; Jing, Y.-Y.; Zhang, C.-F.; Zhao, J.-H. Review on multi-criteria decision analysis aid in sustainable energy decision-making. Renew. Sustain. Energy Rev. 2009, 13, 2263–2278. [Google Scholar] [CrossRef]
- Ribeiro, F.; Ferreira, P.; Araújo, M. Evaluating future scenarios for the power generation sector using a multi-criteria decision analysis (MCDA) tool: The Portuguese case. J. Energy 2013, 52, 126–136. [Google Scholar] [CrossRef]
- Shen, Y.C.; Grace, T.R.L.; Tzeng, G.H. Combined DEMATEL techniques with novel MCDM for the organic light emitting diode technology selection. J. Expert Syst. Appl. 2011, 38, 1468–1481. [Google Scholar] [CrossRef]
- Zhang, J. Evaluating regional low-carbon tourism strategies using the fuzzy delphi-analytic network process approach. J. Clean. Prod. 2017, 141, 409–419. [Google Scholar] [CrossRef]
- Haruna, D.M.; Mohd, R.Y.; Ahmad, M.A.; Mohd, Y.I. Delphi method of developing environmental well-being indicators for the evaluation of urban sustainability in Malaysia. J. Procedia Environ. Sci. 2015, 30, 244–249. [Google Scholar]
- Sultana, I.; Ahmed, I.; Azeem, A. An integrated approach for multiple criteria supplier selection combining Fuzzy Delphi, Fuzzy AHP & Fuzzy TOPSIS. J. Intell. Fuzzy Syst. 2015, 29, 1273–1287. [Google Scholar]
- Chang, K.L. A hybrid program projects selection model for nonprofit TV stations. J. Math. Probl. Eng. 2015, 2015, 368212. [Google Scholar] [CrossRef]
- Gene, R.; George, W. The Delphi technique as a forecasting tool: Issues and analysis. Int. J. Forecast. 1999, 15, 353–375. [Google Scholar]
- Norman, D.; Olaf, H. An experimental application of the Delphi method to the use of experts. J. Manag. Sci. 1963, 9, 351–515. [Google Scholar]
- Martino, J.P. Technological Forecasting for Decision-Making; North-Holland: Amsterdarn, The Nederland, 1983. [Google Scholar]
- Linstone, H.A.; Turoff, M. The Delphi Techniques and Applications; Addison-Wesley: London, UK, 1975; Available online: https://web.njit.edu/~turoff/pubs/delphibook/delphibook.pdf (accessed on 11 January 2019).
- Mullen, P.M. Delphi: Myths and reality. J. Health Organ. Manag. 2003, 17, 37–52. [Google Scholar] [CrossRef]
- Robinson, J.B.L. Delphi methodology for economic impact assessment. J. Trans. Eng. 1991, 117, 335–349. [Google Scholar] [CrossRef]
- Hill, K.Q.; Fowles, J. The methodological worth of the Delphi forecasting technique. J. Technol. Forecast. Soc. Chang. 1975, 7, 179–192. [Google Scholar] [CrossRef]
- Sourani, A.; Sohail, M. The Delphi method: Review and use in construction management research. Int. J. Constr. Edu. Res. 2015, 11, 54–76. [Google Scholar] [CrossRef]
- Jafari, A.; Valentin, V.; Bogus, S.M. Identification of Social Sustainability Criteria in Building Energy Retrofit Projects. J. Constr. Eng. Manag. 2019, 145, 04018136. [Google Scholar] [CrossRef]
- Perveen, S.; Kamruzzaman, M.; Yigitcanlar, T. Developing policy scenarios for sustainable urban growth management: A Delphi approach. Sustainability 2017, 9, 1787. [Google Scholar] [CrossRef]
- Noh, H.-J.; Lee, S.-K.; Yu, J.-H. Identifying effective fugitive dust control measures for construction projects in Korea. Sustainability 2018, 10, 1206. [Google Scholar] [CrossRef]
- Agrawal, T.K.; Pal, R. Traceability in textile and clothing supply chains: Classifying implementation factors and information sets via Delphi study. Sustainability 2019, 11, 1698. [Google Scholar] [CrossRef]
- Dong, J.; Liu, D.; Wang, D.; Zhang, Q. Identification of key influencing factors of sustainable development for traditional power generation groups in a market by applying an extended MCDM model. Sustainability 2019, 11, 1754. [Google Scholar] [CrossRef]
- Bastas, A.; Liyanage, K. ISO 9001 and supply chain integration principles based sustainable development: A Delphi study. Sustainability 2018, 10, 4569. [Google Scholar] [CrossRef]
- Gupta, U.G.; Clarke, R.E. Theory and applications of the Delphi technique: A bibliography (1975–1994). J. Technol. Forecast. Soc. Chang. 1996, 53, 185–211. [Google Scholar] [CrossRef]
- Hinks, J.; McNay, P. The creation of a management-by-variance tool for facilities management performance assessment. Facilities 1999, 17, 31–53. [Google Scholar] [CrossRef]
- Bradley, L.; Stewart, K. A Delphi study of the drivers and inhibitors of Internet banking. Inter. J. Bank Mark. 2002, 20, 250–260. [Google Scholar] [CrossRef]
- Orndoff, C.J.W. Promising new tool for stakeholder interaction. J. Archit. Eng. 2005, 11, 139–146. [Google Scholar] [CrossRef]
- Padel, S.; Midmore, P. The development of the European market for organic products: Insights from a Delphi study. Br. Food J. 2005, 107, 626–647. [Google Scholar] [CrossRef]
- Bendaña, R.; del Caño, A.; de la Cruz, M.P. Contractor selection: Fuzzy control approach. Can. J. Civ. Eng. 2008, 35, 473–486. [Google Scholar] [CrossRef]
- Yeung, J.F.Y.; Chan, A.P.C.; Chan, D.W.M. Developing a performance index for relationship-based construction projects in Australia: Delphi study. J. Manag. Eng. 2009, 25, 59–68. [Google Scholar] [CrossRef]
- Lucko, G.; Rojas, E.M. Research validation: Challenges and opportunities in the construction domain. J. Constr. Eng. Manag. 2010, 136, 127–135. [Google Scholar] [CrossRef]
- Hallowell, M.R.; Gambatese, J.A. Qualitative research: Application of the Delphi method to CEM research. J. Constr. Eng. Manag. 2010, 136, 99–107. [Google Scholar] [CrossRef]
- Weidman, J.E.; Miller, K.R.; Christofferson, J.P.; Newitt, J.S. Best practices for dealing with price volatility in commercial construction. Inter. J. Constr. Edu. Rev. 2011, 7, 276–293. [Google Scholar] [CrossRef]
- Mitchell, V.; McGoldrick, P.J. The role of geodemographics in segmenting and targeting consumer markets: A Delphi study. Eur. J. Mark. 1994, 28, 54–72. [Google Scholar] [CrossRef]
- Chong, H.Y.; Zin, R.M. Application of the Delphi into construction law research. Inter. J. Interdiscip. Soc. Sci. 2010, 5, 200–206. [Google Scholar] [CrossRef]
- Gunhan, S.; Arditi, A. Factors affecting international construction. J. Constr. Eng. Manag. 2005, 131, 273–282. [Google Scholar] [CrossRef]
- Jones, J.; Hunter, D. Qualitative research: Consensus methods for medical and health services research. BMJ 1995, 311, 376–380. [Google Scholar] [CrossRef] [PubMed]
- Hughes, R. Definitions for public health nutrition: A developing consensus. J. Public Health Nutr. 2003, 6, 615–620. [Google Scholar] [CrossRef]
- Kumar, S.; Kumar, N.; Vivekadhish, S. Millennium development goals (MDGS) to sustainable development goals (SDGS): Addressing unfinished agenda and strengthening sustainable development and partnership. Ind. J. Community Med. 2016, 41, 1–4. [Google Scholar] [CrossRef] [PubMed]
- Battersby, J. MDGs to SDGs—New goals, same gaps: The continued absence of urban food security in the post-2015 global development agenda. J. Afr. Geogr. Rev. 2017, 36, 115–129. [Google Scholar] [CrossRef]
- WHO. Health in 2015: From Millennium Development Goals to Sustainable Development Goals. 2015. Available online: https://apps.who.int/iris/bitstream/handle/10665/200009/9789241565110_eng.pdf (accessed on 21 April 2019).
- Carl, D.; Clive, G. Doing biopolitics differently? Radical potential in the post-2015 MDG and SDG debates. Globalizations 2015, 12, 597–612. [Google Scholar]
- Li, L.; Shefali, O.; Dan, H.; Yue, C.; Jamie, P.; Jun, Z.; Joy, E.L.; Simon, C.; Colin, M.; Robert, E.B. Global, regional, and national causes of under-5 mortality in 2000–15: An updated systematic analysis with implications for the sustainable development goals. Lancet 2016, 388, 3027–3035. [Google Scholar] [CrossRef]
- ASEAN. ASEAN Cooperation on Environmentally Sustainable City (ESC). The Introduction. Available online: https://environment.asean.org (accessed on 21 January 2019).
- ASEAN. Annex C—Environmentally Sustainable City (ESC) Key Indicators. Available online: http://environment.asean.org/wp-content/uploads/2017/01/Key-Indicators_2017-Endorsed.pdf (accessed on 14 January 2019).
- Han, S.M.; Lee, M.H. Indicators for the development and management of sustainable cities: Focusing on the goal 11 of UN sustainable development goals. J. Korean R. Dev. Assoc. 2017, 29, 1–24. (In Korean) [Google Scholar]
- Royal Government of Cambodia. Press OCM. Available online: http://pressocm.gov.kh/en/minister (accessed on 27 April 2019).
- Schumann, A. Using Outcome Indicators to Improve Policies: Methods, Design Strategies and Implementation. OECD Regional Development Working Papers, 2016, 02. Available online: https://doi.org/10.1787/5jm5cgr8j532-en (accessed on 27 April 2019).


| Category | Indicator | SDG11 | ESC | HAN | GC | CC |
|---|---|---|---|---|---|---|
| Demography | Population density | ● | ● | |||
| Population growth rate | ● | ● | ||||
| The ratio of land consumption rate to the population growth rate | ● | ● | ||||
| Birth rate | ● | |||||
| Active population (20–65) rate | ● | |||||
| Elderly population (over 65) rate | ● | |||||
| Jobs and Tourism | Labor force participation rate | ● | ||||
| Unemployment rate | ● | ● | ||||
| Absence or presence of shopping centers or shopping outlets within tourist areas | ● | |||||
| Absence or presence of local products in shopping centers or shopping outlets within tourist areas | ● | |||||
| Tourism growth rate per year | ● | |||||
| Number of registered foreigners | ● | |||||
| Housing | Percentage of the population living in slums | ● | ● | |||
| Percentage of the population spending more than 30% of their income on housing costs | ● | |||||
| Number of low-income housing units | ● | |||||
| Percentage of population living in owned houses | ● | |||||
| Percentage of aging residential buildings | ● | |||||
| Transport | Percentage of population living within 0.5 km of public transport access | ● | ||||
| Percentage of people using large public transports | ● | |||||
| Public transport sharing rate | ● | |||||
| Investment in transports under the budget | ● | ● | ||||
| Number of taxi and bus | ● | |||||
| Proportion of environmentally friendly vehicles | ● | |||||
| Proportion of traffic congestion level (extra hours of travel time) | ● | ● | ||||
| Safety | Absence or presence of measures to prevent crimes | ● | ● | |||
| Number of people affected by crimes; number of crimes | ● | ● | ||||
| Number of affected people resulting from disasters | ● | |||||
| Number of damaged or destroyed houses | ● | ● | ||||
| Proportion of disaster prevention facilities (constructed dams, reservoirs, pumping stations etc.) | ● | ● | ● | |||
| Proportion of basic livelihood security | ● | |||||
| Clean Air and Energy | Fine dust level | ● | ● | ● | ||
| Number of days in a year that Pollutant Standards Index (PSI) exceeded 100 (unhealthy) using USEPA standard | ● | |||||
| Proportion of the city government’s efforts in greenhouse gas reduction | ● | ● | ||||
| The ratio of forest conservation areas to the total land area of the city | ● | |||||
| Percentage of gasoline- and diesel-fueled vehicles that meet city or national standards during roadside inspection | ● | |||||
| Percentage of industries that fulfill the requirement of national standards | ● | ● | ||||
| Types of alternative fuels used | ● | |||||
| Percentage of hotels using energy saving devices or renewable energy | ● | |||||
| Proportion of awareness campaigns on energy-saving techniques | ● | |||||
| Proportion of incentives for sustainable use of energy | ● | |||||
| Percentage of solar energy share in electricity supply | ● | |||||
| Number of buildings with solar PV installed | ● | |||||
| Number of green buildings in the city | ● | ● | ||||
| Waste Management | Percentage of solid waste regularly collected and recycled | ● | ● | ● | ● | ● |
| Percentage of reduction in total waste generated a year | ● | |||||
| Percentage of waste collected from door to door/collection point | ● | |||||
| Percentage of waste transported in covered vehicles on a daily basis | ● | |||||
| Percentage of households and industries linked to sewerage system | ● | |||||
| Percentage of households with secured sanitation systems | ● | |||||
| Proportion of wastewater treatment plants in the city | ● | |||||
| Water Use | Percentage of households with tap water that meets WHO drinking water standard | ● | ||||
| Percentage of school at all levels with water conservation education programs | ● | |||||
| Percentage of capacity of city in supplying water to meet average consumption | ● | |||||
| Percentage of available freshwater from ground and surface water extracted for use | ● | |||||
| Percentage of households with access to potable water infrastructure | ● | ● | ||||
| Public Space and Heritage | The ratio of public and green spaces compared to the total area of the city | ● | ● | ● | ||
| Frequency and time of maintaining and cleaning public and green spaces | ● | |||||
| Percentage of the area that complies with the stipulated spatial plan of the city | ● | ● | ||||
| Number of urban parks | ● | |||||
| Proportion of leisure areas in the city | ● | |||||
| Percentage of residents residing in public and green spaces accessible within 0.5 km | ● | |||||
| Percentage of conservative status given to historical and cultural areas | ● | ● | ||||
| Percentage of the budget provided to maintain the cultural and natural heritage | ● | ● |
| Category | Indicator | |
|---|---|---|
| Demography | SCI1 | Population density |
| SCI2 | Population growth rate | |
| SCI3 | Average of household income | |
| SCI4 | Birth rate | |
| SCI5 | Percentage of the population aged 65 and over | |
| SCI6 | Percentage of the population migrating into the city | |
| SCI7 | Percentage of the population with disabilities | |
| SCI8 | Mortality rate | |
| Employment | SCI9 | Labor force participation rate |
| SCI10 | Unemployment rate | |
| SCI11 | Percentage of the foreign companies investing in the city | |
| SCI12 | Number of new jobs created per year | |
| SCI13 | Percentage of the shopping center or outlets selling local products | |
| SCI14 | Employment participation rate by age and gender | |
| SCI15 | Absence or presence of SMEs competition | |
| Housing | SCI16 | Number of low-income housing development projects |
| SCI17 | Percentage of the population living in slums | |
| SCI18 | Percentage of new residential buildings (aged less than 30 years) | |
| SCI19 | Percentage of the population living in owned houses | |
| SCI20 | Percentage of the population living in rent houses | |
| SCI21 | Percentage of aging residential buildings (aged more than 30 years) | |
| SCI22 | The radio of middle-income houses compared to the low-income houses | |
| Transport | SCI23 | Public transport sharing rate |
| SCI24 | Number of initiatives to reduce traffic congestion | |
| SCI25 | Number of initiatives for sidewalk improvement | |
| SCI26 | Number of public parking lots in the city | |
| SCI27 | Percentage of the population living within 0.5 km of public transport access | |
| SCI28 | Percentage of environmentally friendly vehicles | |
| SCI29 | Number of road cleaning times per week or per month | |
| SCI30 | Proportion of streets with lights | |
| Safety | SCI31 | Number of measures or initiatives to prevent crimes |
| SCI32 | Number of facilities to prevent disasters | |
| SCI33 | Number of initiated programs to protect workers or road users from construction risks | |
| SCI34 | Percentage of residents using insurance services; number of insurance companies | |
| SCI35 | Number of damaged or destroyed houses | |
| SCI36 | Number of people affected by crimes; number of crimes | |
| SCI37 | Number of affected people resulting from disasters | |
| Water Use | SCI38 | Percentage of households with access to potable water infrastructure |
| SCI39 | Percentage of households with tap water that meets WHO drinking water standard | |
| SCI40 | Number of natural or artificial reservoirs in or nearby the city | |
| SCI41 | Average of the water consumption rate per person or household | |
| SCI42 | Percentage of water use in production | |
| SCI43 | The ratio of water use from underground and surface water | |
| SCI44 | Percentage of school at all levels with water conservation education programs | |
| Waste Management | SCI45 | Percentage of solid waste regularly collected |
| SCI46 | The capacity of wastewater treatment plants in the city | |
| SCI47 | Percentage of households linked to the sewerage system | |
| SCI48 | Number of initiatives to reduce wastes | |
| SCI49 | Percentage of reduction in total waste generated per year | |
| SCI50 | Percentage of recycled waste from total waste generation | |
| SCI51 | Number of households with secured sanitation systems | |
| SCI52 | Percentage of waste collected from door to door or collection point | |
| Noise, Air Quality and Energy | SCI53 | Average of the energy consumption rate per person or household |
| SCI54 | Percentage of the urban forest | |
| SCI55 | Fine dust levels | |
| SCI56 | Number of measures or initiatives to control noise in the city | |
| SCI57 | Absence or presence of greenhouse gas reduction strategies | |
| SCI58 | Percentage of renewable energy contributed to the electricity supply | |
| SCI59 | Percentage of hotels using energy saving devices | |
| SCI60 | Percentage of green buildings in the city | |
| Urban Space and Tourism | SCI61 | The ratio of public and green spaces compared to the total area of the city |
| SCI62 | Number of natural or artificial parks in the city | |
| SCI63 | Percentage of residents living within 0.5 km of public and green space access | |
| SCI64 | Tourism growth rate per year | |
| SCI65 | Number of conserved cultural, historical, and heritage buildings | |
| SCI66 | Number of tourism firms providing tourism services in the city | |
| SCI67 | Number of botanic gardens in the city | |
| SCI68 | Number of playgrounds in the city | |
| SCI69 | Number of zoological gardens in the city | |
| Category | Indicator | Mean | SD | Percentage of Panelists Voting for Indicator as | ||||||
|---|---|---|---|---|---|---|---|---|---|---|
| 5 | 4 | 3 | 2 | 1 | 5 or 4 or 3 | 2 or 1 | ||||
| Demography | SCI3 | 4.20 | 0.60 | 30.00 | 60.00 | 10.00 | 0 | 0 | 100.00 | 0 |
| SCI1 | 3.90 | 0.83 | 30.00 | 30.00 | 40.00 | 0 | 0 | 100.00 | 0 | |
| SCI6 | 3.60 | 0.92 | 20.00 | 30.00 | 40.00 | 10.00 | 0 | 90.00 | 10.00 | |
| Employment | SCI12 | 4.60 | 0.49 | 60.00 | 40.00 | 0 | 0 | 0 | 100.00 | 0 |
| SCI9 | 4.20 | 0.75 | 40.00 | 40.00 | 20.00 | 0 | 0 | 100.00 | 0 | |
| SCI10 | 3.50 | 1.02 | 10.00 | 40.00 | 40.00 | 10.00 | 0 | 90.00 | 10.00 | |
| Housing | SCI16 | 4.70 | 0.46 | 70.00 | 30.00 | 0 | 0 | 0 | 100.00 | 0 |
| SCI18 | 3.90 | 0.94 | 30.00 | 40.00 | 20.00 | 10.00 | 0 | 90.00 | 10.00 | |
| SCI17 | 3.60 | 0.66 | 10.00 | 40.00 | 50.00 | 0 | 0 | 100.00 | 0 | |
| Transport | SCI25 | 4.80 | 0.40 | 80.00 | 20.00 | 0 | 0 | 0 | 100.00 | 0 |
| SCI26 | 4.10 | 0.83 | 40.00 | 30.00 | 30.00 | 0 | 0 | 100.00 | 0 | |
| SCI23 | 3.90 | 1.04 | 40.00 | 20.00 | 30.00 | 10.00 | 0 | 90.00 | 10.00 | |
| SCI24 | 3.80 | 0.60 | 10.00 | 60.00 | 30.00 | 0 | 0 | 100.00 | 0 | |
| Safety | SCI31 | 4.20 | 0.75 | 40.00 | 40.00 | 20.00 | 0 | 0 | 100.00 | 0 |
| SCI33 | 3.90 | 0.70 | 20.00 | 50.00 | 30.00 | 0 | 0 | 100.00 | 0 | |
| SCI32 | 3.70 | 0.64 | 10.00 | 50.00 | 40.00 | 0 | 0 | 100.00 | 0 | |
| SCI34 | 3.50 | 0.67 | 10.00 | 30.00 | 60.00 | 0 | 0 | 100.00 | 0 | |
| Water Use | SCI38 | 4.60 | 0.49 | 60.00 | 40.00 | 0 | 0 | 0 | 100.00 | 0 |
| SCI41 | 4.50 | 0.67 | 60.00 | 30.00 | 10.00 | 0 | 0 | 100.00 | 0 | |
| SCI40 | 3.90 | 0.70 | 20.00 | 50.00 | 30.00 | 0 | 0 | 100.00 | 0 | |
| Waste Management | SCI45 | 4.60 | 0.66 | 70.00 | 20.00 | 10.00 | 0 | 0 | 100.00 | 0 |
| SCI48 | 4.30 | 0.78 | 50.00 | 30.00 | 20.00 | 0 | 0 | 100.00 | 0 | |
| SCI46 | 4.10 | 0.83 | 40.00 | 30.00 | 30.00 | 0 | 0 | 100.00 | 0 | |
| Air Quality and Energy | SCI55 | 4.60 | 0.49 | 60.00 | 40.00 | 0 | 0 | 0 | 100.00 | 0 |
| SCI54 | 4.50 | 0.67 | 60.00 | 30.00 | 10.00 | 0 | 0 | 100.00 | 0 | |
| SCI53 | 3.90 | 0.70 | 20.00 | 50.00 | 30.00 | 0 | 0 | 100.00 | 0 | |
| SCI58 | 3.70 | 0.64 | 10.00 | 50.00 | 40.00 | 0 | 0 | 100.00 | 0 | |
| Urban Space and Tourism | SCI67 | 4.10 | 0.70 | 30.00 | 50.00 | 20.00 | 0 | 0 | 100.00 | 0 |
| SCI62 | 4.10 | 0.83 | 40.00 | 30.00 | 30.00 | 0 | 0 | 100.00 | 0 | |
| SCI64 | 4.00 | 0.77 | 30.00 | 40.00 | 30.00 | 0 | 0 | 100.00 | 0 | |
| SCI65 | 3.70 | 0.90 | 30.00 | 10.00 | 60.00 | 0 | 0 | 100.00 | 0 | |
| SCI68 | 3.60 | 0.80 | 20.00 | 20.00 | 60.00 | 0 | 0 | 100.00 | 0 | |
| Category | Consensus | GC and CC | SDG 11 |
|---|---|---|---|
| Demography | SCI3: Average of household income | ||
| SCI1: Population density | ● | ||
| SCI6: Percentage of the population migrating into the city | |||
| Employment | SCI12: Number of new jobs created per year | ||
| SCI9: Labor force participation rate | |||
| SCI10: Unemployment rate | ● | ||
| Housing | SCI16: Number of low-income housing development projects | ● | |
| SCI18: Percentage of new residential buildings (aged less than 30 years) | |||
| SCI17: Percentage of the population living in slums | ● | ||
| Transport | SCI25: Number of initiatives for sidewalk improvement | ||
| SCI26: Number of public parking lots in the city | |||
| SCI23: Public transport sharing rate | ● | ● | |
| SCI24: Number of initiatives to reduce traffic congestion | ● | ||
| Safety | SCI31: Number of measures or initiatives to prevent crimes | ● | |
| SCI33: Number of initiated programs to protect workers or road users from construction risks | |||
| SCI32: Number of facilities to prevent disasters | ● | ● | |
| SCI34: Percentage of residents using insurance services; number of insurance companies | |||
| Water Use | SCI38: Percentage of households with access to potable water infrastructure | ● | |
| SCI41: Average of the water consumption rate per person or household | |||
| SCI40: Number of natural or artificial reservoirs in or nearby the city | |||
| Waste Management | SCI45: Percentage of solid waste regularly collected | ● | ● |
| SCI48: Number of initiatives to reduce wastes | ● | ||
| SCI46: Capacity of wastewater treatment plants in the city | ● | ||
| Air Quality and Energy | SCI55: Fine dust levels | ● | |
| SCI54: Percentage of the urban forest | |||
| SCI53: Average of the energy consumption rate per person or household | |||
| SCI58: Percentage of renewable energy contributed to the electricity supply | ● | ||
| Urban Space and Tourism | SCI62: Number of natural or artificial parks in the city | ||
| SCI67: Number of botanic gardens in the city | |||
| SCI64: Tourism growth rate per year | ● | ||
| SCI65: Number of conserved cultural, historical, and heritage buildings | ● | ● | |
| SCI68: Number of playgrounds in the city |
© 2019 by the authors. Licensee MDPI, Basel, Switzerland. This article is an open access article distributed under the terms and conditions of the Creative Commons Attribution (CC BY) license (http://creativecommons.org/licenses/by/4.0/).
Share and Cite
Chan, P.; Lee, M.-H. Developing Sustainable City Indicators for Cambodia through Delphi Processes of Panel Surveys. Sustainability 2019, 11, 3166. https://doi.org/10.3390/su11113166
Chan P, Lee M-H. Developing Sustainable City Indicators for Cambodia through Delphi Processes of Panel Surveys. Sustainability. 2019; 11(11):3166. https://doi.org/10.3390/su11113166
Chicago/Turabian StyleChan, Puthearath, and Myeong-Hun Lee. 2019. "Developing Sustainable City Indicators for Cambodia through Delphi Processes of Panel Surveys" Sustainability 11, no. 11: 3166. https://doi.org/10.3390/su11113166
APA StyleChan, P., & Lee, M.-H. (2019). Developing Sustainable City Indicators for Cambodia through Delphi Processes of Panel Surveys. Sustainability, 11(11), 3166. https://doi.org/10.3390/su11113166