Evaluating the Public’s Preferences toward Sustainable Planning under Climate and Land Use Change in Forest Parks


Abstract
:1. Introduction
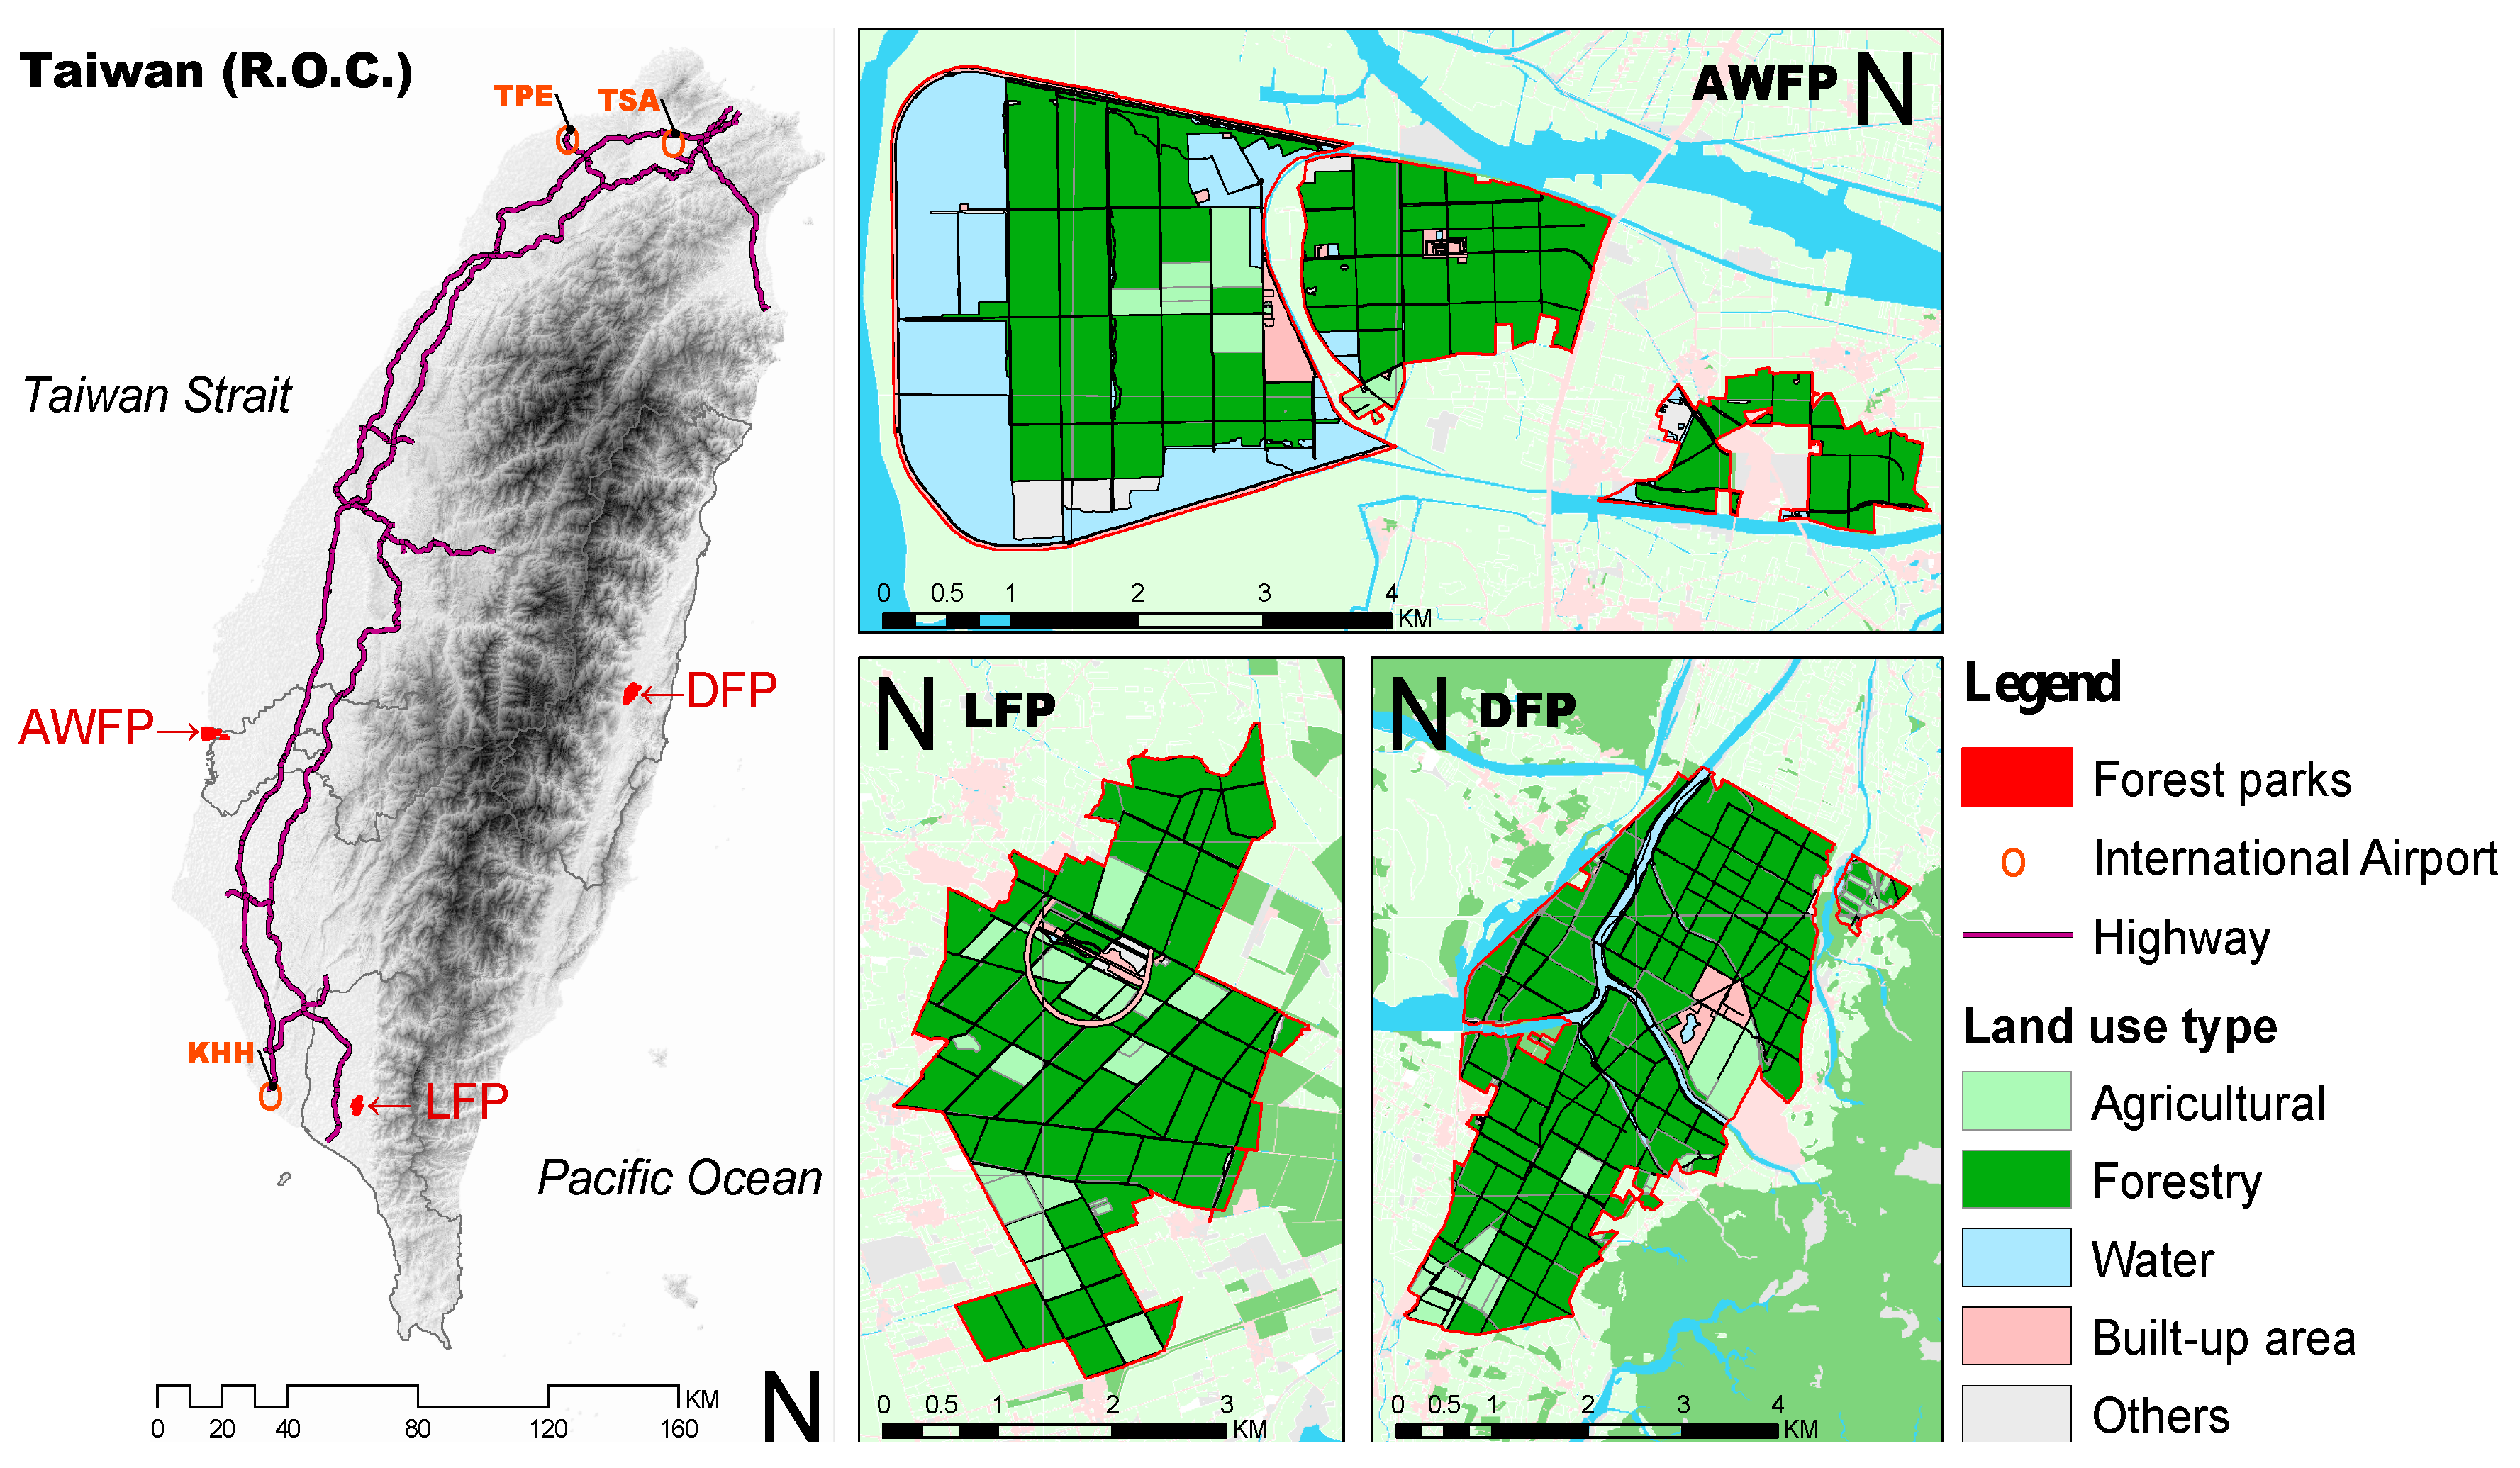
2. Study Area
2.1. Forest Parks in Taiwan
2.2. Conducting the Theoretical Thinking on SLM
3. Research Framework
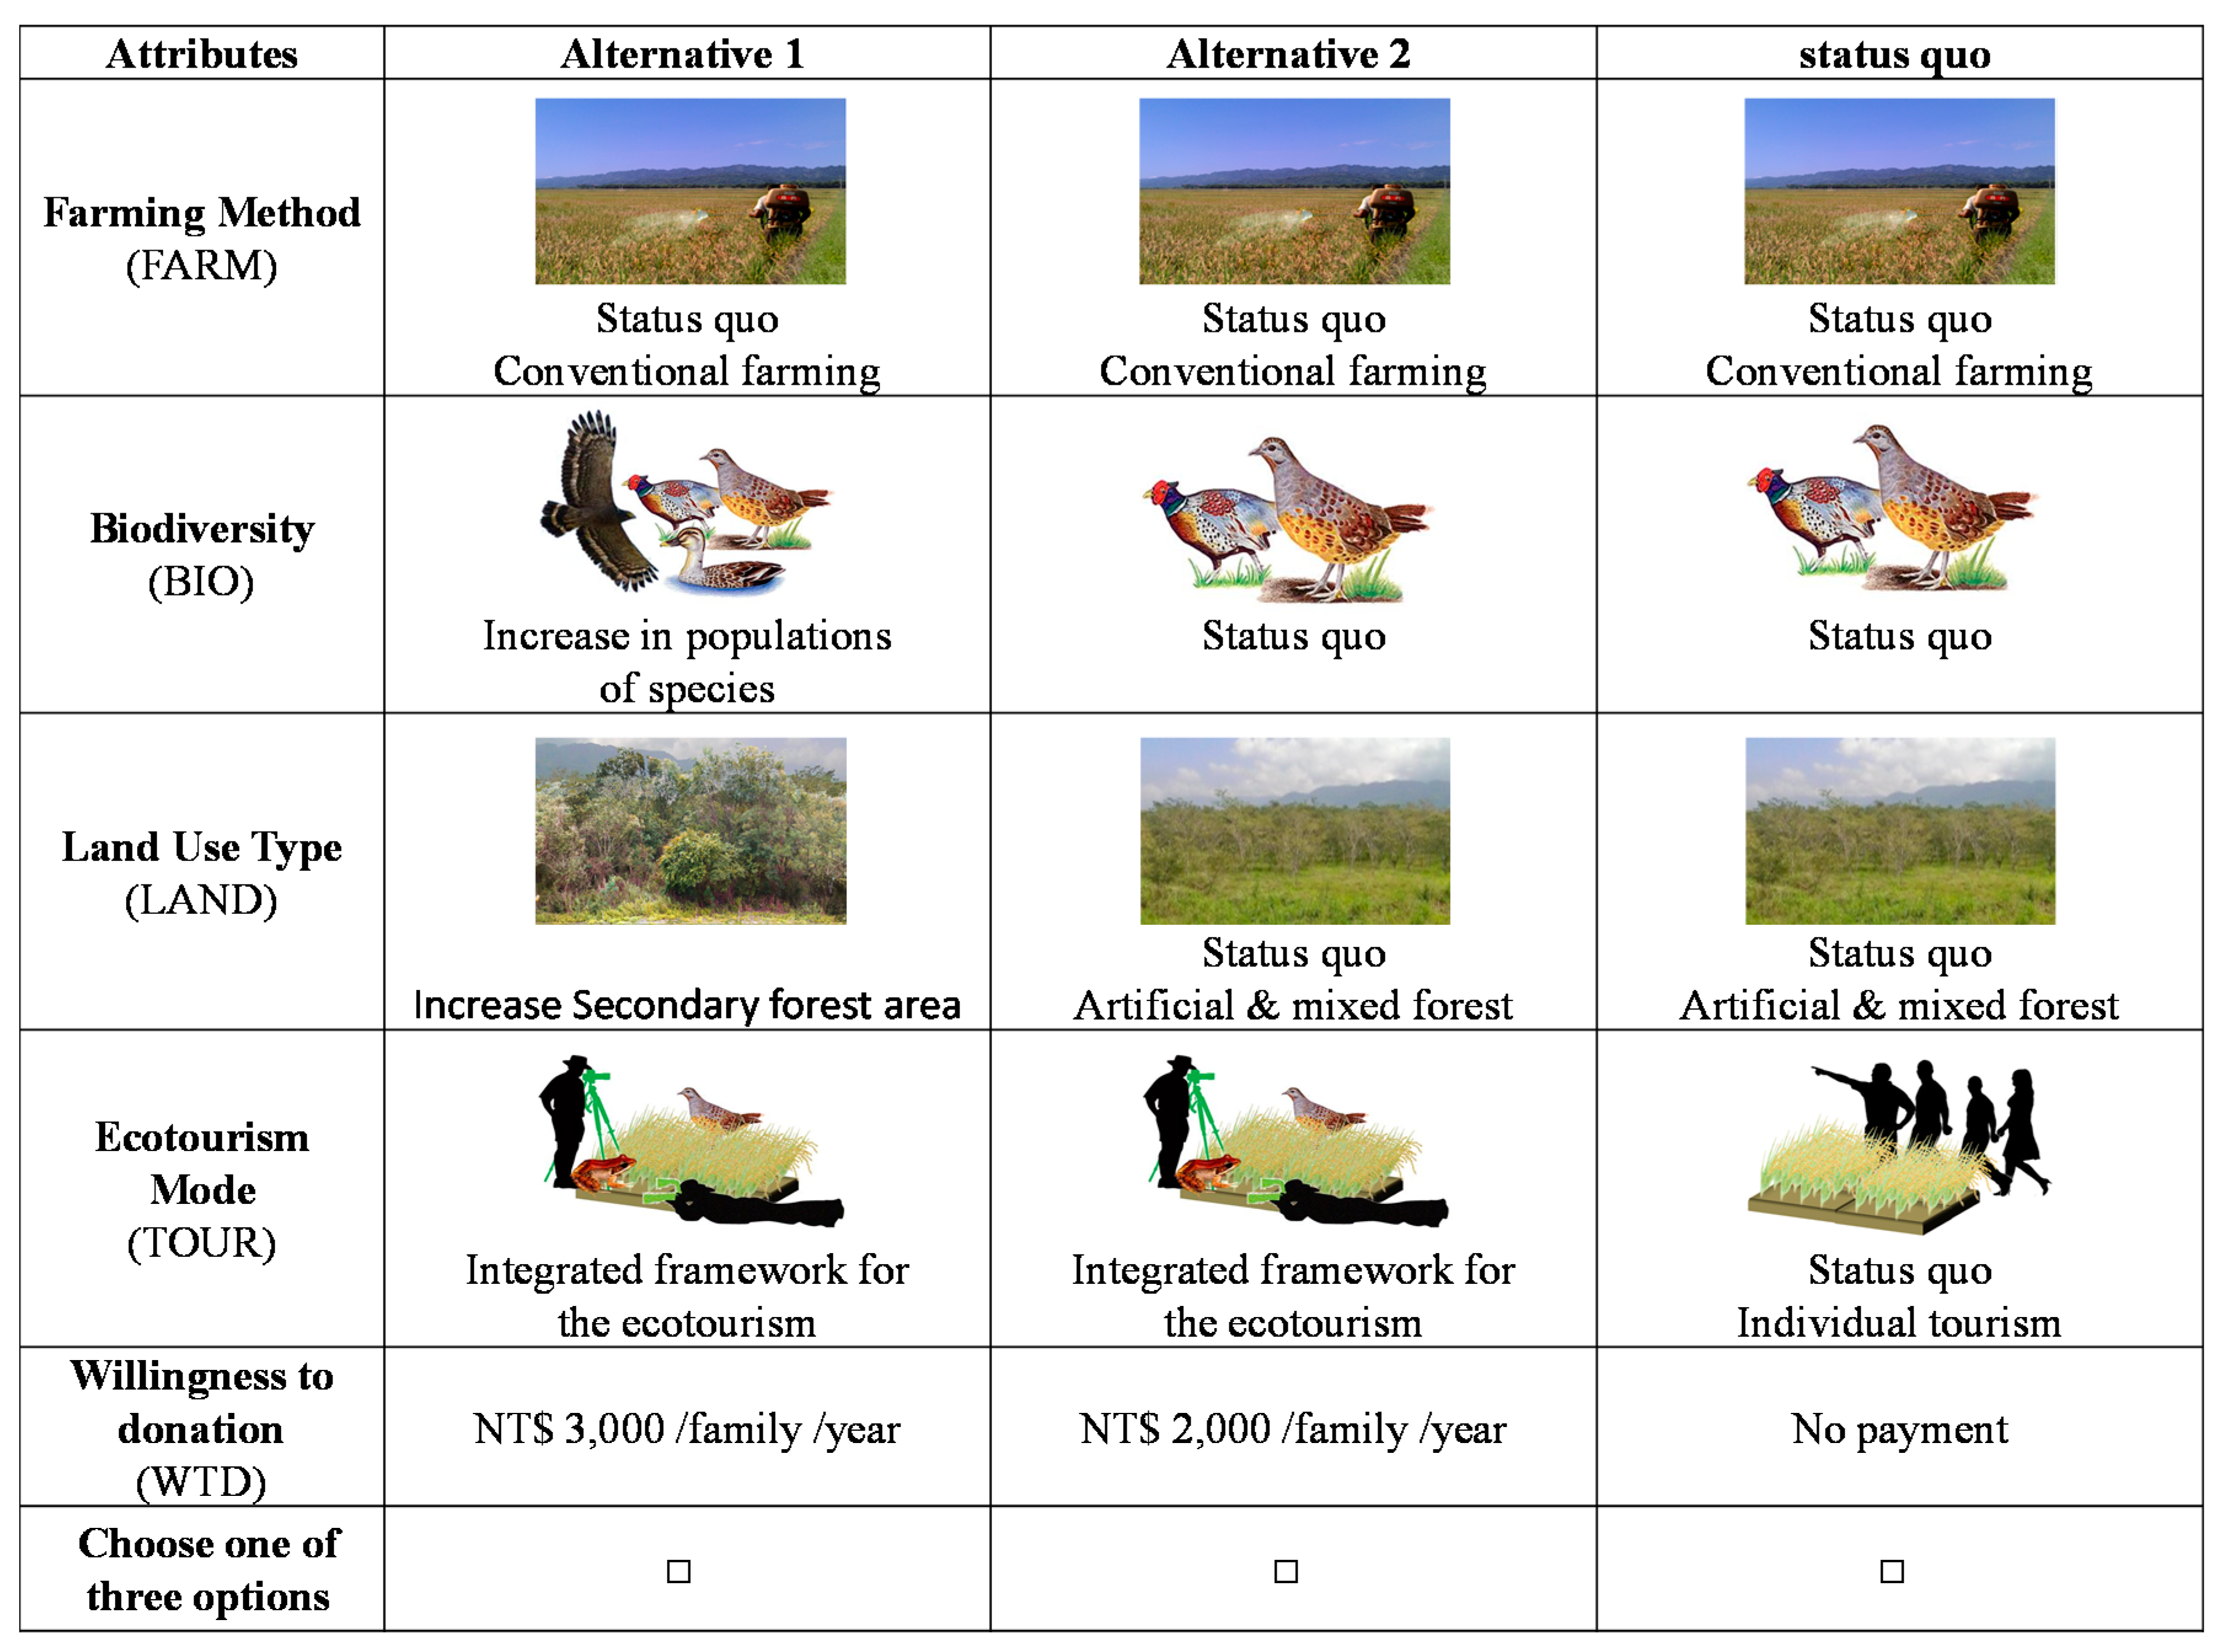
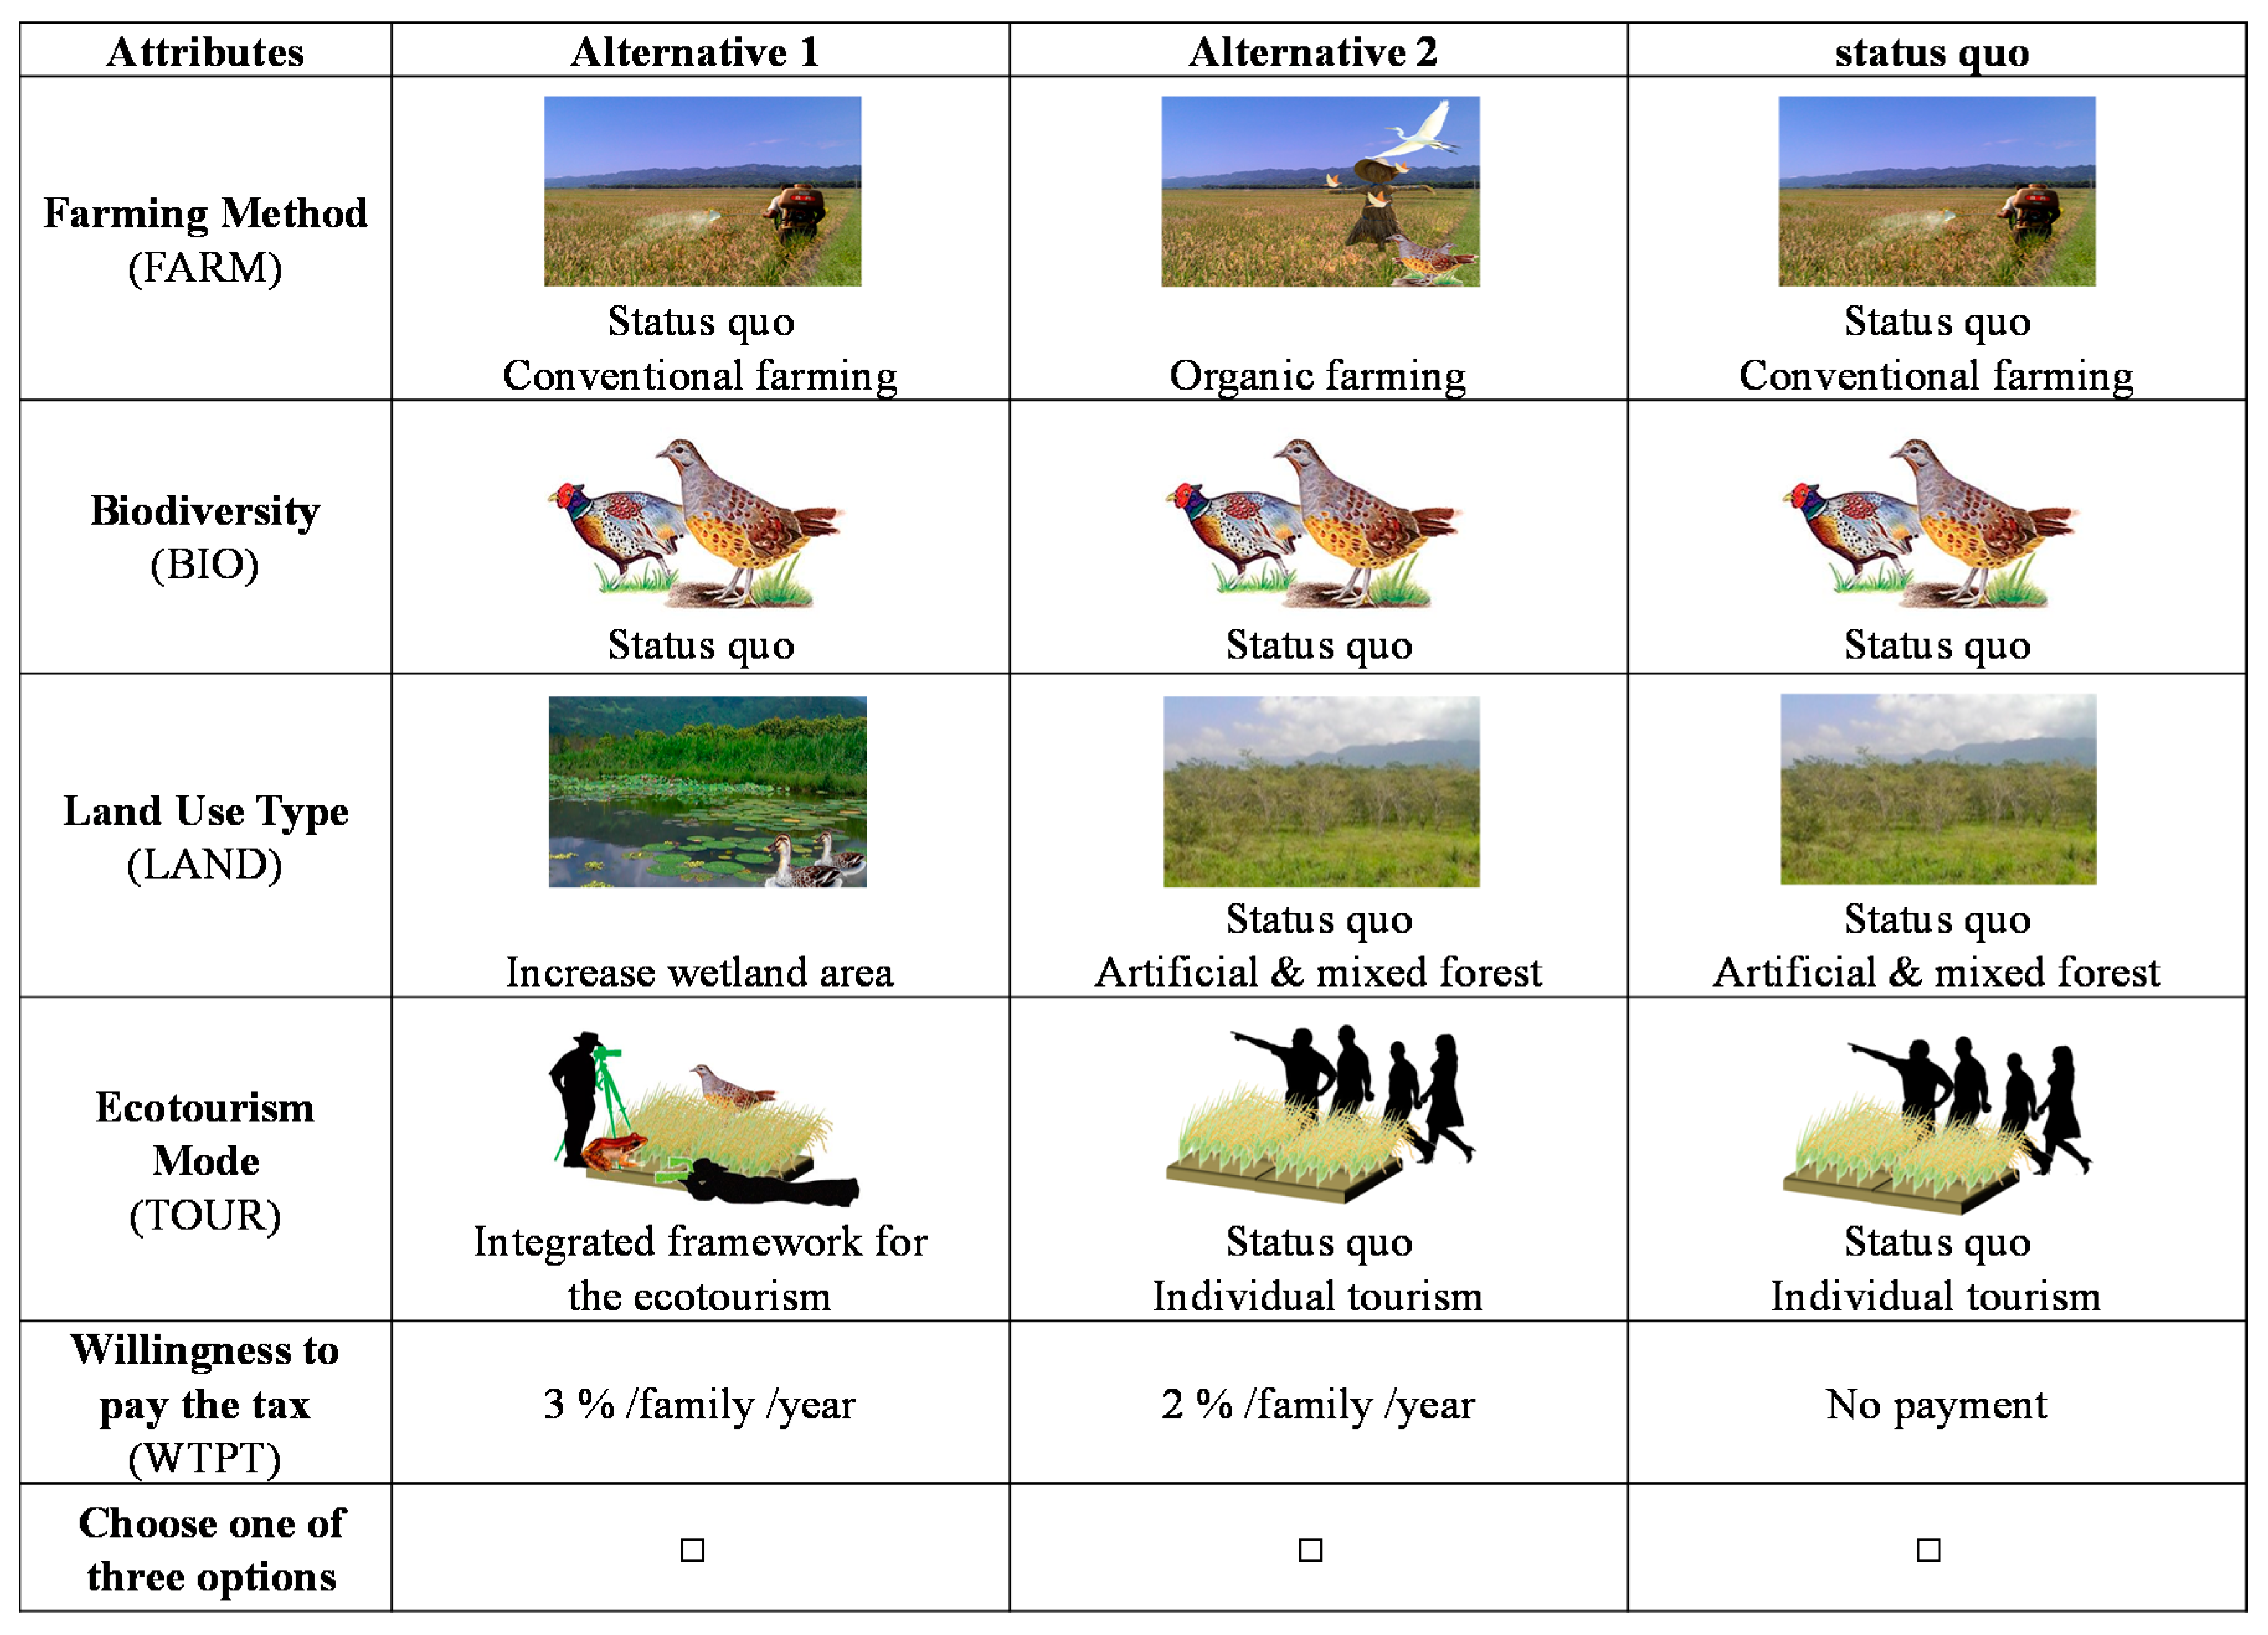
3.1. The Attribute Design For Measuring the Publics’ Preferences
3.2. The Questionnaire Design of SLM
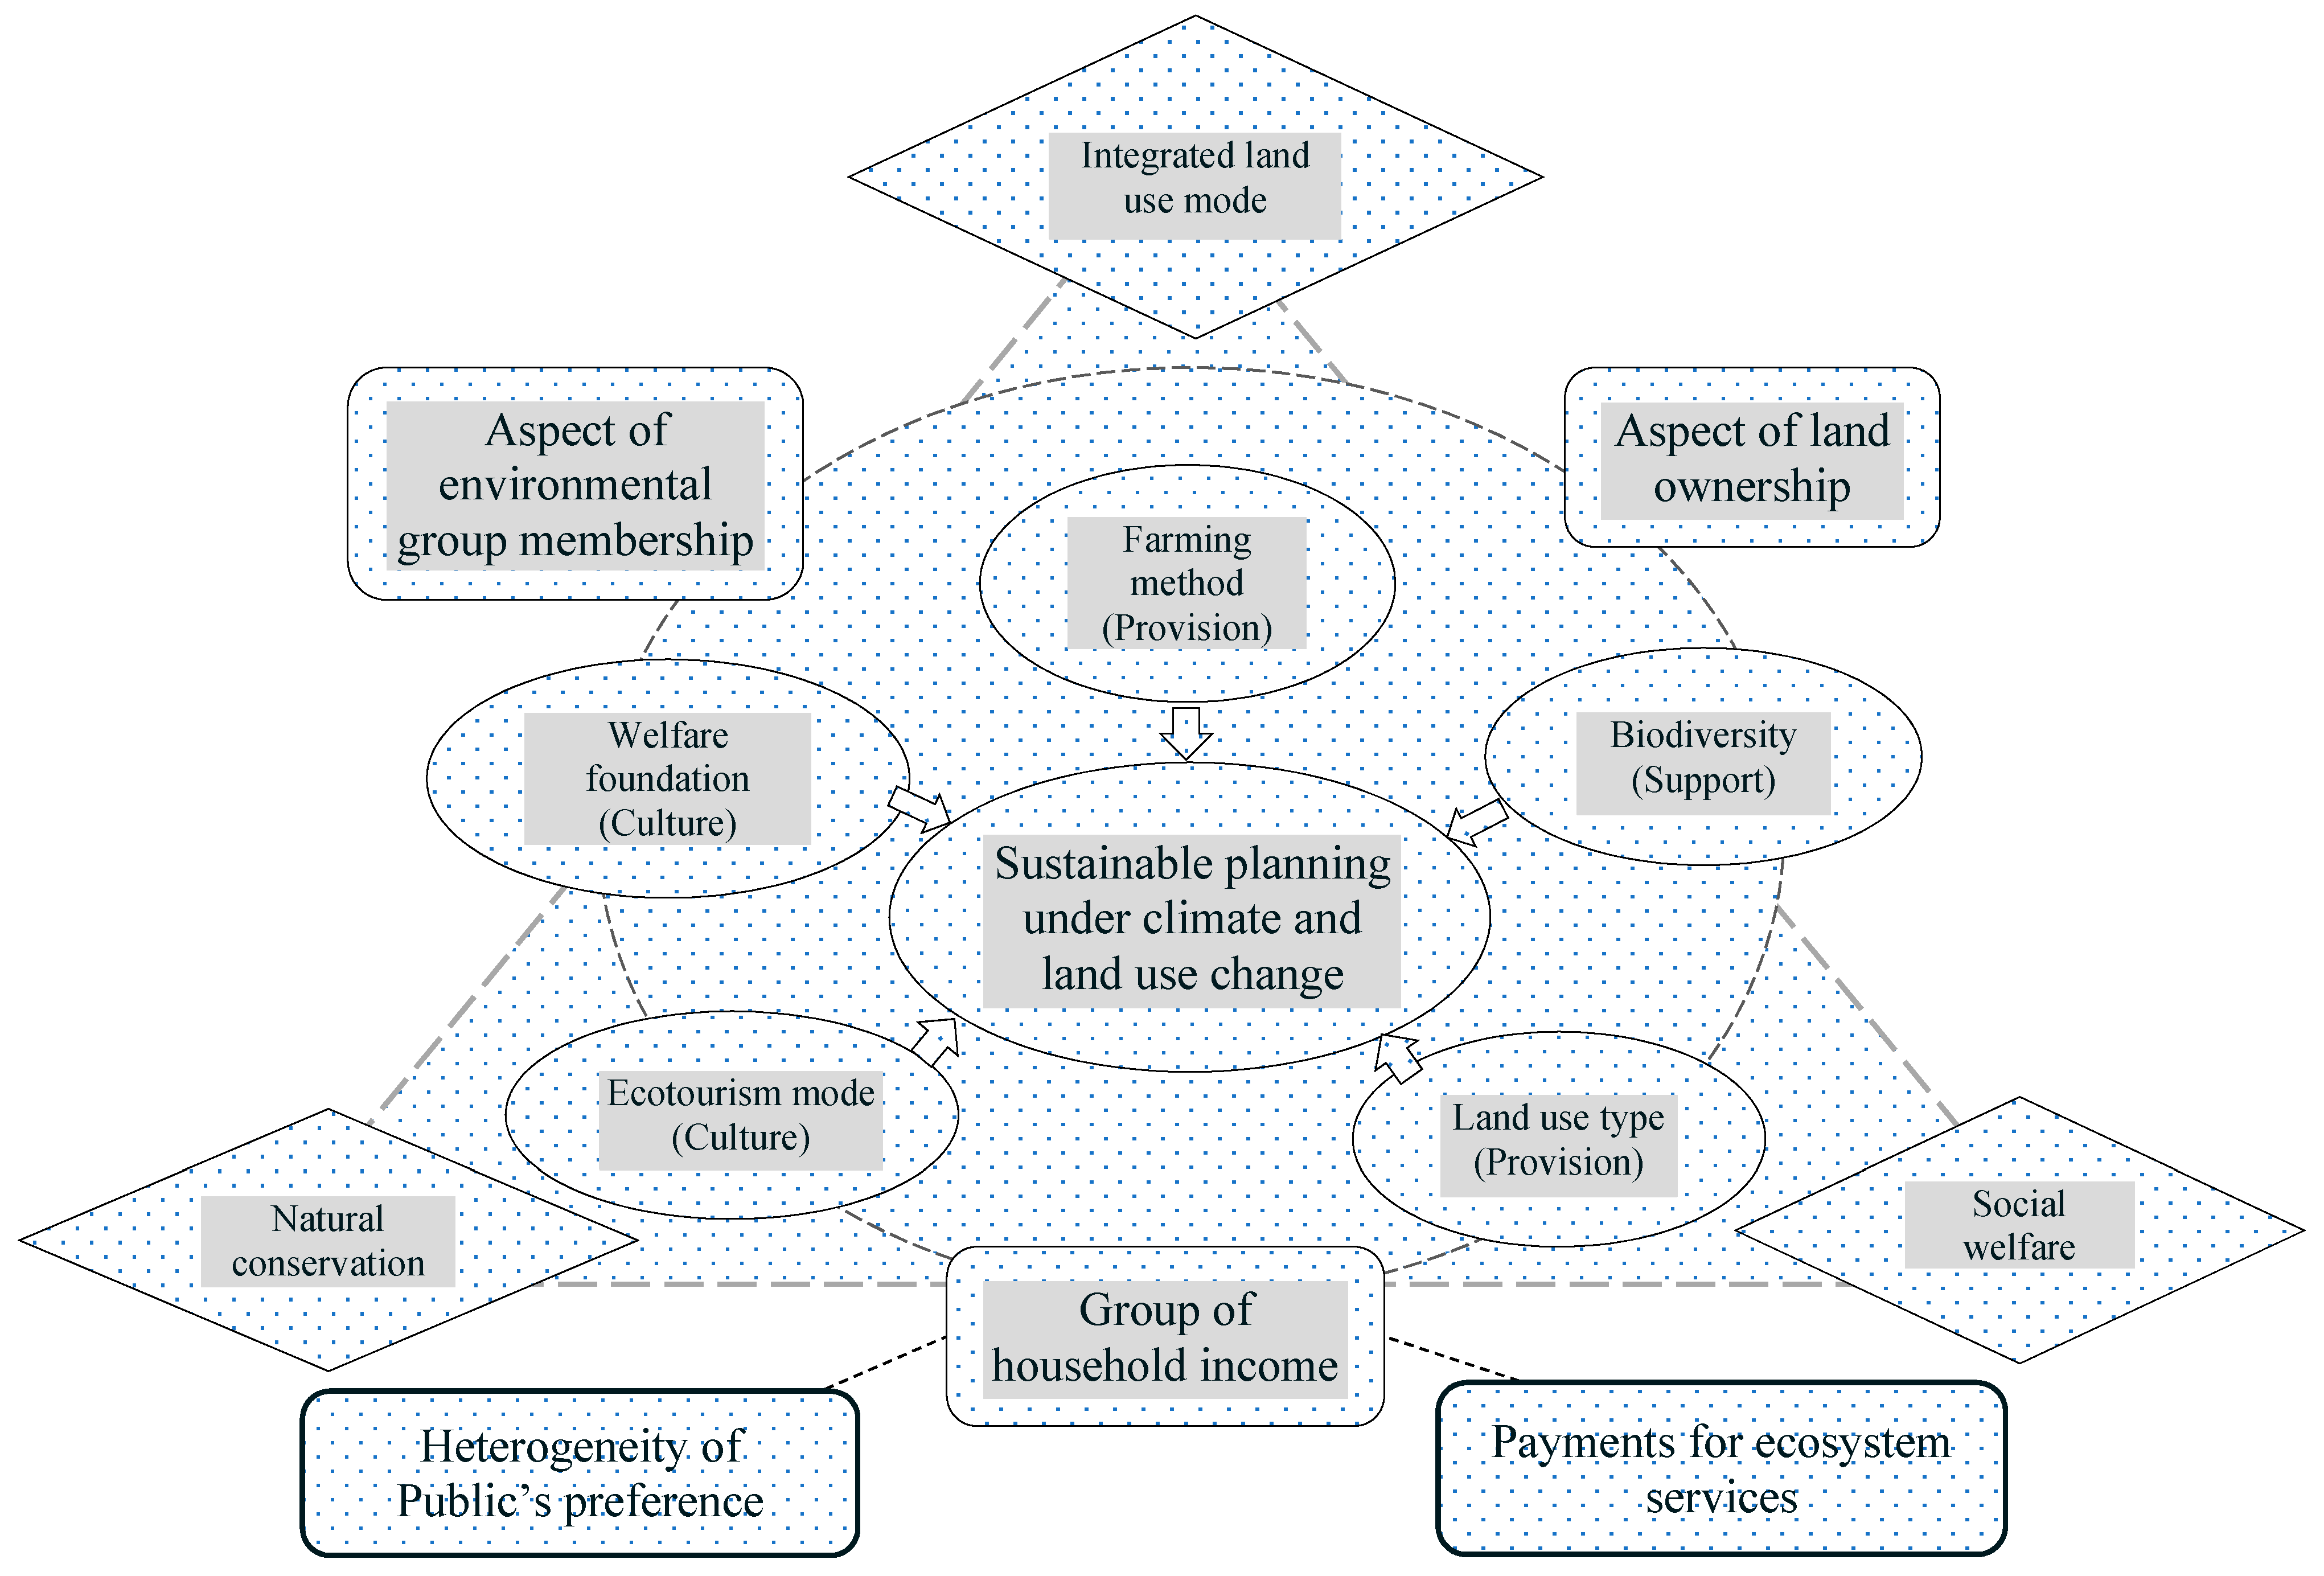
3.3. The Preference Model
3.4. Hypothetical Scenarios
- Strategy I—Nature conservation: Devoted to increasing biodiversity and increasing the secondary forest area. For the farming method and mode of ecotourism, it retains its current situation.
- Strategy II—Social welfare: Devoted to implementing organic farming and integrated ecotourism. For biodiversity and land use type, it retains its current situation.
- Strategy III—Integrated land use programs: Set a mode of ecotourism, devoted to creating and increasing healthy environment areas via implementing organic farming, increasing biodiversity, and increasing secondary forest area.
3.5. Sample Design and Survey Method
3.6. Characterization of Respondents
4. Empirical Results
4.1. The Publics’ Preferences Estimation
4.2. Testing Public’s Heterogeneity of Preference
4.3. The Welfare Effects of Hypothetical Scenarios
5. Discussion
6. Conclusions
Author Contributions
Funding
Acknowledgments
Conflicts of Interest
References
- Boyd, E.; Corbera, E.; Estrada, M. UNFCCC negotiations (pre-Kyoto to COP-9): What the process says about the politics of CDM-sinks. Int. Environ. Agreem. Polit. Law Econ. 2008, 8, 1–18. [Google Scholar] [CrossRef]
- Lorencová, E.; Frélichová, J.; Nelson, E.; Vačkář, D. Past and future impacts of land use and climate change on agricultural ecosystem services in the Czech Republic. Land Use Policy 2013, 33, 183–194. [Google Scholar] [CrossRef]
- Li, F.; Zhang, S.W.; Yang, J.C.; Chang, L.P.; Yang, H.J.; Bu, K. Effects of land use change on ecosystem services value in West Jilin since the reform and opening of China. Ecosyst. Serv. 2018, 31, 12–20. [Google Scholar]
- Bateman, I.J.; Harwood, A.R.; Mace, G.M.; Watson, R.T.; Abson, D.J.; Andrews, B.; Binner, A.; Crowe, A.; Day, B.H.; Dugdale, S.; et al. Bringing ecosystem services into economic decision-making: Land use in the United Kingdom. Science 2013, 341, 45–50. [Google Scholar] [CrossRef] [PubMed]
- Noszczyk, T. A review of approaches to land use changes modeling. Hum. Ecol. Risk Assess. Int. J. 2018. [Google Scholar] [CrossRef]
- Khan, M.M.H.; Bryceson, I.; Kolivras, K.N.; Faruque, F.; Rahman, M.M.; Haque, U. Natural disasters and landuse/ land-cover change in the southwest coastal areas of Bangladesh. Reg. Environ. Chang. 2015, 15, 241–250. [Google Scholar] [CrossRef]
- Roth, D.; Moreno-Sanchez, R.; Torres-Rojo, J.M.; Moreno-Sanchez, F. Estimation of human induced disturbance of the environment associated with 2002, 2008 and 2013 and use/cover patterns in Mexico. Appl. Geogr. 2016, 66, 22–34. [Google Scholar] [CrossRef]
- Dubreuil, V.; Debortoli, N.; Funatsu, B.; Nédélec, V.; Durieux, L. Impact of land-cover change in the Southern Amazonia climate: A case study for the region of Alta Floresta, Mato Grosso, Brazil. Environ. Monit. Assess. 2012, 184, 877–891. [Google Scholar] [CrossRef] [PubMed]
- Daniel, D.W.; Smith, L.M.; Belden, J.B.; McMurry, S.T.; Swain, S. Effects of land-use change and fungicide application on soil respiration in playa wetlands and adjacent uplands of the U.S. High Plains. Sci. Total Environ. 2015, 514, 290–297. [Google Scholar] [CrossRef]
- Natkhin, M.; Dietrich, O.; Schäfer, M.P.; Lischeid, G. The effects of climate and changing land use on the discharge regime of a small catchment in Tanzania. Reg. Environ. Chang. 2015, 15, 1269–1280. [Google Scholar] [CrossRef]
- He, C.C.; Han, Q.; de Vries, B.; Wang, X.M.; Zhao, G.C. Evaluation of sustainable land management in urban area: A case study of Shanghai, China. Ecol. Indic. 2017, 80, 106–113. [Google Scholar] [CrossRef]
- Long, H.L.; Tang, G.P.; Li, X.B.; Heilig, G.K. Socio-economic driving forces of land use change in Kunshan, the Yangtze River Delta economic area of China. J. Environ. Manag. 2007, 83, 351–364. [Google Scholar] [CrossRef] [PubMed]
- Luo, G.P.; Feng, Y.X.; Zhang, B.P.; Cheng, W.M. Sustainable land-use patterns for arid lands: A case study in the northern slope areas of the Tianshan Mountains. J. Geogr. Sci. 2010, 20, 510–524. [Google Scholar] [CrossRef]
- Smyth, A.J.; Dumanski, J. An International Framework for Evaluating Sustainable Land Management World Soil Resources Reports; Food and Agriculture Organization: Rome, Italy, 1993. [Google Scholar]
- Liekens, I.; Schaafsma, M.; De Nocker, L.; Broekx, S.; Staes, J.; Aertsens, J.; Brouwer, R. Developing a value function for nature development and land use policy in Flanders, Belgium. Land Use Policy 2013, 30, 549–559. [Google Scholar] [CrossRef]
- Birol, E.; Karousakis, K.; Koundouri, P. Using a choice experiment to account for preference heterogeneity in wetland attributes: The case of Cheimaditida wetland in Greece. Ecol. Econ. 2006, 60, 145–156. [Google Scholar] [CrossRef]
- Scarpa, R.; Thiene, M. Destination choice models for rock climbing in the Northeastern Alps: A latent-class approach based on intensity of preferences. Land Econ. 2005, 81, 426–444. [Google Scholar] [CrossRef]
- García-Llorente, M.; Martín-López, B.; Nunes, P.A.L.D.; Castro, A.J.; Montes, C. A choice experiment study for land-use scenarios in semi-arid watershed environments. J. Arid Environ. 2012, 87, 219–230. [Google Scholar] [CrossRef]
- Garrod, G.; Ruto, E.; Willis, K.; Powe, N. Heterogeneity of preferences for the benefits of Environmental Stewardship: A latent-class approach. Ecol. Econ. 2012, 76, 104–111. [Google Scholar] [CrossRef] [Green Version]
- Cerda, C.; Ponce, A.; Zappi, M. Using choice experiments to understand public demand for the conservation of nature: A case study in a protected area of Chile. J. Nat. Conserv. 2013, 21, 143–153. [Google Scholar] [CrossRef]
- Allen, K.E.; Moore, R. Moving beyond the exchange value in the nonmarket valuation of ecosystem services. Ecosyst. Serv. 2016, 18, 78–86. [Google Scholar] [CrossRef] [Green Version]
- Zandersen, M.; Jørgensen, S.L.; Nainggolan, D.; Gyldenkærne, S.; Winding, A.; Greve, M.H.; Termansen, M. Potential and economic efficiency of using reduced tillage to mitigate climate effects in Danish agriculture. Ecol. Econ. 2016, 123, 14–22. [Google Scholar] [CrossRef]
- Lee, C.-H.; Wang, C.-H. Estimating residents’ preferences of the land use program surrounding a forest park, Taiwan. Sustainability 2017, 9, 598. [Google Scholar] [CrossRef]
- Krajewski, P. Monitoring of Landscape Transformations within Landscape Parks in Poland in the 21st Century. Sustainability 2019, 11, 2410. [Google Scholar] [CrossRef]
- Wu, C.-H.; Lo, Y.-H.; Blanco, J.; Chang, S.-C. Resilience assessment of lowland plantations using an ecosystem modeling approach. Sustainability 2015, 7, 3801–3822. [Google Scholar] [CrossRef]
- Tai, H.-S. Cross-scale and Cross-level dynamics: Governance and capacity for resilience in a social-ecological system in Taiwan. Sustainability 2015, 7, 2045–2065. [Google Scholar] [CrossRef]
- Zong, C.; Cheng, K.; Lee, C.H.; Hsu, N.L. Capturing tourists’ preferences for the management of community-based ecotourism in a forest park. Sustainability 2017, 9, 1673. [Google Scholar] [CrossRef]
- Forest Bureau. Available online: http://recreation.forest.gov.tw/English/FP_01.html (accessed on 27 February 2019).
- Christensen, T.; Pedersen, A.B.; Nielsen, H.O.; Mørkbak, M.R.; Hasler, B.; Denver, S. Determinants of farmers’ willingness to participate in subsidy schemes for pesticide-free buffer zones—A choice experiment study. Ecol. Econ. 2011, 70, 1558–1564. [Google Scholar] [CrossRef]
- Fan, S.; Brzeska, J. Sustainable food security and nutrition: Demystifying conventional beliefs. Glob. Food Security 2016, 11, 11–16. [Google Scholar] [CrossRef]
- Lefebvre, M.; Langrell, S.R.H.; Gomez-y-Paloma, S. Incentives and policies for integrated pest management in Europe: A review. Agron. Sustain. Dev. 2015, 35, 27–45. [Google Scholar] [CrossRef]
- Rambonilaza, T.; Brahic, E. Non-market values of forest biodiversity and the impact of informing the general public: Insights from generalized multinomial logit estimations. Environ. Sci. Policy 2016, 64, 93–100. [Google Scholar] [CrossRef]
- Shoyama, K.; Managi, S.; Yamagata, Y. Public preferences for biodiversity conservation and climate-change mitigation: A choice experiment using ecosystem services indicators. Land Use Policy 2013, 34, 282–293. [Google Scholar] [CrossRef]
- Juutinen, A.; Mitani, Y.; Mäntymaa, E.; Shoji, Y.; Siikamäki, P.; Svento, R. Combining ecological and recreational aspects in national park management: A choice experiment application. Ecol. Econ. 2011, 70, 1231–1239. [Google Scholar] [CrossRef]
- Chen, Y.-H. Environmentally Friendly Payments Policies in Taiwan and Germany; Council of Agriculture, Executive Yuan: Taipei, Taiwan, 2012.
- Šrůtek, M.; Urban, J. Organic farming A2—Jørgensen, Sven Erik. In Encyclopedia of Ecology; Fath, B.D., Ed.; Academic Press: Oxford, UK, 2008; pp. 2582–2587. [Google Scholar]
- Hearne, R.R.; Santos, C.A. Tourists’ and locals’ preferences toward ecotourism development in the Maya Biosphere Reserve, Guatemala. Environ. Dev. Sustain. 2005, 7, 303–318. [Google Scholar] [CrossRef]
- Sriarkarin, S.; Lee, C.H. Integrating the multiple attributes for sustainable development in a national park. Tour. Manag. Perspect. 2018, 28, 113–125. [Google Scholar] [CrossRef]
- Westerberg, V.H.; Lifran, R.; Olsen, S.B. To restore or not? A valuation of social and ecological functions of the Marais des Baux wetland in Southern France. Ecol. Econ. 2010, 69, 2383–2393. [Google Scholar] [CrossRef] [Green Version]
- Guimarães, M.H.; Madureira, L.; Nunes, L.C.; Santos, J.L.; Sousa, C.; Boski, T.; Dentinho, T. Using choice modeling to estimate the effects of environmental improvements on local development: When the purpose modifies the tool. Ecol. Econ. 2014, 108, 79–90. [Google Scholar] [CrossRef]
- Krawczyk, R. Afforestation and secondary succession. For. Res. Pap. 2015, 75, 423–427. [Google Scholar] [CrossRef] [Green Version]
- Gibson, J.M.; Rigby, D.; Polya, D.A.; Russell, N. Discrete choice experiments in developing countries: Willingness to pay versus willingness to work. Environ. Resour. Econ. 2016, 65, 697–721. [Google Scholar] [CrossRef]
- Hanley, N.; Mourato, S.; Wright, R.E. Choice modelling approaches: A superior alternative for environmental valuation? J. Econ. Surv. 2001, 15, 435–462. [Google Scholar] [CrossRef]
- Louviere, J.J.; Hensher, D.A.; Swait, J.D. Stated Choice Methods: Analysis and Application; Cambridge University Press: Cambridge, UK, 2000. [Google Scholar]
- Train, K. Discrete Choice Methods with Simulation, 2nd ed.; Cambridge University Press: London, UK, 2009. [Google Scholar]
- Boxall, P.C.; Adamowicz, W.L. Understanding heterogeneous preferences in random utility models: A latent class approach. Environ. Resour. Econ. 2002, 23, 421–446. [Google Scholar] [CrossRef]
- Train, K.E. Recreation demand models with taste differences over people. Land Econ. 1998, 74, 230–239. [Google Scholar] [CrossRef]
- Kontoleon, A. Essays on Non-Market Valuation of Environmental Resources: Policy and Technical Explorations. Ph.D. Thesis, University College London, London, UK, 2003. [Google Scholar]
- Hensher, D.A.; Rose, J.M.; Greene, W.H. Applied Choice Analysis-A Primer; Cambridge University Press: Cambridge, UK, 2005. [Google Scholar]
- Lienhoop, N.; Brouwer, R. Agri-environmental policy valuation: Farmers’ contract design preferences for afforestation schemes. Land Use Policy 2015, 42, 568–577. [Google Scholar] [CrossRef]
- Wattage, P.; Glenn, H.; Mardle, S.; Van Rensburg, T.; Grehan, A.; Foley, N. Economic value of conserving deep-sea corals in Irish waters: A choice experiment study on marine protected areas. Fish. Res. 2011, 107, 59–67. [Google Scholar] [CrossRef]
- León, C.J.; de León, J.; Araña, J.E.; González, M.M. Tourists’ preferences for congestion, residents’ welfare and the ecosystems in a national park. Ecol. Econ. 2015, 118, 21–29. [Google Scholar] [CrossRef]
- Robinson, G.; Song, B. Transforming the peri-urban fringe in China: The example of Xi’an-Xianyang. Sustainability 2018, 10, 3932. [Google Scholar] [CrossRef]
- Ibănescu, B.-C.; Bulai, M.; Eva, M. Tourism behavior of periurban localities in relation to the urban centres. Case study: Romania. Paper presented at 3rd International Multidisciplinary Scientific Conference on Social Sciences and Arts SGEM 2016, Bulgaria, Balkans, 30 September 2016. Economics and Tourism. [Google Scholar]
- Le Texier, M.; Schiel, K.; Caruso, G. The provision of urban green space and its accessibility: Spatial data effects in Brussels. PLoS ONE 2018, 13, e0204684. [Google Scholar] [CrossRef] [PubMed]
- Yoong, H.Q.; Lim, K.Y.; Lee, L.K.; Zakaria, N.A.; Foo, K.Y. Sustainable urban green space management practice. Int. Malays.-Indones.-Thail. Symp. Innov. Creat. (iMIT-SIC) 2017, 2, 1–4. [Google Scholar]


| Attributes | Levels | Variable Name | |
|---|---|---|---|
| Farming Method (FARM) | a. Current situation (conventional farming) | FARM± | |
| b. Organic farming | FARM+ | ||
| Biodiversity (BIO) | a. Current situation | BIO± | |
| b. Increase in species populations | BIO+ | ||
| Land Use Type (LAND) | a. Status quo (artificial & mixed forest) | LAND± | |
| b. Increasing secondary forest area | LAND1 | ||
| c. Increasing ethno-botany area | LAND2 | ||
| d. Increasing wetland area | LAND3 | ||
| Ecotourism Mode (TOUR) | a. Current situation (individual tourism) | TOUR± | |
| b. Integrated framework for ecotourism | TOUR+ | ||
| Welfare foundation | (a) Willingness to donate (WTD) | a. Current situation (no payment) | FUND |
| b. NTD 1000/family/year | |||
| c. NTD 2000/family/year | |||
| d. NTD 3000/family/year | |||
| e. NTD 4000/family/year | |||
| (b) Willingness to pay a tax (WTPT) | a. Status quo (no payment) | TAX | |
| b. 1%/family/year | |||
| c. 2%/family/year | |||
| d. 3%/family/year | |||
| e. 4%/family/year | |||
| Attributes | Willingness to Donate | Willingness to Donate | ||||||
|---|---|---|---|---|---|---|---|---|
| Coefficient | t-Value | Std. Dev. | Coefficient | t-Value | Std. Dev. | |||
| Coefficient | t-Value | Coefficient | t-Value | |||||
| ASC | −1.00344 | −4.50 *** | 3.51399 | 14.07 *** | −1.35512 | −5.20 *** | 3.63932 | 12.33 *** |
| FARM | 0.64339 | 11.69 *** | 0.49549 | 4.4 *** | 0.73794 | 11.02 *** | 0.61775 | 4.93 *** |
| BIO | 0.12895 | 2.78 *** | 0.0191 | 0.17 | 0.15752 | 2.95 *** | 0.03456 | 0.21 |
| LAND1 | 0.27470 | 3.98 *** | 0.47735 | 2.77 *** | 0.35417 | 4.45 *** | 0.5273 | 2.66 *** |
| LAND2 | −0.03258 | −0.41 | 0.0515 | 0.17 | −0.01721 | −0.19 | 0.01067 | 0.04 |
| LAND3 | −0.00045 | −0.01 | 0.60747 | 3.9 *** | −0.03002 | −0.35 | 0.67067 | 3.65 *** |
| TOUR | 0.26628 | 5.28 *** | 0.51589 | 4.79 *** | 0.32191 | 5.41 *** | 0.60595 | 4.91 *** |
| Interactions between attributes and other variables | ||||||||
| FUND D1 | − | − | − | − | 0.00047 | 2.23 ** | 0.00067 | 1.65 * |
| FUND D2 | − | − | − | − | 0.00019 | 2.00 ** | 0.00021 | 0.99 |
| FUND D3 | − | − | − | − | −0.00033 | −3.33 *** | 0.00018 | 0.58 |
| FUND D4 | − | − | − | − | −0.00021 | −1.94 * | 0.0008 | 7.51 *** |
| FUND | −0.00051 | −12.18 *** | −0.00056 | −5.3 *** | ||||
| Log-likelihood | 1179.58 *** | 1260.65 *** | ||||||
| Chi Squared | χ2 0.01(15) = 30.5779 | χ2 0.01(23) = 41.6384 | ||||||
| Inf. Cr. AIC | AIC = 4960.9; AIC/N = 1.784 | AIC = 4895.8; AIC/N = 1.76 | ||||||
| Attributes | Willingness to Pay the Tax | Willingness to Pay the Tax | ||||||
|---|---|---|---|---|---|---|---|---|
| Coefficient | t-Value | Std. Dev. | Coefficient | t-Value | Std. Dev. | |||
| Coefficient | t-Value | Coefficient | t-Value | |||||
| ASC | −1.00575 | −3.41 *** | 5.53772 | 12.49 *** | −1.77296 | −4.54 *** | 5.83395 | 10.25 *** |
| FARM | 0.62437 | 8.78 *** | 0.84348 | 6.64 *** | 0.782 | 7.25 *** | 1.14563 | 6.17 *** |
| BIO | 0.08985 | 1.66 * | 0.01752 | 0.05 | 0.12173 | 1.73 * | 0.25665 | 1.13 |
| LAND1 | 0.17931 | 2.16 ** | 0.59655 | 3.31 *** | 0.2821 | 2.53 ** | 0.73269 | 2.76 *** |
| LAND2 | 0.11151 | 1.19 | 0.18512 | 0.76 | 0.17463 | 1.49 | 0.26763 | 1.05 |
| LAND3 | −0.04647 | −0.54 | 0.6224 | 3.31 *** | −0.1228 | −1.15 | 0.66411 | 2.4 ** |
| TOUR | 0.25578 | 4.15 *** | 0.70595 | 5.72 *** | 0.33618 | 4.18 *** | 0.86368 | 4.99 *** |
| Interactions between attributes and other variables | ||||||||
| TAX D1 | - | - | - | - | 46.2139 | 1.72 * | 95.2335 | 2.59 *** |
| TAX D2 | - | - | - | - | 18.5402 | 1.14 | 48.627 | 1.05 |
| TAX D4 | - | - | - | - | −30.0938 | −1.87 * | 121.358 | 7.33 *** |
| TAX D5 | - | - | - | - | 2.53302 | 0.17 | 58.7888 | 1.88 * |
| TAX | −0.63174 | −11.35 *** | −1.04796 | −5.97 *** | ||||
| Log-likelihood | 1496.76 *** | 1578.94 *** | ||||||
| Chi Squared | χ2 0.01(15) = 30.5779 | χ2 0.01(23) = 41.6384 | ||||||
| Inf. Cr. AIC | AIC = 4643.7; AIC/N = 1.670 | AIC = 4577.5; AIC/N = 1.646 | ||||||
| Attributes | Class 1 | Class 2 | ||||
|---|---|---|---|---|---|---|
| Coefficient | t-Value | MWTD (NTD/family/year) | Coefficient | t-Value | MWTD (NTD/family/year) | |
| ASC | −1.16594 | −1.86 * | - | −5.75257 | −2.33 ** | - |
| FARM | 0.49973 | 8.89 *** | 2173 | −0.16249 | −0.46 | - |
| BIO | 0.11356 | 2.31 ** | 494 | 1.69087 | 2.44 ** | 500 |
| LAND1 | 0.31239 | 3.96 *** | 1358 | 0.22003 | 0.73 | - |
| LAND2 | −0.04586 | −0.47 | - | −1.16492 | −1.65 * | −345 |
| LAND3 | 0.10884 | 1.44 | - | −2.13392 | −1.99 ** | −631 |
| TOUR | 0.32417 | 5.79 *** | 1409 | −0.80559 | −1.44 | - |
| FUND | −0.00023 | −5.25 *** | - | −0.00338 | −2.84 *** | - |
| Probability | 0.604 | 0.396 | ||||
| Class membership parameters | ||||||
| Constant | −0.05429 | −0.17 | ||||
| D1 | 1.15898 | 3.54 *** | ||||
| D2 | 0.33889 | 2.58 *** | ||||
| D3 | −0.39015 | −3.16 *** | ||||
| D4 | 0.33425 | 2.19 ** | ||||
| D6 | 0.20812 | 0.74 | ||||
| Log-likelihood Ratio | 562.94 *** | |||||
| Chi Square | χ2 0.01(22) = 40.2849 | |||||
| Inf. Cr. AIC | AIC = 5591.5; AIC/N = 2.011 | |||||
| Attributes | Class 1 | Class 2 | ||||
|---|---|---|---|---|---|---|
| Coefficient | t-Value | MWTPT (%/family/year) | Coefficient | t-Value | MWTPT (%/family/year) | |
| ASC | −5.87112 | −2.64 *** | - | −1.40263 | −1.53 | - |
| FARM | −0.30254 | −1.06 | - | 0.37933 | 6.93 *** | 1.46 |
| BIO | 1.7774 | 2.81 *** | 0.52 | 0.0213 | 0.42 | - |
| LAND1 | −0.07521 | −0.19 | - | 0.20112 | 2.60 *** | 0.77 |
| LAND2 | −1.50172 | −2.46 ** | −0.44 | 0.15896 | 1.63 | - |
| LAND3 | −1.81195 | −1.90 * | −0.53 | 0.00342 | 0.04 | - |
| TOUR | −0.94261 | −1.80 * | −0.28 | 0.27508 | 4.85 *** | 1.06 |
| TAX | −3.39307 | −3.23 *** | - | −0.2605 | −6.10 *** | - |
| Probability | 0.455 | 0.545 | ||||
| Class membership parameters | ||||||
| Constant | 0.35302 | 1.08 | ||||
| D1 | −0.6243 | −2.43 ** | ||||
| D2 | −0.37909 | −3.02 *** | ||||
| D4 | −0.38417 | −2.62 *** | ||||
| D5 | −0.26913 | −2.31 ** | ||||
| D6 | 0.05153 | 0.20 | ||||
| Log-likelihood Ratio | 483.47 *** | |||||
| Chi Square | χ2 0.01(22) = 40.2849 | |||||
| Inf. Cr. AIC | AIC = 5671.0 AIC/N = 2.03 | |||||
| Attributes | Strategic Scenario I: Nature Conservation Program | Strategic Scenario II: Social Welfare Program | Strategic Scenario III: Integrated Land Use Program |
|---|---|---|---|
| FARM | Current situation | Implement organic farming | Implement organic farming |
| BIO | Increase | Current situation | Increase |
| LAND | Increase secondary forest area | Current situation | Increase secondary forest area |
| TOUR | Current situation | Integrated ecotourism package | Integrated ecotourism package |
| FUND mean (95% CI) | 910.99 (894.3~927.7) | 1906.42 (1870.7~1942.2) | 2817.41 (2776.5~2858.3) |
| TAX mean (95% CI) | 0.38 (0.37~0.39) | 1.08 (1.04~1.12) | 1.46 (1.42~1.50) |
© 2019 by the authors. Licensee MDPI, Basel, Switzerland. This article is an open access article distributed under the terms and conditions of the Creative Commons Attribution (CC BY) license (http://creativecommons.org/licenses/by/4.0/).
Share and Cite
Lee, C.-L.; Wang, C.-H.; Lee, C.-H.; Sriarkarin, S. Evaluating the Public’s Preferences toward Sustainable Planning under Climate and Land Use Change in Forest Parks. Sustainability 2019, 11, 3149. https://doi.org/10.3390/su11113149
Lee C-L, Wang C-H, Lee C-H, Sriarkarin S. Evaluating the Public’s Preferences toward Sustainable Planning under Climate and Land Use Change in Forest Parks. Sustainability. 2019; 11(11):3149. https://doi.org/10.3390/su11113149
Chicago/Turabian StyleLee, Chun-Lin, Chiung-Hsin Wang, Chun-Hung Lee, and Supasit Sriarkarin. 2019. "Evaluating the Public’s Preferences toward Sustainable Planning under Climate and Land Use Change in Forest Parks" Sustainability 11, no. 11: 3149. https://doi.org/10.3390/su11113149
APA StyleLee, C.-L., Wang, C.-H., Lee, C.-H., & Sriarkarin, S. (2019). Evaluating the Public’s Preferences toward Sustainable Planning under Climate and Land Use Change in Forest Parks. Sustainability, 11(11), 3149. https://doi.org/10.3390/su11113149