Article

Evaluation of Water and Energy Nexus in Wami Ruvu River Basin, Tanzania

1
Institute of Water Sciences, College of Engineering, Peking University, Beijing 100871, China
2
School of Environmental Science and Engineering, Southern University of Science and Technology, Shenzhen 518055, China
*
Author to whom correspondence should be addressed.
Sustainability 2019, 11(11), 3109; https://doi.org/10.3390/su11113109
Submission received: 9 May 2019 / Revised: 29 May 2019 / Accepted: 30 May 2019 / Published: 2 June 2019
(This article belongs to the Special Issue Modern Bioenergy for Sustainable Development)

Abstract

:
In African nations, national and regional development targets for water and energy sectors seldom consider the nexus between the two, risking imbalances and inefficiencies in resource allocation and utilization. A typical example is the development and expansion of biofuel in the Wami Ruvu River Basin, Tanzania (WRB). Water Evaluation and Planning (WEAP) model was applied to the WRB to investigate the Water Energy Nexus (WEN), specifically, whether the development plan calling for biofuel expansion is a sound approach. Results show that WEN is much stronger in the biofuel irrigation consuming 69.3% and 61% of total biofuel’s water and energy requirement, respectively. By 2035, the nexus continues to be stronger, consuming 54.5% and 49% of total biofuel’s water and energy requirement, respectively, and thus first generation biofuels use much more resources in the growing than the refining process. An additional 768.2 million meter cubic of water and 413.4 million kWh of energy are needed for planned biofuel expansion, reallocating water to biofuels in water-scarce regions inherit related problems to other sectors such as increasing water use for the industry, agriculture, and energy sector by 67%, 45%, and 9%, respectively, which could further exacerbate stresses on water and energy supplies in the basin. Biofuel generation rely heavily on energy imports, as it consumes substantially more energy than it produces. Policies should promote the coordinated development of sustainable biofuel programs that are less water intensive with very low inputs of fossil fuels.

1. Introduction

The sustainable management of water and energy resources faces enormous challenges globally in the upcoming decades due to the increasing complexity of dealing with them [1,2,3]. By 2050, global demand for energy will nearly double, while water and food demand is set to increase by over 50% [3]. Sustaining this upswing resource demand has driven the search for efficiency in water and energy sectors conjunctively, given competing needs for limited global resources in the era of climate change reality. The water–energy nexus has received global attention in recent years with a focus on how to balance their trade-offs [4], development agenda [5], interdependence [6], resources governance [7], and integrating one constraint into the other [8]. Proponents of the concept argue that by governing these resources in an integrated manner, problems such as resource scarcity, quality, and human wellbeing will be addressed in a more sustainable way [9]. The Water-Energy Nexus(WEN) captures the interdependency between the two resources, and focuses on the need for water in the Energy supply chain, and on the energy used to collect, clean, move, store, and dispose of water [10,11,12,13].
In the fast developing regions of the world, it is expected that the WEN approach applied to development plans may offer benefits such as increasing energy efficiency, decreasing water pollution, reducing costs of energy, and water delivery. However, WEN studies are few for the fast developing regions of Africa [14], despite well-known water scarcity issues facing 300 million people in sub-Saharan Africa [15,16,17]. The estimated reductions of about 20% in rainfall by 2080 from the current level of 650 mm/yr in the region is expected to exacerbate water, energy, and food insecurity if no action is taken [15,16], with indirect impacts on nutrition, health, sanitation, and water conflicts, among other social challenges.
Recent biofuel trends such as biofuel mandates in the EU [17] and USA [18] have heightened demand for bio-ethanol and biodiesel, thereby further contributing to the increased demand for land in sub-Saharan Africa and Southeast Asia [19]. With large biofuel land deals reported in Zambia, Sudan, Botswana, Namibia Mozambique, and Tanzania [20]. Sugarcane alone in Southern Africa occupies approximately 785,000 hectares (ha), of which more than 40% is irrigated. Several catchments are either closed or rapidly approaching closure [21,22], due to combined effects of resource over-allocation and poor rainfall to runoff conversion ratios sprinkled by high evaporation rates [23]. Several studies [19,20,21] pointed out the importance to take regional-specific characteristics and the multi-dimension approach into consideration when implementing biofuel policies [24].
Prior nexus studies often used WEAP modeling tool, with applications in dozens of basins across more than 170 countries worldwide [25]. Relevant for planning purpose is the model’s ability to simulate climate change impacts on the water supply to different sectors [26,27,28], to optimize allocation priorities [29,30,31], to investigate supply-demand relation [32,33,34] and energy demands [35,36,37], and to conduct environmental assessments [38,39]. The model has enough flexibility to adopt different levels of data availability with a graphical interface, deals with distributed basin demand sites in large spatial scale with supply, and demand internally matched [40,41]. The model is considered to be the most suitable available methods for the nexus analysis at the basin level, due to its robust decision-making support and scenario generation features that govern the nexus [42]. Abdullahi et al. [26] applied the WEAP model and found that climate change will significantly reduce the runoff, and increases evapotranspiration in the Sokoto-Rima river basin in Nigeria; Höllermann et al. [27] revealed that the pressure on water resources will increase, decreasing inflows and groundwater recharge due to climate change aggravate the situation in the Ouémé–Bonou catchment in Benin; Kinoti et al. [31] used the model to balance the water requirements of competing users against the available water resources and found that the use of WEAP improved the complex system of demand-supply of the Ewaso Ng’iro river basin in Kenya. Johannsen et al. [33] used the model and found that climate change shows a significant decrease in available water resources and drastic reduction of irrigated agricultural area is the only solution to guarantee sustainable water use in the Drâa Basin in Morocco; Adgolign et al. [43] used the model and found that there will be 10.3%, reduction in the total annual flow and watersheds will have unmet demands towards the year 2050, but the impact of the existing and planned water resources development on delivery of instream flow requirements and downstream water availability is minimal in the Didessa Sub-Basin in Ethiopia. Despite the model being used to tested various water demand management options in various water-stressed basins in Africa [26,27,29,31,33,43,44], the WEN in these regions like the Tanzania’s Wami Ruvu Basin remains unstudied and the influence of biofuel on water and energy availability and consumption have high levels of uncertainty. It is crucial to quantify the WEN and illustrate its complexities for effective operational and long-term water resource management, governance, and integrated water-energy resources management at the basin scale.
We evaluate WEN in the WRB of Tanzania where a development plan calls for 50% increase in biofuel production by 2025 [45,46]. The capital city of Tanzania, Dodoma as well as commercial and agriculture center of Dar es salaam and Morogoro respectively are located in WRB. In 2013, about 80% of the WRB population lives in urban areas, while 20% in rural areas—in complete opposition to the rest of Tanzania [47].
The aim of the study is to evaluate the WEN based on multi-sector water demands estimated under basin-developed scenarios and how uncoordinated biofuels agriculture impacts the basin’s water resources. The study applied the WEAP model to simulate natural hydrological processes (e.g., evapotranspiration, runoff, and infiltration) and anthropogenic activities superimposed on the natural system to influence water resources and their allocation (i.e., consumptive and non-consumptive water demands) to enable evaluation of the water used for the entire Energy sector and energy used for the entire water use.
Following this introduction, the Materials and Methods part is found in Section 2, whereby, Study area, WEAP model development and input data, Scenario design, Country energy balance and the Water and energy for biofuel has been explained. Section 3 describes the results such as model performance, water and energy for biofuel in 2015, and water and energy for biofuel in 2035 were detailed as well. Section 4 includes discussion on resource security in the context of nexus, resource footprints management, and mitigation strategy in the nexus systems. Section 5 gives the general conclusion and some recommendations for future research. The conclusion shows the implications of the findings for the region and the world where multiscale biofuel expansion projects are being considered in various basins.

2. Materials and Methods

2.1. Study Area

Wami Ruvu Basin is located to the eastern part of Tanzania, which lies between Longitudes 35°30′00″ to 40°00′00″ E and Latitudes 05°00′00″ to 07°30′00″ S in the Eastern side of Tanzania, Figure 1. The area of the Wami Catchment is 43,742 km2 and the total length of the Wami River is approximately 637 km. The area of the Ruvu Catchment is 11,789 km2 and the total length of the Ruvu River is approximately 316 km. The basin area is the home of two estuaries, two national parks (Mikumi and Saadani), and two forest reserves. The Wami and Ruvu rivers are managed by the Wami-Ruvu Basin Water Office (WRBWO).

2.2. Model Development and Input Data

As inputs to the model, climatic, hydrological, biophysical, and management data were collected from different sources and archives such as Wami Ruvu basin Water Atlas developed by Florida International University (FIU) [48], Integrated Water, Sanitation and Hygiene (iWASH) Program [49], and Global Water for Sustainability Program [50]. Sectorial water consumption (e.g., agriculture, domestic, industrial, energy, etc.), groundwater extraction, hydro-climate, and meteorological data (e.g., stream flows, temperature, precipitations, and rainfall) from various gauges were obtained from WRBWO’s inventory.
The WEAP model was chosen because it is user-friendly, well documented, has enough flexibility to adopt different levels of data availability with a friendly graphical user interface, and has the advantage in dealing with distributed basin demand sites on a large spatial scale. The WEAP model was used to simulate natural hydrological processes (e.g., evapotranspiration, runoff, and infiltration) and anthropogenic activities such as agriculture and their water allocations between upstream and downstream users. Due to the high degree of interactions between water and energy related sectors, flow records at 1G1, 1HA8A, and 1H8, with 6%, 27%, and 26% missing data, respectively, were chosen to simulate demand and supply options. The gaps in the data were filled using the linear interpolation between the previous and next (non-missing) values.
The water system was characterized by: water demand sites, reservoir, flow gauging station, and river head flows. The study area boundaries were used to describe the spatial location of the water system. The demand site, reservoirs and catchments sources were represented with nodes. These nodes were linked to the Wami and Ruvu rivers through transmission links and return flow links. The demand is the product of total activity level and sectorial water user rates. The demand site nodes were created in the schematic view at relative positions, Figure 1. The demands were then named accordingly and demand priority set. Flow data for the year 2015 were used to create the current account (representing the system as it currently exists) in WEAP for scenario analysis.
After model construction and sectorial demand computation, the model performances were assessed using Nash and Sutcliffe coefficient, E, and Pearson’s square method, R2. The model interpolated (assign input time series for each WEAP catchment object for the climate data) inputs and created parameters (GDP growth, industrial growth, urbanization rate, population growth, and irrigation efficiency) for the entire simulation period. Monthly inflow data of 1955–1980 at the 1H8 (Ruvu river), 1G1 (Wami river) and at the 1HA8A (Ngerengere Catchment) gauging stations were used in simulating the flows for the 2016–2035 period. The model was run on a monthly time step (12 time steps per year), giving both E > 50 % and R 2 > 50 % , which is the acceptable hydrological model performance. The current accounts year is set to be 2015, and then the model was run from the year 2016, beginning of projection to year 2035, and end of simulation by introducing three different set of scenarios.

2.3. Scenarios Design

An analysis of global datasets reveals a statistically significant relationship between water availability and per capita GDP [51,52]. The water-energy trade-offs to be tested using different water-centric scenarios, which is based on GDP growth rates.
For Scenario 1, the current GDP growth 6% and uncoordinated water management practices continue, neither water resources allocation nor priority setting between downstream and upstream water users are in place.
In Scenario 2, resource use management practices were in place, efficiency for water (drip irrigation, sprinkles, etc., 15–30%) and energy (pump efficiencies, 40–75%) were applied, then the biofuel demand was kept constant, only the population growth, GDP growth, industrial growth and urbanization rate were raised to 6%, 8%, 11%, and 85%, respectively, due to expected transformation to middle income countries.
In Scenario 3, energy intensifications (thermal + renewables energy deployments) accompanying with biofuel expansion were examined. The irrigated biofuel land was doubled whereby population growth, GDP growth, industrial growth, and urbanization rate were raised to 8%, 10%, 16%, and 90%, respectively, due to the expected socioeconomic development.

2.4. Country’s Energy Balance

The most important measure in the energy balance of Tanzania is the total consumption of 5.7 × 10⁹ kWh of electric energy per year. The balance is dominated by biomass-based fuels, constitutes 88% (5.02 × 10⁹ kWh) of total energy consumption [53]. Commercial energy sources such as oil, gas, electricity, and coal, as well as non-biomass renewable energy, account for the remaining 12% (0.68 × 10⁹ kWh), [54], Figure 2. The country has very low levels of electricity consumption per capita (100 kWh per person per year), far much less than the global average consumption of 2000 kWh per annum and average consumption in developing countries such as Sub-Saharan African of 552 kWh per annum [55].

2.5. Water and Energy for Biofuel

The estimates in Table 1 and Table 2 are for three major estates in the Wami, Ruvu, and Coast catchment). The study consider water withdraw (from well or surface) as a measure of water use since they are continually metered by authority. Figure S1 in the Supplementary Materials show the relative position for all biofuel projects in the basin. First-generation biofuels are presently available biofuels produced using conventional technology, i.e., fermentation of carbohydrates into ethanol, and extracting and processing oil from oil crops into biodiesel [56]. Crops that are common used as biofuel feedstocks in Africa includes jatropha, oil palm, sugar cane, oil seeds, and sorghum [57]. Sugarcane is regarded as the main feedstock for the production of biofuel and considered in this study.
Energy intensity values for surface water and groundwater extraction in Table 1 and Table 2 were adopted from Wakeel et al. [58] since there is no country specific data, while waste water and recycled water treatment based on widely used technologies in Africa such as lagoon ponds and trickling filter—as reported by Wang et al. [59] and Paul et al. [12].

3. Results

3.1. Model Performance

The model calibrated using the streamflow data monitored during the time period from 2005 to 2015, which contained both drier and wetter years. The sensitive analysis was used to determine the best value for some specific parameters. The model performances using the Nash-Sutcliffe Efficiency, E, and Coefficient of determination, R2 [60], are calculated using Equations (1) and (2);
E = 1.0 i = 1 N ( Q o i Q s i ) 2 i = 1 N ( Q o i Q ˜ ) 2
R 2 = i = 1 N ( Q O i Q ˜ o i ) 2 i = 1 N ( Q s i Q ˜ s i ) 2 i = 1 N ( Q o i Q ˜ O i ) 2
where Q o i i s the observed streamflow (m3/s), Q s i   i s the simulated streamflow (m3/s), Q ˜   i s the average streamflow (m3/s), and N is the total number of observations.
Equations (1) and (2) above indicated that performances at Wami River during calibration (E = 0.69, R2 = 0.74) and validation (E = 0.63, R2 = 0.78) and Ruvu River during calibration (E = 0.80, R2 = 0.86) and validation (E = 0.79, R2 = 0.88) were all satisfactory and acceptable model performances, (see Figures S2 and S3 in the Supplementary Materials).

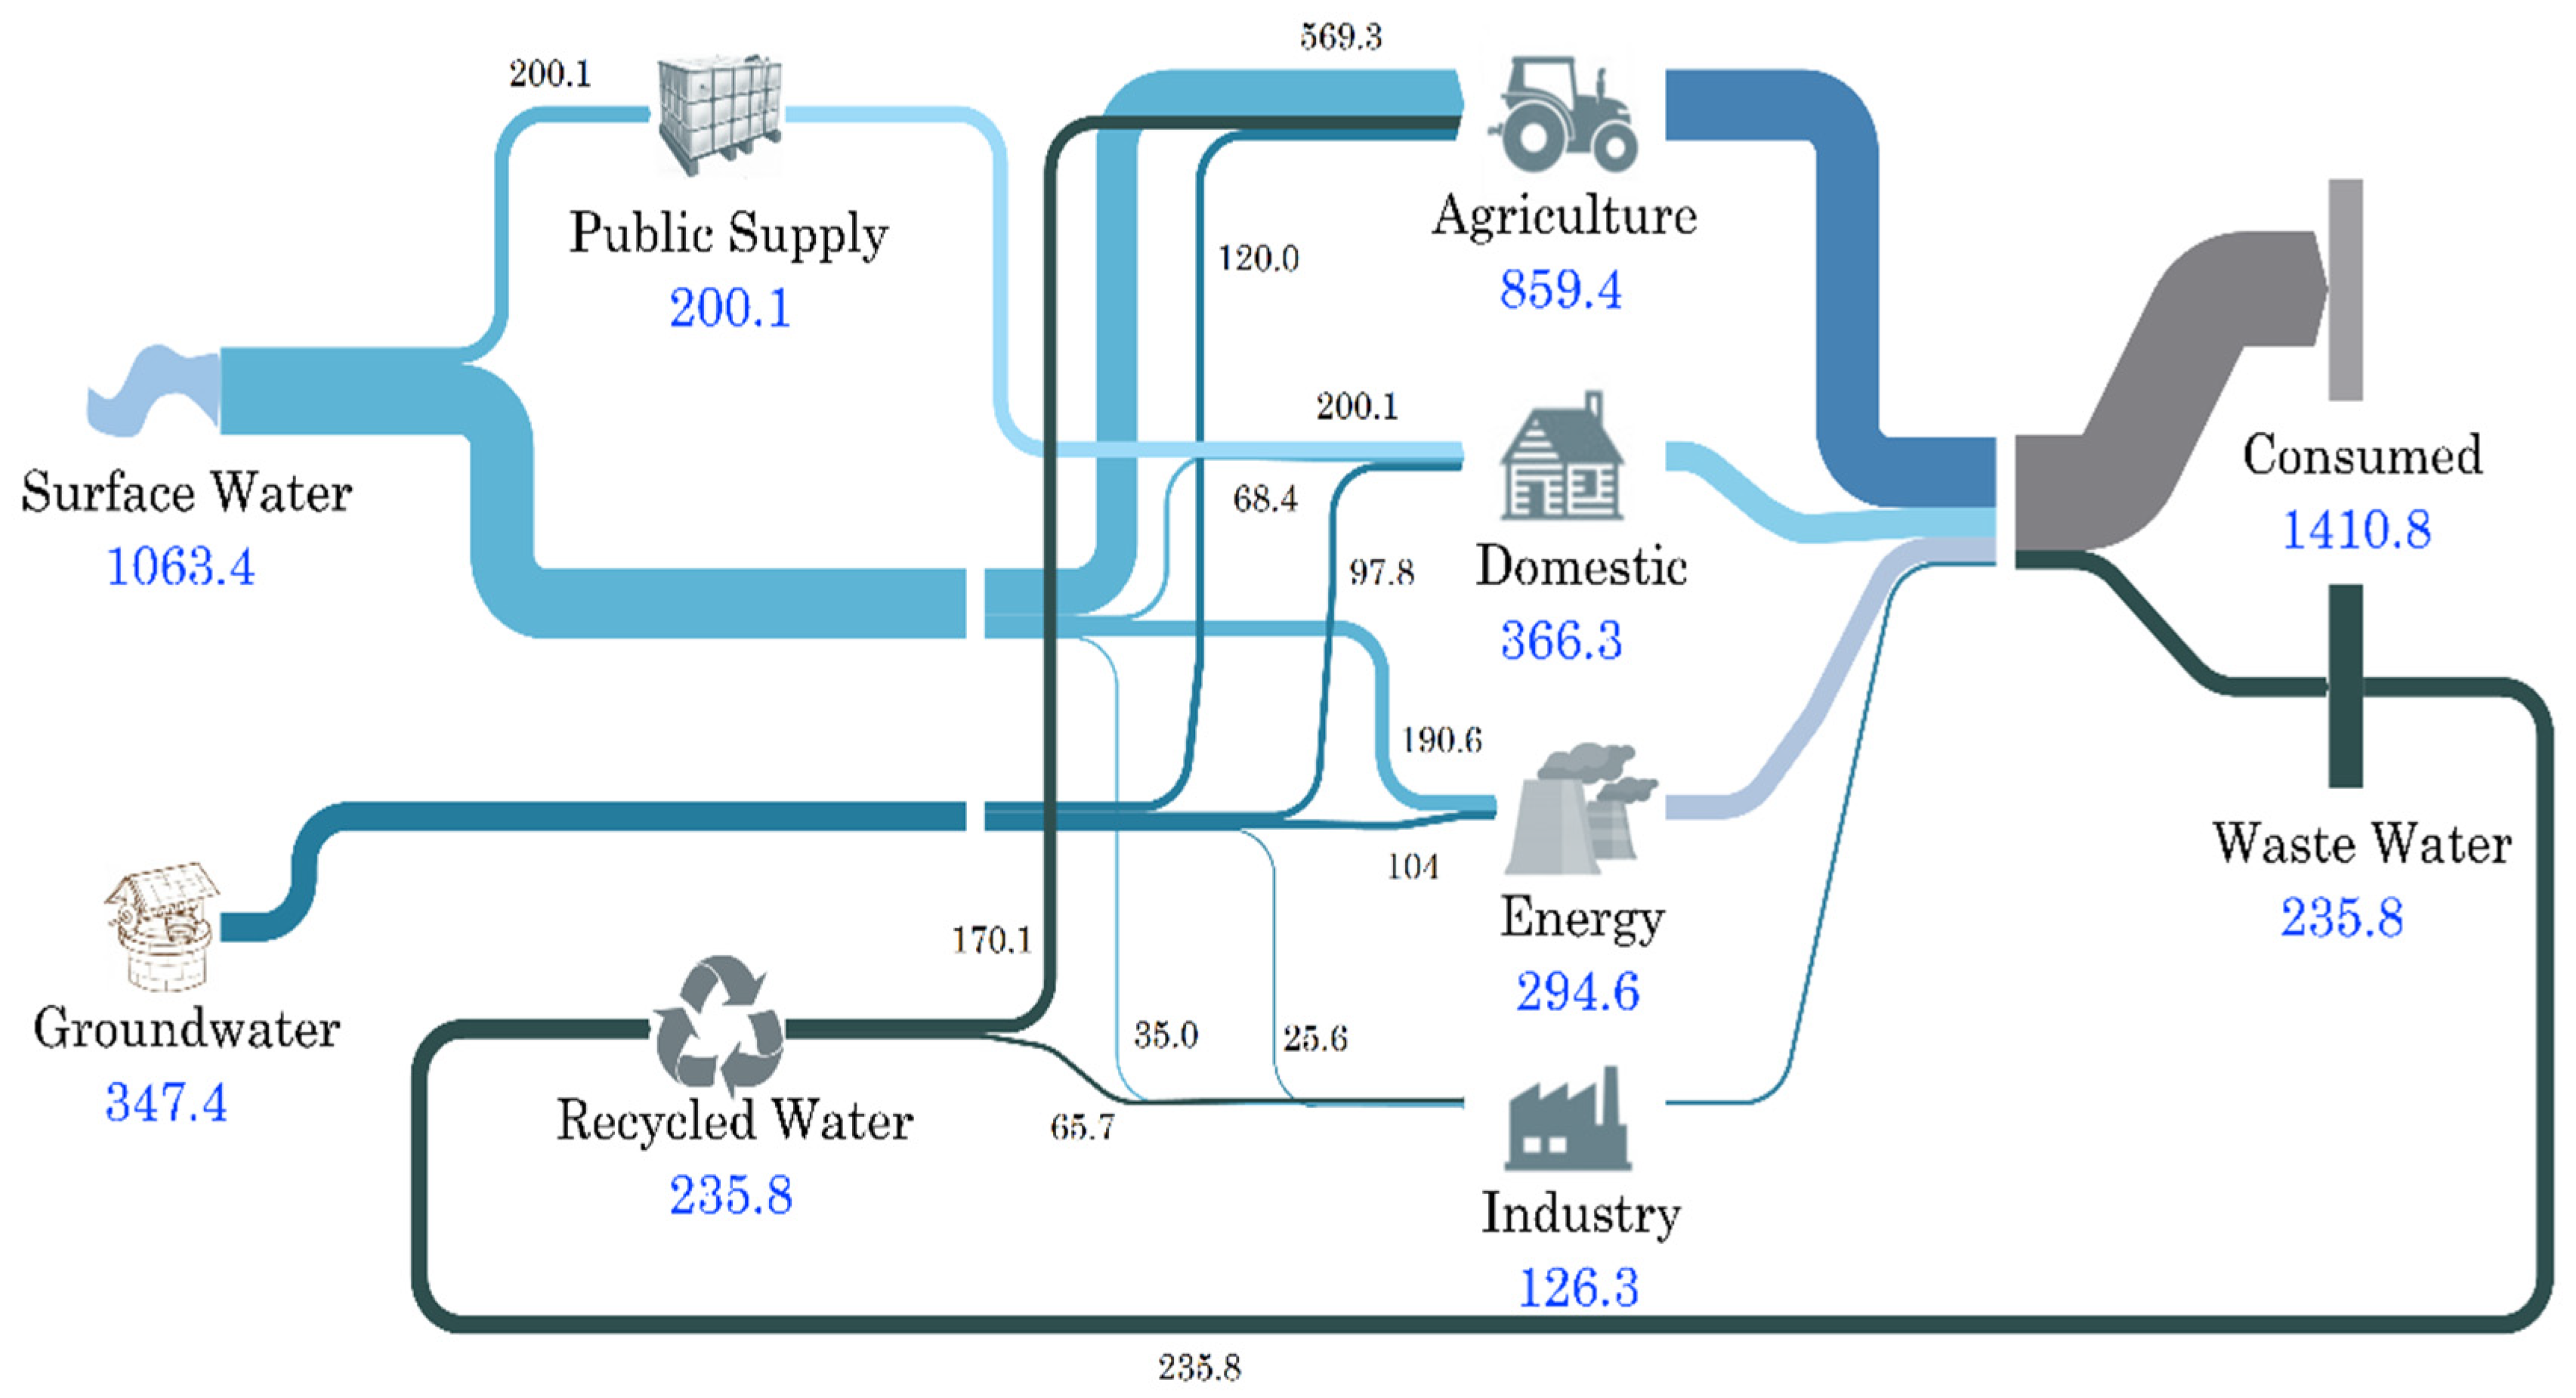
3.2. Water and Energy for Biofuel in 2015

The agricultural sector accounts for 61% of total water consumed in the basin and biofuel irrigation constitutes 29% (251.9 × 10⁶ m3) of agricultural water use. Biofuel consumes 35% (104 × 106 m3) of total water use in the energy sector to process bagasse in the energy (electricity and heat) production in the manufacture of ethanol. The industrial processes in the estates use 8% (10.5 × 10⁶ m3) of total water in the industry sector (Figure 3, Table 1, and Table S1). The WEN is much stronger in the biofuel irrigation sector consuming 69.3% and 61% of water and energy, respectively, thus biofuel use much more resources in the growing than the refining process (Table 1).

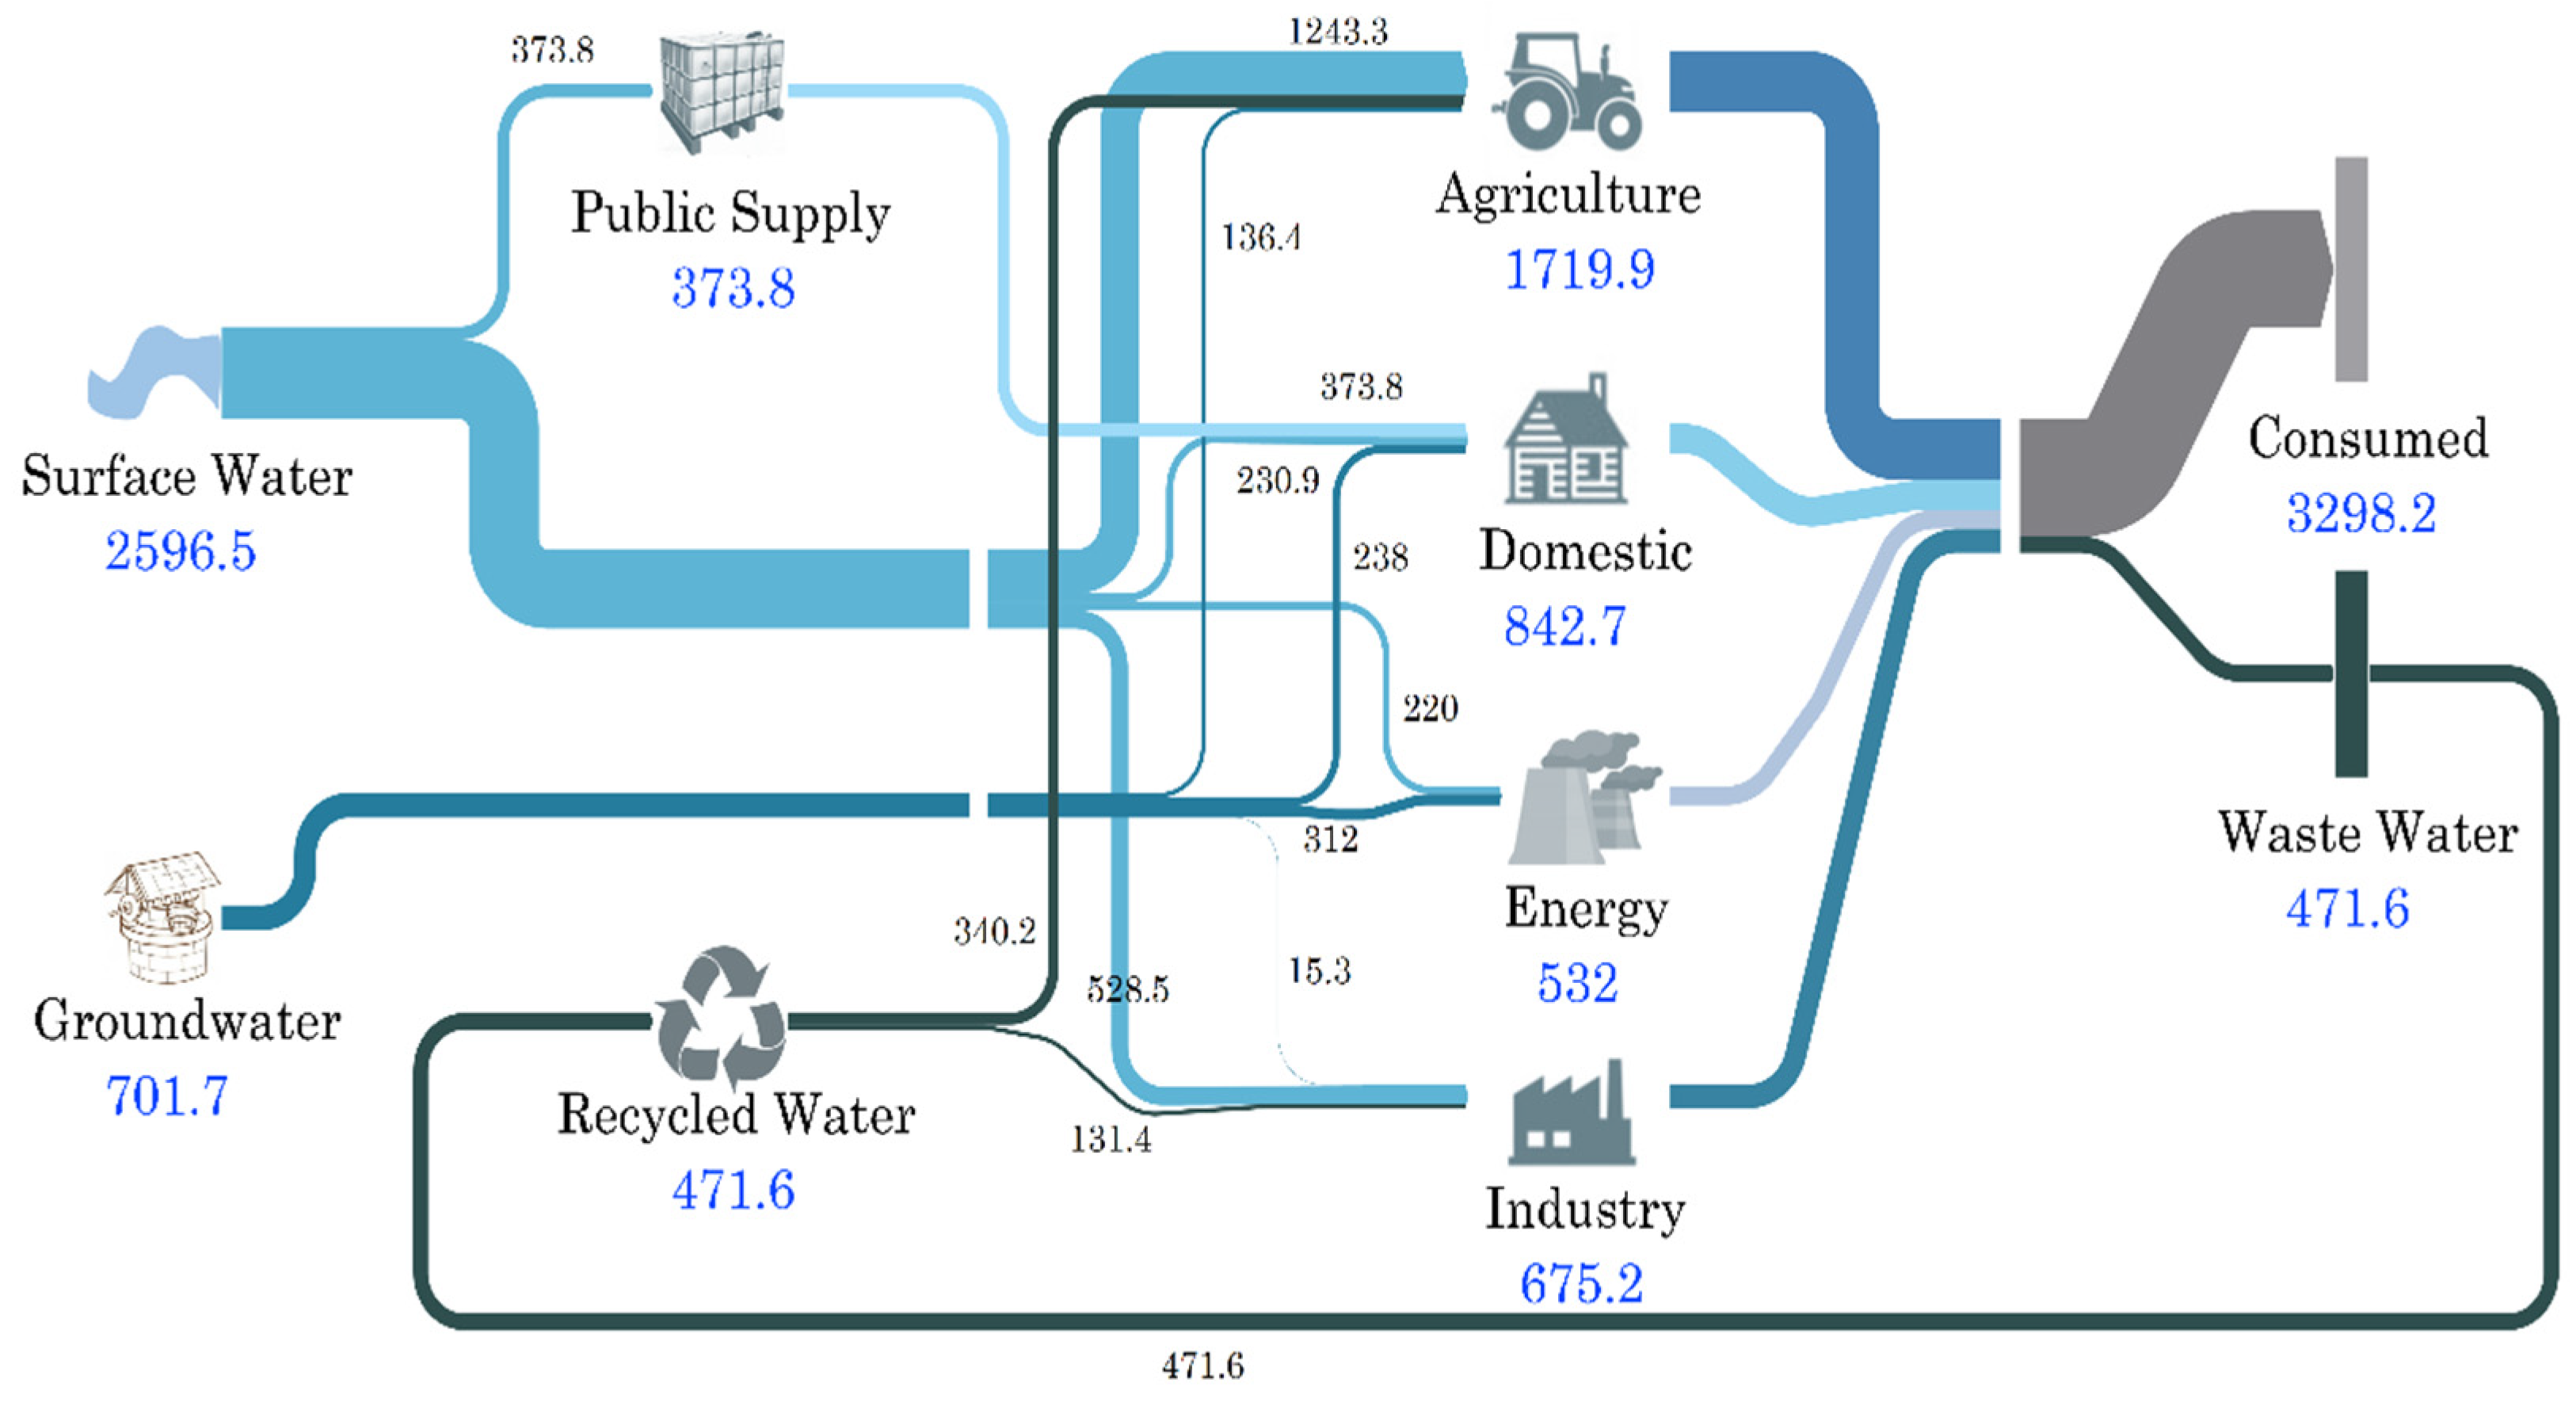
3.3. Water and Energy for Biofuel in 2035

3.3.1. With Biofuel Expansion

If the GDP turns to double digit (e.g., 10% growth) then the projected water needed for biofuel will be two times higher, additional 768.2 × 10⁶ m3 of water needed to accommodate the expansion. The energy needed for biofuel will grow by two-fold with additional 413.4 × 10⁶ kWh needed for water extraction, recycling, and wastewater treatment (Table 2).
In this scenario biofuel irrigation share 36% (621.6 × 10⁶ m3) of the total agricultural water use and will consume 57% (312 × 106 m3) of total water use in the energy sector to process bagasse into energy. Industrial water use for biofuel will increase from 8% (2015) to 12% (81 × 106 m3) in 2035 (Figure 4, Table 2 and Table S1). The WEN continue to be stronger in the biofuel irrigation sector consuming 54.5% and 49% of water and energy, respectively, thus biofuel use much more resources in the growing than the refining process (Table 2).

3.3.2. Without Biofuel Expansion

Implementing resource use management practices without altering biofuel demand and resource efficiency for water (e.g., drip irrigation, sprinkles, etc.) being in place. With GDP growth 8%, the basin’s water use for industry, agriculture, and energy will decline by 67%, 45%, and 9%, respectively (see Table S1 in the Supplementary Materials). Thus, water resources for industry, agriculture, and energy are becoming increasingly scarce in the basin as a result of increased competition with biofuel expansion.
Table 1 and Table 2 shows that there is interdependence between water for biofuel and energy needed to support biofuels. Currently, biofuel consume 205.18 × 10⁶ kWh, producing 138.1 × 10⁶ kWh and will consume 618.6 × 10⁶ kWh, to produce 290 × 106 kWh by 2035 (see Table S2 in the Supplementary Materials). This makes biofuel heavily rely on energy imports. Thus, it only provides a small benefit over fossil fuels in regards to greenhouse gases since they still require high amounts of energy to grow and process.
The current energy generation potential from excess bagasse in sugar mills is about 138.1 × 10⁶ kWh per year that is 2.4% of the national electricity generation. By 2035, estimated potential from excess bagasse will be more than 290 × 106 kWh per year, which is 5.1% of the national electricity generation (see Table S2 in the Supplementary Materials). The biofuel is yet to replace the fossil fuel in the main grid system. The sugar and ethanol produced are only used for the domestic market.

4. Discussion

4.1. Resource Security in the Context of the Nexus

The impacts of biofuels on water resources can be mitigated by infrastructure expansion and allocation priority between upstream and downstream water users, which reduces surface water influence over total water abstraction and hence balance WEN trade-offs. Water use by the Energy sector is directly proportional to the water use for the biofuel irrigation that is related by efficient technologies in place. Despite the rapid sectorial growth, the nexus consumption trends are better saved under Scenario 2 (resource use efficiency) than under any other scenario. Mainly because high amounts of water savings are derived from technological advances and improved pumps efficiencies in the large irrigation areas that impacts a basin’s water demand growth.

4.2. Resource Footprints Management

The current water and energy conservation measures in several basins in the developing regions such as Africa (e.g., Sokoto Rima River basin, Didessa Sub-basin, Mara River Basin, Niger River Basin, etc.) have largely focused water-efficient systems such as pressurized irrigations, which are more energy intensive [61]. Water and energy conservation can both be more effectively achieved by focusing on biofuel irrigation and its related sectors (e.g., water extraction) as well as improving pump efficiencies. Most water consumption occurs during the irrigation activities, which produce the biofuel feedstocks. Thus increasing global WEN productivity means decreasing the resource footprints for water, as well as mitigating their impacts on water resources.

4.3. Mitigation Strategies in the Nexus Systems

The demand surge of water and energy resources in basin areas can be mitigated by focusing on two major sectors, irrigation and surface water conveyance as both have major shares in most of the river basins in Nigeria, Ethiopia, Kenya, Morocco, Niger etc. The increase of agricultural withdrawal is due to rapid population, high urbanization and industrial demand. This has caused rising withdrawal to support livestock, crop-specific irrigation needs and energy (electrification) drive on the other hand. Meeting this rising demand could increase global water withdrawals in the energy sector by 20%, and water consumption in the sector by 85%, as indicated in the World Bank [2] and IRENA [3] reports. If water supply is reallocated to biofuels in water-scarce regions, this will pressure the other sectors that require it, which could inherit related problems. Thus, it is so important to optimize the freshwater efficiency of energy production as well as energy efficiency of water management, treatments, and distribution.

5. Conclusions

This study answers an important question on how to balance the resources tradeoffs by promoting coordinated development and why the water basins found in semi-arid regions such as West Africa, East Africa, Southern Africa, and South Asian countries should not apply freshwater resources to the production of Energy crops unless water energy nexus has been considered.
The nexus synergies and trade-offs should be balanced by the fact that, quantity of the water required for different energy production varies significantly according to the region, process, and technology of energy production, from rather negligible quantities of water used for solar and wind power generation to vast water use for biofuel irrigation, processing and production. For example, oil palms in Indonesia, Malaysia, and sugarcane in Brazil are grown in large quantities without irrigation due to the fact that the tropical lands they are grown on receive abundant rains, contrary to semi-arid regions such as WRB where sugar cane for ethanol is grown under irrigated conditions and water availability is a constraint.
First generation biofuels symbolize a step forward in energy independence and get-off fossil fuels for energy demands. These biofuels also support agricultural industries and rural communities through increased demand for crops production. That being said, first-generation biofuels, unlike second and third generation biofuels, they are extremely water intensive, requires lots of land to grow, compete with food crops over arable land in some parts of the world and still require high amounts of energy to grow, collect, and process.
Rapid increase of biofuel production could cause other environmental concerns in the basin such as water stress due to rapid population growth and abrupt increase in consumption. This study could be instructive to other regions facing similar problems. Highly urbanized, densely populated, loss of biodiversity, and freshwater scarcity regions share the concern that energy sector may scramble water resources with other sectors. Meanwhile, increase in energy production, water resources overexploitation as the global facts may have the trickle down effects on basin water budgets worldwide. Rational development policies and well-designed management practices are needed to ensure sustainable development of biofuels in this regard.
The analysis of nexus systems in the semi-arid basins is challenged by huge gaps in available data, inadequate water and energy utilities data that impedes careful nexus plans. These data are useful for a close examination of the nexus components and deserves increased attention in a world of growing scarcities to ensure optimal resource allocation to sustain living standards and preserve the environment.

Supplementary Materials

The following are available online at https://www.mdpi.com/2071-1050/11/11/3109/s1, Figure S1. Spatial distribution of biofuel projects; Figure S2. Calibration and validation hydrographs at (a) 1G1, Wami River (b) 1HA8A, Ruvu River; Figure S3. Calibration and validation scatter plots at (a) 1G1, Wami River (b) 1HA8A, Ruvu River; Table S1. Sectorial water use per scenario; Table S2. Biofuel generation in the Wami Ruvu Basin.

Author Contributions

Formal analysis, M.M.; Methodology, M.M. and X.L.; Resources, J.L.; Supervision, C.Z.; Visualization, X.L.; Writing–original draft, M.M.; Writing–review & editing, J.L.

Funding

This study was supported by the National Key Research and Development Program (No.2016YFE0102400) of the Ministry of Science and Technology of China.

Acknowledgments

The authors acknowledge the support provided by the WRBWO officials, Niqbar Ally and Pascal Qutaw, and Ally Mgelwa of the University of Dodoma. The authors thank the anonymous reviewers for their helpful comments.

Conflicts of Interest

The authors declare no conflict of interest.

Abbreviations

kWh, kilowatt hour; m3, meter cubic.

References

  1. IEA. Water for Energy: Is energy becoming a thirstier resource. In World Energy Outlook; IEA: Paris, France, 2012; pp. 1–33. [Google Scholar]
  2. Rodriguez, D.J.; Delgado, A.; DeLaquil, P.; Sohns, A. Thirsty Energy; World Bank: Washington, DC, USA, 2013. [Google Scholar]
  3. IRENA. Renewable Energy in the Water, Energy and Food Nexus; International Renewable Energy Agency: Abu Dhabi, UAE, 2015; pp. 1–125. [Google Scholar]
  4. Zhang, X.; Vesselinov, V.V. Energy-water nexus: Balancing the tradeoffs between two-level decision makers. Appl. Energy 2016, 183, 77–87. [Google Scholar] [CrossRef]
  5. Yumkella, K.K.; Yillia, P.T. Framing the Water-energy Nexus for the Post-2015 Development Agenda. Aquat. Procedia 2015, 5, 8–12. [Google Scholar] [CrossRef] [Green Version]
  6. Tan, C.; Zhi, Q. The Energy-Water Nexus: A literature Review of the Dependence of Energy on Water. Energy Procedia 2016, 88, 277–284. [Google Scholar] [CrossRef]
  7. Hagemann, N.; Kirschke, S. Key Issues of Interdisciplinary NEXUS Governance Analyses: Lessons Learned from Research on Integrated Water Resources Management. Resources 2017, 6, 9. [Google Scholar] [CrossRef]
  8. DeNooyer, T.A.; Peschel, J.M.; Zhang, Z.; Stillwell, A.S. Integrating water resources and power generation: The energy-water nexus in Illinois. Appl. Energy 2016, 162, 363–371. [Google Scholar] [CrossRef]
  9. Scanlon, B.R.; Ruddell, B.L.; Reed, P.M.; Hook, R.I.; Zheng, C.; Tidwell, V.C.; Siebert, S. The food-energy-water nexus: Transforming science for society. Water Resour. Res. 2017, 53, 3550–3556. [Google Scholar] [CrossRef]
  10. Hoff, H. Understanding the Nexus. In Background Paper for the Bonn2011 Nexus Conference; Stockholm Environment Institute: Stockholm, Sweden, 2011; pp. 1–52. [Google Scholar]
  11. Lee, M.; Keller, A.A.; Chiang, P.C.; Den, W.; Wang, H.; Hou, C.H.; Wu, J.; Wang, X.; Yan, J. Water-energy nexus for urban water systems: A comparative review on energy intensity and environmental impacts in relation to global water risks. Appl. Energy 2017, 205, 589–601. [Google Scholar] [CrossRef] [Green Version]
  12. Paul, R.; Kenway, S.; Mukheibir, P. How scale and technology influence the energy intensity of water recycling systems—An Analytical Review. J. Clean. Prod. 2018. [Google Scholar] [CrossRef]
  13. Plappally, A.K.; Lienhard, V.J.H. Energy requirements for water production, treatment, end use, reclamation, and disposal. Renew. Sustain. Energy Rev. 2012, 16, 4818–4848. [Google Scholar] [CrossRef]
  14. Endo, A.; Tsurita, I.; Burnett, K.; Orencio, P.M. A review of the current state of research on the water, energy, and food nexus. J. Hydrol. Reg. Stud. 2017, 11, 20–30. [Google Scholar] [CrossRef] [Green Version]
  15. Thurlow, J.; Dalin, C.; Krueger, T.; Zhu, T.; Osborn, T.; Ringler, C.; Conway, D.; Dorling, S.; van Garderen, E.A.; Landman, W.; et al. Climate and southern Africa’s water–energy–food nexus. Nat. Clim. Chang. 2015, 5, 837–846. [Google Scholar]
  16. Mpandeli, S.; Naidoo, D.; Mabhaudhi, T.; Nhemachena, C.; Nhamo, L.; Liphadzi, S.; Hlahla, S.; Modi, A.T. Climate change adaptation through the water-energy-food nexus in Southern Africa. Int. J. Environ. Res. Public Health 2018, 15, 2306. [Google Scholar] [CrossRef] [PubMed]
  17. Schuenemann, F.; Kerr, W.A. European union non-tariff barriers to imports of African biofuels. Agrekon 2019, 1–19. [Google Scholar] [CrossRef]
  18. Thompson, W.; Johansson, R.; Meyer, S.; Whistance, J. The US biofuel mandate as a substitute for carbon cap-and-trade. Energy Policy 2018, 113, 368–375. [Google Scholar] [CrossRef]
  19. Chiarelli, D.D.; Davis, K.F.; Rulli, M.C.; D’Odorico, P. Climate change and large-scale land acquisitions in Africa: Quantifying the future impact on acquired water resources. Adv. Water Resour. 2016, 94, 231–237. [Google Scholar] [CrossRef] [Green Version]
  20. Kiggundu, N.; Arhin, S.G.; Banadda, N.; Kabenge, I. Impacts of Biofuel Policies on Welfare and Food Security: Assessing the Socioeconomic and Environmental Trade-offs in Sub-Saharan Africa. Int. J. Renew. Energy Res. 2017, 7, 2162–2171. [Google Scholar]
  21. Ngcobo, S.; Jewitt, G. Multiscale drivers of sugarcane expansion and impacts on water resources in Southern Africa. Environ. Dev. 2019, 24, 63–76. [Google Scholar] [CrossRef]
  22. Serdeczny, O.; Adams, S.; Baarsch, F.; Coumou, D.; Robinson, A.; Hare, W.; Schaeffer, M.; Perrette, M.; Reinhardt, J. Climate change impacts in Sub-Saharan Africa: From physical changes to their social repercussions. Reg. Environ. Chang. 2017, 17, 1585–1600. [Google Scholar] [CrossRef]
  23. Rodell, M.; Famiglietti, J.S.; Wiese, D.N.; Reager, J.T.; Beaudoing, H.K. Emerging trends in global freshwater availability. Nature 2018, 557, 651. [Google Scholar] [CrossRef]
  24. McClain, M.E. Balancing water resources development and environmental sustainability in Africa: A review of recent research findings and applications. Ambio 2013, 42, 549–565. [Google Scholar] [CrossRef]
  25. Stockholm Environment Institute (SEI). U.S.C. Water Evaluation and Planning System. In Weap; SEI: Boston, MA, USA, 2015; pp. 1–202. [Google Scholar]
  26. Abdullahi, S.A.; Muhammad, M.M.; Adeogun, B.K.; Mohammed, I.U. Assessment of water availability in the Sokoto Rima River Basin. Sci. Acad. Publ. 2014, 4, 220–233. [Google Scholar]
  27. Höllermann, B.; Giertz, S.; Diekkrüger, B. Benin 2025-Balancing Future Water Availability and Demand Using the WEAP “Water Evaluation and Planning” System. Water Resour. Manag. 2010, 24, 3591–3613. [Google Scholar] [CrossRef]
  28. Santikayasa, I.P.; Babel, M.S.; Shrestha, S.; Jourdain, D.; Clemente, R.S. Evaluation of water use sustainability under future climate and irrigation management scenarios in Citarum River Basin, Indonesia. Int. J. Sustain. Dev. World Ecol. 2014, 21, 181–194. [Google Scholar] [CrossRef]
  29. Mounir, Z.M.; Ma, C.M.; Amadou, I. Application of water evaluation and planning (WEAP): A model to assess future water demands in the Niger River (in Niger Republic). Mod. Appl. Sci. 2011, 5, 38–49. [Google Scholar] [CrossRef]
  30. Mohd Firdaus Hum, N.N.; Abdul Talib, S. Modeling water supply and demand for effective water management allocation in Selangor. J. Teknol. 2016, 78, 15–20. [Google Scholar] [CrossRef]
  31. Mutiga, J.K.; Mavengano, S.T.; Zhongbo, S.; Woldai, T.; Becht, R. Water Allocation as a Planning Tool to Minimise Water Use Conflicts in the Upper Ewaso Ng’iro North Basin, Kenya. Water Resour. Manag. 2010, 24, 3939–3959. [Google Scholar] [CrossRef]
  32. Raskina, P.; Hansen, E.; Zhu, Z.; Stavisky, D. Simulation of water supply and demand in the Aral Sea region. Water Int. 1992, 17, 55–67. [Google Scholar] [CrossRef]
  33. Johannsen, I.; Hengst, J.; Goll, A.; Höllermann, B.; Diekkrüger, B. Future of Water Supply and Demand in the Middle Drâa Valley, Morocco, under Climate and Land Use Change. Water 2016, 8, 313. [Google Scholar] [CrossRef]
  34. Mourad, K.A.; Alshihabi, O. Assessment of future Syrian water resources supply and demand by the WEAP model. Hydrol. Sci. J. 2016, 61, 393–401. [Google Scholar] [CrossRef]
  35. Ospina-Noreña, J.E.; Gay-García, C.; Conde, A.C.; Sánchez-Torres Esqueda, G. Water availability as a limiting factor and optimization of hydropower generation as an adaptation strategy to climate change in the Sinú-Caribe river basin. Atmosfera 2011, 24, 203–220. [Google Scholar]
  36. Sattler, S.; MacKnick, J.; Yates, D.; Flores-Lopez, F.; Lopez, A.; Rogers, J. Linking electricity and water models to assess electricity choices at water-relevant scales. Environ. Res. Lett. 2012, 7, 045804. [Google Scholar] [CrossRef]
  37. Flores-López, F.; Yates, D. A water system model for exploring electric energy alternatives in southeastern US basins. Environ. Res. Lett. 2013, 8, 035041. [Google Scholar] [CrossRef] [Green Version]
  38. Flores-lópez, F.; Galaitsi, S.E.; Escobar, M.; Purkey, D. Modeling of Andean Páramo Ecosystems’ Hydrological Response to Environmental Change. Water 2016, 8, 94. [Google Scholar] [CrossRef]
  39. Gao, J.; Christensen, P.; Li, W. Application of the WEAP model in strategic environmental assessment: Experiences from a case study in an arid/semi-arid area in China. J. Environ. Manag. 2017, 198, 363–371. [Google Scholar] [CrossRef] [PubMed] [Green Version]
  40. Stockholm Environment Institute. WEAP-TUTORIAL Water Evaluation and Planning System. In Weap; Stockholm Environment Institute: Boston, MA, USA, 2016; p. 286. [Google Scholar]
  41. Purkey, D.; Galbraith, H.; Huber-Lee, A.; Sieber, J.; Yates, D. WEAP21—A Demand-, Priority-, and Preference-Driven Water Planning Model. Water Int. 2009, 30, 501–512. [Google Scholar]
  42. Dai, J.; Wu, S.; Han, G.; Weinberg, J.; Xie, X.; Wu, X.; Song, X.; Jia, B.; Xue, W.; Yang, Q. Water-energy nexus: A review of methods and tools for macro-assessment. Appl. Energy 2017, 210, 393–408. [Google Scholar] [CrossRef]
  43. Adgolign, T.B.; Rao, G.V.R.S.; Abbulu, Y. WEAP modeling of surface water resources allocation in Didessa Sub-Basin, West Ethiopia. Sustain. Water Resour. Manag. 2016, 2, 55–70. [Google Scholar] [CrossRef]
  44. George, O.; Metobwa, M.; Mourad, K.A.; Ribbe, L. Water Demand Simulation Using WEAP 21: A Case Study of the Mara River Basin, Kenya. Int. J. Nat. Resour. Ecol. Manag. 2018, 3, 9–18. [Google Scholar]
  45. Mshandete, A.M. Biofuels in Tanzania: Small Scale Producers and Sustainable Environmental Management; Land Rights Research & Resources Institute (HAKIARDHI): Dar es salaam, Tanzania, 2013. [Google Scholar]
  46. Habib-Mintz, N. Biofuel investment in Tanzania: Omissions in implementation. Energy Policy 2010, 38, 3985–3997. [Google Scholar] [CrossRef]
  47. Melesse, A.M.; Abtew, W.; Setegn, S.G. Nile River Basin: Ecohydrological Challenges, Climate Change and Hydropolitics; Springer International Publishing: Cham, Switzerland, 2013; pp. 1–718. [Google Scholar]
  48. Saha, A.; Donoso, M.; Mohamed, A.; Masikini, R.; Abbott, V.; Anderson, E. Water Atlas of the Wami/Ruvu Basin, Tanzania; Florida International University: Miami, FL, USA, 2014. [Google Scholar]
  49. GLOWS-FIU. Socioeconomic Conditions and links to Freshwater Ecosystem Services of the Ruvu River Basin, Tanzania; Global Water Sustainability Program: Morogoro, Tanznia, 2013; p. 38. [Google Scholar]
  50. GLOWS-FIU. Climate, Forest Cover, and Water Resources Vulnerability Wami/Ruvu Basin, Tanzania; GLOWS-FIU: Morogoro, Tanzania, 2014. [Google Scholar]
  51. Brown, C.; Lall, U. Water and economic development: The role of variability and a framework for resilience. Nat. Resour. Forum 2006, 30, 306–317. [Google Scholar] [CrossRef]
  52. Brown, C.; Meeks, R.; Hunu, K.; Yu, W. Hydroclimate risk to economic growth in sub-Saharan Africa Hydroclimate risk to economic growth in sub-Saharan Africa. Clim. Chang. 2011, 106, 621–647. [Google Scholar] [CrossRef]
  53. Kichonge, B.; John, G.R.; Mkilaha, I.S.N.; Hameer, S. Modelling of Future Energy Demand for Tanzania. J. Energy Technol. Policy 2014, 4, 16–32. [Google Scholar]
  54. Kitonga, J.F.; Bonafe, E. Tanzanian Energy Sector under the Universal Principles of under the Universal Principles of the Energy Charter; The European Union: Brussel, Belgium, 2015. [Google Scholar]
  55. Nyari, E.A.; Pogrebnaya, T.; Wilson, L. Energy sector and solar energy potential in Tanzania. International Journal of Emerging Technologies and Engineering (IJETE) 2015, 2, 143–149. [Google Scholar]
  56. Gerbens-Leenes, W.; Hoekstra, A.Y.; van der Meer, T.H. The water footprint of bioenergy. Proc. Natl. Acad. Sci. USA 2009, 106, 10219–10223. [Google Scholar] [CrossRef] [PubMed] [Green Version]
  57. Amigun, B.; Kaviti, J.; Stafford, W. Biofuels and sustainability in Africa. Renew. Sustain. Energy Rev. 2011, 15, 1360–1372. [Google Scholar] [CrossRef]
  58. Wakeel, M.; Chen, B.; Hayat, T.; Alsaedi, A.; Ahmad, B. Energy consumption for water use cycles in different countries: A review. Appl. Energy 2016, 178, 868–885. [Google Scholar] [CrossRef]
  59. Wang, H.; Yang, Y.; Keller, A.A.; Li, X.; Feng, S.; Dong, Y.N.; Li, F. Comparative analysis of energy intensity and carbon emissions in wastewater treatment in USA, Germany, China and South Africa. Appl. Energy 2016, 184, 873–881. [Google Scholar] [CrossRef] [Green Version]
  60. Moriasi, D.N.; Arnold, J.G.; Van Liew, M.W.; Bingner, R.L.; Harmel, R.D.; Veith, T.L. Model evaluation guidelines for systematic quantification of accuracy in watershed simulations. Trans. ASABE. 2007, 50, 885–900. [Google Scholar] [CrossRef]
  61. Siddiqi, A.; Fletcher, S. Energy Intensity of Water End-Uses. Curr. Sustain. Energy Rep. 2015, 2, 25–31. [Google Scholar] [CrossRef]
Figure 1. Map of the Wami-Ruvu Basin located in Eastern Tanzania.
Sustainability 11 03109 g001
Figure 2. Tanzania’s energy consumption pattern in 2015 [54,55].
Sustainability 11 03109 g002
Figure 3. Sankey diagram of water flows from sources to destinations in 2015 (106 m3). Sankey; diagram is made by eSankey (www.e-sankey.com).
Sustainability 11 03109 g003
Figure 4. Sankey diagram of water flows from sources to destinations in 2035 (106 m3). Sankey; diagram is made by eSankey (www.e-sankey.com).
Sustainability 11 03109 g004
Table 1. Water and energy needed for biofuel production in WRB (2015).
ItemsQuantity (106 m³/Year)Energy Intensity (kWh/m³) Energy Consumed (106 kWh)Data Sources
Surface water extractionRivers247 (68%)0.50125.22 (61%)WRB inventory, Wakeel et al. (2016)
Reservoirs4.91 (1.3%)0.35
Groundwater extraction104 (29%)0.7578 (38%)
Recycled water treatment0.57 (0.1%)0.480.27 (0.1%)WRB inventory, Paul et al. (2018)
Waste water treatment6.04 (1.6%)0.281.69 (0.9%)WRB inventory, Wang et al. (2016)
Total362.52 205.18
Table 2. Water and energy needed for biofuel production in WRB (2035).
ItemsQuantity (106 m³/Year)Energy Intensity (kWh/m³) Energy Consumed (106 kWh)Data Sources
Surface water extractionRivers570.5 (50%)0.50303.1 (49%)WRB inventory, Wakeel et al. (2016)
Reservoirs51.1 (4.5%)0.35
Groundwater extraction312 (27.5%)0.75234 (38%)
Recycled water treatment131.4 (12%)0.4863.1 (10%)WRB inventory, Paul et al. (2018)
Waste water treatment65.7 (6%)0.2818.4 (3%)WRB inventory, Wang et al. (2016)
Total1130.7 618.6

