Article

Polycentricity in the Yangtze River Delta Urban Agglomeration (YRDUA): More Cohesion or More Disparities?

1
Key Laboratory of Watershed Geographic Sciences, Nanjing Institute of Geography and Limnology, Chinese Academy of Sciences, 73 East Beijing Road, Nanjing 210008, China
2
Faculty of Built Environment, University of New South Wales (UNSW), Sydney, NSW 2052, Australia
3
Department of Geography, University of Utah, Salt Lake City, UT 84112, USA
*
Author to whom correspondence should be addressed.
Sustainability 2019, 11(11), 3106; https://doi.org/10.3390/su11113106
Submission received: 23 April 2019 / Revised: 20 May 2019 / Accepted: 28 May 2019 / Published: 1 June 2019
(This article belongs to the Section Sustainability in Geographic Science)

Abstract

:
Urban spatial structure is a critical component of urban planning and development, and among the different urban spatial structure strategies, ‘polycentric mega-city region (PMR)’ has recently received great research and public policy interest in China. However, there is a lack of systematic understanding on the spatiality of PMR from a pluralistic perspective. This study aims to fill this gap by investigating the spatiality of PMR in the Yangtze River Delta Urban Agglomeration (YRDUA) using city-level data on gross domestic product (GDP), population share, and urban income growth for the period 2000–2013. The results reveal that economically, the YRDUA is experiencing greater polycentricity, but in terms of social welfare, the region manifests growing monocentricity. We further find that the triple transition framework (marketization, urbanization, and decentralization) can greatly explain the observed patterns. Although the economic goals are accomplished with better spatial linkages and early economic development policies, inequality in spatial distribution of public services and the continuing legacy of central planning remain barriers for the YRDUA to emerge as a successful PMR. The results of this research offer meaningful insights on the impact of polycentric policies in the YRDUA and support policymakers in the implementation of appropriate urban spatial development strategies.

1. Introduction

Over 50% of the global population now live in urban areas, and this is expected to become 70% by 2050 [1]. For a long period, urban planners and city managers have been implementing different urban spatial structure strategies to meet the needs of the growing urban population in a sustainable manner [2]. Urban spatial structure is a critical component of urban planning and development and is defined as the spatial distribution of various urban elements (e.g., land use and urban networks) [3]. Among the different urban spatial structure strategies, ‘polycentric mega-city region (PMR)’ has recently received great public policy interest as it is believed to facilitate economic integration, social welfare, and spatially balanced metropolitan regions, city clusters, and urban networks [4,5]. Monocentricity on the other hand accompanies congestion, high land prices, social problems, and environmental pollution [6].
A PMR is characterized by functionally and spatially connected network of several semi-independent cities and/or subcenters [7]. It has become a global phenomenon post the European polycentricity planning projects (e.g., European spatial development perspective and European polycentric mega-cities regional sustainable development management project) [8].
PMRs have been extensively reported in Europe (e.g., Rhine-Main and Rhine-Ruhr region in Germany, Liverpool, Manchester, London, Paris-Ile-de-France, Northern Switzerland, Holland, and Dublin) [9,10] and the United States (e.g., Southern California, Texas Triangle, Great Lakes, and Florida) [4]. In Asia, new forms of PMRs are visible in Japan (Nagoya, Osaka, Kyoto, and Kobe), Vietnam (Ho Chi Minh City), and Philippines [11].
In China, several PMRs (e.g., Pearl River Delta (PRD), Yangtze River Delta (YRD) and Jing-Jin-Ji) have evolved to achieve balanced regional development by shifting population and economic activities from old core to new cities [12,13]. And, many more are in pipeline (five national level mega-city regions, nine national level secondary level mega-city regions, and six regional level mega-city regions) [14].
As more and more PMRs emerge in China, it is important to understand questions such as (i) whether such policies result in functionally and geographically coherent megacity regions or they are just defined politically as polycentric and (ii) what are the factors that shape PMRs in China? We aim to provide response to these questions by examining the performance of Yangtze River Delta Urban Agglomeration (YRDUA) Development Plan and characterize the degree of polycentricity in the YRDUA using three indicators (population, economic development and social welfare). We also discuss the drivers shaping the spatial structure of the YRDUA in the transitional era.
The degree of polycentricity at a regional level reflects the extent to which population and activities are spread over multiple cities in the wider metropolitan region [15]. The higher the degree of polycentricity the less disparities and the more spatially development region [7].
The motivation for this case study selection arises from two key arguments: First, the ‘YRDUA Development Plan’ (developed in 2016) aims to establish a functionally and geographically integrated city region (‘three provinces-one city’) and to strengthen cooperation between urban and rural areas and between leading and lagging cities in the region. Therefore, it offers an excellent and recent example. Second, the YRDUA surpasses the other two largest metropolitan regions (PRD and Jing-Jin-Ji) in China in terms of economic size [16].
Historical record of polycentric policies in the YRDUA also provides an ample source of narrative. As early as 1983, the State Council established the Shanghai Economic Zone (SEZ) to facilitate cooperation between Shanghai and other cities in the neighboring provinces of Jiangsu, Zhejiang, Anhui, Jiangxi, and Fujian though it was dissolved in 1988 due to regional differences, lack of administrative organization, and difficulties in coordinating benefits. The decentralization reform in the late 1990s—the Pudong Development and the YRD strategies—once again revived new urban spatial structure strategies in the YRDUA. A number of initiatives were launched (e.g., Planning for the YRDUA and The Forum of Two Provinces and One Municipality) to support balanced regional development.
The rest of the paper is organized as follows. The following section presents a brief literature review on the concept of PMR, the current status of research, and the potential factors that can explain polycentricity. Data, methods, and study area are introduced in Section 3. The results of this research are presented in Section 4. The drivers shaping the observed patterns of polycentricity are discussed in Section 5. Finally, the paper ends with some concluding remarks.

2. Literature Review

2.1. Polycentric Mega-City Region: Concept and Measurement

Though polycentricity has been in existence since the early 20th century [17,18], it didn’t emerge as a key concept in studying urban spatial structure until the 1990s. The works on ‘edge cities’ [19] and the evolution of polycentric structure [20] have deepened the usage of polycentricity in urban spatial structure analysis. Broadly, polycentricity can be described in two types: (i) spatial polycentricity, which deals with the geographic distribution of cities and towns of different sizes [21]; it focuses on population, employment, land use, and so on [22]. (ii) Functional polycentricity, which is related to functional relationships between cities and regions and how those relationships are linked to each other through networks (e.g., commuting flows and knowledge-based flow of people and information) [23,24].
It is also important to note that polycentricity is a multiscalar concept operating at local, regional and national levels [4], and therefore is understood differently at different scales [25]. At the intraurban scale, it is the outward diffusion of agglomeration from centers of cities to their suburbs or subcenters [26]. At the interurban scale, it is related to flow of people and activity from big cities to smaller cities within their urban spheres of influence [6]. In the recent years, the concept of polycentricity has spread out from ‘city’ to cover a wider region, calling for PMRs [27,28].
PMRs are complex versions of urban forms denoted by a cluster of 10–50 separate, but morphologically and functionally networked, cities and may have one or more megacities [29]. They are not just isolated central agglomerations that grow towards empty spaces as in the cases of inter- and intra-urban scales [23]. They encompass central agglomerations and the small cities with frequent internal connection between the cities in the hinterland and external connection with the cities beyond the region [30]. A PMR is featured by transactional flows of goods, people, and services and is linked through economic, environmental, and infrastructure networks [29]. It is now a popular planning concept around the world (see examples outlined in Section 1), as it is believed to promote internationally accessible and internally linked synergy economies, spatially balanced development [26], global competitiveness, economic integration, and social cohesion between cities, towns, and suburban areas [5].
The maturity of polycentricity theory has greatly prompted empirical studies on tracking the performance of PMRs around the world [31,32]. However, the different ways in which PMR is understood and the different concepts evolved over time (e.g., polycentric metacity, urban agglomerations, megalopolis, metropolitan area, regional, translational, and urban systems/networks regions) contributed to plurality of methods and indicators within different domains (e.g., economic development, social equity, and environmental protection) [29]. Indicators used for economic development are gross domestic product (GDP), GDP per capita, income, and industrial output [33,34]. Indicators to measure social equity include employment, education, health care, and urban–rural income [14,35]. Other indicators include population or employment density, land use or housing, transport and firm locations and knowledge spillovers [13,36].
The performance of polycentricity in city regions has been measured by different methods based on selected indicators. For example, rank/size distribution [33]; social network analysis [37]; sprawl index and the level of connectivity [38]; level of centrality/polycentricity index using size, location, and connectivity [11]; entropy index [39]; and fragmentation metrics (path density, edge density, area-weighted shape index, and dispersion index) [29] are used for GDP per capita, urban–rural income gap, and urban fragmentation. Statistical analysis methods (Mann–Kendall test, seasonal decomposition, and Hurst exponent) [29], Gini Coefficient [40], coordinated coupling degree model, and one-way ANOVA are used to gauge the degree of cooperation among the cities in the mega-city region. Spatial integration and clustering models [27], physical network analysis [41], and social network analysis [24] are used to visualize characteristics of the networks. The employment of each of the methodologies however depends on theoretical assumptions and the data used.

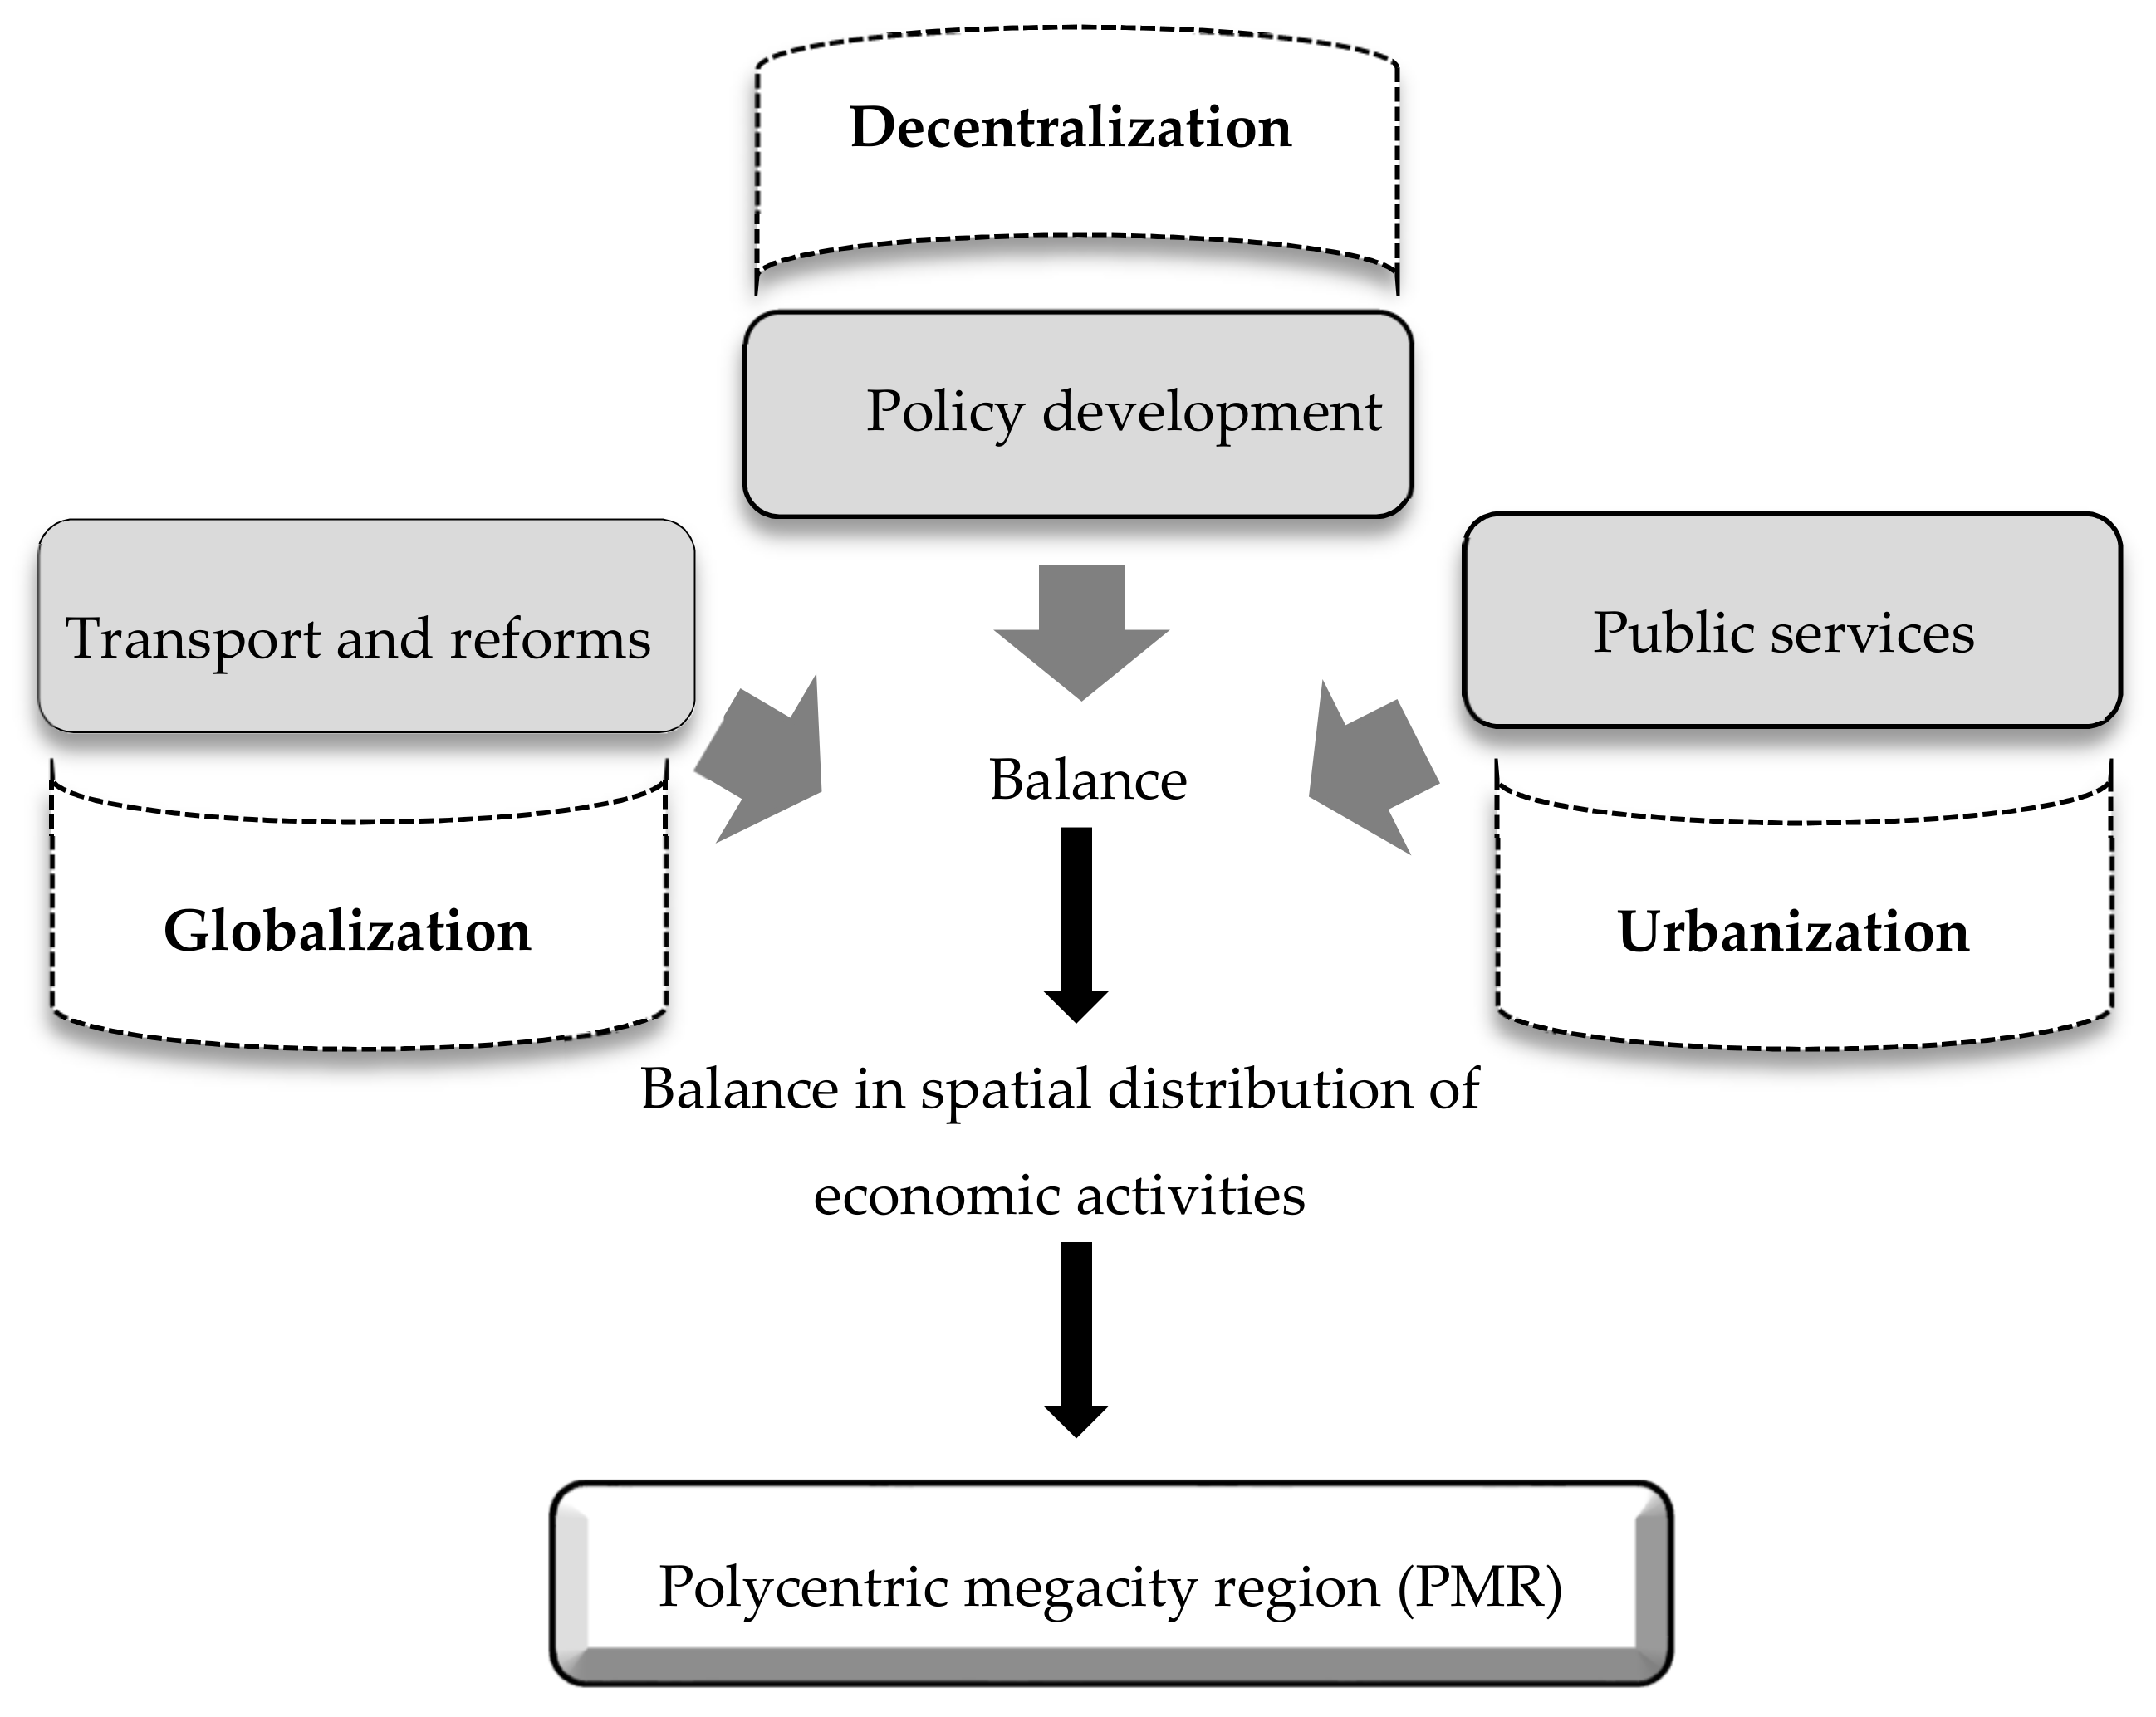
2.2. The Triple Transitions as Determinants of Polycentricity

There are many potential determinants that can explain the degree of polycentricity in cities and urban regions: One leading candidate is spatial linkages. The significance of spatial linkages to polycentricity has been emphasized by studies on regional development, global cities, and production organization [24,42]. For example, studies in regional development emphasize that cities close to major economic centers tend to benefit from the trickle-down effect of these centers [43]. The spatial concentration of financial and human capital network around hubs and peripheral cities creates inequality between cities [44]. Investment in localized infrastructure (e.g., roads and railways) can significantly improve spatial linkages and mobility of factors [45], and thereby reduce distance and spatial barriers to polycentric development [46].
Another popular factor is the role of institutions. A large body of literature analyze the role of states and regional policies [47,48], particularly policies promoting industrialization, foreign investment, and trade, and conclude that state intervention has much more influence on polycentricity [49,50], than even transport networks. Rodrik et al [51] makes an extreme assertion, arguing that institutions “trumps” everything else. However, others see state as simply an instrument of manipulating labor in the interest of industry and creating economic and social conditions favorable to capital accumulation; thus state actions tend to create, maintain, and intensify regional inequality [52].
What is not clear from such arguments, however, is the role of a combination of factors in the success or failure of polycentric policies. Too often past studies build on a single factor, and hence found to be controversial, or at least incomplete. Geographers have demonstrated the limited power of a single determinant, and suggested that multi-perspective synthesis might be necessary for a better research [52]. Drawing on this literature, we argue that, both in theory and practice, polycentricity needs to be understood from multiple interconnected factors.
We attempt to build an integrated conceptual framework to draw insightful perspectives on polycentricity in China (Figure 1). This framework is different from the polycentricity under the traditional system, in that emphasis on a single factor. It is based on an argument that in the context of marketization, decentralization, and urbanization, the balance in spatial distribution of spatial linkages, state policies, and public services will contribute to a balance in spatial distribution of economic activities, which in turn will contribute to a greater degree of polycentricity. We demonstrate the conceptual framework to our case, but it can be tested for applicability to other regions in China and elsewhere in the world.

2.3. The Current Research

A large literature has emerged to investigate polycentricity in China using different indicators and different analytical methods [13,32]. Various factors have been considered to explain the formation and changes of polycentricity and the distribution of activities and people. Further, several empirical studies have been carried out to measure polycentricity in the YRDUA. However, most of the existing research focuses on intercity [46] or intracity scale, restricted to a few large cities, such as Shanghai [7] and Hangzhou [53]. Research at intraregional scale (or polycentric mega-city region) is largely limited to gauging functional polycentricity from a knowledge collaboration perspective [54,55]. A small body of literature evaluates spatial polycentricity [55,56,57]. Even the little existing literature uses only a single indicator: for example, GDP [29], land use [14], or transport/traffic [58,59]. There is a lack of systematic understanding on the changing spatial configurations of the region from a pluralistic perspective. Whatever the caveats in our understanding of polycentricity in the YRDUA, our knowledge on the mechanisms of change so far is even scantier. Further, it is important to understand the achievement and failure of the polycentric development in the YRDUA as the region has evolved from a focus on equal distribution of spatial growth and population to more regional diversity and competitiveness. We hope that this research will fill this gap by investigating the spatiotemporal aspects of polycentricity in the YRDUA and the driving forces for the observed patterns using multiple indicators and dimensions.

3. Data and Methods

3.1. Data Collection

We gathered data on GDP, urban–rural income, number of physicians and students with higher education, scientific research and development investment from the China City Statistical Yearbook (CCSY) (1991–2015), statistical communique on national economic and social development (1991, 2001, 2006, 2011, and 2015), and provincial statistical yearbooks. The population data was obtained from Census (1990, 2000, and 2010) and statistical yearbooks. The spatial accessibility data (mileages and commuting time) was calculated based on route between cities (by using http://map.baidu.com/ and https://kyfw.12306.cn/). Policies and documents on market, finance, technology, land, and other fields were obtained from official websites of respective city and county governments (see Table 2).
A number of suburban counties in the YRDUA were merged between 2000 and 2005. To ensure the comparability of spatial data in different years, the urban administrative system was adjusted to the county, prefectural, and provincial administrative boundaries in 2010. As the inclusion of migrants in any analysis pertaining to regional development in China is crucial [60], the de facto population was considered to describe the actual population distribution.
Based on the data from the ‘Regional Planning of YRDUA’, this paper covers 1 core city, 5 regional central cities, and 10 regional common cities at prefectural level, and 36 county-level cities stretching across Shanghai, the southern and central parts of Jiangsu province, and the northern part of Zhejiang province, as shown in Table 1.

3.2. Methodologies

Based on the collected data, we built a spatial database on the socioeconomic development in the YRDUA (Figure 2). We employed three techniques to improve our understanding on the polycentricity in the rapidly urbanizing mega-region: First, we measured the polycentricity in terms of population and economy using the degree of concentration or dispersion. We list and map the total population and GDP by city in 2000 and 2013. The population and GDP shares, and their changes from 2000 to 2013, were used as the proxies of the evolving trends of polycentric patterns in population distribution and economic development. We analyzed the extent of polycentricity in social welfare through the urban and rural residents’ income in 2000 and 2013, and their growth rate during 2000 to 2013. The Gini coefficient was used to measure the social welfare indicator.
With regard to the analysis of the drivers behind polycentricity in the YRDUA, we focused on the impacts of spatial linkages, public services, and state policies. First, we considered transportation accessibility and network, especially access to Shanghai from other cities by highway and high-speed railway (HSR), as the proxies of spatial linkages in the YRDUA. With the help of travel data extracted from the websites of China Railway and Baidu maps, the spatial connection between Shanghai and other cities can be well detected. Second, we investigated the distribution of number of doctors, undergraduates, key state laboratories, and R&D expenditure to measure the quality of public services by city. These data were extracted from various yearbooks mentioned above and counted by city types (in both region and administrative level terms) to detect the heterogeneity of public services. We applied the OLS model to demystify the correlation between different public service levels and population agglomeration. Third, we reviewed different national state policy documents and the benefited cities in the YRDUA to examine the level of decentralization (Table 2).
For the analysis of the drivers, we mainly used the quantitative correlation and the qualitative methods (i.e., policy analysis); GIS-based approaches are employed to visually interpret polycentricity in the YRDUA.

4. Spatiotemporal Patterns of Polycentricity in the YRDUA

To gauge the level of polycentricity in the YRDUA, we analyzed the changes in GDP, resident population, and urban/rural income patterns.
At an overall level, the GDP of the YRDUA increased rapidly from billion RMB 16, 202 in 2000 to 97, 759 in 2013 (Table 3). For the same period, the YRDUA’s contribution to China’s GDP increased from 16.3% to 17.2%, facilitating its emergence as a nationally prominent mega-city region. Economically, the gap between the cities in the YRDUA is gradually narrowing. The Gini coefficient measured with GDP is observed to be slightly expanding before 2005, but thereafter, it fell to as low as 0.393 in 2014.
In line with the results of regional level GDP changes, the cities at sub-regional level had shown increased percentages of proportion of GDP, except for Shanghai. The proportion of Shanghai’s GDP fell by 6.4%, from 28.2% in 2000 to 21.8% in 2013. This is unexpected given Shanghai’s dominating position in the region. At the same time, the proportion of regional central cities moved up by 2.6%, while the proportion of the GDP of other common and county-level cities increased by 1% and 2%, respectively. We also observed that the contribution of the five regional central cities to the total percentage of YRD’s GDP was two times more than that of the other 10 common cities in both 2000 and 2013.
A significant rise in county-level cities’ share of GDP from 2000 to 2013 shows that smaller cities are pursuing economic development and improving their position in urban networks. In addition, the decline of growth in the core and central cities and increase in county-level cities indicate a shift of urban growth and the dispersion of activities to smaller cities. This finding supports studies that emphasize positive relationship between polycentricity and economic performance [15,61]. In terms of spatial patterns, the economy measured by GDP was still highly concentrated in the ‘Z’ shaped areas along the Shanghai-Nanjing, Shanghai-Hangzhou, and Hangzhou-Ningbo Lines (Figure 3).
The economic development and rapid urbanization has been attracting labor from all over the country to the cities in the YRDUA. Between 1990 and 2014, the permanent population of the YRDUA region increased by ~41.2%, from ~77.52 million to 110.00 million. Spanning an area of 354,000 square kilometers, the region comprises just 3.7% of China’s territory, but one-sixth of China’s population. This reflects that YRDUA is increasingly becoming a center for what may be the largest spatial concentration of population in China. The degree of population concentration within the region also enhanced significantly; the Gini coefficient measured with permanent population rose from 0.268 to 0.332, indicating that the population growth was mainly concentrated in certain cities.
In terms of changes in proportion of permanent population, the results indicate that between 2000 and 2013, the proportion of permanent population in the core city (Shanghai) increased by 2.8%, from 18.6% in 2000 to 21.4% 2013, while that of central cities moved up by 2.3%. A striking point revealed in the analysis was the decreased levels of proportion of population in regional common and county-level cities. To be precise, the results show that cities surrounding the core city and the central cities had the largest population share, forming a monocentric spatial structure.
The results of spatial patterns provide roughly the same picture of GDP. As seen from the change in the proportion of permanent population in 2000 and 2013, the population in the YRDUA was concentrated along Shanghai–Suzhou and Hangzhou–Suzhou–Ningbo lines.
As for urban–rural income patterns, while the urban residents’ disposable income and rural per capita net income in the YRDUA considerably grew at an overall level, the income gap among the cities within the region was steadily expanding (Table 4). The Gini coefficient measured with urban residents’ disposable income and rural per capita net income present a trend of rise on the whole, except for a slight fall in 2010. As seen from the urban–rural residents’ income distribution, the urban residents’ disposable income and rural residents’ net income of the regional core city (Shanghai) and five regional central cities were commonly higher than those of other types of cities. At the same time, the gap between the urban residents’ disposable income of regional central cities and that of other cities was narrowing; the growth rate of Shanghai and five central cities was lower than the median of the growth rate of all other cities. As for the index of rural residents’ net income, the growth rate in all cities, other than Shanghai, was higher than the median, indicating that the gap of rural per capita net income between the six large cities and other cities is expanding further.
In terms of the urban residents’ income spatial distribution, a noticeable spatial concentration patterns along Hangzhou-Shaoxing-Ningbo and Wuxi-Suzhou lines, surrounding Shanghai and central cities developed (Figure 3). Interestingly, in terms of change in urban income growth, we can see that a pattern along Lishui–Gaochun–Jurong–Danyang lines emerged. In fact, some of the other common and county-level cities, such as Taizhou, Yangzhou, and Nantong witnessed urban income growth higher than that of Nanjing, and even Shanghai.
The rural-income patterns are very similar to urban income. In both the study periods, the rural income is concentrated along Jiaxing–Hangzhou–Shaoxing–Ningbo and Suzhou–Wuxi. In 2013, the concentration shifted Zhenjiang–Changzhou in Southern Jiangsu with Nanjing as the core.
The results show that polycentric urban development in the megacity region of YRDUA is uneven. The YRDUA mega-city region policy has only achieved the economic goals and failed to accomplish the objectives of social equity and rational urban growth. The region is experiencing the simultaneous presence of polycentricity and monocentricity; fundamentally, a new dynamic spatial form and arrangement of PMR [3]. Let us now take a closer look at the driving forces behind this spatial structure.

5. Discussion

A large literature has attempted to explain the polycentricity in megacity regions of China in the context of urbanization, marketization, and decentralization [11,53]. Although, we did not attempt to develop ‘a theory of PMR’, we try to explain the observed patterns through a conceptual framework on triple transitions in China (i.e., marketization, urbanization and decentralization) [62].

5.1. Marketization

The relevance of marketization and changes in political economy to polycentricity in China has been emphasized by several studies. A number of scholars argue that rapid expansion of transport networks facilitates relocation of economic activities to the new areas and small cities and dispersion of economy, making room for polycentric development [3,7].
An exploratory analysis suggests that the polycentricity in the YRDUA can be attributed to comprehensive spatial linkages within the region. The integrated road and local transport network within the region (Table 5) has reduced transportation costs and provided a choice of options for market. As a result, manufacturing industries have moved from land and labor expensive core and central cities to peripheral common cities (e.g., Wuxi, Suzhou, Changzhou, etc.), and even county-level cities contributed to higher growth of GDP in smaller and lagging cities. Meanwhile, the development of SEZs and industrial districts in smaller cities has further reduced economic gap among the cities in the YRDUA. Overall, decentralization by the death of physical distance and favorable economic development policies have facilitated the industrial attractiveness of smaller cities, and supported the development of a “new network of economically networked” mega-city region [63].

5.2. Urbanization

Urbanization also help to explain patterns of polycentricity. A large body of literature concludes that urbanization process in China represents the dual process of spatial expansion and social differentiation [52]. In this vein, scholars argue that polycentric regions have fewer social services than monocentric areas [6,22]. The uneven distribution of high-quality public services creates, maintain or intensify spatial disparities [5]. This is also consistent with the findings of our research.
A high correlation between different public service levels and population agglomeration show that large cities have more high-quality public services and cities with better public services naturally attract population (Figure 4 and Figure 5). This finding can be supported by the distribution of public services in the region (Figure 6).
In terms of education, Shanghai gathered 45.5% of universities, 22.7% high schools, 28.6% higher vocational schools, 23.7% full-time teachers, and 19.2% student enrolment in colleges and universities in the YRDUA. Combining Shanghai, Nanjing and Hangzhou together, the proportions will increase to 86.4%, 45.5%, 64.3%, 67.4%, and 61.2% respectively. Moreover, the number of students’ enrolment in colleges and universities for every 10,000 persons in core and central cities exceeds the total of those in other level cities.
In terms of medical service, Shanghai gathered 24.4% grade-three class-A hospitals and 19.6% doctors, and coupled with Nanjing and Hangzhou, the two proportions will shoot up to 55.6% and 39.0%, respectively.
In terms of scientific, technological, and cultural services, Shanghai gathered 53.0% of national key laboratories and 29.0% of R&D expenditure, and combined with Nanjing and Hangzhou, the shares will go up to 95.2% and 47.1%, respectively. Further, the collection of books in public libraries for every hundred persons in Shanghai is up to 504 volumes, around twice that in Nanjing and Hangzhou together, ~5 times that in common cities, and up to ~10 times that in county-level cities.
Moreover, the difference in spatial distribution of public services and the associated high-quality jobs (e.g., teachers, doctors, and researchers) greatly affected the spatial patterns of income growth in the YRDUA (Figure 6). Though manufacturing development facilitated the growth in jobs in smaller cities, it did not bring the required population due to lower level of public services. The spatial disparities in public services have significantly contributed to the spatial mismatch of population and income in the YRDUA.

5.3. Decentralization

Political factors have long been affecting urban development in China [7,29]. To seize both foreign and domestic investment and market opportunities, cities in the YRDUA are undergoing a major reformative planning process. A number of new preferential policies and pilot reforms are being developed to promote industrialization, foreign investment, and trade in lagging cities, and hence facilitate polycentricity. However, in practice, most of the new economic development policies and reforms implemented after the global financial crisis in 2008 and the ‘The Eighteenth National Congress of the Communist Party of China’ concentrated in core and central cities. For example, Shanghai, Nanjing, Suzhou, and Hangzhou enjoy preferential policies in e-commerce, financial cooperation, and scientific and technological innovation. On the other hand, urban development policies that encourage pilot projects in smart cities, national-level new districts, and low-carbon cities benefit smaller cities. The large city focus policies that tend to favor enterprises, large socioeconomic development projects and investments in urban infrastructure and public services failed to disperse population and social welfare.
Ideally, a PMR contributes to the flow of goods, people and services without any barriers, promotes the overall regional economic development, and tends to bridge regional differentials at some point of time. It is in accordance with the regional economic relations, factor flow, social development needs, and economic integration. The results of our research reveal that although the improvement in spatial linkages and early economic development policies have been contributing to a greater degree of polycentricity, the spatial hierarchy, and more power in the hands of the Chinese state are barriers for the social cohesion and free flow of public capital and people between different cities in the YRDUA, and as shown in the paper, have influenced the allocation of public services and excessive concentration of people and income in core and central cities. This suggests that more often than not, the central government’s focus has been on strengthening Shanghai and regional central cities, which in turn suggests the lack of political commitment in practice. For example, the ‘one nuclear five circles four belt’ policy aims to accelerate Shanghai’s core competitiveness and overall service capabilities, to promote the functional strength of Shanghai’s neighboring cities, such as Suzhou and Wuxi, and to foster spatial development along Shanghai, Nanjing, Hangzhou, and Ningbo development zones. And of course, this focus on spatial hierarchy-based development falters the polycentric mega-city region project.

6. Conclusions

Urban spatial structure and the distribution of activities and physical elements of urban areas has received immense interest from regional planners, urban geographers and economists around the world, particularly from Europe and China, who believe that it effects urban growth, spatial development, economic performance and social well-being of cities and their inhabitants [2,8]. The city is now becoming a regional phenomenon and calls have been made to study urban spatial structure from a wider, polycentric mega-city region (PMR) form of development [29,33].
PMRs are seen as more flexible, innovative and resource-efficient than more monocentric city forms [4]. In the recent years, the governments in China have been encouraging polycentric urban development through implementation of revised master plans, annexing nearby districts and establishing development zones. This is compelling as polycentricity is argued to be a key element in enhancing globally and regionally competitive urbanization [5].
In this research, we have endeavored to examine the degree of polycentricity in the Yangtze River Delta Urban Agglomeration (YRDUA) and the underlying driving forces. This study builds upon the recent interest in spatial polycentricity [21,22], which highlights a balanced distribution of population and activity between cities within a region. The use of spatial polycentricity is useful to analyze the case of YRDUA as mega-city regional plans proliferate to achieve balanced spatial development. We use city-level dataset of GDP share, population share, and urban income growth for the period 2000–2013. Our case study provides an intriguing perspective from a globalizing city region in a transitional economic period.
Success or failure of a polycentric arrangement should be evaluated in the context of the objectives it sets to achieve and the political, economic and institutional context under which it operates. In the case of polycentricity in the YRDUA, the objective is to eventually form an economically and socially coordinated megacity region. Judged against this objective, the region hasn’t, to date, successfully fulfilled all the requirements of a functional polycentric region.
The results of our research show that the spatial structure of the YRDUA cannot be considered very monocentric or very polycentric, but somewhere in between the ends of the scale. The region is experiencing simultaneous presence of polycentricity and monocentricity consisting of multiple cities with their own characteristics, profiles and strategic roles to play [3]. Economically, the region is witnessing greater polycentricity, but in terms of social equity, the region manifests growing monocentricity. This is substantiated by the empirical findings—despite of the greater transfer of GDP to the lower-level cities, population, and income are still concentrated in Shanghai and provincial capitals. Our findings support numerous studies, which have concluded that it is difficult to achieve complete positive effects of polycentricity [33,38].
Our research further show that a combination of interconnected driving forces shaped the emerging spatial structure in the YRDUA. The “death of distance” by advances in transportation and a variety of economic development initiatives in the lower-level cities increased the flow of capital to small- and medium-sized cities and supported greater polycentricity in economic development. Though economic dispersion brought more jobs in lower-level cities, the lack of high-quality public services (e.g., educational centers, healthcare, and social, technological, and cultural services) greatly affected the flow of population and income between cities.
The social differentiation in and between cities has become an epitome of regional inequality in the YRDUA. The uneven distribution in public services can be partially explained by the state funding allocation and preferential policies. Large cities tend to receive considerably large government funds and special urban development policies [11]. More often, the central government focuses on strengthening Shanghai and regional central cities. For example, the ‘one nuclear five circles four belt’ policy aims to accelerate Shanghai’s core competitiveness and overall service capabilities, to promote the functional strength of Shanghai’s neighboring cities (e.g., Suzhou and Wuxi), and to foster spatial development along Shanghai, Nanjing, Hangzhou, and Ningbo development zones. On the other hand, smaller cities suffer the problems of policy depressions and administrative fragmentation.
Ideally, a polycentric spatial structure is expected to blur the gaps between cities and suburbs and support the socioeconomic development of existing and new small cities. However, the results of our research conclude that although the content and forms of polycentricity in the YRDUA is changing with improvement in spatial linkages and early economic development policies, spatial hierarchies, power structures and the continuing legacy of central government interventions in major economic and social activities falters the PMR project.
If a PMR is to be successful in practical terms, the set of issues highlighted above, which have hindered the progress so far, should be resolved. The experience of the former socialist countries of central Europe show that though socialist urbanization policies aimed to achieve balanced spatial development through spatially even distribution of jobs and services, the strict top-down approach, limited choice at the bottom and among individuals and households resulted in a spatial structure characterized by centralization and monocentric regions [5]. To avoid the repetition of such negative experience in China’s mega-city regions, it is imperative to enhance the plurality of choices for populations in terms of jobs and public services through redistributive policies and reforms.
Local governments’ consensus and cooperative actions are imperative to bring consistency in the allocation of central government’s policy and capital resources, to optimize the spatial configuration and to improve the overall regional advantages. A dialogue and continuous interactive engagement between different tiers of governments, and constant involvement of citizens, local business enterprises and other stakeholders are required to address the structural fragmentation and managerial challenges involved in achieving a polycentric YRDUA [4,7].
There are several policy and theoretical implications that follow from our analysis: (i) the results offer meaningful insights on the impact of polycentric policies in the YRDUA and support policymakers in the implementation of appropriate urban spatial structure policies; (ii) this work takes forward the polycentricity literature by operationalizing this framework in an important new arena that of city scale in a rapidly developing economic region in China; and (iii) the triple transition conceptual framework emphasizes that any change in urban spatial structure in Chinese megacity regions is shaped by a multitude of factors within the context of marketization, urbanization, and decentralization.
We acknowledge two potential limitations of this study: First, county-level administrative boundaries are frequently adjusted in China because of various political and/or economic issues. Analysis based on different administrative boundaries and borders pose a great challenge to a study on polycentricity. Second, because of population migration, the hukou-registered (Hukou refers to being a de jure citizen of a certain area in China. Many migrants do not own a hukou.) population may not represent the actual income distribution. Yet, we hope that this work will improve our understanding on how the cities in the YRDUA function today and what spatial characteristics might they take in near future.
This research could be improved and extended by considering other indicators of polycentricity, such as growth in construction land, industrial development, ecology, environment, etc. Further, we apply the triple transition framework to understand the urban spatial structure in the YRDUA, but it can be tested for applicability to other regions in China and elsewhere in the world.

Author Contributions

Conceptualization, K.Y., J.W. and W.C.; methodology, K.Y. and J.W.; software, J.G.; validation, J.W.; formal analysis, J.W.; investigation, J.W., W.C., F.Y., J.G. and K.Y.; resources, W.C., F.Y. and Y.D.; data curation, J.W.; writing—original draft preparation, K.Y. and J.W.; writing—review and editing, K.Y. and J.W.; visualization, J.W.; supervision, W.C. and Y.D.; project administration, W.C. and Y.D.; funding acquisition, W.C., F.Y. and Y.D.

Funding

This research was funded by Strategic Priority Research Program of the Chinese Academy of Sciences (XDA230201), “One-Three-Five” Strategic Planning of Nanjing Institute of Geography and Limnology, Chinese Academy of Sciences (NIGLAS2017GH06), National Natural Science Foundation of China (41130750), and US National Science Foundation (1759746).

Acknowledgments

We would like to thank the three reviewers for their comments and suggestions. The reviews have significantly improved the paper.

Conflicts of Interest

The authors declare no conflicts of interest.

References

  1. UN-Habitat, Urban Patterns for Sustainable Development: Towards a Green Economy, in UN-Habitat Draft Working Paper. 2011. Available online: http://mirror.unhabitat.org/pmss/getElectronicVersion.aspx?nr=3077&alt=1 (accessed on 20 May 2019).
  2. Healey, P. Urban complexity and spatial strategies: Towards a relational planning for our times. J. Am. Plann. Assoc. 2008, 74, 137. [Google Scholar] [CrossRef]
  3. Dadashpoor, H.; Yousefi, Z. Centralization or decentralization? A review on the effects of information and communication technology on urban spatial structure. Cities 2018, 78, 194–205. [Google Scholar] [CrossRef]
  4. Rauhut, D. Polycentricity—One concept or many? Eur. Plan. Stud. 2017, 25, 332–348. [Google Scholar] [CrossRef]
  5. Sykora, L.; Mulíček, O.; Maier, K. City regions and polycentric territorial development: concepts and practice. Urban Res. Pract. 2009, 2, 233–239. [Google Scholar] [CrossRef]
  6. Meijers, E. Summing Small Cities Does Not Make a Large City: Polycentric Urban Regions and the Provision of Cultural, Leisure and Sports Amenities. Urban Stud. 2008, 45, 2323–2342. [Google Scholar] [CrossRef]
  7. Ren, Y.; Berg, P.O. Developing and branding a polycentric mega-city: The case of Shanghai. In Branding Chinese Mega-Cities: Policies, Practices and Positioning; Edward Elgar: Cheltenham, UK, 2014; pp. 21–41. [Google Scholar]
  8. Finka, M.; Kluvánková, T. Managing complexity of urban systems: A polycentric approach. Land Use Policy 2015, 42, 602–608. [Google Scholar] [CrossRef]
  9. Faludi, A. Territorial cohesion: an unidentified political objective: Introduction to the special issue. Town Plan. Rev. 2005, 76, 1–13. [Google Scholar] [CrossRef]
  10. Marull, J.; Galletto, V.; Domene, E.; Trullén, J. Emerging megaregions: A new spatial scale to explore urban sustainability. Land Use Policy 2013, 34, 353–366. [Google Scholar] [CrossRef]
  11. Liu, X.; Wang, M. How polycentric is urban China and why? A case study of 318 cities. Landsc. Urban Plan. 2016, 151, 10–20. [Google Scholar] [CrossRef]
  12. Zhang, T.; Sun, B.; Li, W. The economic performance of urban structure: From the perspective of Polycentricity and Monocentricity. Cities 2017, 68, 18–24. [Google Scholar] [CrossRef]
  13. Zhao, M.; Derudder, B.; Huang, J. Examining the transition processes in the Pearl River Delta polycentric mega-city region through the lens of corporate networks. Cities 2017, 60, 147–155. [Google Scholar] [CrossRef]
  14. Feng, Y.; Wu, S.; Wu, P.; Su, S.; Weng, M.; Bian, M. Spatiotemporal characterization of megaregional poly-centrality: Evidence for new urban hypotheses and implications for polycentric policies. Land Use Policy 2018, 77, 712–731. [Google Scholar] [CrossRef]
  15. Meijers, E.J.; Burger, M.J. Spatial Structure and Productivity in US Metropolitan Areas. Environ. Plan. A 2010, 42, 1383–1402. [Google Scholar] [CrossRef] [Green Version]
  16. Gao, J.; Wei, Y.D.; Chen, W.; Yenneti, K. Urban Land Expansion and Structural Change in the Yangtze River Delta, China. Sustainability 2015, 7, 10281–10307. [Google Scholar] [CrossRef] [Green Version]
  17. Burgess, E.W. Can neighborhood work have a scientific basis. In The City; The University of Chicago Press: Chicago, IL, USA, 1925; pp. 142–155. [Google Scholar]
  18. Harris, C.D.; Ullman, E.L. The nature of cities. Ann. Am. Acad. Political Soc. Sci. 1945, 242, 7–17. [Google Scholar] [CrossRef]
  19. Beauregard, R.A. Edge cities: Peripheralizing the center. Urban Geogr. 1995, 16, 708–721. [Google Scholar] [CrossRef]
  20. Krugman, P. The Role of Geography in Development. Int. Reg. Sci. 1999, 22, 142–161. [Google Scholar] [CrossRef] [Green Version]
  21. Kloosterman, R.C.; Musterd, S. The Polycentric Urban Region: Towards a Research Agenda. Urban Stud. 2001, 38, 623–633. [Google Scholar] [CrossRef]
  22. Parr, J. The Polycentric Urban Region: A Closer Inspection. Reg. Stud. 2004, 38, 231–240. [Google Scholar] [CrossRef]
  23. Hall, P. Polycentricity. In International Encyclopedia of Human Geography; Kitchin, R., Thrift, N., Eds.; Elsevier: Oxford, UK, 2009; pp. 260–264. [Google Scholar]
  24. Vasanen, A. Functional Polycentricity: Examining Metropolitan Spatial Structure through the Connectivity of Urban Sub-centres. Urban Stud. 2012, 49, 3627–3644. [Google Scholar] [CrossRef]
  25. Ostrom, E. Scales, polycentricity, and incentives: Designing complexity to govern complexity. In Protection of Global Biodiversity: Converging Strategies; Duke University Press: Durham, UK, 1998; pp. 149–167. [Google Scholar]
  26. Davoudi, S. European Briefing: Polycentricity in European spatial planning: From an analytical tool to a normative agenda. Eur. Plan. Stud. 2003, 11, 979–999. [Google Scholar] [CrossRef]
  27. Hall, P.; Pain, K. The polycentric Metropolis: Learning from Mega-City Regions in Europe; Routledge: London, UK, 2006. [Google Scholar]
  28. Dewar, M.; Epstein, D. Planning for “Megaregions” in the United States. J. Plan. Lit. 2007, 22, 108–124. [Google Scholar] [CrossRef]
  29. Su, S.; Liu, Z.; Xu, Y.; Li, J.; Pi, J.; Weng, M. China’s megaregion policy: Performance evaluation framework, empirical findings and implications for spatial polycentric governance. Land Use Policy 2017, 63, 1–19. [Google Scholar] [CrossRef]
  30. Taylor, P.J.; Derudder, B. World City Network: A Global Urban Analysis; Routledge: Abingdon, UK, 2015. [Google Scholar]
  31. Halbert, L.; Pain, K.; Thierstein, A. European Polycentricity and Emerging Mega-City Regions: ‘One Size Fits All’Policy? Built Environ. 1978, 32, 206–218. [Google Scholar] [CrossRef]
  32. Zhao, M.; Zhong, Y.; Xu, G. Polycentric Progress of the Three Major City Regions in China, 2001-2009. Econ. Geogr. 2015, 35, 52–59. [Google Scholar]
  33. Meijers, E.; Sandberg, K. Polycentric Development to Combat Regional Disparities? The Relation between Polycentricity and Regional Disparities in European Countries. 2006. Available online: https://www.econstor.eu/handle/10419/118289 (accessed on 29 May 2019).
  34. Palma, P.; Rauhut, D.; Humer, A. Polycentricity and Social Services of General Interest: A Multivariate Analysis. 2015. Available online: https://www.econstor.eu/handle/10419/124775 (accessed on 29 May 2019).
  35. Pfister, N.; Freestone, R.; Murphy, P. Polycentricity or Dispersion?: Changes in Center Employment in Metropolitan Sydney, 1981 To 1996. Urban Geogr. 2000, 21, 428–442. [Google Scholar] [CrossRef]
  36. Muñiz, I.; Garcia-López, M.À. The Polycentric Knowledge Economy in Barcelona. Urban Geogr. 2010, 31, 774–799. [Google Scholar]
  37. Green, N. Functional Polycentricity: A Formal Definition in Terms of Social Network Analysis. Urban Stud. 2007, 44, 2077–2103. [Google Scholar] [CrossRef]
  38. Brezzi, M.; Veneri, P. Assessing polycentric urban systems in the OECD: Country, regional and metropolitan perspectives. Eur. Plan. Stud. 2015, 23, 1128–1145. [Google Scholar] [CrossRef]
  39. Limtanakool, N.; Schwanen, T.; Dijst, M. Developments in the Dutch Urban System on the Basis of Flows. Reg. Stud. 2009, 43, 179–196. [Google Scholar] [CrossRef]
  40. Veneri, P.; Burgalassi, D. Questioning Polycentric Development and its Effects. Issues of Definition and Measurement for the Italian NUTS-2 Regions. Eur. Plan. Stud. 2012, 20, 1017–1037. [Google Scholar] [CrossRef] [Green Version]
  41. Taylor, P.J.; Evans, D.M.; Pain, K. Application of the Interlocking Network Model to Mega-City-Regions: Measuring Polycentricity Within and Beyond City-Regions. Reg. Stud. 2008, 42, 1079–1093. [Google Scholar] [CrossRef]
  42. Richardson, T.; Jensen, O.B. Discourses of Mobility and Polycentric Development: A Contested View of European Spatial Planning. Eur. Plan. Stud. 2000, 8, 503–520. [Google Scholar] [CrossRef]
  43. Liao, F.H.; Wei, Y.D. Space, scale, and regional inequality in provincial China: A spatial filtering approach. Appl. Geogr. 2015, 61, 94–104. [Google Scholar] [CrossRef]
  44. Poon, J.P.; Tan, G.K.; Yin, W. Wage inequality between financial hubs and periphery. Appl. Geogr. 2015, 61, 47–57. [Google Scholar] [CrossRef]
  45. Yu, N.; De Jong, M.; Storm, S.; Mi, J. Transport Infrastructure, Spatial Clusters and Regional Economic Growth in China. Transp. Rev. 2012, 32, 3–28. [Google Scholar] [CrossRef]
  46. Liu, X.; Derudder, B.; Wu, K. Measuring polycentric urban development in China: An intercity transportation network perspective. Reg. Stud. 2016, 50, 1302–1315. [Google Scholar] [CrossRef]
  47. Homsy, G.C.; Warner, M.E. Cities and sustainability: polycentric action and multilevel governance. Urban Aff. Rev. 2015, 51, 46–73. [Google Scholar] [CrossRef]
  48. Lee, Y.S.; Shin, H. Negotiating the polycentric city-region: Developmental state politics of new town development in the Seoul capital region. Urban Stud. 2012, 49, 1333–1355. [Google Scholar] [CrossRef]
  49. Mittelman, J.H. Global Bricolage: Emerging market powers and polycentric governance. Third World Q. 2013, 34, 23–37. [Google Scholar]
  50. Huang, X.; Li, Y.; Hay, I. Polycentric city-regions in the state-scalar politics of land development: The case of China. Land Use Policy 2016, 59, 168–175. [Google Scholar] [CrossRef]
  51. Rodrik, D.; Subramanian, A.; Trebbi, F. Institutions Rule: The Primacy of Institutions Over Geography and Integration in Economic Development. J. Econ. Growth 2004, 9, 131–165. [Google Scholar] [CrossRef]
  52. Wei, Y.D. Spatiality of regional inequality. Appl. Geogr. 2015, 61, 1–10. [Google Scholar] [CrossRef]
  53. Yue, W.; Liu, Y.; Fan, P. Polycentric Urban Development: The Case of Hangzhou. Environ. Plan. A 2010, 42, 563–577. [Google Scholar] [CrossRef]
  54. Zhao, M.; Chen, C. Polycentric Network Organization of Mega-City Regions in Yangtze River Delta. Procedia Earth Planet. Sci. 2011, 2, 309–314. [Google Scholar] [CrossRef] [Green Version]
  55. Li, Y.; Phelps, N. Megalopolis unbound: Knowledge collaboration and functional polycentricity within and beyond the Yangtze River Delta Region in China, 2014. Urban Stud. 2016, 55, 443–460. [Google Scholar] [CrossRef]
  56. Li, Y.; Liu, X. How did urban polycentricity and dispersion affect economic productivity? A case study of 306 Chinese cities. Landsc. Urban Plan. 2018, 173, 51–59. [Google Scholar] [CrossRef]
  57. Li, Y.; Phelps, N.A. Knowledge polycentricity and the evolving Yangtze River Delta megalopolis. Reg. Stud. 2017, 51, 1035–1047. [Google Scholar] [CrossRef]
  58. Luo, Z.; He, H.; Geng, L. Analysis of the polycentric structure of Yangtze River Delta based on passenger traffic flow. Urban Plan. Forum. 2011. Available online: http://en.cnki.com.cn/Article_en/CJFDTOTAL-CXGH201102005.htm (accessed on 29 May 2019).
  59. Li, Y.; Xiong, W.; Wang, X. Does polycentric and compact development alleviate urban traffic congestion? A case study of 98 Chinese cities. Cities 2019, 88, 100–111. [Google Scholar] [CrossRef]
  60. He, S.; Bayrak, M.M.; Lin, H.A. Comparative analysis of multi-scalar regional inequality in China. Geoforum 2017, 78, 1–11. [Google Scholar] [CrossRef]
  61. Andersson, K.P.; Ostrom, E. Analyzing decentralized resource regimes from a polycentric perspective. Policy Sci. 2008, 41, 71–93. [Google Scholar] [CrossRef]
  62. Wei, Y.D. Decentralization, marketization, and globalization: the triple processes underlying regional development in China. Asian Geogr. 2001, 20, 7–23. [Google Scholar] [CrossRef]
  63. Townsend, A.M. The Internet and the Rise of the New Network Cities, 1969–1999. Environ. Plan. B Plan. Des. 2001, 28, 39–58. [Google Scholar] [CrossRef]
Figure 1. The conceptual framework of triple transitions.
Sustainability 11 03106 g001
Figure 2. The Yangtze River Delta Urban Agglomeration (YRDUA).
Sustainability 11 03106 g002
Figure 3. (a) Change of GDP. (b) Change of population. (c) Change of urban income growth. (d) Change of rural income growth (2000–2013).
Sustainability 11 03106 g003
Figure 4. The correlation between population agglomeration and medical service level. (Note: The correlation coefficient (Pearson) between population agglomeration and certified doctors by city is 0.972, and that between population agglomeration and high-quality hospital is 0.977. All of them are significant at the 0.01 level.)
Sustainability 11 03106 g004
Figure 5. The linear approximation between population agglomeration and service level of higher education. (Note: The correlation coefficient (Pearson) between population agglomeration and Teachers in institutions of higher learning by city is 0.698, and that between population agglomeration and high-quality hospital is 0.664. All of them are significant at 0.01 level.) Data source: “China City Statistical Yearbook”, the Yangtze River Delta region of the national economic and social development statistics bulletin.
Sustainability 11 03106 g005
Figure 6. (a) Spatial distributions of number of doctors. (b) Spatial distribution of number of students enrolled. (c) Spatial distribution of key state laboratories. (d) Spatial distribution of R & D expenditure. Data sources: 2001 and 2015 Shanghai, Jiangsu, Zhejiang province and the city statistical yearbook.
Sustainability 11 03106 g006
Table 1. Cities in the Yangtze River Delta Urban Agglomeration (YRDUA).
CityProvince
Regional core city
ShanghaiNA
Regional central cities
Nanjing, Wuxi, SuzhouSouthern Jiangsu (Sunan)
Hangzhou, NingboNorthern Zhejiang (Zhebei)
Regional common cities
Nantong, Yangzhou, TaizhouCentral Jiangsu (Suzhong)
Changzhou, ZhenjiangSouthern Jiangsu (Sunan)
Taizhou, Jiaxing, Huzhou, Shaoxing, ZhoushanNorthern Zhejiang (Zhebei)
County-level cities
Gaoyou, Haimen, Jiangdu, Jiangyan, Jingjiang, Qidong, Rugao, Taixing, Xinghua, YizhengCentral Jiangsu (Suzhong)
Changshu, Danyang, Jiangyin, Jintan, Jurong, Kunshan, Liyang, Taicang, Wujiang, Yangzhong, Yixing, ZhangjiagangSouthern Jiangsu (Sunan)
Cixi, Fenghua, Fuyang, Haining, Jiande, Lin’an, Linhai, Pinghu, Shangyu, Shengzhou, Tongxiang, Wenling, Yuyao, ZhujiNorthern Zhejiang (Zhebei)
Table 2. State policies and the benefited cities.
State Preferential Policy Benefited Cities
Free Trade ZonesShanghai, Zhoushan
Promoting Pilot Programs of Comprehensive InnovationShanghai
National Innovation Pilot City (first round)Nanjing, Hangzhou, Suzhou, Wuxi
National Innovation Demonstration ZoneShanghai (Zhangjiang), Nanjing, Suzhou, Wuxi, Changzhou, Zhenjiang, Hangzhou (Xiaoshan), Ningbo
Comprehensive Pilot of Expanded the Reform and Opening up of the Service IndustryShanghai, Nanjing, Hangzhou, Ningbo
Deepening the Financial System ReformShanghai, Hangzhou, Nanjing, Suzhou, Ningbo, Wuxi, Changzhou
National E-Commerce Demonstration BasesShanghai, Nanjing, Hangzhou, Ningbo, Szuhou, Changzhou, Teizhou
Service Outsourcing Demonstration CitiesShanghai, Nanjing, Hangzhou, Suzhou, Ningbo, Wuxi, Zhenjiang, Nantong
Comprehensive Pilot Program on Domestic Trade Distribution System Reform and DevelopmentShanghai, Nanjing
Pilot Administrative Measures for Consumer Finance CompaniesShanghai, Nanjing, Hangzhou
State-level New AreasShanghai (Pudong), Nanjing (Jiangbei), Zhoushan
Promoting Pilot on the Reform on Rural LandShanghai (Songjiang), Changzhou (Wujin), Huzhou (Deqing)
Pilot Project to Build Low-carbon CitiesShanghai, Hangzhou, Suzhou, Ningbo, Zhenjiang
Table 3. Changes of GDP and population in the Yangtze River Delta (YRD) region (2000–2013).
Cities in the YRD 20002013Change
TotalProportion to the Total (16,202)TotalProportion to the Total (97,759)
GDP(in billion)(%)(in billion)(%)(%)
Regional core city 4551.228.221,349.821.8−6.4
Regional central cities3841.423.825,832.226.42.6
Other regional cities1865.111.612,009.112.61.0
County-level cities 5948.936.438,568.239.22.8
Total16,202 97,759
TotalProportion to the total (8742)TotalProportion to the total (10,985)
Population(in million)(%)(in million)(%)(%)
Regional core city 1575.818.62345.421.42.8
Regional central cities1735.020.52501.422.82.3
Other regional cities1107.813.11407.212.8−0.3
County-level cities 4324.547.84723.243.0−4.8
Total8742 10,985
Table 4. Changes of urban and rural residents’ income from 2000 to 2013.
Cities Disposable Income of Urban Residents (RMB)Net Income of Rural Residents (RMB)
20002013Increase (%)20002013Increase (%)
Core cityShanghai18,64543,815135.0834219,208130.3
Regional central cities Nanjing14,99739,881165.9742625,647245.4
Hangzhou16,60141,262148.6867923,077165.9
Wuxi16,00537,971137.2767224,696221.9
Suzhou16,27641,143152.8843725,197198.6
Ningbo1740841,729139.7832922,605171.4
Other regional citiesChangzhou14,58936,946153.2751723,090207.2
Nantong12,38433,136167.6633320,978231.2
Yangzhou11,37930,690169.7695019,153175.6
Zhenjiang12,39432,352161.0704320,985198.0
Taizhou11,12230,069170.4558418,874238.0
Jiaxing15,55536,743136.2793620,149153.9
Huzhou15,56136,796136.5737219,570165.5
Shaoxing17,31937,881118.7895020,873133.2
Zhoushan15,86341,079159.0734220,589180.4
Teizhou18,31339,123113.6763017,926134.9
County-level city median 14,69835,004149.0685217,589162.0
Table 5. Access to Shanghai from main cities in the YRD.
City Shortest Road/Express Way (Mileage/km)Travel by Car (Time/Hour)Direct Access by Passenger Rail Transit (In Hour)
Nanjing 298.0 3.0 1.3
Wuxi135.0 1.4 0.5
Changzhou177.0 1.8 0.7
Suzhou108.0 1.1 0.4
Nantong128.0 1.3 No direct train
Yangzhou282.0 2.8 6.0
Zhenjiang248.0 2.5 1.0
Taizhou233.0 2.3 7.0
Hangzhou176.0 1.8 1.0
Ningbo214.0 2.1 2.0
Jiaxing108.0 1.1 0.5
Huzhou149.0 1.5 2.0
Shaoxing199.0 2.0 1.4
Zhoushan287.0 2.9 No direct train
Teizhou370.0 3.7 3.2
Data source: 12306 China Railway (https://kyfw.12306.cn) and Baidu Map (https://map.baidu.com).

