Article

A Bibliometric Analysis of Research on Acid Rain

1
Department of Ecology, College of Natural Resources and Environment, South China Agricultural University, Guangzhou 510642, China
2
Key Laboratory of Agro-Environment in the Tropics, Ministry of Agriculture, South China Agricultural University, Guangzhou 510642, China
3
Guangdong Engineering Research Center for Modern Eco-agriculture and Circular Agriculture, Guangzhou 510642, China
4
Guangdong Provincial Key Laboratory of Eco-Circular Agriculture, Guangzhou 510642, China
*
Author to whom correspondence should be addressed.
Sustainability 2019, 11(11), 3077; https://doi.org/10.3390/su11113077
Submission received: 10 April 2019 / Revised: 12 May 2019 / Accepted: 26 May 2019 / Published: 31 May 2019

Abstract

:
With the continuation of industrialization and urbanization, acid rain (AR) has aroused extensive concern because of its potential negative effects on ecosystems. However, analysis of the current status and development trends in AR research area has seldom been systematically studied. Therefore, we motivated to conduct a bibliometric analysis of AR publications (1900–2018) using HistCite and CiteSpace software programs. Compared to traditional reviews by experts, this study offers an alternative method to quantitatively analyze and visualize the development of AR field at a large time scale. The results indicated that the overall concern of AR research studies had increased from 1900 to 2018. The most productive country was the United States, while the institution with the most publications was Chinese Academy of Sciences. “Environmental Sciences” was the most popular subject category, Water, Air, and Soil Pollution was the dominant journal, and C.T. Driscoll was the most prominent author in AR field. There were three hotspots in the field of AR, including analyzing AR status and its control policies in Europe, the United States, and China in the past few decades, investigating the ecological consequences of AR on plant histological, physiological, and biochemical traits, as well as surface water and soil properties, and the model application for quantitatively assessing AR and its effects on terrestrial and aquatic ecosystems at regional scale. Further, “behavior”, “phosphorus”, “fractionation”, “soil acidification”, “corrosion”, “performance”, “recovery”, “rainwater”, “trace element”, and “surface water” have been emerging active topics in recent years. This study can help new researchers to find out the most relevant subject categories, countries, institutions, journals, authors, and articles, and identify research trends and frontiers in the field of AR.

1. Introduction

Acid rain (AR) primarily results from emissions of sulphur- (S) and nitrogen- (N) containing oxides from extensive fossil fuel combustion, including electricity generators, vehicles, heavy equipment, manufacturing, and oil refineries [1,2]. In North America, Central Europe, and Southeast Asia, AR has been a severe environmental issue for decades, and therefore has received much attention [1,3]. In North America and Europe, the emissions of SO2 have been decreasing from 1990 to 2016 due to many international agreements, such as Clean Air Act and Convention on Long-range Transboundary Air Pollution [2,4]. In contrast, NOX emission keeps increasing because of the increasing amount of vehicles, and therefore makes greater contributions to the occurrence of AR, which has been changing the ion components of AR, e.g., from SO42− to NO3 dominant [5,6]. Unlike in North America and Europe, emissions of SO2 and NOX have been rapidly increasing simultaneously in Asia due to intensive industrialization- and urbanization-induced energy consumption [7,8,9]. Owing to cost and technique limitations, acidic particles and gases are directly emitted into the atmosphere in many territories [10]. With China as an example, annual S and N emissions from coal combustion, fertilizer applications, and livestock (NH3) were rapidly increasing until 2006, and thereafter remained steady or declined slightly [11]. As a result, AR frequently occurs in southern and southwestern China [12], and most acid-vulnerable areas in southern China were covered by AR with pH values below 5.0 [13]. Therefore, central and southern China has become the third most-severe AR region in the world [14].
The first AR-related literature was published in 1900 by Caro [15], and since then the field of AR has emerged as a hotspot, which attracted numerous researchers involved in environmental sciences, meteorology atmospheric sciences, plant sciences, and water resources and ecology, and a huge amount of literatures is available. In previous studies, AR has been shown to bring about various ecological and economic consequences, and has therefore been regarded as an invisible plague in the industrial age [16]. In natural ecosystems, AR harms plants by damaging the morphological structure [17,18], depressing the physiological activities [16,18,19,20,21] and plant productivity [17,19], eventually leading to canopy cover reduction, crown dieback, and whole tree death [22]. Soil is the final receiver of atmospheric acid deposition. AR can cause soil acidification, and increase the exchange between hydrogen ion (H+) and nutrient cations (such as K+, Na+, Mg2+, and Ca2+) and metal ions (such as Al, Pb, Hg, and Cd) in the soil [23,24]. Then, these cations are liberated into soil and can be rapidly leached out [25], which ultimately results in soil nutrient deficiency and metal toxicity to plants, animals, and microorganisms [24]. Compared with plants and soil, streams and lakes have less capability to buffer the acid stress derived from extra atmospheric inputs [16]. As a result of AR, water acidification in lakes and rivers further leads to death of fish and other aquatic organisms [26]. AR also negatively affects statues, buildings, and other manmade structures by corroding their surfaces, subsequently causing deterioration more quickly [16]. With continuous high acid deposition, future endeavors are needed to fully dissect the profound effects of AR on ecosystems and its underlying mechanisms, which will promote us to tackle AR challenges globally in a sustainable way.
However, there are very few research studies that have contributed to the following aspects: (1) Which subject category is the most popular in the AR domain? (2) Which country and institution is the most active contributor to AR research? (3) Which journal and author is most representative in the AR field? (4) What are the research hotspots, the emerging topics, and development in this research area? Answers to these questions are conductive to providing a comprehensive insight into AR research domain and ultimately proposing the future research directions and focus. Although some empirical and qualitative review articles by experts have offered an overview of AR research, they are limited in some specific aspects, such as regions, ecosystems, and subjects [1,12,27,28], or need to be updated [16]. Moreover, it is very difficult to effectively organize, summarize, and quantitatively analyze the development of a specific field among a large amount of literature studies on a large time scale in traditional review articles. Therefore, bibliometrics serve as an alternative and available method for exploring research progress in a field, which includes qualitative and quantitative analysis of publications indexed by databases based on statistics, computing technology, and networks among countries and institutions collaborations, co-authorship and co-occurring categories, and keywords [29,30,31]. For these reasons, we are motivated to provide a comprehensive and systematic perspective on the research of AR based on the bibliometric method. Compared to traditional reviews, this study is a new attempt to review and visualize the development of the AR research field over a large time scale. This work will further advance both the development of the AR research area and the application of bibliometric analysis. Through different aspects of analysis, the knowledge domains, research hotspots, and emerging trends in the AR field can be uncovered. Among various tools used in bibliometrics, HistCite and CiteSpace are two widely used software programs in many disciplines, including policy, food safety, environment science, etc. For example, Yu et al. [32] applied CiteSpace to analyze the current state and explore the development trends in carbon emission trading area based on a co-citation analysis. Sun et al. [33] provided an insight into stage-based characteristics of research on polycyclic aromatic hydrocarbons in food with cluster analysis and citation analysis using CiteSpace and HistCite. Ouyang et al. [34] applied keyword co-word analysis and term co-occurrence analysis to investigate the knowledge structure of heavy metal loss from agricultural watersheds to aquatic systems and presented the global development trends.
Given the circumstances of continuous and steady increase of attention and publications, AR still remains a hotspot in the academic community. It is necessary and urgent to summarize the current research status, the development trends, as well as the research frontier in this domain. Specifically, HistCite tool was used to evaluate research outputs and citations, authors, and research hotspots. Meanwhile, CiteSpace software was applied to visualize the collaboration networks among countries, institutions, and authors.

2. Materials and Methods

2.1. Data Collection

Literatures were collected from Web of Science Core Collection on 26 April 2019. The search strategy for the data was set as: Search term is topic, TS = (“acid rain” OR “acid deposition” OR “acid precipitation” OR “acidic rain” OR “acidic deposition” OR “acidic precipitation”), which includes the common expressions of AR. These terms will appear in the title, abstract, author keywords and keywords plus of publications, which ensures that the literatures are related to AR as much as possible. The timespan is from 1900–2018. The chosen databases are Science Citation Index Expanded (SCI-E) and Social Sciences Citation Index (SSCI). Finally, a total of 10,164 records that consist of articles, proceedings papers, reviews, editorial material, and letters were obtained. These data were downloaded and exported as a text-based format, including full records and cited references.

2.2. Analysis Tools and Methods

Theses text-based files are subsequently imported in HistCite to analyze document types and languages, outputs and citations, the dominant journals and prominent authors, and the citation network regarding the 50 most-cited articles in HistCite [30]. Due to a format problem, 7 studies were lost in the process of importing the data to the HistCite software. Two indices, i.e., Local Citation Score (LCS) and Global Citation Score (GCS), were available to evaluate the significance of each literature in HistCite. The former indicates the total citation number of a given literature by those literatures that have a similar topic within 10,164 records, while the latter represents those in the entire Web of Science database, regardless of the research fields. Therefore, a high LCS indicates high importance in its professional field, while a high GCS means that this literature attracts worldwide attention that is independent of the specialty of readers. That is to say, a literature with a high GCS possibly has a low LCS. It is considered that LCS has relatively higher reference value than GCS [30]. Finally, the articles and authors were ranked based on the total local citation score (TLCS) and the total local citation score excluding self-citations (TLCSX), respectively.
In terms of the network analysis (subject categories, countries, institutions, and authors) and burst detection (keywords, countries, institutions, and authors), we carried out through CiteSpace (version 5.2.R2) [29]. The parameters in CiteSpace were set as: (1) Time slicing was from 1980 to 2018, years per slice = 1. This mainly referred to the research outputs from 1900–2018. In the period of 1900–1980, the AR publications were discontinuous and sporadic. Therefore, we excluded this period and choose 1980–2018 for visual analysis; (2) Node type = country, institution, category, author, keyword; (3) We selected top 50 levels of most-cited or occurred items from each slice for countries, institutions, categories, and keyword. This criterion was recommended in many previous studies [34,35]. For the author, we selected top 20 levels of most-cited or frequently occurring items from each slice, which ensured that we obtained the most prominent author; (4) Pruning = pathfinder and pruning of the merged network. To obtain the most salient network, we chose pathfinder to eliminate redundant or counterintuitive connections [36]. Other settings remain the default. As for the collaboration networks, author co-occurrences, country co-occurrences, and institution co-occurrences, we took authors’ names, countries of affiliation, and institutional affiliations as the units of analysis [36]. If there were more than one author within the same country, only the first one was included in the analysis [37]. In the single author articles, the author was designated as both the first author and corresponding author [38].
Many studies have proposed that term-based analyses are more reliable for interpreting the knowledge domains and provide more explicit information compared to co-word analysis [39]. Therefore, noun phrase term-based analysis was incorporated in this work. However, noise was not completely avoided in the topic search in our work; in some cases, the collected texts are possibly irrelevant to the AR subject. In many previous studies, “abstract” and “keywords plus” contained too much noise to generate accurate results [38,39]. Therefore, we decided to exclude the above two term sources and used “title” and “keywords” as the term sources and Part-of-Speech Tagging was utilized to extract the noun phrases from all the titles and keywords in the term-based analysis.

3. Results and Discussion

3.1. Document Types and Languages

As Figure 1 showed, the literatures were categorized into 12 document types. Articles are the dominant document type (accounting for up to 76.8% of the total publications), indicating that it is the main approach for scientific communication in this field. In addition, proceeding papers and reviews contributed 8.7% and 3.9% to the total publications, respectively, and were therefore two other important communication channels. The literatures were published in 18 languages, with English undoubtedly dominating and accounting for 98.1% of the total records. The explanation is that English still remains widely-accepted and the most popular language used for communications in the academic community.

3.2. Research Outputs and Citation

A total of 10,164 publications on AR were retrieved in this study, with the first one being indexed in 1900 [15]. AR had not drawn much attention until the 1980s because few records were available before then (Figure 2). Thereafter, it was recognized as a global environmental issue and started to receive extensive attention. However, it is interesting that there are two peaks regarding AR publications from 1980–2018 (Figure 2). We can divide the development process of AR research into three stages. The first stage is from 1980 to 1989, where AR publication experienced an exponential increase from 1980 (20) to 1983 (260), and then a decrease from 1984 to 1989 (149). In central and northwestern Europe and the northeastern United States, acid precipitation occurred as a widespread phenomenon around the 1960s [40,41]. After that the visible and perceived effects of AR on ecosystems, including damage to plant growth and interference to aquatic organisms, were investigated [40,42]. Therefore, AR has attracted numerous researchers to study its effects on vegetation and chemical changes of soil and surface water since 1980 [25,28,40,43,44,45]. From 1984 to 1989, the focus of AR research was slightly shifted to model application for estimating and assessing temporal and spatial variations in the status and effects of acid deposition [46,47,48]. The second stage is the period of 1990–2001. As we know, the signing of the 1990 Clean Air Act amendments is a milestone among many international agreements [27]. These laws and agreements promoted AR research to control SO2 and NOX emissions and reduce AR. Therefore, AR reached a critical stage in its development during the period 1990–2001. However, the number of AR publications in this period fluctuated, and the year of 1995, notably, was the most active year, with the highest records (434). This result can be attributed to the influence and promotion of previous research studies to produce a peak in 1995. After 2001, as the third stage, more than 200 papers were published each year and the record revealed a stable and continuous increase, indicating that “AR” remains a hotspot in ecological researches.
Regarding the annual total local citations, the TLCS was “bell-shaped” over time and shifted consistently with the records (Figure 2). This result indicated that the higher records, the more citations. The TLCS reached peaks in 1985 (1238) and 1995 (2230), indicating that some highly-cited publications appeared in these years. For instance, two highly-cited papers related to model application in the AR field were published in 1985 [47,48]. The paper titled “A new mechanism for calcium loss in forest-floor soils” is another highly-cited paper published in top journal Nature in 1995 [49]. However, the TLCS rapidly declined after 2005. The sharp falloff of TLCS since 2005 does not necessarily signify that there were no high-quality articles, but rather that it always requires several decades for articles to be recognized and widely cited [50].

3.3. Subject Categories Co-Qccurring Analysis

The research studies on AR involved in 195 subject categories. Table 1 presents the top 10 subject categories in the AR area. It is clear that “Environmental Sciences” is the most popular subject category with 3885 publications, which accounts for 38.22% of the total publications. The second subject category is “Meteorology Atmospheric Sciences” with 1756 publications, followed by “Water Resources”, “Engineering Environmental”, “Plant Sciences”, “Ecology”, “Geosciences Multidisciplinary”, “Forestry”, “Multidisciplinary Sciences”, and “Chemistry Multidisciplinary”. AR was preliminarily regarded as an environmental problem, but it has subsequently been extended to various fields with the expansion of the AR area and deterioration of AR hazards.
Figure 3 presents co-occurring networks of the subject categories. We found that AR research is a multidisciplinary and interdisciplinary field that has infiltrated into various subjects, from environmental science to materials science, energy and fuels, physics, etc. This result indicates that AR is an integrated problem that is involved in multifaceted aspects. From Figure 3, we found that Materials Science emerged as an intermediary and core role, which connected with many different subject categories, including Forestry, Agronomy, and Water Resources. This result reflects the profound effects of AR and it required joint efforts from different research areas to solve such a global problem.

3.4. Countries and Institutions Research Outputs and Collaborations

3.4.1. Countries Research Outputs and Collaborations

The analysis of each country’s research output is conductive to comprehending the global geographic distribution of AR publications and picking out the most active contributor to AR research. As a result, 118 countries and regions (50.6% of the total amount of countries and regions around the world) contributed to the research output of AR (Figure 4), indicating that AR has been a global challenge and attracted extensive attention. However, the geographical distribution was very uneven, being centralized in several dominant countries and regions, whereas some other countries made limited contributions (Figure 4). The United States and China were the two main contributors in the AR field, as indicated by the reddest color in Figure 4. This result can be attributed to the serious AR status in the United States and Asia meaning that it deserves more attention, along with economic and social development. From Table 2, the rest of the top 10 most productive countries were Canada, England, Japan, Germany, Sweden, Norway, the Netherlands, and Finland, in which the amount of records occupied 72.3% of the total records. All of these countries were developed countries, except for People’s Republic of China (PR China). To meet the development of economic growth and reduction of environmental problems (such as AR), the research on the AR problem has become extremely crucial and urgent for the largest developing country because the complexity and scale of the AR problem has become increasingly prominent in the social and economic development process. AR has been considered as one of the high-priority areas for the Chinese government and researchers [12]. Moreover, these top countries are all located in the three AR centers and have more or less been covered by acid rain for a long time [24].
Moreover, the academic cooperation among countries and territories in the AR field is shown in Figure 5. It is evident that the connections between countries were not dense. Though the United States, PR China, and Canada were the most productive countries, they had few interrelations with other countries and territories. This result indicates that the collaborations between many countries were insufficient in the AR field and most of the cooperation occurred in domestic areas. However, the European countries had close cooperation with each other. Among these countries and regions, Switzerland, Poland, and Slovakia had the highest centrality value (0.84, 0.61 and 0.50, respectively. Table 2), which played a core and intermediary role in the AR research domain and acted as a bridge connecting countries. However, the centrality value of PR China was only 0.10, which indicated that its international academic influence was relatively weak in this field. From the color of the annual rings of nodes (blue for the earliest cooperation and red for the most recent cooperation), we found the United States was the earliest contributor to AR research and most of the scientific research on AR effects was initially conducted in the United States. Then, Canada, Japan, and PR China followed the United States and started to deal with the AR problem.

3.4.2. Institutions’ Research Outputs and Collaborations

An analysis of institutions’ research outputs can help us to realize the research capacity and potential of institutions around the world and encourage us to identify the leading institutions in AR research. As shown in Table 3, the most productive institution was the Chinese Academy of Sciences, which was far ahead with 328 records. Occupying the second position was United States Forest Service (208 publications), which was followed by Cornell University (USA), United States Environmental Protection Agency (USA), United States Geological Survey (USA), Syracuse University (USA), Swedish University of Agricultural Sciences (Sweden), Norwegian Institute for Water Research (Norway), Environment Canada (Canada), and University of Virginia (USA). Among the above 10 mentioned institutions, seven institutions are located in North America, while Asia and Europe had one and two top institutions, respectively. It should be pointed out that 6 top institutions came from the United States, which implied the United States was certainly a dominant pioneer in AR research. This meant that researchers of these regions devoted a large number of resources to AR research due to the severity of the AR situation [24]. Though England, Japan, Germany, Netherlands, and Finland were the most productive countries in the AR research area, publications were not centralized in any one institution in these countries, suggesting many research groups in different organizations are concerned with the AR problem.
Furthermore, the academic collaborations among institutions are shown in Figure 6. United States Environmental Protection Agency (USA) had the highest centrality value (0.20, Table 3), which occupied a key position in the AR research area and had the closest cooperation with other institutions, especially with United States Forest Service and Syracuse University. Obviously, almost all institutions tend to cooperate with other institutions in this field. However, the intensity of cooperation varies greatly among institutions. For instance, Chinese Academy of Sciences is loosely connected with other institutions, though it owned the most AR publications, indicating that its studies were relatively independent. Therefore, the cooperation between many institutions still needs to be enhanced and strengthened to some extent. From the color of links, we also found that the inter-institutional research collaborations among Cornell University, North Carolina State University, Oak Ridge National Laboratory, and United States Forest Service were the earliest.

3.5. Dominant Journals

AR publications are disseminated across 2018 journals. Table 4 lists the top 10 journals that have the most publications, with a total of 2330 articles (22.9%) published. In particular, Water, Air, and Soil Pollution contains 706 records (7.0% of the total records) and was ranked the first, and the following four major journals were Atmospheric Environment, Environmental Pollution, Science of the Total Environment and Environmental Science and Technology, with 413, 248, 212, and 205 records, respectively (4.1%, 2.4%, 2.1%, and 2.0%, respectively). According to the main research areas of the top 10 record journals, AR research studies were concentrated in water resources, environmental science, atmospheric science, forestry, geosciences, and chemistry, suggesting that researchers in these disciplines paid more attention to studying AR. This was basically consistent with the results in Table 1.

3.6. Prominent Authors and Collaborations

The overall influence of authors was indicated by the TLCSX, an index with self-citations excluded for any given author. The results showed that C.T. Driscoll was the most influential researcher in this field, while the second and third high-impact authors were G.E. Likens and R.F. Wright (Table 5). However, the TLCSx of Likens is much higher than that of Wright, in spite of their records being comparable. This result can help us to find out the classic and excellent publications in the AR field by following theses top authors. Among the top 10 authors, seven authors came from United States, which reflected its importance in the AR field.
Figure 7 displayed the collaboration network of authors in the AR field. It is obvious that frequent author cooperation occurred in the AR field and numerous authors tended to have a stable cooperative relationship with some specific authors. Also, we found that there are many clusters consisting of some core authors, which can be regarded as the representative and active research groups within the AR domain that can provide highly individualized scientific references to other relevant researchers [34]. Also, it will be conductive to detecting the leading research groups in this area, for example, the group with Driscoll, the group with Cosby, and the group with Larssen. According to the color of the links, which represent the corresponding collaboration time, we found that authors from China started to study the AR problem relatively late and most authors collaborations occurred after 2010.

3.7. Research Hotspots in AR Domain

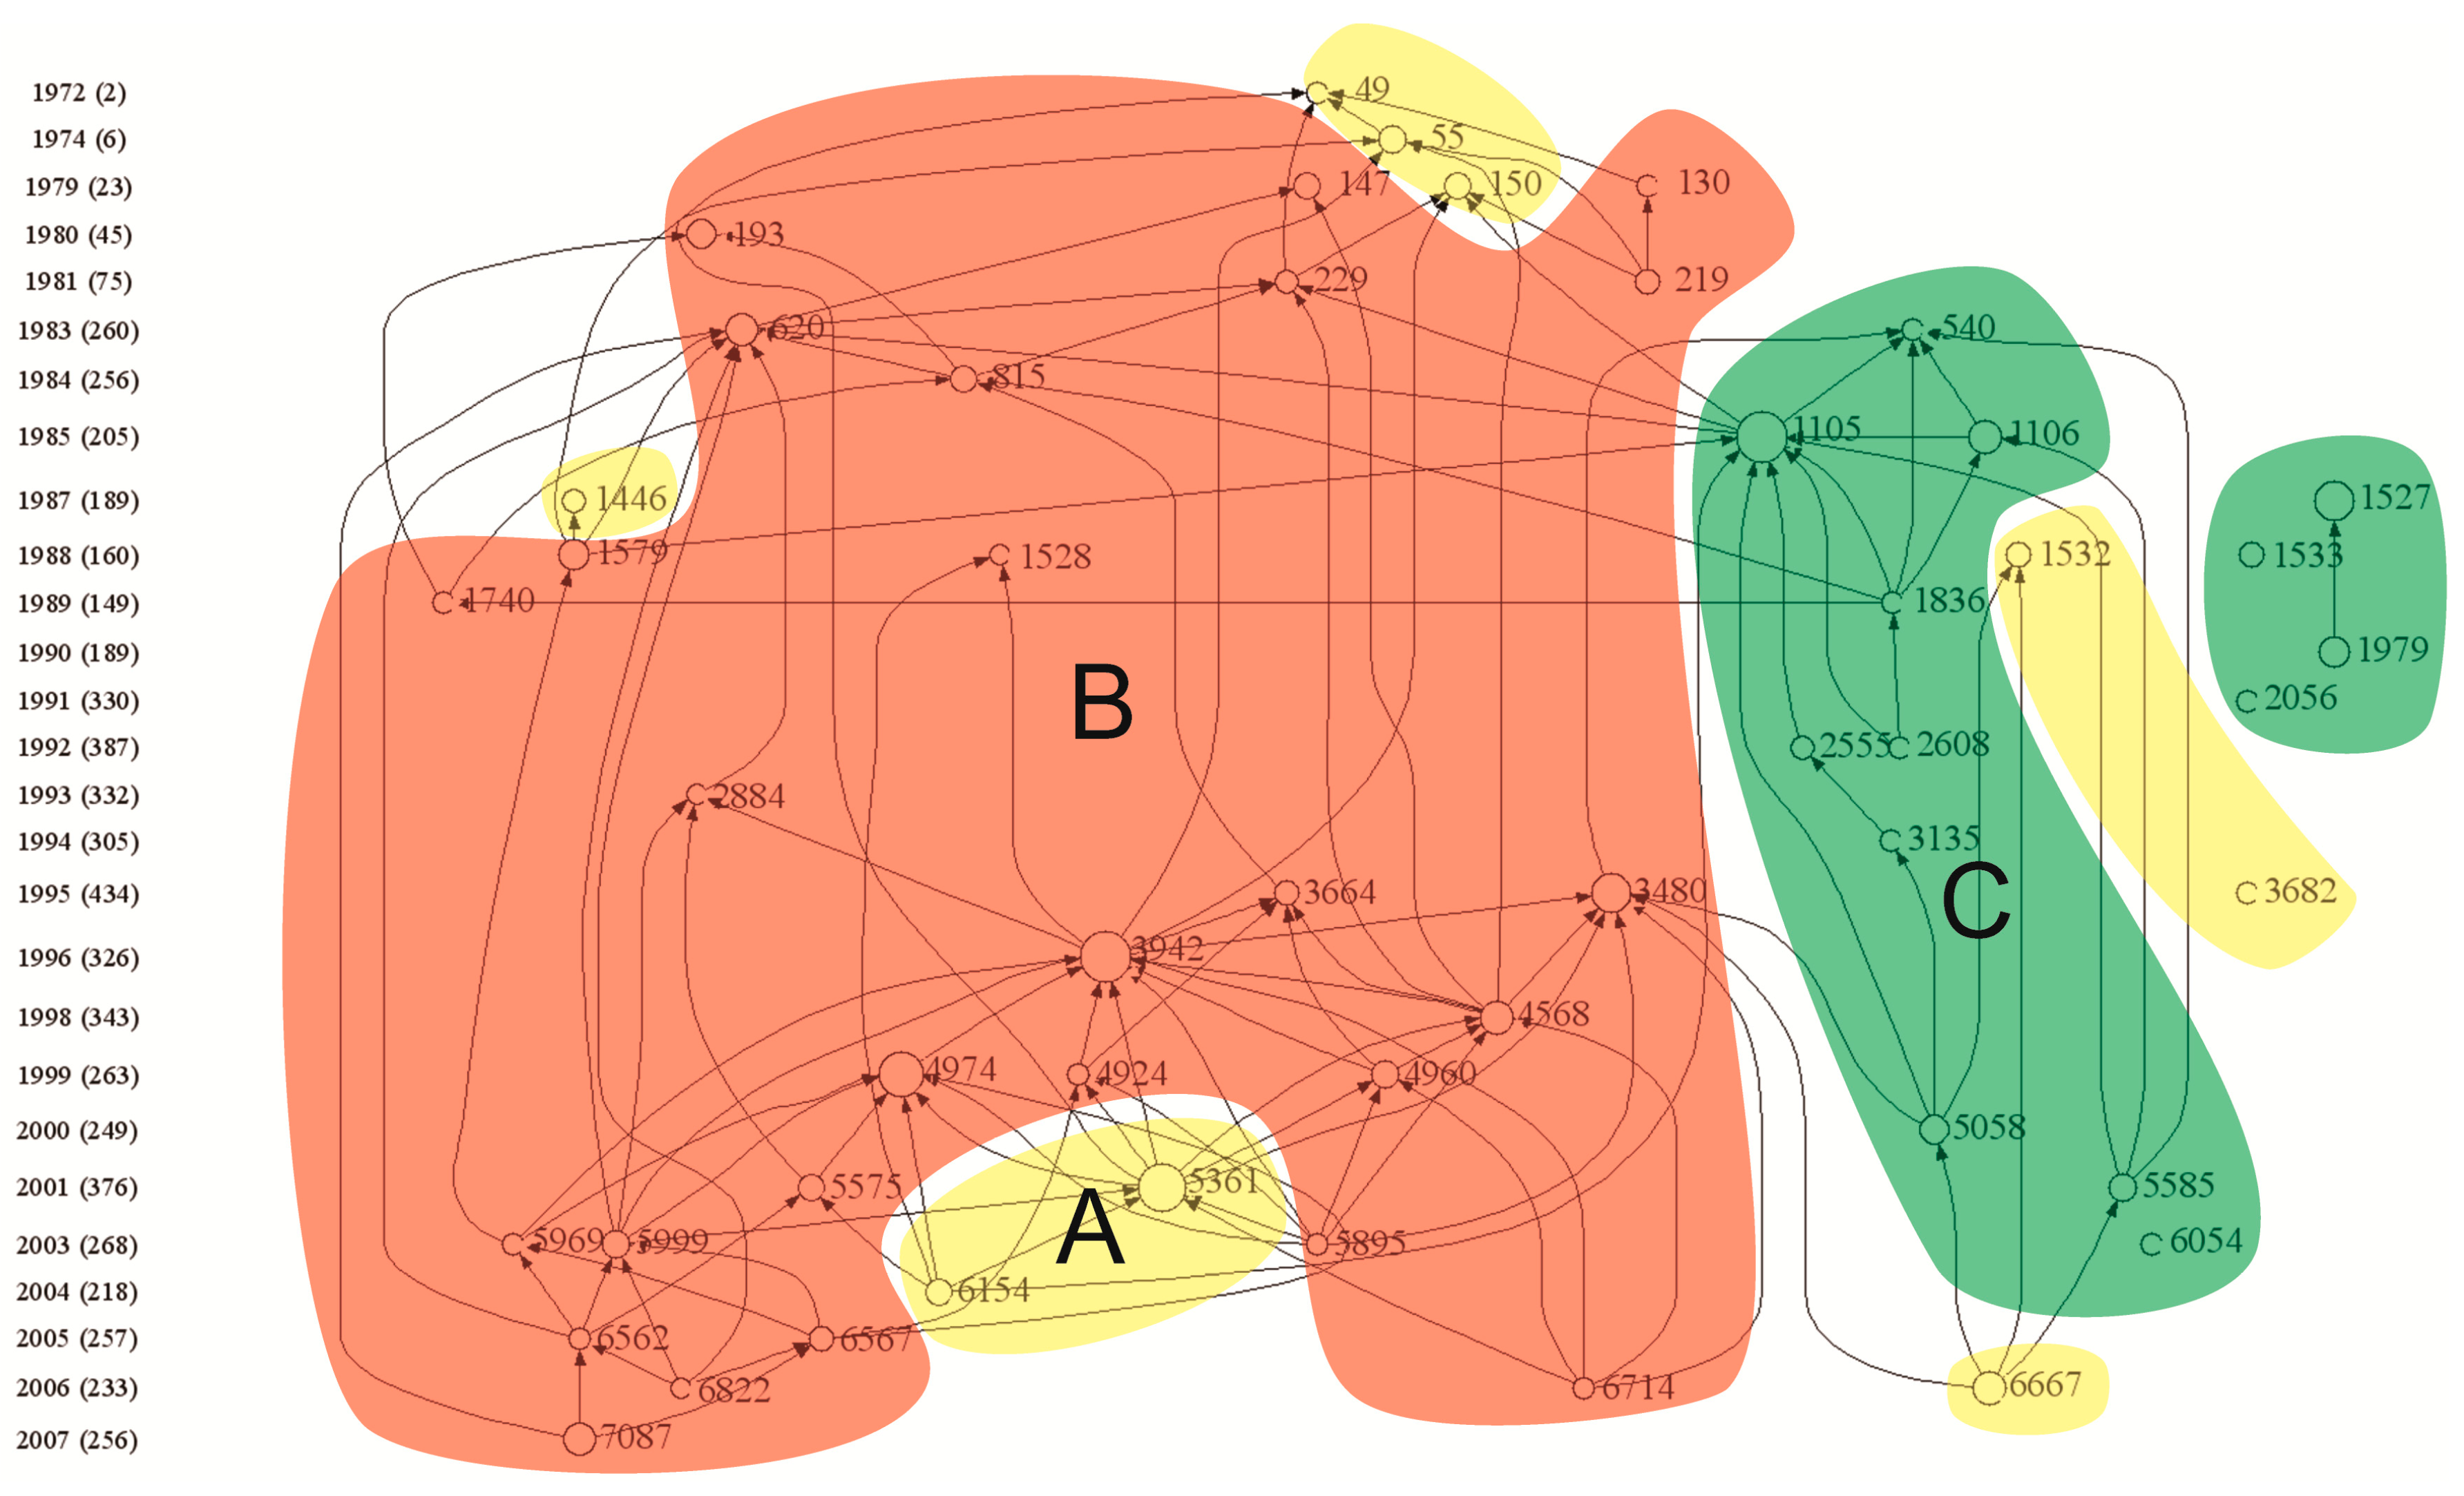
Through the citation network analysis on the highly cited articles, we can comprehend the status of development over time and identify the research hotspots in this area. As shown in Figure 8, we selected the top 50 most cited publications in the AR research area to construct the citation network. According to the topics and contents of these papers, all of the 50 highly cited publications can be categorized into three relatively isolated panels (A, B, and C) that represent three research hotspots.
The hotspot A (marked in yellow) reviewed the status of AR and its control policies in Europe, the United States, and China over the past decades. It began with three papers (node 49, 55, and 150). The first highly cited paper (49) pointed out that rain and snow had been increasingly more acidic in northwestern Europe due to increasing emissions of sulfur and nitrogen oxides, which resulted in precipitation with pH values between 3 and 5 [41]. Then, another paper (55) published in the top journal Science revealed that acid deposition encompassed most of the northeastern United States with a pH value below 4.4 due to the industrial source in the Midwest, and H2SO4, HNO3, and HCl accordingly contributed 65%, 30%, and less than 5% of the acidity in acid deposition, respectively [51]. Thereafter, Likens et al. (150) [52] reported that the acidity of precipitation had increased sharply in northwestern Europe and eastern North America in the past decades and this trend was closely linked to the emissions of sulfur and nitrogen oxides due to fossil fuel combustion. Subsequently, Zhao’s paper (1532) [53] provided an overview of the serious AR situation in China and illustrated that approximately 90% of areas were covered by AR in the south of the Yangtze River in China, especially in Sichuan, Guizhou, and Jiangxi provinces. Moreover, they found NH4+ and Ca2+ were the major cations, while anions were dominated by SO42− and the occurrence of AR depended not only on high SO2 emission in the atmosphere, but also upon the amount of alkaline substances available, which acted as neutralizers (such as alkaline dust and NH3). Galloway (3682) [54] concluded that the emissions of SO2, NOX, and NH3 would substantially increase in the developing world in the future. By 2020, the total amount of these source emissions in Asia would possibly be equal to, or greater than, the sum of Europe and North America. Recently, China has developed a policy for AR mitigation by adopting a 20% emission reduction goal from 1995 to 2010 within the AR control zone and great efforts have been made to improve the awareness of AR and related effects in China [12]. In Europe and the United States, many policies, such as the Clean Air Act (CAA), adopted in 1970 and the Convention on Long-range Transboundary Air Pollution (LRTAP), signed in 1979, have been implemented to control air pollution and reduce AR in the past decades [27]. What is more, to evaluate an overall development status of AR in United States, Driscoll et al. [55] made a comprehensive review from the following aspects: sources and inputs, ecosystem effects, and management strategies, which received the most citations in this hotspot.
Due to the implementation of AR control policy and reduction measures in North America, Europe, and Asia, the basic research studies on AR were required to support the formulation of AR control policy and air pollution reduction measures. Based on this background, studies focused on the ecological consequences of AR on plant histological, physiological, and biochemical traits, as well as surface water and soil properties had become another hotspot (B, marked in red). This research hotspot started with two studies. One is Evans’s paper (130), in which the authors investigated leaf surfaces and anatomical lesions under simulated AR and found that the sensitivity and alterations of plants foliage to AR mainly depended on the plant species [42]. Another highly-cited paper (147) published in Science revealed that soil leaching and mineral weathering by acid precipitation were two dominant contributions to high concentrations of dissolved aluminum being transferred to surface and ground waters in the United States and Europe, which consequently led to aquatic organism mortality [56]. However, there was still controversy on the effects of AR, with some researchers concluding that AR acidified soil and surface water, while others claiming that sometimes internal protons in soil could overshadow the effects of AR. Based on this fact, many researchers started to clarify which source was dominant among the atmospheric acid inputs (external hydrogen ions) and internal protons (cation assimilation and organic acid deprotonation) [25,28]. In acidic soils, external protons (H+) usually exceed internal loading, leading to soil acidification by Al dissolution and sulphate retention [25]. Following this, Schindler [57] synthesized some possible mechanisms that led to acidification in lakes and freshwater. After that, a new mechanism for acidification in lakes and streams was proposed. Aluminum-induced reductions of Ca storage in soil resulted in decreased neutralization of drainage waters, thereby leading to acidification of lakes and streams [49]. Likens proposed that the recovery of soil and stream water chemistry was significantly delayed because of a large amount of Ca and Mg lost from soil and leached out, although the atmospheric acid deposition decreased [58], which received 335 LCS and ranked the first, as shown in supplementary Table S1. Since then, DeHayes et al. (4960) revealed the mechanism on how AR altered the foliar Ca pool in red spruce and attributed this physiological disruption to enhanced freezing injury susceptibility under AR [59]. Although emissions regulations had contributed to declining acid deposition in North America and Europe, recovery of surface water chemistry was insufficient because the substantial decline of base-cation concentration exceeded the decrease of sulphate concentration [60]. Further research revealed that the effect of AR on cation leaching depended not only on the pH of AR but also on the original soil pH [24]. Lately, an increase of dissolved organic carbon (DOC) concentration in surface water and its mechanisms have aroused much attention. Monteith et al. (7087) [61] demonstrated that the increase of DOC concentration was proportional to the rate of the decline of atmospheric sulphur deposition. Because of co-occurrence of AR and other pollutants (such as heavy metal pollution) in the AR zone, the research on the interactions among AR and other pollution emerged as a new trend in the AR field [57,62]. For instance, Wen et al. considered the combined effects of lanthanumion and AR on the growth, photosynthesis, and chloroplast ultrastructure of soybean seedlings, because AR can change the bioavailability of lanthanumion in soil [62].
In the process of AR research development, model applications for quantitatively assessing the acid deposition and its effects on terrestrial and aquatic ecosystems at regional scale became the third hotspot (C, marked in green). Nodes 1105 and 1106 were two representative articles, in which a conceptual model was built to estimate the gross chemical changes in the soil, soil water, and surface water of the catchment under acid deposition. This model used a lumped-parameter to represent the complex soil chemical processes and the predicted values of soil properties (such as pH and base saturation) were reliably consistent with the measurements [47,48]. Then, Chang et al. [46] developed a three-dimensional Eulerian model to evaluate chemical components of acid deposition in North America, especially to determine the relative contribution among physical and chemical processes to acid deposition. Soon after, Stockwell [63] presented the second generation Regional Acid Deposition Model (RADM2) for modeling atmospheric chemistry on a regional scale and it was proven to reliably predict sulfate and nitric acid concentrations. In the early 2000s, The Model of Acidification of Groundwater In Catchments (MAGIC model) was applied to predict soil acidification in southwest China and it was found that serious soil acidification had been going on over the last several decades [64,65]. Further, the long-term (1880–2030) trends of SO2, NOX, and NH3 in European freshwater sensitive regions had been calculated. The results showed that SO2, NOX, and NH3 will accordingly decrease 66%, 45%, and 16% until 2030 [66]. In this hotspot, many models had been proposed, adjusted, upgraded, and implemented to predict the trend of AR and its effects on a regional scale.

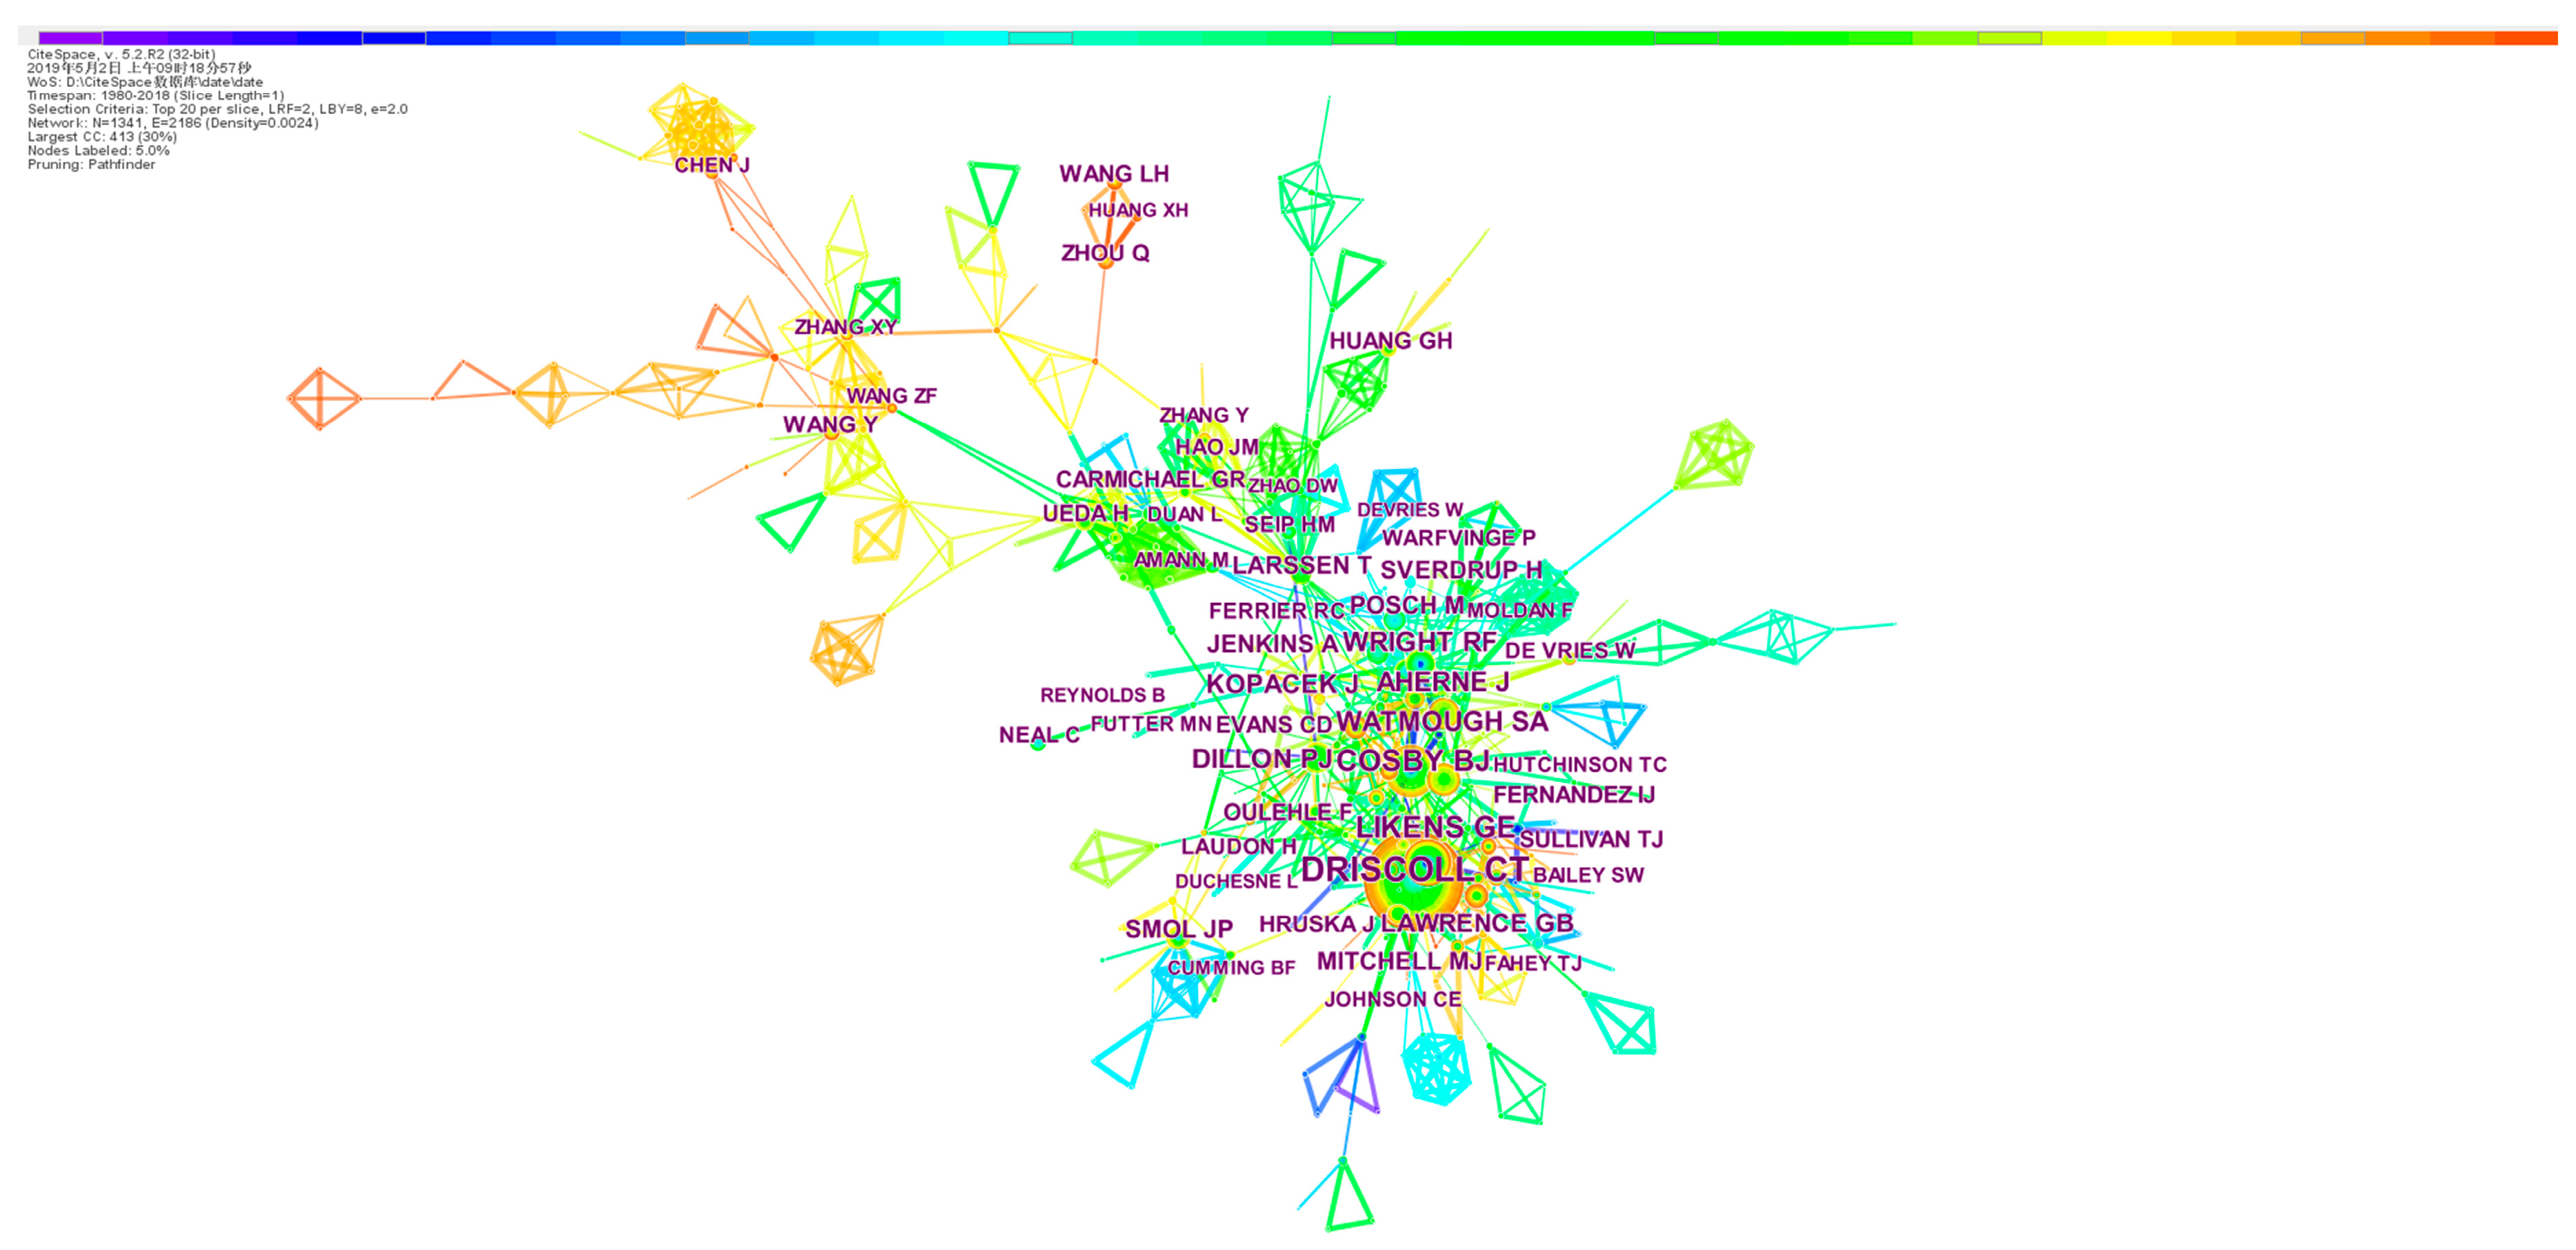
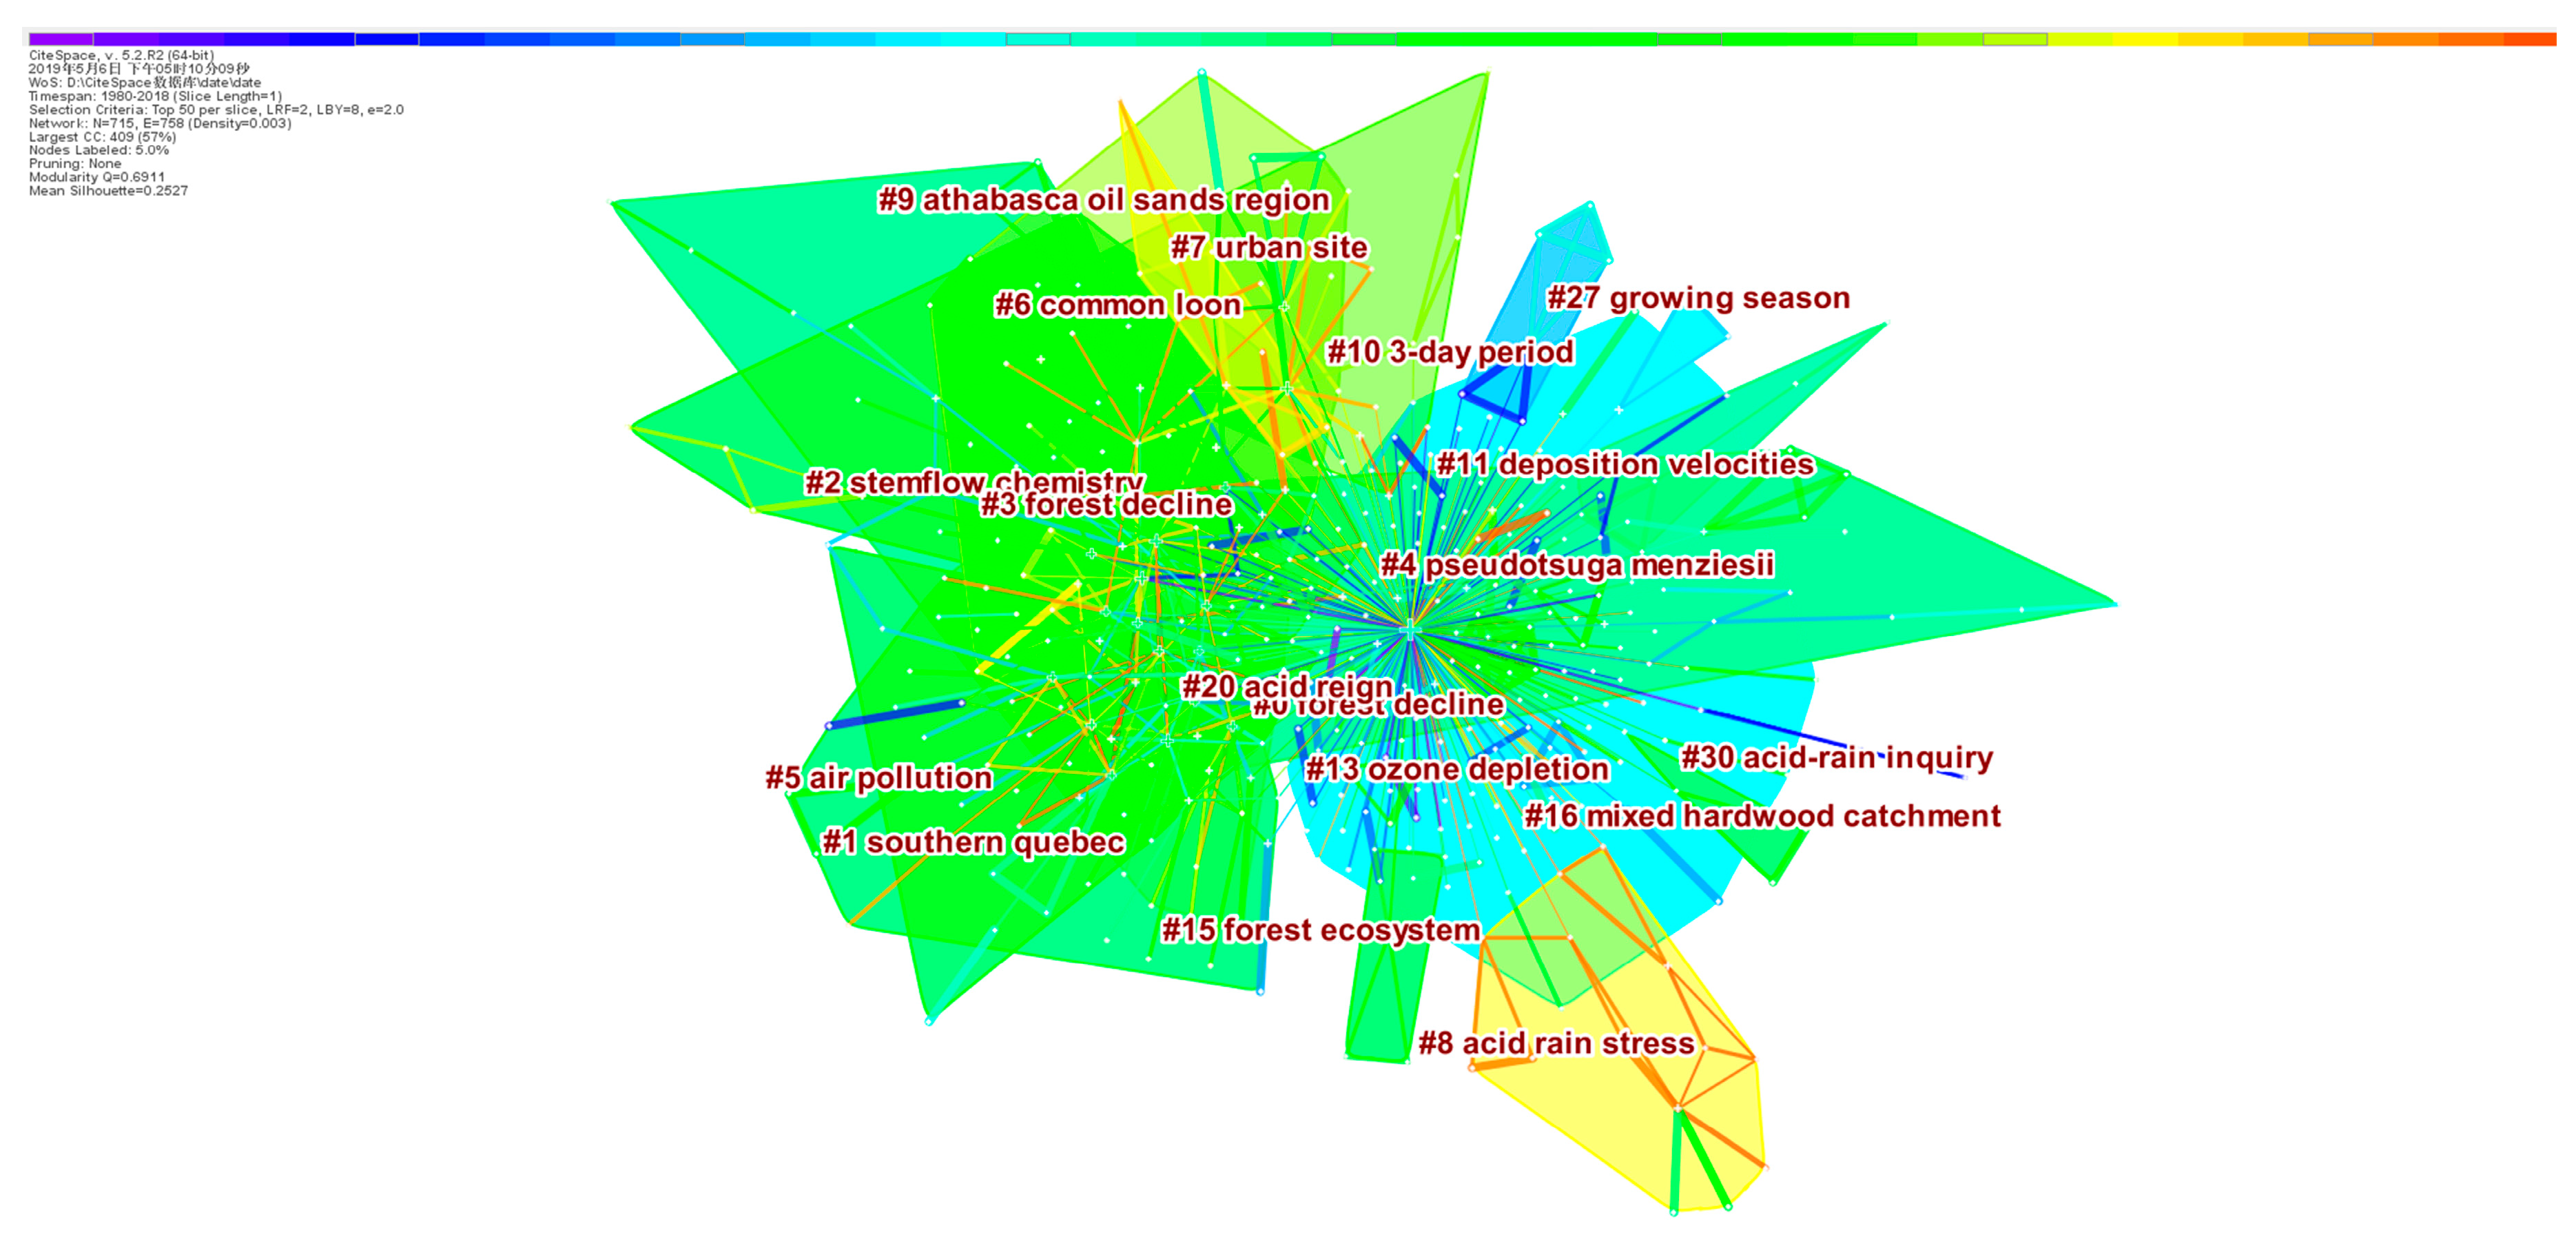
3.8. Term Co-Occurrence Network Analysis

Compared to the citation network or co-word analyses, term co-occurrence analysis can offer a more comprehensive and reliable perspective on the structure of a specific field over time [34]. Term cluster analysis can organize similar terms together and generate clusters on the basis of these terms that represent corresponding research areas. In this process, we used log-likelihood ratio (LLR) method to label the clusters, which enabled us to obtain the best result in terms of the uniqueness and coverage of themes within a cluster [35]. Figure 9 presents the term-based network from 1980–2018. It should be noted that there were several indexes related to the clusters. Size index indicates the numbers of terms in the corresponding clusters. Silhouette index represents the homogeneity level of a cluster [32]. This varies between 0 and 1. The closer it is to 1, the higher the cluster homogeneity. Once it is above 0.5, the cluster result is highly reliable and rational [33,35]. The parameter of Mean (Year) reflects the average year of the terms in a specific cluster, which is valuable to determine whether the cluster is new or old [32]. Then, we listed the top 10 clusters in Table 6 and found the silhouette values of all ten clusters were greater than 0.5, indicating the clusters were reasonable.
Among the top 10 clusters, we can divide the clusters into three stage (1990–2000, 2001–2010, and 2011–2018) in terms of the mean (year) index. We found different focuses for the three stages. In the period of 1990–2000, five cluster IDs 0, 1, 2, 4, and 5 were included. Forest decline had been observed in Asia, Europe, and North America due to air pollutants (acid deposition) [58,67]. The phenological events and characteristics were closely related to environmental factors (water, temperature, nutrient availability, etc.) [67]. Therefore, whether and how acid deposition could affect the foliar phenological events aroused much attention. Shan et al. [67] found that direct AR and indirect soil acidification were the main contributors to phenological disorder and forest decline. The acid deposition in southern Quebec had been considered serious and a series of effects of AR on forests and lakes had been studied, especially changes in forest soil chemistry (i.e., concentrations of major and trace elements) [68,69]. Links between ion concentrations (such as SO42−, NO3, NH4+, and PO3) in stemflow and epiphytic lichen diversity was another interesting topic. Many investigations in Harz mountain concluded that epiphytic lichen had a relatively higher diversity in AR affected forests than the healthy ones due to reduced canopy surfaces and lower ion concentrations in stemflows in affected forests [70,71]. The cluster ID 5 mainly focused on the spectral reflectance response of lichen Ramalina duriaei to AR and air pollution that was derived from the combustion of heavy fuel oil in urban-industrial sites [72,73].
For 2001 to 2010, there are three involved clusters. We found cluster ID 3 was similar to cluster ID 0; “forest decline” and “phenological disorder” were still topics in the period of 2001–2010, but the topic “atmospheric nitrogen deposition” emerged as a more specific aspect, which mainly concentrated on the effects of nitrogen on ecosystems compared to acid deposition. The cluster ID 6 investigated changes in the reproduction of common loon (Gavia immer) under acid precipitation [74]; this is a crucial bioindicator species related to acid precipitation. Nova Scotia had become a susceptible area where AR-induced surface water acidification had led to a dramatic drop in the Atlantic Salmon population [75]. With the continuous extension of the AR area, urban sites also suffered from acid pulses. The chemical characteristics of rainwater and wet precipitation in many urban sites had been observed by this point [14,76].
With the rapid development in the AR field, potential mechanisms of AR effects appear to have received more attention. For example, Wang et al. [77] used the photosynthetic parameters (photosynthesis, chlorophyll content, chlorophyll fluorescence, etc.) of McClure seedlings to indicate their tolerance to AR stress. Additionally, the response of antioxidative systems and comprehensive transcriptomes to AR was also analyzed [78,79]. The Athabasca oil sands region is the largest area for open-pit oil sand mining in Alberta, Canada. Soil and water acidification in this area under dry and wet deposition is of high concern to government, industry, and the public, making it a hotspot in the AR field [80].

3.9. Burst Detection in AR Research Area

Burst detection is an available and effective way to discover the significant frequency changes of keywords, countries, institutions, and authors in a specific time zone [29,81].

3.9.1. Emerging Topics

Keyword co-occurrence analysis is effective for classifying research topics, and the burst detection on keywords is usually applied to pick out new topics in a specific research area [32]. Through CiteSpace, we obtained some keywords with bursts in the last three years (Table 7). It should be noted that the length of the whole line (red and blue strips) in the last columns of Table 7 represents the research period (1980–2018) and the red line indicates the time period of the burst. The lines in Table 8, Table 9 and Table 10 have the similar meanings. From Table 7, we found that the research studies related to “behavior”, “phosphorus”, “fractionation”, “soil acidification”, “corrosion”, “performance”, “recovery”, “rainwater”, “trace element”, and “surface water” were the emerging active topics in recent years. AR has been a serious global problem for several decades in many regions, and the response of various ecosystems to AR stress and the profound negative effects have been studied [16,78,79]. Recently, many studies have focused on the metallic material electrochemical behavior (including corrosion behavior) [82,83,84,85], reinforced-concrete structure seismic behavior and performance [86], composites wear behavior [87,88], and element leaching behavior in metal-contaminated soil [89] under AR stress. Phosphorus-related research has also become attractive to researchers. The effects of AR on phosphorus release from phosphate rock [90], phosphorus leaching from contaminated soils [91], phosphorus availability in lakes [92,93], and phosphorus absorption efficiency by plants [94] have been investigated by numerous researchers. The effect of AR on the fractionation of heavy metals (such as Cd, Cu, Fe, Mn, Ni, Pb, and Zn) [95] has also attracted much attention. Soil acidification is one of the main consequences caused by AR in soil, which subsequently has potential effects on vegetation [96], arthropods [97], microorganisms [98], and soil biochemical processes (such as soil respiration) [99]. The recovery of ecosystem functions has been imperative for researchers, along with societal and economic development [100,101,102]. Due to serious AR, the pH values of most rainwater events in southern China were below 5.0 [13]. The chemical composition and characteristics of rainwater in many regions were studied [103]. Research studies concentrating on the sources, characteristics, and impacts of trace elements in atmospheric deposition have aroused more attention in the last year [104,105,106]. With the continuous and high acid deposition, severe regional surface water acidification has started to attract much attention in China, while surface water acidification has been reported as a main perceived problem in northern Europe and eastern North America under acid deposition since the 1950s [12,107,108]. These new emerging topics are not only helpful for us to identify the research frontiers in the AR domain, but also can serve as new inspiration sources for proposing new research issues, scientific hypotheses, and perspectives in the future research.

3.9.2. Active Countries and Institutions

From the burst detection on countries and institutions, we can pick out which countries and institutions were the active ones in a specific time-span in the AR domain. Table 8 and Table 9 listed the top 10 countries and institutions with bursts, respectively.
As Table 7 shows, the United States and Canada had the strongest bursts from early 1980 until 1994, which means that the United States and Canada paid increased attention to studying the AR problem and made significant contributions to the AR publications in this period. After that, Finland, Germany, Scotland, Japan, and Sweden showed a rapid increase in AR publications with bursts because of the severe AR status in these countries. Lately, Romania, Iran, and China had a potential influence on AR research due to the expansion of the AR area and increasing concerns around AR in these countries. Among these results, we found that China developed very fast regarding the AR publications, though it engaged in AR research relatively later among the top countries. This is mainly due to the urgency of solving the AR problem in the process of development.
The burst of institutions from 1980 to 1997 was associated with Cornell University (USA), United States Forest Service (USA), United States Environmental Protection Agency (USA), North Carolina State University (USA), Oak Ridge National Laboratory (USA), and Pennsylvania State University (USA). In the following years from 1998 to 2018, the burst occurred in the Institute of Ecosystem Studies (USA), Trent University (Canada), University of Chinese Academy of Sciences (PR China), and Chinese Academy of Sciences (PR China). This result reveals that those institutions in the United States were dominant in previous AR research. Among those institutions, seven were from the United States, two from China, and one from Canada. This result coincides with the above contributions of countries.

3.9.3. Potential Authors

Through the burst detection of authors, we could identify the authors who had potential vitality in the recent years. Then, we could seize the latest development trends in the AR field by tracking the studies of these authors. In Table 10, we presented the authors with bursts between 2010 and 2018. Surprisingly, most authors came from China, which reflected the severity of AR in many regions of China and extensive attention having been paid in recent years to understanding the effects of AR on various ecosystems and the underlying mechanisms in China. Under strong environmental pressure, the Chinese government has implemented many policies and measures to mitigate SO2 and NOX emissions, including flue gas desulfurization and phasing out inefficient power sectors [1]. Meanwhile, many researchers have been devoted to studying the consequences of AR, which aids the drafting of AR control policies and measures for the government.

4. Conclusions

In this paper, we performed a comprehensive scientometric review on AR studies based on 10,164 documents that were retrieved from the Web of Sciences. We presented the development process of AR research from multiple perspectives—research outputs, collaborations among countries, institutions and authors, citation network analysis, and co-occurrence analysis of subject categories and terms. Results showed that the overall concern regarding AR, an important aspect of global environmental changes, has been increasing from 1900 to 2018, though there were some fluctuations in terms of the AR publications. AR research is an interdisciplinary field and involves multifaceted aspects, from environmental science to materials science, energy and fuels, physics, etc. However, the concern was not evenly distributed among countries and regions but was almost centralized in North America, Europe, and Asia. In addition, international collaborations among European countries were relatively intensive. The top five countries with the most AR publications were the United States, PR China, Canada, England, and Japan, of which all were developed countries besides China, which has been rapidly developing in recent decades. Chinese Academy of Sciences, United States Forest Service, Cornell University, United States Environmental Protection Agency, and United States Geological Survey are the top five most productive institutions. There were 2018 journals related to this field. The journal Water, Air, and Soil Pollution published the highest number of articles in the AR area. Prof. C.T. Driscoll was the most high-impact author on this topic, with the largest number of TLCSx. In total, the research studies on AR can be categorized into three main hotspots, including analyzing the AR status and its control policies in Europe, the United States, and China in the past few decades, investigating the ecological consequences of AR on plant histological, physiological, and biochemical traits, as well as surface water and soil properties, and the model application for quantitatively assessing the AR and its effects on terrestrial and aquatic ecosystems at the regional scale. The research studies on “behavior”, “phosphorus”, “fractionation”, “soil acidification”, “corrosion”, “performance”, “recovery”, “rainwater”, “trace elements”, and “surface water” have been the emerging active topics in recent years. This study explored the literature information, a citation network analysis, and co-occurrence analysis in the AR field to provide an important reference for scholars to comprehend the current situation, influential development trends and research frontiers in the AR field.
It should be pointed out that there are some limitations and deviations. Firstly, there are limited sources of data collection and format problems. Secondly, CiteSpace software also has some drawbacks that need to be solved, though it has been applied to a large proportion of bibliometric research studies. For example, the first author and corresponding author are not distinguished clearly. However, the findings based on the objective data are stable and reliable, and are not influenced by empiricism.

Supplementary Materials

The following is available online at https://www.mdpi.com/2071-1050/11/11/3077/s1, Table S1: Information about the 50 most cited papers sorted by LCS.

Author Contributions

The research was conceived by Z.L., H.W. and J.Z. The data collection and analysis were conducted by Z.L. All authors contributed to manuscript writing and revision. All authors read and approved the final manuscript.

Funding

This work was supported by the National Natural Science Foundation of China (Grant Nos. U1701236 and 31500401).

Conflicts of Interest

The authors declare that they have no conflict of interest.

References

  1. Zhao, Y.; Duan, L.; Xing, J.; Larssen, T.; Nielsen, C.P.; Hao, J. Soil acidification in china: Is controlling SO2 emissions enough? Environ. Sci. Technol. 2009, 43, 8021–8026. [Google Scholar] [CrossRef] [PubMed]
  2. The U.S. Environmental Protection Agency (EPA). Our Nation’s Air: Air Quality Improves as America Grows. Available online: https://gispub.epa.gov/air/trendsreport/2018 (accessed on 21 January 2019).
  3. Kuylenstierna, J.C.I.; Rodhe, H.; Cinderby, S.; Hicks, K. Acidification in developing countries: Ecosystem sensitivity and the critical load approach on a global scale. Ambio 2001, 30, 20–28. [Google Scholar] [CrossRef]
  4. The European Monitoring and Evaluation Programme (EMEP) Officially Reported Emission Trends. Available online: http://www.emep.int/ (accessed on 21 January 2019).
  5. Aas, W.; Shao, M.; Jin, L.; Larssen, T.; Zhao, D.; Xiang, R.; Zhang, J.; Xiao, J.; Duan, L. Air concentrations and wet deposition of major inorganic ions at five non-urban sites in China, 2001–2003. Atmos. Environ. 2007, 41, 1706–1716. [Google Scholar] [CrossRef]
  6. Liu, X.; Zhang, B.; Zhao, W.; Wang, L.; Xie, D.; Huo, W.; Wu, Y.; Zhang, J. Comparative effects of sulfuric and nitric acid rain on litter decomposition and soil microbial community in subtropical plantation of Yangtze River Delta region. Sci. Total Environ. 2017, 601, 669–678. [Google Scholar] [CrossRef]
  7. Balasubramanian, R.; Victor, T.; Begum, R. Impact of biomass burning on rainwater acidity and composition in Singapore. J. Geophys. Res. Atmos. 1999, 104, 26881–26890. [Google Scholar] [CrossRef]
  8. Sant’Anna-Santos, B.F.; Da Silva, L.C.; Azevedo, A.A.; de Araujo, J.M.; Alves, E.F.; Da Silva, E.A.M.; Aguiar, R. Effects of simulated acid rain on the foliar micromorphology and anatomy of tree tropical species. Environ. Exp. Bot. 2006, 58, 158–168. [Google Scholar] [CrossRef]
  9. Kita, I.; Sato, T.; Kase, Y.; Mitropoulos, P. Neutral rains at Athens, Greece: A natural safeguard against acidification of rains. Sci. Total Environ. 2004, 327, 285–294. [Google Scholar] [CrossRef] [PubMed]
  10. Chen, S.; Shen, X.; Hu, Z.; Chen, H.; Shi, Y.; Liu, Y. Effects of simulated acid rain on soil CO2 emission in a secondary forest in subtropical China. Geoderma 2012, 189, 65–71. [Google Scholar] [CrossRef]
  11. Larssen, T.; Duan, L.; Mulder, J. Deposition and leaching of sulfur, nitrogen and calcium in four forested catchments in china: Implications for acidification. Environ. Sci. Technol. 2011, 45, 1192–1198. [Google Scholar] [CrossRef] [PubMed]
  12. Larssen, T.; Lydersen, E.; Tang, D.G.; He, Y.; Gao, J.X.; Liu, H.Y.; Duan, L.; Seip, H.M.; Vogt, R.D.; Mulder, J.; et al. Acid rain in China. Environ. Sci. Technol. 2006, 40, 418–425. [Google Scholar] [CrossRef]
  13. Hou, Q.; Zhao, Y. An analysis on characteristics of regional acid rain over China in 2007. Adv. Clim. Chang. Res. 2009, 5, 7–11. [Google Scholar]
  14. Zhang, M.; Wang, S.; Wu, F.; Yuan, X.; Zhang, Y. Chemical compositions of wet precipitation and anthropogenic influences at a developing urban site in southeastern China. Atmos. Res. 2007, 84, 311–322. [Google Scholar] [CrossRef]
  15. Caro The relation of epileptic attacks to uric acid precipitation. Deut. Med. Wochenschr. 1900, 26, 308–310.
  16. Singh, A.; Agrawal, M. Acid rain and its ecological consequences. J. Environ. Biol. 2008, 29, 15–24. [Google Scholar]
  17. Singh, B.; Agrawal, M. Impact of simulated acid rain on growth and yield of two cultivars of wheat. Water Air Soil Pollut. 2004, 152, 71–80. [Google Scholar] [CrossRef]
  18. Murray, A.M.; Percival, D.C.; Stratton, G.W. Impact of simulated acid rain on photochemistry, morphology, and yield of the wild blueberry (Vaccinium angustifolium Ait.). Can. J. Plant Sci. 2004, 84, 877–880. [Google Scholar] [CrossRef]
  19. Singh, A.; Agrawal, M. Response of two cultivars of Triticum aestivum L. To simulated acid rain. Environ. Pollut. 1996, 91, 161–167. [Google Scholar] [CrossRef]
  20. Wyrwicka, A.; Skłodowska, M. Influence of repeated acid rain treatment on antioxidative enzyme activities and on lipid peroxidation in cucumber leaves. Environ. Exp. Bot. 2006, 56, 198–204. [Google Scholar] [CrossRef]
  21. Ferenbaugh, R.W. Effects of simulated acid rain on Phaseolus vulgaris L. (Fabaceae). Am. J. Bot. 1976, 63, 283–288. [Google Scholar] [CrossRef]
  22. Nd, T.G. Air pollutants and forest decline. Environ. Sci. Technol. 1983, 17, 246A. [Google Scholar]
  23. Irving, P.M. Acidic precipitation effects on crops: A review and analysis of research. J. Environ. Qual. 1983, 12, 442–453. [Google Scholar] [CrossRef]
  24. Zhang, J.; Ouyang, Y.; Ling, D. Impacts of simulated acid rain on cation leaching from the Latosol in south China. Chemosphere 2007, 67, 2131–2137. [Google Scholar] [CrossRef]
  25. Breemen, N.V.; Driscoll, C.T.; Mulder, J. Acidic deposition and internal proton sources in acidification of soils and waters. Nature 1984, 307, 599. [Google Scholar] [CrossRef]
  26. Watt, W.D.; Scott, C.D.; White, W.J. Evidence of acidification of some Nova Scotian rivers and its impact on Atlantic salmon, Salmo solar. Can. J. Fish. Aquat. Sci. 1983, 40, 462–473. [Google Scholar] [CrossRef]
  27. Menz, F.C.; Seip, H.M. Acid rain in Europe and the United States: An update. Environ. Sci. Policy 2004, 7, 253–265. [Google Scholar] [CrossRef]
  28. Krug, E.C.; Frink, C.R. Acid Rain on Acid Soil: A New Perspective. Science 1983, 221, 520–525. [Google Scholar] [CrossRef] [Green Version]
  29. Chen, C.; Dubin, R.; Kim, M.C. Emerging trends and new developments in regenerative medicine: A scientometric update (2000–2014). Expert Opin. Biol. Ther. 2014, 14, 1295–1317. [Google Scholar] [CrossRef]
  30. Yu, D.; Shi, S. Researching the development of Atanassov intuitionistic fuzzy set: Using a citation network analysis. Appl. Soft Comput. 2015, 32, 189–198. [Google Scholar] [CrossRef]
  31. Shao, H.; Yu, Q.; Bo, X.; Duan, Z. Analysis of oncology research from 2001 to 2010: A scientometric perspective. Oncol. Rep. 2013, 29, 1441–1452. [Google Scholar] [CrossRef] [Green Version]
  32. Yu, D.; Xu, C. Mapping research on carbon emissions trading: A co-citation analysis. Renew. Sustain. Energy Rev. 2017, 74, 1314–1322. [Google Scholar] [CrossRef]
  33. Sun, Y.; Wu, S.; Gong, G. Trends of research on polycyclic aromatic hydrocarbons in food: A 20-year perspective from 1997 to 2017. Trends Food Sci. Technol. 2019, 83, 86–98. [Google Scholar] [CrossRef]
  34. Ouyang, W.; Wang, Y.; Lin, C.; He, M.; Hao, F.; Liu, H.; Zhu, W. Heavy metal loss from agricultural watershed to aquatic system: A scientometrics review. Sci. Total Environ. 2018, 637–638, 208–220. [Google Scholar] [CrossRef]
  35. Xiao, F.; Li, C.; Sun, J.; Zhang, L. Knowledge domain and emerging trends in organic photovoltaic technology: A scientometric review based on CiteSpace analysis. Front. Chem. 2017, 5, 67. [Google Scholar] [CrossRef] [PubMed]
  36. Song, J.; Zhang, H.; Dong, W. A review of emerging trends in global PPP research: Analysis and visualization. Scientometrics 2016, 107, 1111–1147. [Google Scholar] [CrossRef]
  37. Burmaoglu, S.; Saritas, O.; Kidak, L.B.; Berber, I.C. Evolution of connected health: A network perspective. Scientometrics 2017, 112, 1419–1438. [Google Scholar] [CrossRef]
  38. Zheng, M.; Fu, H.; Ho, Y. Research trends and hotspots related to ammonia oxidation based on bibliometric analysis. Environ. Sci. Pollut. Res. 2017, 24, 20409–20421. [Google Scholar] [CrossRef]
  39. Ding, W.; Chen, C. Dynamic topic detection and tracking: A comparison of HDP, C-word, and Cocitation methods. J. Assoc. Inf. Sci. Technol. 2014, 65, 2084–2097. [Google Scholar] [CrossRef]
  40. Ulrich, B.; Mayer, R.; Khanna, P.K. Chemical changes due to acid precipitation in a loess-derived soil in central Europe. Soil Sci. 1980, 130, 193–199. [Google Scholar] [CrossRef]
  41. Likens, G.E.; Bormann, F.H.; Johnson, N.M. Acid rain. Environment 1972, 14, 33–40. [Google Scholar]
  42. Evans, L.S.; Curry, T.X. Differential responses of plant foliage to simulated acid rain. Am. J. Bot. 1979, 66, 953–962. [Google Scholar] [CrossRef]
  43. Reuss, J.O. Implications of the Calcium-Aluminum exchange system for the effect of acid precipitation on soils1. J. Environ. Qual. 1983, 12, 591–595. [Google Scholar] [CrossRef]
  44. Lee, J.J.; Neely, G.E.; Perrigan, S.C.; Grothaus, L.C. Effect of simulated sulfuric acid rain on yield, growth and foliar injury of several crops. Environ. Exp. Bot. 1981, 21, 171–185. [Google Scholar] [CrossRef]
  45. Johnson, N.M.; Driscoll, C.T.; Eaton, J.S.; Likens, G.E.; McDowell, W.H. ‘Acid rain’, dissolved aluminum and chemical weathering at the Hubbard Brook Experimental Forest, New Hampshire. Geochim. Cosmochim. Acta 1981, 45, 1421–1437. [Google Scholar] [CrossRef]
  46. Chang, J.S.; Brost, R.A.; Isaksen, I.S.A.; Madronich, S.; Middleton, P.; Stockwell, W.R.; Walcek, C.J. A three-dimensional Eulerian acid deposition model: Physical concepts and formulation. J. Geophys. Res. Atmos. 1987, 92, 14681–14700. [Google Scholar] [CrossRef]
  47. Cosby, B.J.; Hornberger, G.M.; Galloway, J.N.; Wright, R.F. Modeling the effects of acid deposition: Assessment of a lumped parameter model of soil water and streamwater chemistry. Water Resour. Res. 1985, 21, 51–63. [Google Scholar] [CrossRef]
  48. Cosby, B.J.; Wright, R.F.; Hornberger, G.M.; Galloway, J.N. Modeling the effects of acid deposition: Estimation of Long-Term water quality responses in a small forested catchment. Water Resour. Res. 1985, 21, 1591–1601. [Google Scholar] [CrossRef]
  49. Lawrence, G.B.; David, M.B.; Shortle, W.C. A new mechanism for calcium loss in forest-floor soils. Nature 1995, 378, 162–165. [Google Scholar] [CrossRef]
  50. Pilkington, A.; Meredith, J. The evolution of the intellectual structure of operations management-1980-2006: A citation/co-citation analysis. J. Oper. Manag. 2009, 27, 185–202. [Google Scholar] [CrossRef]
  51. Galloway, J.N.; Likens, G.E.; Edgerton, E.S. Acid precipitation in the northeastern united states. Science 1974, 194, 722–724. [Google Scholar] [CrossRef]
  52. Likens, G.E.; Wright, R.F.; Galloway, J.N.; Butler, T.J. Acid rain. Sci. Am. 1979, 241, 43–51. [Google Scholar] [CrossRef]
  53. Dianwu, Z.; Jiling, X.; Yu, X.; Chan, W.H. Acid rain in southwestern China. Atmos. Environ. 1988, 22, 349–358. [Google Scholar] [CrossRef]
  54. Galloway, J.N. Acid deposition: Perspectives in time and space. Water Air Soil Pollut. 1995, 85, 15–24. [Google Scholar] [CrossRef]
  55. Driscoll, C.T.; Lawrence, G.B.; Bulger, A.J.; Butler, T.J.; Cronan, C.S.; Eagar, C.; Lambert, K.F.; Likens, G.E.; Stoddard, J.L.; Weathers, K.C. Acidic Deposition in the Northeastern United States: Sources and Inputs, Ecosystem Effects, and Management Strategies. Bioscience 2001, 51, 180–198. [Google Scholar] [CrossRef] [Green Version]
  56. Cronan, C.S.; Schofield, C.L. Aluminum leaching response to Acid precipitation: Effects on high-elevation watersheds in the northeast. Science 1979, 204, 304–306. [Google Scholar] [CrossRef]
  57. Schindler, D.W. Effects of Acid Rain on Freshwater Ecosystems. Science 1988, 239, 149–157. [Google Scholar] [CrossRef] [Green Version]
  58. Likens, G.E.; Driscoll, C.T.; Buso, D.C. Long-Term effects of acid rain: Response and recovery of a forest ecosystem. Science 1996, 272, 244–246. [Google Scholar] [CrossRef]
  59. DeHayes, D.H.; Schaberg, P.G.; Hawley, G.J.; Strimbeck, G.R. Acid rain impacts on calcium nutrition and forest health: Alteration of membrane-associated calcium leads to membrane destabilization and foliar injury in red spruce. Bioscience 1999, 49, 789–800. [Google Scholar] [CrossRef]
  60. Stoddard, J.L.; Jeffries, D.S.; Lükewille, A.; Clair, T.A.; Dillon, P.J.; Driscoll, C.T.; Forsius, M.; Johannessen, M.; Kahl, J.S.; Kellogg, J.H.; et al. Regional trends in aquatic recovery from acidification in North America and Europe. Nature 1999, 401, 575. [Google Scholar] [CrossRef]
  61. Monteith, D.T.; Stoddard, J.L.; Evans, C.D.; de Wit, H.A.; Forsius, M.; Høgåsen, T.; Wilander, A.; Skjelkvåle, B.L.; Jeffries, D.S.; Vuorenmaa, J.; et al. Dissolved organic carbon trends resulting from changes in atmospheric deposition chemistry. Nature 2007, 450, 537. [Google Scholar] [CrossRef]
  62. Wen, K.; Liang, C.; Wang, L.; Hu, G.; Zhou, Q. Combined effects of lanthanumion and acid rain on growth, photosynthesis and chloroplast ultrastructure in soybean seedlings. Chemosphere 2011, 84, 601–608. [Google Scholar] [CrossRef]
  63. Stockwell, W.R.; Middleton, P.; Chang, J.S.; Tang, X. The second generation regional acid deposition model chemical mechanism for regional air quality modeling. J. Geophys. Res. Atmos. 1990, 95, 16343–16367. [Google Scholar] [CrossRef]
  64. Larssen, T.; Carmichael, G.R. Acid rain and acidification in China: The importance of base cation deposition. Environ. Pollut. 2000, 110, 89–102. [Google Scholar] [CrossRef]
  65. Cosby, B.J.; Ferrier, R.C.; Jenkins, A.; Wright, R.F. Modelling the effects of acid deposition: Refinements, adjustments and inclusion of nitrogen dynamics in the MAGIC model. Hydrol. Earth Syst. Sci. 2001, 5, 499–518. [Google Scholar] [CrossRef]
  66. Schöpp, W.; Posch, M.; Mylona, S.; Johansson, M. Long-term development of acid deposition (1880–2030) in sensitive freshwater regions in Europe. Hydrol. Earth Syst. Sci. 2003, 7, 436–446. [Google Scholar] [CrossRef]
  67. Shan, Y.; Izuta, T.; Totsuka, T. Phenological disorder induced by atmospheric nitrogen deposition: Original causes of pine forest decline over japan. Part I. Phenological disorder, cold death of apical shoots of red pine subjected to combined exposures of simulated acid rain and soil acidification, and implications for forest decline. Water Air Soil Pollut. 2000, 117, 191–203. [Google Scholar]
  68. Bouchard, A. Recent lake acidification and recovery trends in southern Quebec, Canada. Water Air Soil Pollut. 1997, 94, 225–245. [Google Scholar] [CrossRef]
  69. Lin, Z.Q.; Hendershot, W.H.; Schuepp, P.H.; Kennedy, G.G.; Dutilleul, P. Total elements in forest soils affected by acid deposition in southern Quebec. Can. J. Soil Sci. 1996, 76, 165–171. [Google Scholar] [CrossRef]
  70. Hauck, M.; Runge, M. Stemflow chemistry and epiphytic lichen diversity in dieback-affected spruce forest of the Harz Mountains, Germany. Flora 2002, 197, 250–261. [Google Scholar] [CrossRef]
  71. Hauck, M.; Hesse, V.; Runge, M. The significance of stemflow chemistry for epiphytic lichen diversity in a dieback-affected spruce forest on Mt Brocken, northern Germany. Lichenologist 2002, 34, 415–427. [Google Scholar] [CrossRef]
  72. Garty, J.; Kloog, N.; Cohen, Y.; Wolfson, R.; Karnieli, A. The Effect of Air Pollution on the Integrity of Chlorophyll, Spectral Reflectance Response, and on Concentrations of Nickel, Vanadium, and Sulfur in the Lichen Ramalina duriaei (De Not.) Bagl. Environ. Res. 1997, 74, 174–187. [Google Scholar] [CrossRef]
  73. Garty, J.; Kloog, N.; Wolfson, R.; Cohen, Y.; Karnieli, A.; Avni, A. The Influence of Air Pollution on the Concentration of Mineral Elements, on the Spectral Reflectance Response and on the Production of Stress-Ethylene in the Lichen Ramalina duriaei. New Phytol. 1997, 137, 587–597. [Google Scholar] [CrossRef]
  74. Mcnicol, D.K.; Mallory, M.L.; Vogel, H.S. Using volunteers to monitor the effects of acid precipitation on Common Loon (Gavia immer) reproduction in Canada: The Canadian Lakes Loon Survey. Water Air Soil Pollut. 1995, 85, 463–468. [Google Scholar] [CrossRef]
  75. Laudon, H.; Clair, T.A.; Hemond, H.F. Long-term response in episodic acidification to declining SO42 deposition in two streams in Nova Scotia. Hydrol. Earth Syst. Sci. 2002, 6, 773–781. [Google Scholar] [CrossRef]
  76. Kulshrestha, U.C.; Kulshrestha, M.J.; Sekar, R.; Sastry, G.; Vairamani, M. Chemical characteristics of rainwater at an urban site of south-central India. Atmos. Environ. 2003, 37, 3019–3026. [Google Scholar] [CrossRef]
  77. Wang, T.; Yang, W.; Xie, Y.; Shi, D.; Ma, Y.; Sun, X. Effects of exogenous nitric oxide on the photosynthetic characteristics of bamboo (Indocalamus barbatus McClure) seedlings under acid rain stress. Plant Growth Regul. 2017, 82, 69–78. [Google Scholar] [CrossRef]
  78. Ren, X.; Zhu, J.; Liu, H.; Xu, X.; Liang, C. Response of antioxidative system in rice (Oryza sativa) leaves to simulated acid rain stress. Ecotox. Environ. Saf. 2018, 148, 851–856. [Google Scholar] [CrossRef]
  79. Yang, L.; Xu, Y.; Zhang, R.; Wang, X.; Yang, C. Comprehensive transcriptome profiling of soybean leaves in response to simulated acid rain. Ecotox. Environ. Saf. 2018, 158, 18–27. [Google Scholar] [CrossRef]
  80. Jung, K.; Chang, S.X. Soil and tree chemistry reflected the cumulative impact of acid deposition in Pinus banksiana and Populus tremuloides stands in the Athabasca oil sands region in western Canada. Ecol. Indic. 2013, 25, 35–44. [Google Scholar] [CrossRef]
  81. Chen, C.; Dubin, R.; Kim, M.C. Orphan drugs and rare diseases: A scientometric review (2000–2014). Expert Opin. Orphan Drugs 2014, 2, 709–724. [Google Scholar] [CrossRef]
  82. Pilić, Z. A Comparative Study on the Electrochemical Behaviour of Aluminium and 8090 Al- Li-Cu-Mg Alloy in Acid Rain Solution. Int. J. Electrochem. Sci. 2017, 12, 3576–3588. [Google Scholar] [CrossRef]
  83. Wong, P.K.; Kwok, C.T.; Man, H.C.; Guo, D. Laser fabrication of W-reinforced Cu layers: I. Corrosion behavior in 3.5% NaCl solution and synthetic acid rain. Mater. Chem. Phys. 2016, 181, 397–408. [Google Scholar] [CrossRef]
  84. Gerengi, H.; Slepski, P.; Ozgan, E.; Kurtay, M. Investigation of corrosion behavior of 6060 and 6082 aluminum alloys under simulated acid rain conditions. Mater. Corros. 2015, 66, 233–240. [Google Scholar] [CrossRef]
  85. Pilić, Z. Electrochemical behaviour of iron in simulated acid rain in presence of Achillea millefolium L. Int. J. Electrochem. Sci. 2018, 13, 5151–5163. [Google Scholar] [CrossRef]
  86. Guan, Y.; Zheng, S. Seismic behaviors of RC frame Beam-Column joints under acid rain circle: A pilot experimental study. J. Earthq. Eng. 2018, 22, 1008–1026. [Google Scholar] [CrossRef]
  87. Jiang, L.; He, C.; Fu, J.; Chen, D. Wear behavior of wood–plastic composites in alternate simulated sea water and acid rain corrosion conditions. Polym. Test. 2017, 63, 236–243. [Google Scholar] [CrossRef]
  88. Jiang, L.; He, C.; Fu, J.; Chen, D. Wear behavior of straw fiber-reinforced polyvinyl chloride composites under simulated acid rain conditions. Polym. Test. 2017, 62, 373–381. [Google Scholar] [CrossRef]
  89. Liu, J.; Li, H.; Wu, R.; Zhu, Y.; Shi, W. Effect of weathered coal on the leaching behavior of Lead-Contaminated soil with simulated acid rain. Water Air Soil Pollut. 2016, 227, 361. [Google Scholar] [CrossRef]
  90. Jiang, L.; Xue, Q.; Liu, L. Evaluation of the potential release of phosphorus from phosphate waste rock piles in different environmental scenarios. Environ. Earth Sci. 2015, 74, 597–607. [Google Scholar] [CrossRef]
  91. Cui, H.; Zhang, S.; Li, R.; Yi, Q.; Zheng, X.; Hu, Y.; Zhou, J. Leaching of Cu, Cd, Pb, and phosphorus and their availability in the phosphate-amended contaminated soils under simulated acid rain. Environ. Sci. Pollut. Res. 2017, 24, 21128–21137. [Google Scholar] [CrossRef]
  92. Kopáček, J.; Hejzlar, J.; Kaňa, J.; Norton, S.A.; Stuchlík, E. Effects of Acidic Deposition on in-Lake Phosphorus Availability: A Lesson from Lakes Recovering from Acidification. Environ. Sci. Technol. 2015, 49, 2895–2903. [Google Scholar] [CrossRef]
  93. Nürnberg, G.K.; Fischer, R.; Paterson, A.M. Reduced phosphorus retention by anoxic bottom sediments after the remediation of an industrial acidified lake area: Indications from P, Al, and Fe sediment fractions. Sci. Total Environ. 2018, 626, 412–422. [Google Scholar] [CrossRef]
  94. Zhang, B.; Bu, J.; Liang, C. Regulation of nitrogen and phosphorus absorption by plasma membrane H+-ATPase in rice roots under simulated acid rain. Int. J. Environ. Sci. Technol. 2017, 14, 101–112. [Google Scholar] [CrossRef]
  95. Moharami, S.; Jalali, M. Effect of acid rain on the fractionation of heavy metals and major elements in contaminated soils. Chem. Ecol. 2014, 31, 160–172. [Google Scholar] [CrossRef]
  96. Liu, X.; Fu, Z.; Zhang, B.; Zhai, L.; Meng, M.; Lin, J.; Zhuang, J.; Wang, G.G.; Zhang, J. Effects of sulfuric, nitric, and mixed acid rain on Chinese fir sapling growth in Southern China. Ecotox. Environ. Saf. 2018, 160, 154–161. [Google Scholar] [CrossRef]
  97. Kwon, T.; Kim, Y.S.; Lee, S.W.; Park, Y. Changes of soil arthropod communities in temperate forests over 10years (1998–2007). J. Asia-Pac. Entomol. 2016, 19, 181–189. [Google Scholar] [CrossRef]
  98. Xu, H.; Zhang, J.; Ouyang, Y.; Lin, L.; Quan, G.; Zhao, B.; Yu, J. Effects of simulated acid rain on microbial characteristics in a lateritic red soil. Environ. Sci. Pollut. Res. 2015, 22, 18260–18266. [Google Scholar] [CrossRef]
  99. Chen, S.; Zhang, X.; Liu, Y.; Hu, Z.; Shen, X.; Ren, J. Simulated acid rain changed the proportion of heterotrophic respiration in soil respiration in a subtropical secondary forest. Appl. Soil Ecol. 2015, 86, 148–157. [Google Scholar] [CrossRef]
  100. Warren, D.R.; Kraft, C.E.; Josephson, D.C.; Driscoll, C.T. Acid rain recovery may help to mitigate the impacts of climate change on thermally sensitive fish in lakes across eastern North America. Glob. Chang. Biol. 2017, 23, 2149–2153. [Google Scholar] [CrossRef]
  101. Yu, Q.; Zhang, T.; Ma, X.; Kang, R.; Mulder, J.; Larssen, T.; Duan, L. Monitoring effect of SO2 emission abatement on recovery of acidified soil and streamwater in southwest china. Environ. Sci. Technol. 2017, 51, 9498–9506. [Google Scholar] [CrossRef]
  102. Shortle, W.C.; Smith, K.T.; Lapenis, A.G. Dendrochemical evidence for soil recovery from acidic deposition in forests of the northeastern U.S. With comparisons to the southeastern U.S. and Russia. Chemosphere 2017, 181, 786–796. [Google Scholar] [CrossRef]
  103. Sun, X.; Wang, Y.; Li, H.; Yang, X.; Sun, L.; Wang, X.; Wang, T.; Wang, W. Organic acids in cloud water and rainwater at a mountain site in acid rain areas of South China. Environ. Sci. Pollut. Res. 2016, 23, 9529–9539. [Google Scholar] [CrossRef]
  104. Cable, E.; Deng, Y. Trace elements in atmospheric wet precipitation in the detroit metropolitan area: Levels and possible sources. Chemosphere 2018, 210, 1091–1098. [Google Scholar] [CrossRef]
  105. Nie, X.; Wang, Y.; Li, Y.; Sun, L.; Li, T.; Yang, M.; Yang, X.; Wang, W. Characteristics and impacts of trace elements in atmospheric deposition at a high-elevation site, southern China. Environ. Sci. Pollut. Res. 2017, 24, 22839–22851. [Google Scholar] [CrossRef]
  106. Cukurluoglu, S. Sources of trace elements in wet deposition in Pamukkale, Denizli, western Turkey. Environ. Forensics 2017, 18, 83–99. [Google Scholar] [CrossRef]
  107. Yu, Q.; Zhang, T.; Cheng, Z.; Zhao, B.; Mulder, J.; Larssen, T.; Wang, S.; Duan, L. Is surface water acidification a serious regional issue in China? Sci. Total Environ. 2017, 584–585, 783–790. [Google Scholar] [CrossRef]
  108. Qiao, Y.; Feng, J.; Liu, X.; Wang, W.; Zhang, P.; Zhu, L. Surface water pH variations and trends in China from 2004 to 2014. Environ. Monit. Assess. 2016, 188, 443. [Google Scholar] [CrossRef]
Figure 1. Document types of AR publications from 1900 to 2018.
Sustainability 11 03077 g001
Figure 2. Records and TLCS of publications in the AR field from 1900 to 2018.
Sustainability 11 03077 g002
Figure 3. The co-occurring network of subject categories. Nodes represent subject categories. The size of a node is proportional to the literature number of the subject category. The color of rings corresponds to the year. The purple rings of nodes indicate the high centrality.
Sustainability 11 03077 g003
Figure 4. Global geographic distribution of AR publications.
Sustainability 11 03077 g004
Figure 5. The network about the country/territory collaborations. Nodes represent countries and territories. The size of a node is proportional to the literature number of the country and territory. The color of the rings corresponds to the year. The purple rings of nodes indicate high centrality.
Sustainability 11 03077 g005
Figure 6. Network of collaboration between institutions. Nodes represent institutions. The size of a node is proportional to the literature number of the institution. The colors of rings correspond to the year. The purple rings of nodes indicate high centrality.
Sustainability 11 03077 g006
Figure 7. The collaboration network of the authors. Nodes represent authors. The size of a node is proportional to the publication number of the author. The colors of the rings correspond to the year. The purple rings of nodes indicate high centrality.
Sustainability 11 03077 g007
Figure 8. The citation network in the AR field. Each node represents one highly cited paper. If paper A cites paper B, there is a line between paper A and paper B, and this line’s arrow points to paper B. The size of each node is proportional to the LCS of this paper. Notes: Nodes = 50, Links = 115; LCS Min = 63, Max = 335 (LCS scaled). The code references are listed in supplementary Table S1.
Sustainability 11 03077 g008
Figure 9. The term co-occurring network for 1980–2018.
Sustainability 11 03077 g009
Table 1. Top 10 subject categories in AR area.
IdentifierSubject CategoriesRecordsPercentage/%
1Environmental Sciences388538.22
2Meteorology Atmospheric Sciences175617.28
3Water Resources113711.19
4Engineering Environmental5805.71
5Plant Sciences5785.69
6Ecology5575.48
7Geosciences Multidisciplinary5395.30
8Forestry4614.54
9Multidisciplinary Sciences4314.24
10Chemistry Multidisciplinary4244.17
Table 2. Rank of records and centrality by countries and territories.
IdentifierCountries/TerritoriesRecordsCountries and TerritoriesCentrality
1United States3549Switzerland0.84
2People’s Republic of China1229Poland0.61
3Canada959Slovakia0.50
4England739Scotland0.46
5Japan489France0.45
6Germany442New Zealand0.43
7Sweden384Slovenia0.38
8Norway357Denmark0.36
9Netherlands244Hungary0.36
10Finland221Spain0.33
Table 3. Rank of records and centrality by institutions.
IdentifierInstitutionsRecordsInstitutionsCentrality
1Chinese Academy of Sciences328United States Environmental Protection Agency0.20
2United States Forest Service208National Oceanic and Atmospheric Administration0.19
3Cornell University185Colorado State University0.14
4United States Environmental Protection Agency170University at Albany-State University of New York0.12
5United States Geological Survey155Centre for Ecology and Hydrology0.11
6Syracuse University142Peking University0.11
7Swedish University of Agricultural Sciences124Czech Geological Survey0.10
8Norwegian Institute for Water Research122University of New Hampshire0.10
9Environment Canada121University of Virginia0.09
10University of Virginia111University of Minnesota0.09
Table 4. Top 10 journals in terms of publications in AR filed.
IdentifierJournalsRecordsPercentage/%
1Water, Air, and Soil Pollution7067.0
2Atmospheric Environment4134.1
3Environmental Pollution2482.4
4Science of the Total Environment2122.1
5Environmental Science and Technology2052.0
6Journal of Geophysical Research-Atmospheres1161.1
7Environmental Monitoring and Assessment1111.1
8Canadian Journal of Forest Research1091.1
9Forest Ecology and Management1061.0
10Abstracts of Papers of the American Chemical Society1041.0
Table 5. Top 10 authors sorted by TLCSX.
IdentifierAuthorsRecordsPercentage/%TLCSTLCSx
1C.T. Driscoll (USA)1221.225811747
2G.E. Likens (USA)790.819601503
3R.F. Wright (Norway)620.61366948
4B.J. Cosby (USA)760.71333866
5J.N. Galloway (USA)290.31029864
6J.L. Stoddard (USA)160.21056787
7C.S. Cronan (USA)90.1751642
8D.T. Monteith (England)200.2799620
9G.B. Lawrence (USA)480.5880587
10T. Larssen (Norway)350.3758576
Table 6. Top 10 clusters.
Cluster IDSizeSilhouetteMean (Year)Representative Terms (LLR)
01530.9911996forest decline; phenological disorder; southern Quebec
1430.9121999southern Quebec; nutrient availability; soil chemistry
2360.8741999stemflow chemistry; epiphytic lichen diversity; Harz mountain
3290.9272001forest decline; phenological disorder; atmospheric nitrogen deposition
4260.9461997Pseudotsuga menziesii; Pinus ponderosa; high exposure
5250.8881998air pollution; lichen Ramalina duriaei; spectral reflectance response
6220.9472003common loon; Nova Scotia; circumneutral lake
7170.9752004urban site; wet precipitation; chemical characteristics
8140.9972013acid rain stress; physiological characteristics; McClure seedling
980.9972011Athabasca oil sands region; Pinus banksiana; Populus tremuloide
Table 7. Keywords with bursts in the last three years.
KeywordsStrengthBeginEnd1980–2018
Behavior24.701620152018▂▂▂▂▂▂▂▂▂▂▂▂▂▂▂▂▂▂▂▂▂▂▂▂▂▂▂▂▂▂▂▂▂▂▂▃▃▃▃
Phosphorus6.476120152018▂▂▂▂▂▂▂▂▂▂▂▂▂▂▂▂▂▂▂▂▂▂▂▂▂▂▂▂▂▂▂▂▂▂▂▃▃▃▃
Fractionation9.312520152018▂▂▂▂▂▂▂▂▂▂▂▂▂▂▂▂▂▂▂▂▂▂▂▂▂▂▂▂▂▂▂▂▂▂▂▃▃▃▃
Soil acidification3.942920152016▂▂▂▂▂▂▂▂▂▂▂▂▂▂▂▂▂▂▂▂▂▂▂▂▂▂▂▂▂▂▂▂▂▂▂▃▃▂▂
Corrosion8.162920152018▂▂▂▂▂▂▂▂▂▂▂▂▂▂▂▂▂▂▂▂▂▂▂▂▂▂▂▂▂▂▂▂▂▂▂▃▃▃▃
Performance18.877820152018▂▂▂▂▂▂▂▂▂▂▂▂▂▂▂▂▂▂▂▂▂▂▂▂▂▂▂▂▂▂▂▂▂▂▂▃▃▃▃
Recovery5.478620162018▂▂▂▂▂▂▂▂▂▂▂▂▂▂▂▂▂▂▂▂▂▂▂▂▂▂▂▂▂▂▂▂▂▂▂▂▃▃▃
Rainwater5.930720162018▂▂▂▂▂▂▂▂▂▂▂▂▂▂▂▂▂▂▂▂▂▂▂▂▂▂▂▂▂▂▂▂▂▂▂▂▃▃▃
Trace element7.790920162018▂▂▂▂▂▂▂▂▂▂▂▂▂▂▂▂▂▂▂▂▂▂▂▂▂▂▂▂▂▂▂▂▂▂▂▂▃▃▃
Trend3.774220162018▂▂▂▂▂▂▂▂▂▂▂▂▂▂▂▂▂▂▂▂▂▂▂▂▂▂▂▂▂▂▂▂▂▂▂▂▃▃▃
Surface water4.335520162018▂▂▂▂▂▂▂▂▂▂▂▂▂▂▂▂▂▂▂▂▂▂▂▂▂▂▂▂▂▂▂▂▂▂▂▂▃▃▃
Table 8. Top 10 countries with bursts.
CountriesStrengthBeginEnd1980–2018
United States304.459519801994▃▃▃▃▃▃▃▃▃▃▃▃▃▃▃▂▂▂▂▂▂▂▂▂▂▂▂▂▂▂▂▂▂▂▂▂▂▂▂
People’s Republic of China140.691620132018▂▂▂▂▂▂▂▂▂▂▂▂▂▂▂▂▂▂▂▂▂▂▂▂▂▂▂▂▂▂▂▂▂▃▃▃▃▃▃
Japan35.732520002001▂▂▂▂▂▂▂▂▂▂▂▂▂▂▂▂▂▂▂▂▃▃▂▂▂▂▂▂▂▂▂▂▂▂▂▂▂▂▂
Finland19.769819891998▂▂▂▂▂▂▂▂▂▃▃▃▃▃▃▃▃▃▃▂▂▂▂▂▂▂▂▂▂▂▂▂▂▂▂▂▂▂▂
Germany19.186219942002▂▂▂▂▂▂▂▂▂▂▂▂▂▂▃▃▃▃▃▃▃▃▃▂▂▂▂▂▂▂▂▂▂▂▂▂▂▂▂
Iran11.670320112018▂▂▂▂▂▂▂▂▂▂▂▂▂▂▂▂▂▂▂▂▂▂▂▂▂▂▂▂▂▂▂▃▃▃▃▃▃▃▃
Canada10.660119841988▂▂▂▂▃▃▃▃▃▂▂▂▂▂▂▂▂▂▂▂▂▂▂▂▂▂▂▂▂▂▂▂▂▂▂▂▂▂▂
Romania9.838720092014▂▂▂▂▂▂▂▂▂▂▂▂▂▂▂▂▂▂▂▂▂▂▂▂▂▂▂▂▂▃▃▃▃▃▃▂▂▂▂
Scotland9.415619951999▂▂▂▂▂▂▂▂▂▂▂▂▂▂▂▃▃▃▃▃▂▂▂▂▂▂▂▂▂▂▂▂▂▂▂▂▂▂▂
Sweden7.601620002001▂▂▂▂▂▂▂▂▂▂▂▂▂▂▂▂▂▂▂▂▃▃▂▂▂▂▂▂▂▂▂▂▂▂▂▂▂▂▂
Table 9. Top 10 institutions with bursts.
InstitutionsStrengthBeginEnd1980–2018
Cornell University (USA)28.382319811997▃▃▃▃▃▃▃▃▃▃▃▃▃▃▃▃▃▂▂▂▂▂▂▂▂▂▂▂▂▂▂▂▂▂▂▂▂▂
United States Forest Service (USA)24.723619871997▂▂▂▂▂▂▂▃▃▃▃▃▃▃▃▃▃▃▂▂▂▂▂▂▂▂▂▂▂▂▂▂▂▂▂▂▂▂▂
University of Chinese Academy of Sciences (PR China)19.236920132018▂▂▂▂▂▂▂▂▂▂▂▂▂▂▂▂▂▂▂▂▂▂▂▂▂▂▂▂▂▂▂▂▂▃▃▃▃▃▃
United States Environmental Protection Agency (USA)18.503419801994▃▃▃▃▃▃▃▃▃▃▃▃▃▃▃▂▂▂▂▂▂▂▂▂▂▂▂▂▂▂▂▂▂▂▂▂▂▂▂
North Carolina State University (USA)15.346519811996▃▃▃▃▃▃▃▃▃▃▃▃▃▃▃▃▂▂▂▂▂▂▂▂▂▂▂▂▂▂▂▂▂▂▂▂▂▂
Trent University (Canada)13.76120032012▂▂▂▂▂▂▂▂▂▂▂▂▂▂▂▂▂▂▂▂▂▂▂▃▃▃▃▃▃▃▃▃▃▂▂▂▂▂▂
Institute of Ecosystem Studies (USA)13.416319982004▂▂▂▂▂▂▂▂▂▂▂▂▂▂▂▂▂▂▃▃▃▃▃▃▃▂▂▂▂▂▂▂▂▂▂▂▂▂▂
Oak Ridge National Laboratory (USA)13.39619851997▂▂▂▂▂▃▃▃▃▃▃▃▃▃▃▃▃▃▂▂▂▂▂▂▂▂▂▂▂▂▂▂▂▂▂▂▂▂▂
Chinese Academy of Sciences (PR China)12.683520152018▂▂▂▂▂▂▂▂▂▂▂▂▂▂▂▂▂▂▂▂▂▂▂▂▂▂▂▂▂▂▂▂▂▂▂▃▃▃▃
Pennsylvania State University (USA)10.341519841996▂▂▂▂▃▃▃▃▃▃▃▃▃▃▃▃▃▂▂▂▂▂▂▂▂▂▂▂▂▂▂▂▂▂▂▂▂▂▂
Table 10. Authors with bursts after 2010.
AuthorsStrengthBeginEnd1980–2018
L.H. Wang 8.363720102018▂▂▂▂▂▂▂▂▂▂▂▂▂▂▂▂▂▂▂▂▂▂▂▂▂▂▂▂▂▂▃▃▃▃▃▃▃▃▃
C.Q. Liu 4.752620102015▂▂▂▂▂▂▂▂▂▂▂▂▂▂▂▂▂▂▂▂▂▂▂▂▂▂▂▂▂▂▃▃▃▃▃▃▂▂▂
H. Jiang3.741920102013▂▂▂▂▂▂▂▂▂▂▂▂▂▂▂▂▂▂▂▂▂▂▂▂▂▂▂▂▂▂▃▃▃▃▂▂▂▂▂
J. Chen6.816520112018▂▂▂▂▂▂▂▂▂▂▂▂▂▂▂▂▂▂▂▂▂▂▂▂▂▂▂▂▂▂▂▃▃▃▃▃▃▃▃
H.L. Zheng 6.063620112014▂▂▂▂▂▂▂▂▂▂▂▂▂▂▂▂▂▂▂▂▂▂▂▂▂▂▂▂▂▂▂▃▃▃▃▂▂▂▂
T.W. Liu6.063620112014▂▂▂▂▂▂▂▂▂▂▂▂▂▂▂▂▂▂▂▂▂▂▂▂▂▂▂▂▂▂▂▃▃▃▃▂▂▂▂
X.Y. Zhang5.880520112018▂▂▂▂▂▂▂▂▂▂▂▂▂▂▂▂▂▂▂▂▂▂▂▂▂▂▂▂▂▂▂▃▃▃▃▃▃▃▃
W.H. Wang4.958420112014▂▂▂▂▂▂▂▂▂▂▂▂▂▂▂▂▂▂▂▂▂▂▂▂▂▂▂▂▂▂▂▃▃▃▃▂▂▂▂
P.G. Schaberg4.09420112015▂▂▂▂▂▂▂▂▂▂▂▂▂▂▂▂▂▂▂▂▂▂▂▂▂▂▂▂▂▂▂▃▃▃▃▃▂▂▂
W.X. Wang4.09420112015▂▂▂▂▂▂▂▂▂▂▂▂▂▂▂▂▂▂▂▂▂▂▂▂▂▂▂▂▂▂▂▃▃▃▃▃▂▂▂
G.B. Lawrence6.776620122018▂▂▂▂▂▂▂▂▂▂▂▂▂▂▂▂▂▂▂▂▂▂▂▂▂▂▂▂▂▂▂▂▃▃▃▃▃▃▃
T.J. Sullivan4.572120122018▂▂▂▂▂▂▂▂▂▂▂▂▂▂▂▂▂▂▂▂▂▂▂▂▂▂▂▂▂▂▂▂▃▃▃▃▃▃▃
L. Liu3.752720122016▂▂▂▂▂▂▂▂▂▂▂▂▂▂▂▂▂▂▂▂▂▂▂▂▂▂▂▂▂▂▂▂▃▃▃▃▃▂▂
Z.F. Wang4.918620132018▂▂▂▂▂▂▂▂▂▂▂▂▂▂▂▂▂▂▂▂▂▂▂▂▂▂▂▂▂▂▂▂▂▃▃▃▃▃▃
F.H. Wu4.446320132014▂▂▂▂▂▂▂▂▂▂▂▂▂▂▂▂▂▂▂▂▂▂▂▂▂▂▂▂▂▂▂▂▂▃▃▂▂▂▂
Q. Zhou8.786220142018▂▂▂▂▂▂▂▂▂▂▂▂▂▂▂▂▂▂▂▂▂▂▂▂▂▂▂▂▂▂▂▂▂▂▃▃▃▃▃
C.T. Driscoll7.260320142018▂▂▂▂▂▂▂▂▂▂▂▂▂▂▂▂▂▂▂▂▂▂▂▂▂▂▂▂▂▂▂▂▂▂▃▃▃▃▃
X. Liu5.771220142018▂▂▂▂▂▂▂▂▂▂▂▂▂▂▂▂▂▂▂▂▂▂▂▂▂▂▂▂▂▂▂▂▂▂▃▃▃▃▃
X.H. Huang7.177520152018▂▂▂▂▂▂▂▂▂▂▂▂▂▂▂▂▂▂▂▂▂▂▂▂▂▂▂▂▂▂▂▂▂▂▂▃▃▃▃
M. Li4.779820152018▂▂▂▂▂▂▂▂▂▂▂▂▂▂▂▂▂▂▂▂▂▂▂▂▂▂▂▂▂▂▂▂▂▂▂▃▃▃▃
Q. Zhang4.463720152016▂▂▂▂▂▂▂▂▂▂▂▂▂▂▂▂▂▂▂▂▂▂▂▂▂▂▂▂▂▂▂▂▂▂▂▃▃▂▂

