Effectiveness of Diversification Strategies for Ensuring Financial Sustainability of Construction Companies in the Republic of Korea


Abstract
1. Introduction
2. Literature Review
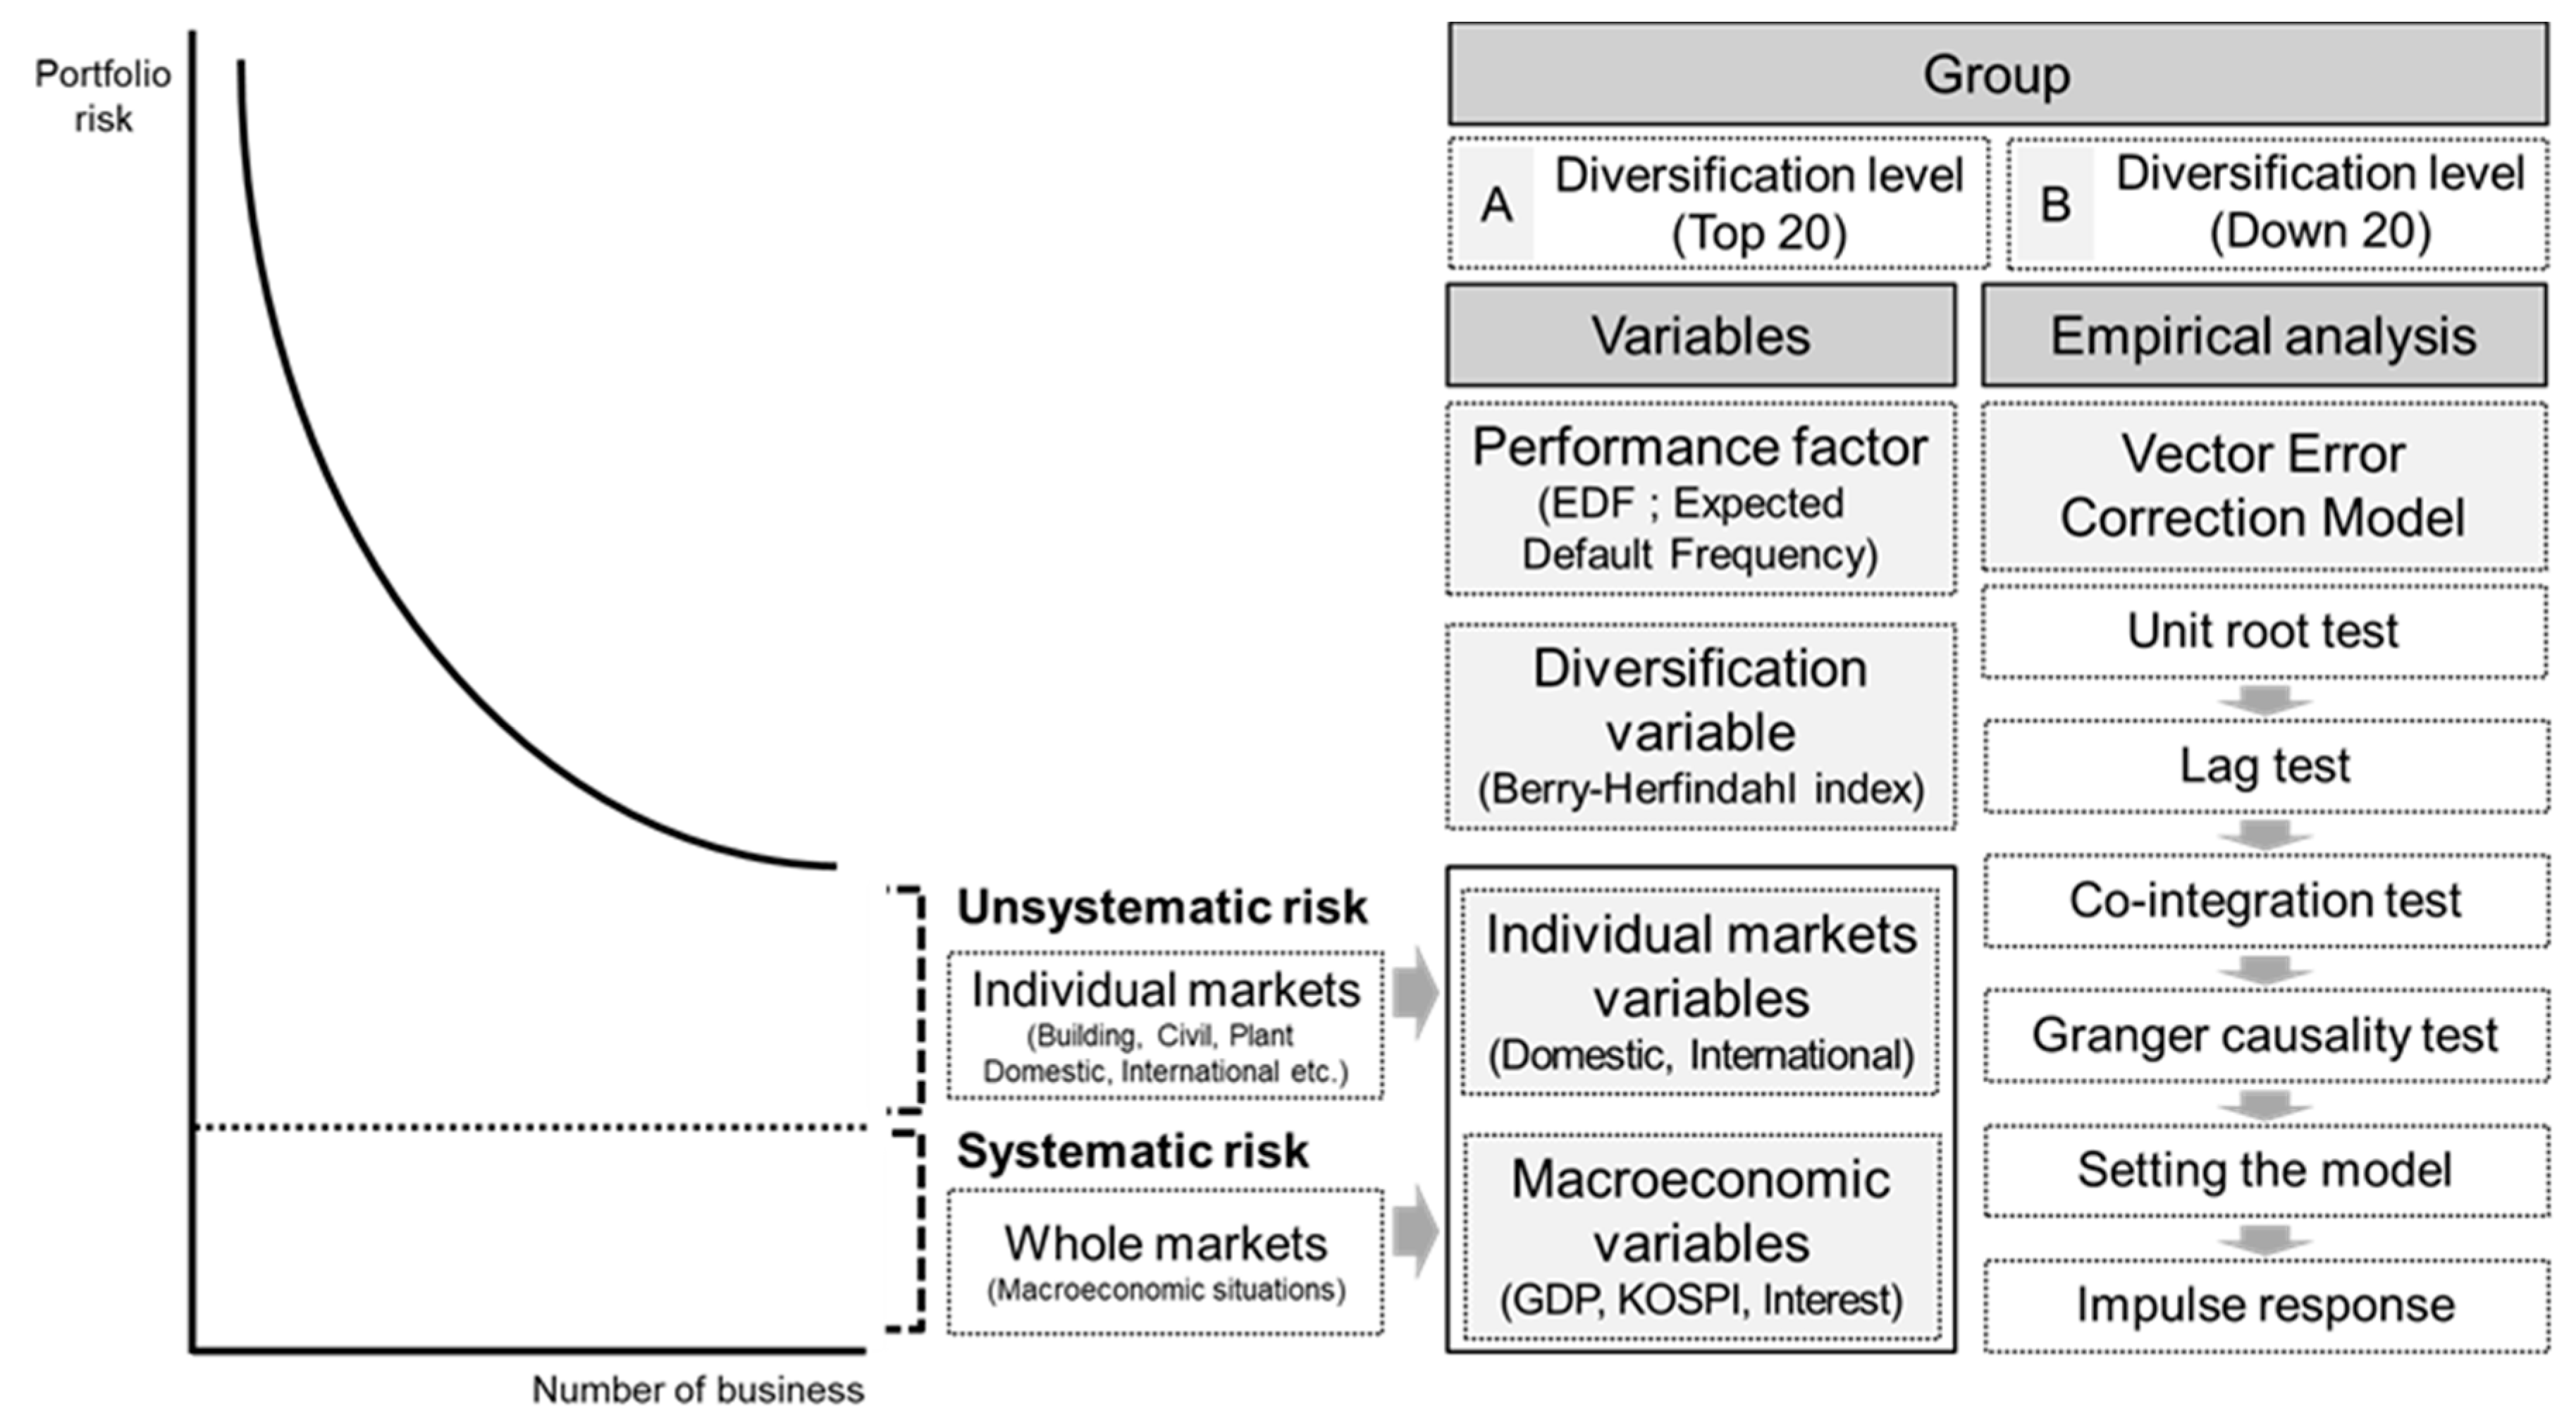
3. Methodology
3.1. The KMV Model
3.2. The Berry−Herfindahl Index
3.3. The Vector Auto-Regression (VAR) Model
4. Empirical Analysis
4.1. Variables and Data Collection
4.2. Unit Root Test
4.3. Cointegration Test
4.4. Granger Causality Test
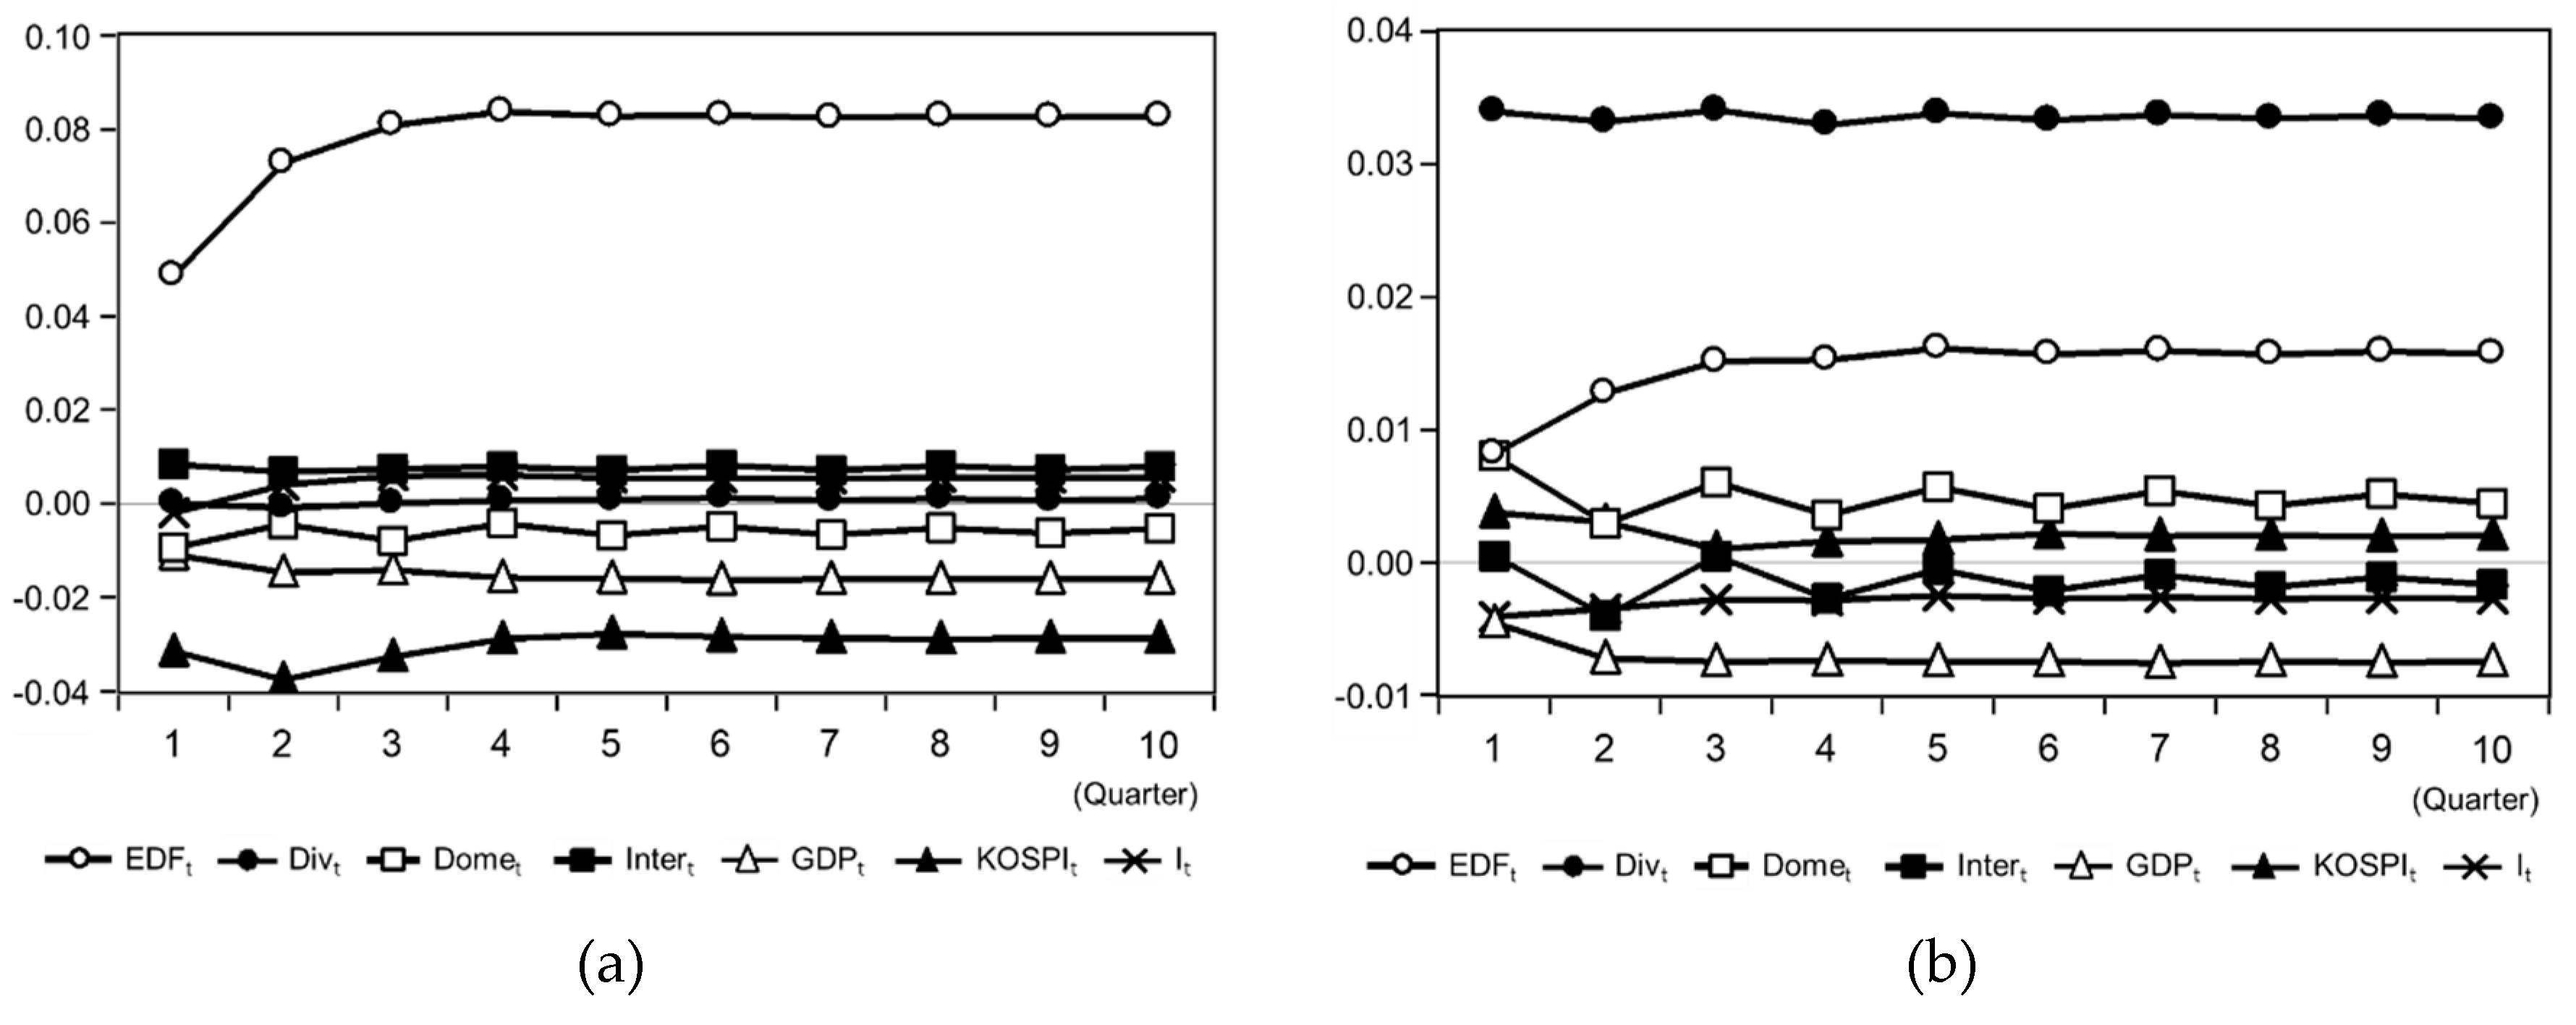
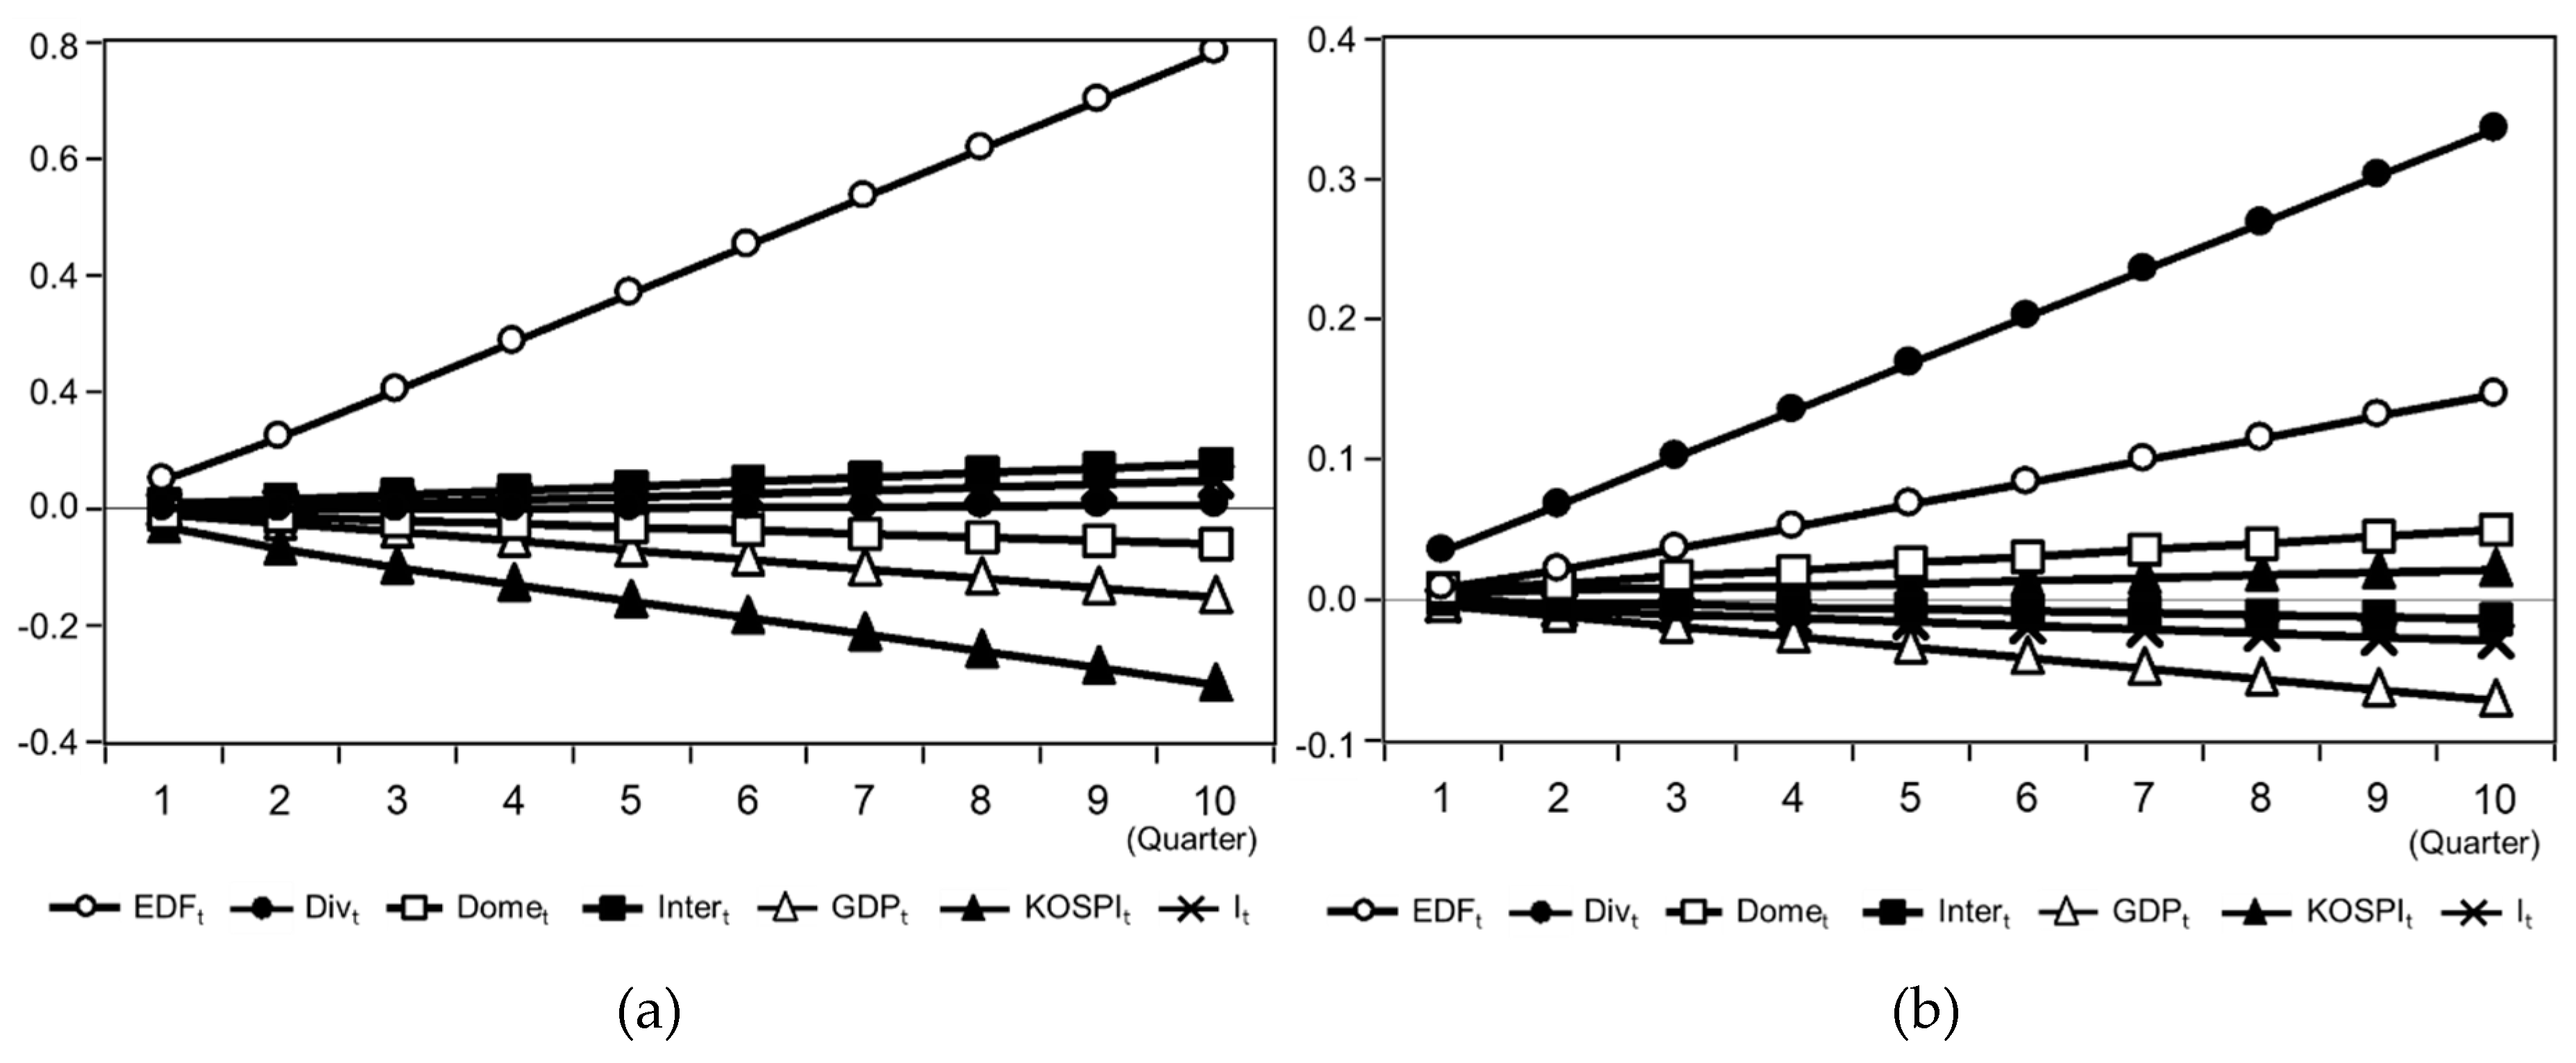
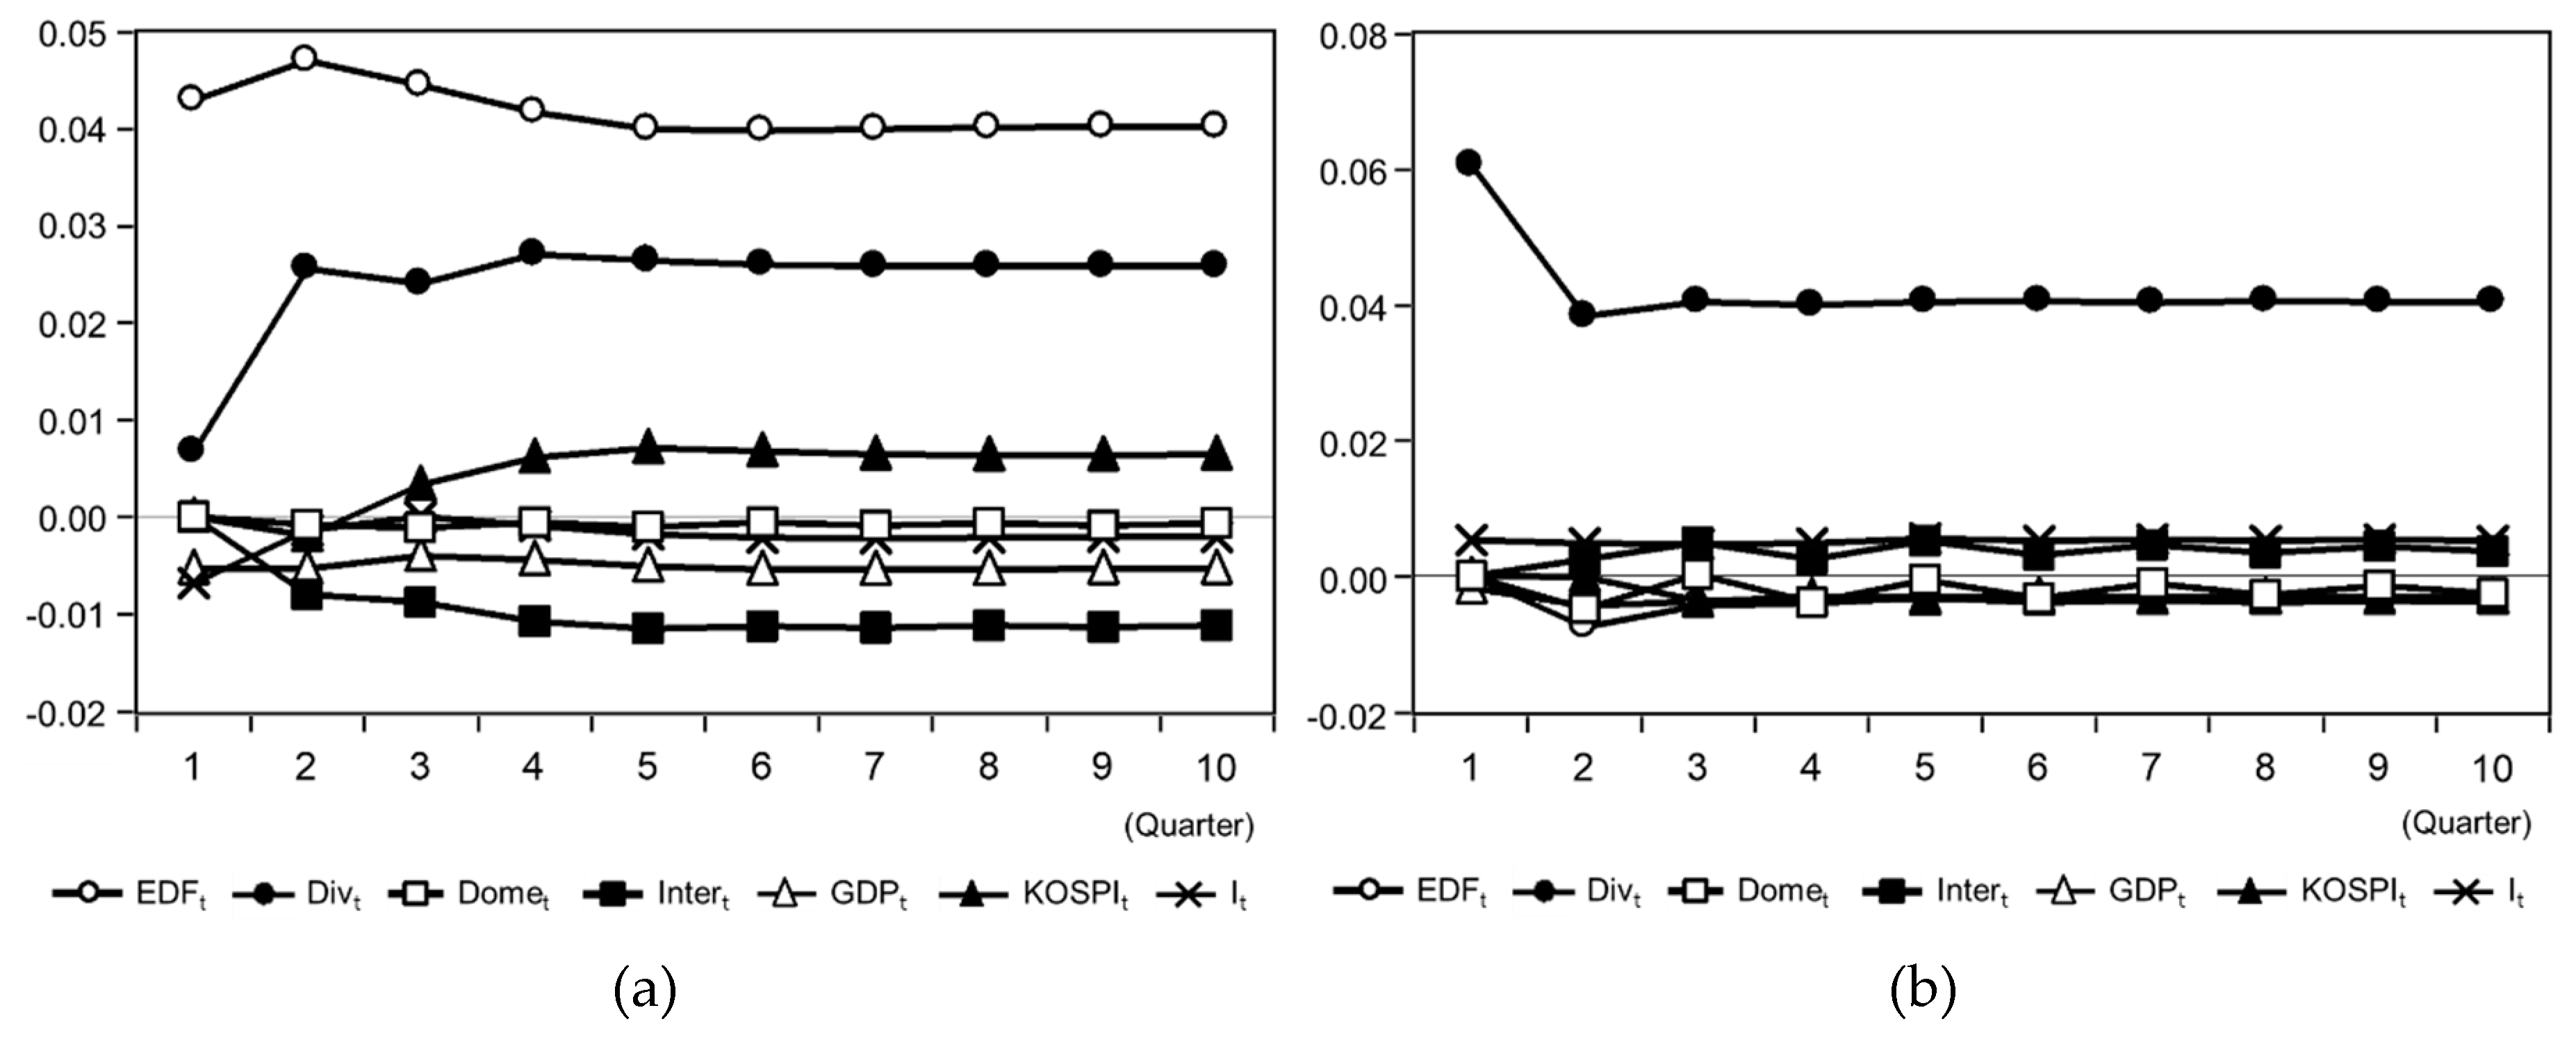
5. Results
6. Discussion and Conclusions
Author Contributions
Funding
Conflicts of Interest
References
- Iezza, P. Financial Sustainability of Microfinance Institutions (MFIs): An Empirical Analysis. Master’s Thesis, Copenhagen Business School, Copenhagen, Denmark, 2010. [Google Scholar]
- Hu, H.; Sathye, M. Predicting Financial Distress in the Hong Kong Growth Enterprises Market from the Perspective of Financial Sustainability. Sustainability 2015, 7, 1186–1200. [Google Scholar] [CrossRef]
- Ho, P.H.K. Analysis of Competitive Environments, Business Strategies, and Performance in Hong Kong’s Construction Industry. J. Manag. Eng. 2016, 32, 04015044. [Google Scholar] [CrossRef]
- Kim, H.; Reinschmidt, K.F. Association of Risk Attitude with Market Diversification in the Construction Business. J. Manag. Eng. 2011, 27, 66–74. [Google Scholar] [CrossRef]
- Jung, W.; Han, S.H.; Lee, K.W. Country Portfolio Solutions for Global Market Uncertainties. J. Manag. Eng. 2012, 28, 372–381. [Google Scholar] [CrossRef]
- Lee, S.; Tae, S.; Yoo, S.; Shin, S. Impact of Business Portfolio Diversification on Construction Company Insolvency in Korea. J. Manag. Eng. 2016, 28, 05016003. [Google Scholar] [CrossRef]
- Jiang, A.; Malek, M.; El-Safty, A. Business Strategy and Capital Allocation Optimization Model for Practitioners. J. Manag. Eng. 2011, 27, 58–63. [Google Scholar] [CrossRef]
- Ansoff, H.I. Corporate Strategy: Business Policy for Growth and Expansion; McGraw-Hill: New York, NY, USA, 1965. [Google Scholar]
- Steinter, G. Strategic Factors in Business Success; Financial Executives Research Foundation: New York, NY, USA, 1969. [Google Scholar]
- Rumelt, R.P. Strategy, Structure, and Economic Performance; Harvard University Press: Cambridge, MA, USA, 1974. [Google Scholar]
- Rubinstein, M. Markowitz’s Portfolio Selection: A Fifty-Year Retrospective. J. Financ. 2002, 57, 1041–1045. [Google Scholar] [CrossRef]
- Sung, Y.K.; Lee, J.H.; Yi, J.S.; Son, J.W. Establishment of Growth Strategies for International Construction Firms by Exploring Diversification-Related Determinants and Their Effects. J. Manag. Eng. 2017, 33, 04015044. [Google Scholar] [CrossRef]
- Yee, C.Y.; Cheah, C.Y.J. Fundamental Analysis of Profitability of Large Engineering and Construction Firms. J. Manag. Eng. 2006, 22, 203–210. [Google Scholar] [CrossRef]
- Yee, C.Y.; Cheah, C.Y. Interactions between Business and Financial Strategies of Large Engineering and Construction Firms. J. Manag. Eng. 2006, 22, 148–155. [Google Scholar] [CrossRef]
- Choi, J.; Russell, J.S. Long-term entropy and profitability change of United States public Construction firms. J. Manag. Eng. 2005, 21, 17–26. [Google Scholar] [CrossRef]
- Kim, H.; Reinschmidt, K. Market Structure and Organizational Performance of Construction Organizations. J. Manag. Eng. 2012, 28, 212–220. [Google Scholar] [CrossRef]
- Berger, P.G.; Ofek, E. Diversification’s effect on firm value. J. Financ. Econ. 1995, 37, 39–65. [Google Scholar] [CrossRef]
- Chandler, A.D. The Visible Hand: The Managerial Revolution in American Business; Harvard University Press: Cambridge, MA, USA, 1977. [Google Scholar]
- Weston, J.F. The Nature and Significance of Conglomerate Firms. St. John’s Law Rev. 1970, 44, 66–80. [Google Scholar]
- Stulz, R.M. Managerial Discretion and Optimal Financing Policies. J. Financ. Econ. 1990, 26, 3–27. [Google Scholar] [CrossRef]
- Lewellen, W.G. A Pure Financial Rationale for the Conglomerate Merger. J. Financ. 1971, 26, 521–537. [Google Scholar] [CrossRef]
- Jensen, M.C. Agency Costs of Free Cash Flow, Corporate Finance and Takeovers. Am. Econ. Rev. 1986, 76, 323–329. [Google Scholar]
- Meyer, M.; Milgrom, P.; Roberts, J. Organizational Prospects, Influence Costs, and Ownership Changes. J. Econom. Manag. Strategy 1992, 1, 9–35. [Google Scholar] [CrossRef]
- Harris, M.; Kriebel, C.H.; Raviv, A. Asymmetry Information, Incentives and Intra Firm Resource Allocation. Manag. Sci. 1982, 28, 604–620. [Google Scholar] [CrossRef]
- Cheah, Y.J. Fundamental Analysis and Conceptual Model for Corporate Strategy in Global Engineering and Construction Markets. Ph.D. Thesis, Massachusetts Institute of Technology, Cambridge, MA, USA, 2002. [Google Scholar]
- Beja, A. On Systematic and Unsystematic Components of Financial Risk. J. Financ. 1972, 27, 37–45. [Google Scholar] [CrossRef]
- Black, F.; Scholes, M. The pricing of options and corporate liabilities. J. Political Econ. 1973, 81, 637–654. [Google Scholar] [CrossRef]
- Merton, R.C. On the pricing of corporate debt: The risk structure of interest rates. J. Financ. 1974, 29, 449–470. [Google Scholar]
- Crosbie, P.; Bohn, J. Modeling Default Risk; Technical Rep.; Moody’s KMV: San Francisco, CA, USA, 2003. [Google Scholar]
- Berndt, A.; Douglas, R.; Duffie, D.; Ferguson, M.; Schranz, D. Measuring Default Risk Premia from Default Swap Rates and EDFs; Working Paper; Stanford University: Stanford, CA, USA, 2005. [Google Scholar]
- Berndt, A. Specification Analysis of Reduced-Form Credit Risk Models; Working Paper; Carnegie Mellon University: Pittsburgh, PA, USA, 2007. [Google Scholar]
- Souto, M.R.; Tabak, B.M.; Vazquez, F. Linking Financial and Macroeconomic Factor to Credit Risk Indicator of Brazilian Banks; Working Paper; Banco Central do Brasil: Brasilia, Brazil, 2009.
- Vassalou, M.; Xing, Y. Default risk in equity returns. J. Financ. 2004, 59, 831–868. [Google Scholar] [CrossRef]
- Montgomery, C.A. The measurement of firm diversification: Some new empirical evidence. Acad. Manag. J. 1982, 25, 299–307. [Google Scholar]
- Kranenburg, H.; Hagedoorn, J.; Pennings, J. Measurement of International and Product Diversification in the Publishing Industry. J. Media Econ. 2004, 17, 87–104. [Google Scholar] [CrossRef][Green Version]
- Lang, L.H.P.; Stulz, R.M. Tobin’s q, Corporate Diversification, and Firm Performance. J. Political Econ. 1994, 102, 1248–1280. [Google Scholar]
- Comment, R.; Jarrell, G.A. Corporate focus and stock returns. J. Financ. Econ. 1995, 37, 67–87. [Google Scholar] [CrossRef]
- Baffoe-Bonnie, J. The dynamic impact of macroeconomic aggregates on housing prices and stock of houses: A national and regional analysis. J. Real Estate Financ. Econ. 1998, 17, 179–197. [Google Scholar] [CrossRef]
- Cooley, T.F.; Leroy, S.F. A theoretical macroeconometrics: A critique. J. Monet. Econ. 1985, 16, 283–308. [Google Scholar] [CrossRef]
- Xu, J.; Moon, S. Stochastic forecast of construction cost index using a cointegrated vector autoregression model. J. Manag. Eng. 2013, 29, 10–18. [Google Scholar] [CrossRef]
- DeJong, D.N. Reconsidering trends and random walks in macroeconomic time series. J. Monet. Econ. 1991, 28, 221–254. [Google Scholar]
- Shahandashti, S.M.; Ashuri, B. Highway Construction Cost Forecasting Using Vector Error Correction Models. J. Manag. Eng. 2016, 32, 04015040. [Google Scholar] [CrossRef]
- Vassallo, J.M.; Ortega, A.; Baeza, M.D. Impact of the Economic Recession on Toll Highway Concessions in Spain. J. Manag. Eng. 2012, 28, 398–406. [Google Scholar]
- Kim, S.; Lee, S.; Kim, J. Relationship between the financial crisis of Korean construction firms and macroeconomic fluctuations. Eng. Constr. Archit. Manag. 2011, 18, 407–422. [Google Scholar]
- Jiang, H.; Liu, C. Forecasting construction demand: A vector error correction model with dummy variables. Constr. Manag. Econ. 2011, 29, 969–979. [Google Scholar] [CrossRef]
- Chen, H.L. Using Financial and Macroeconomic Indicators to Forecast Sales of Large Development and Construction Firms. J. Real Estate Financ. Econ. 2010, 40, 310–331. [Google Scholar]
- Wong, J.M.W.; NG, S.T. Forecasting Construction Tender Price Index in Hong Kong using Vector Error Correction Model. Constr. Manag. Econ. 2010, 28, 1255–1268. [Google Scholar] [CrossRef]
- Granger, C.W.J.; Newbold, P. Spurious regressions in econometrics. J. Econom. 1974, 2, 111–120. [Google Scholar] [CrossRef]
- Eagle, R.; Granger, C. Cointegration and error correction: Representation, estimation and testing. Econometrica 1987, 55, 251–276. [Google Scholar]
- Boswijk, H.P. Efficient inference on cointegration parameters in structural error correction models. J. Econom. 1995, 69, 133–158. [Google Scholar] [CrossRef]
- Granger, C.W.J. Investigating Causal Relations by Econometric Models and Cross-Spectral Methods. Econometrica 1969, 37, 424–438. [Google Scholar] [CrossRef]
- Phillips, P.C.B. Impulse Response and Forecast Error Variance Asymptotics in Nonstationary VARs. J. Econom. 1998, 83, 21–56. [Google Scholar] [CrossRef]
- Lee, S.; Ahn, Y.; Shin, S. The Impact of Multinational Business Diversification on the Financial Sustainability of Construction Firms in Korea. Sustainability 2016, 8, 997. [Google Scholar] [CrossRef]


| Studies | Variables | |
|---|---|---|
| Shahandashti et al. (2016) [42] |
|
|
| Vassallo et al. (2012) [43] |
|
|
| Kim et al. (2011) [44] |
|
|
| Jiang et al. (2011) [45] |
|
|
| Chen (2010) [46] |
|
|
| Wong et al. (2010) [47] |
|
|
| Variables | Descriptions | Period | Frequency |
|---|---|---|---|
| EDFt | Expected Default Frequency | 2001:01–2017:04 | Quarterly |
| Divt | Diversification index | 2001:01–2017:04 | Quarterly |
| Domet | Domestic construction order | 2001:01–2017:04 | Quarterly |
| Intert | International construction order | 2001:01–2017:04 | Quarterly |
| GDPt | Gross Domestic Product | 2001:01–2017:04 | Quarterly |
| KOSPIt | Korea Composite Stock Price Index | 2001:01–2017:04 | Quarterly |
| It | Interest rate | 2001:01–2017:04 | Quarterly |
| Variables | Level | 1st Differencing | |||
|---|---|---|---|---|---|
| t-Statistic | p-Value | t-Statistic | p-Value | ||
| Group A (Top 20) | EDFt | −2.288254 | 0.4341 | −5.742322 | 0.0001 |
| Divt | −2.256928 | 0.4509 | −8.428268 | 0.0000 | |
| Domet | −2.176384 | 0.4940 | −10.00393 | 0.0000 | |
| Intert | −2.023805 | 0.5776 | −7.692541 | 0.0000 | |
| GDPt | −2.196584 | 0.4835 | −8.557918 | 0.0000 | |
| KOSPIt | −2.537528 | 0.3098 | −7.670869 | 0.0000 | |
| It | −2.636346 | 0.2662 | −5.970069 | 0.0000 | |
| Group B (Bottom 20) | EDFt | −1.934036 | 0.6257 | −7.074419 | 0.0000 |
| Divt | −1.256623 | 0.8897 | −11.18367 | 0.0000 | |
| Domet | −2.176384 | 0.4940 | −10.00393 | 0.0000 | |
| Intert | −2.023805 | 0.5776 | −7.692541 | 0.0000 | |
| GDPt | −2.196584 | 0.4835 | −8.557918 | 0.0000 | |
| KOSPtt | −2.537528 | 0.3098 | −7.670869 | 0.0000 | |
| It | −2.636346 | 0.2662 | −5.970069 | 0.0000 | |
| Lag | Group A (Top 20) | Group B (Bottom 20) |
|---|---|---|
| 0 | −4.790108 | −4.644374 |
| 1 | −14.78307 * | −14.08532 * |
| 2 | −12.63590 | −12.16952 |
| 3 | −11.02191 | −10.32565 |
| 4 | −9.906206 | −9.554788 |
| 5 | −10.01882 | −9.074798 |
| Group | Null Hypothesis | Test Statistic | 0.05 Critical Value | p-Value |
|---|---|---|---|---|
| Group A (Top 20) | r = 0 * | 184.7436 | 134.6780 | 0.0000 |
| r ≤ 1 * | 119.0589 | 103.8473 | 0.0034 | |
| r ≤ 2 | 76.21558 | 76.97277 | 0.0570 | |
| r ≤ 3 | 46.73913 | 54.07904 | 0.1915 | |
| r ≤ 4 | 25.40241 | 35.19275 | 0.3762 | |
| r ≤ 5 | 10.00070 | 20.26184 | 0.6398 | |
| r ≤ 6 | 3.267762 | 9.164546 | 0.5319 | |
| Group B (Bottom 20) | r = 0 * | 187.1327 | 134.6780 | 0.0000 |
| r ≤ 1 * | 120.6725 | 103.8473 | 0.0024 | |
| r ≤ 2 * | 84.07724 | 76.97277 | 0.0130 | |
| r ≤ 3 | 53.04259 | 54.07904 | 0.0617 | |
| r ≤ 4 | 26.41871 | 35.19275 | 0.3190 | |
| r ≤ 5 | 10.00521 | 20.26184 | 0.6393 | |
| r ≤ 6 | 3.727490 | 9.164546 | 0.4542 |
| Causality | Lag | F-Statistic | p-Value | Causality | Lag | F-Statistic | p-Value | ||||
|---|---|---|---|---|---|---|---|---|---|---|---|
| Divt | → | EDFt | 1 | 0.03897 | 0.8441 | Divt | → | EDFt | 2 | 0.08274 | 0.9207 |
| EDFt | → | Divt | 1 | 0.00630 | 0.9370 | EDFt | → | Divt | 2 | 0.80825 | 0.4504 |
| Domet | → | EDFt | 1 | 1.64984 | 0.2036 | Domet | → | EDFt | 2 | 1.49146 | 0.2331 |
| EDFt | → | Domet | 1 | 1.71782 | 0.1947 | EDFt | → | Domet | 2 | 1.13456 | 0.3283 |
| Intert | → | EDFt | 1 | 2.06555 | 0.1555 | Intert | → | EDFt | 2 | 0.81739 | 0.4464 |
| EDFt | → | Intert | 1 | 1.88974 | 0.1740 | EDFt | → | Intert | 2 | 1.98089 | 0.1467 |
| GDPt | → | EDFt | 1 | 0.98597 | 0.3245 | GDPt | → | EDFt | 2 | 0.33846 | 0.7142 |
| EDFt | → | GDPt | 1 | 0.00267 | 0.9589 | EDFt | → | GDPt | 2 | 0.85788 | 0.4291 |
| KOSPIt | → | EDFt | 1 | 1.74257 | 0.1915 | KOSPIt | → | EDFt | 2 | 0.83698 | 0.4379 |
| EDFt | → | KOSPIt | 1 | 0.01985 | 0.8884 | EDFt | → | KOSPIt | 2 | 1.40062 | 0.2543 |
| It | → | EDFt | 1 | 0.15797 | 0.6924 | It | → | EDFt | 2 | 0.18248 | 0.8337 |
| EDFt | → | It | 1 | 6.00536 | 0.0170 ** | EDFt | → | It | 2 | 4.08024 | 0.0217 ** |
| Domet | → | Divt | 1 | 4.81324 | 0.0319 ** | Domet | → | Divt | 2 | 3.31613 | 0.0429 ** |
| Divt | → | Domet | 1 | 45.49460 | 0.0000 *** | Divt | → | Domet | 2 | 7.38780 | 0.0013 *** |
| Intert | → | Divt | 1 | 0.14785 | 0.7019 | Intert | → | Divt | 2 | 0.82550 | 0.4428 |
| Divt | → | Intert | 1 | 0.33952 | 0.5622 | Divt | → | Intert | 2 | 0.60570 | 0.5489 |
| GDPt | → | Divt | 1 | 1.50307 | 0.2247 | GDPt | → | Divt | 2 | 0.88791 | 0.4168 |
| Divt | → | GDPt | 1 | 0.17637 | 0.6759 | Divt | → | GDPt | 2 | 0.87170 | 0.4234 |
| KOSPIt | → | Divt | 1 | 0.45708 | 0.5014 | KOSPIt | → | Divt | 2 | 0.25796 | 0.7735 |
| Divt | → | KOSPIt | 1 | 0.45731 | 0.5013 | Divt | → | KOSPIt | 2 | 0.31094 | 0.7339 |
| It | → | Divt | 1 | 3.12513 | 0.0819 * | It | → | Divt | 2 | 1.68616 | 0.1937 |
| Divt | → | It | 1 | 0.71606 | 0.4006 | Divt | → | It | 2 | 1.10181 | 0.3388 |
| Intert | → | Domet | 1 | 2.72054 | 0.1040 | Intert | → | Domet | 2 | 0.24470 | 0.7837 |
| Domet | → | Intert | 1 | 0.89698 | 0.3472 | Domet | → | Intert | 2 | 0.04754 | 0.9536 |
| GDPt | → | Domet | 1 | 21.36440 | 0.0000 *** | GDPt | → | Domet | 2 | 1.67801 | 0.1952 |
| Domet | → | GDPt | 1 | 3.31413 | 0.0734 * | Domet | → | GDPt | 2 | 1.97320 | 0.1478 |
| KOSPIt | → | Domet | 1 | 12.95720 | 0.0006 *** | KOSPIt | → | Domet | 2 | 0.36948 | 0.6926 |
| Domet | → | KOSPIt | 1 | 0.60473 | 0.4396 | Domet | → | KOSPIt | 2 | 1.23951 | 0.2967 |
| It | → | Domet | 1 | 19.07310 | 0.0001 *** | It | → | Domet | 2 | 2.08284 | 0.1333 |
| Domet | → | It | 1 | 0.95934 | 0.3310 | Domet | → | It | 2 | 1.05720 | 0.3537 |
| GDPt | → | Intert | 1 | 7.17528 | 0.0094 *** | GDPt | → | Intert | 2 | 0.37230 | 0.6907 |
| Intert | → | GDPt | 1 | 0.59938 | 0.4417 | Intert | → | GDPt | 2 | 0.32007 | 0.7273 |
| KOSPIt | → | Intert | 1 | 27.07080 | 0.0000 *** | KOSPIt | → | Intert | 2 | 3.83421 | 0.0270 ** |
| Intert | → | KOSPIt | 1 | 1.55828 | 0.2165 | Intert | → | KOSPIt | 2 | 2.08853 | 0.1326 |
| It | → | Intert | 1 | 1.09998 | 0.2982 | It | → | Intert | 2 | 0.39386 | 0.6761 |
| Intert | → | It | 1 | 0.02404 | 0.8773 | Intert | → | It | 2 | 1.36581 | 0.2629 |
| KOSPIt | → | GDPt | 1 | 0.72753 | 0.3969 | KOSPIt | → | GDPt | 2 | 6.44671 | 0.0029 *** |
| GDPt | → | KOSPIt | 1 | 3.33492 | 0.0725 * | GDPt | → | KOSPIt | 2 | 3.31223 | 0.0431 ** |
| It | → | GDPt | 1 | 3.88050 | 0.0532 * | It | → | GDPt | 2 | 2.55114 | 0.0863 * |
| GDPt | → | It | 1 | 1.55181 | 0.2174 | GDPt | → | It | 2 | 4.46511 | 0.0155 ** |
| It | → | KOSPIt | 1 | 5.84890 | 0.0184 ** | It | → | KOSPIt | 2 | 4.40046 | 0.0164 ** |
| KOSPIt | → | It | 1 | 0.75323 | 0.3887 | KOSPIt | → | It | 2 | 4.79273 | 0.0117 ** |
| Causality | Lag | F-Statistic | p-Value | Causality | Lag | F-Statistic | p-Value | ||||
|---|---|---|---|---|---|---|---|---|---|---|---|
| Divt | → | EDFt | 1 | 16.13920 | 0.0002 *** | Divt | → | EDFt | 2 | 9.08397 | 0.0004 *** |
| EDFt | → | Divt | 1 | 0.49876 | 0.4826 | EDFt | → | Divt | 2 | 0.64712 | 0.5271 |
| Domet | → | EDFt | 1 | 0.09912 | 0.7539 | Domet | → | EDFt | 2 | 0.18716 | 0.8298 |
| EDFt | → | Domet | 1 | 33.95010 | 0.0000 *** | EDFt | → | Domet | 2 | 4.27682 | 0.0183 ** |
| Intert | → | EDFt | 1 | 0.07290 | 0.7880 | Intert | → | EDFt | 2 | 0.17063 | 0.8435 |
| EDFt | → | Intert | 1 | 1.94856 | 0.1676 | EDFt | → | Intert | 2 | 3.25771 | 0.0453 ** |
| GDPt | → | EDFt | 1 | 0.67917 | 0.4129 | GDPt | → | EDFt | 2 | 0.50428 | 0.6064 |
| EDFt | → | GDPt | 1 | 0.38621 | 0.5365 | EDFt | → | GDPt | 2 | 0.82186 | 0.4444 |
| KOSPIt | → | EDFt | 1 | 0.00719 | 0.9327 | KOSPIt | → | EDFt | 2 | 0.00421 | 0.9958 |
| EDFt | → | KOSPIt | 1 | 0.33005 | 0.5676 | EDFt | → | KOSPIt | 2 | 1.30267 | 0.2793 |
| It | → | EDFt | 1 | 4.38476 | 0.0402 ** | It | → | EDFt | 2 | 2.19165 | 0.1205 |
| EDFt | → | It | 1 | 1.26409 | 0.2651 | EDFt | → | It | 2 | 0.24124 | 0.7864 |
| Domet | → | Divt | 1 | 0.87802 | 0.3523 | Domet | → | Divt | 2 | 0.31499 | 0.7310 |
| Divt | → | Domet | 1 | 45.31040 | 0.0000 *** | Divt | → | Domet | 2 | 10.76850 | 0.0001 *** |
| Intert | → | Divt | 1 | 0.60425 | 0.4398 | Intert | → | Divt | 2 | 0.37339 | 0.6900 |
| Divt | → | Intert | 1 | 0.10362 | 0.7486 | Divt | → | Intert | 2 | 0.29525 | 0.7454 |
| GDPt | → | Divt | 1 | 2.40636 | 0.1258 | GDPt | → | Divt | 2 | 1.61471 | 0.2073 |
| Divt | → | GDPt | 1 | 0.03293 | 0.8566 | Divt | → | GDPt | 2 | 0.86908 | 0.4245 |
| KOSPIt | → | Divt | 1 | 1.00157 | 0.3207 | KOSPIt | → | Divt | 2 | 0.56680 | 0.5703 |
| Divt | → | KOSPIt | 1 | 1.26919 | 0.2641 | Divt | → | KOSPIt | 2 | 0.73702 | 0.4828 |
| It | → | Divt | 1 | 4.09666 | 0.0471 ** | It | → | Divt | 2 | 1.98378 | 0.1463 |
| Divt | → | It | 1 | 1.43270 | 0.2357 | Divt | → | It | 2 | 1.63926 | 0.2026 |
| Intert | → | Domet | 1 | 2.72054 | 0.1040 | Intert | → | Domet | 2 | 0.24470 | 0.7837 |
| Domet | → | Intert | 1 | 0.89698 | 0.3472 | Domet | → | Intert | 2 | 0.04754 | 0.9536 |
| GDPt | → | Domet | 1 | 21.36440 | 0.0000 *** | GDPt | → | Domet | 2 | 1.67801 | 0.1952 |
| Domet | → | GDPt | 1 | 3.31413 | 0.0734 * | Domet | → | GDPt | 2 | 1.97320 | 0.1478 |
| KOSPIt | → | Domet | 1 | 12.95720 | 0.0006 *** | KOSPIt | → | Domet | 2 | 0.36948 | 0.6926 |
| Domet | → | KOSPIt | 1 | 0.60473 | 0.4396 | Domet | → | KOSPIt | 2 | 1.23951 | 0.2967 |
| It | → | Domet | 1 | 19.07310 | 0.0001 *** | It | → | Domet | 2 | 2.08284 | 0.1333 |
| Domet | → | It | 1 | 0.95934 | 0.3310 | Domet | → | It | 2 | 1.05720 | 0.3537 |
| GDPt | → | Intert | 1 | 7.17528 | 0.0094 *** | GDPt | → | Intert | 2 | 0.37230 | 0.6907 |
| Intert | → | GDPt | 1 | 0.59938 | 0.4417 | Intert | → | GDPt | 2 | 0.32007 | 0.7273 |
| KOSPIt | → | Intert | 1 | 27.07080 | 0.0000 *** | KOSPIt | → | Intert | 2 | 3.83421 | 0.0270 ** |
| Intert | → | KOSPIt | 1 | 1.55828 | 0.2165 | Intert | → | KOSPIt | 2 | 2.08853 | 0.1326 |
| It | → | Intert | 1 | 1.09998 | 0.2982 | It | → | Intert | 2 | 0.39386 | 0.6761 |
| Intert | → | It | 1 | 0.02404 | 0.8773 | Intert | → | It | 2 | 1.36581 | 0.2629 |
| KOSPIt | → | GDPt | 1 | 0.72753 | 0.3969 | KOSPIt | → | GDPt | 2 | 6.44671 | 0.0029 *** |
| GDPt | → | KOSPIt | 1 | 3.33492 | 0.0725 * | GDPt | → | KOSPIt | 2 | 3.31223 | 0.0431 ** |
| It | → | GDPt | 1 | 3.88050 | 0.0532 * | It | → | GDPt | 2 | 2.55114 | 0.0863 * |
| GDPt | → | It | 1 | 1.55181 | 0.2174 | GDPt | → | It | 2 | 4.46511 | 0.0155 ** |
| It | → | KOSPIt | 1 | 5.84890 | 0.0184 ** | It | → | KOSPIt | 2 | 4.40046 | 0.0164 ** |
| KOSPIt | → | It | 1 | 0.75323 | 0.3887 | KOSPIt | → | It | 2 | 4.79273 | 0.0117 ** |
| Dependent Variable | Period (Quarter) | Independent Variables | ||||||
|---|---|---|---|---|---|---|---|---|
| EDFt | Divt | Domet | Intert | GDPt | KOSPIt | It | ||
| EDFt | 1 | 0.04866 | 0.00000 | −0.00946 | 0.00842 | −0.01097 | −0.03156 | −0.00196 |
| 2 | 0.07274 | −0.00088 | −0.00445 | 0.00676 | −0.01468 | −0.03767 | 0.00396 | |
| 3 | 0.08082 | −0.00003 | −0.00794 | 0.00734 | −0.01420 | −0.03276 | 0.00593 | |
| 4 | 0.08368 | 0.00074 | −0.00414 | 0.00784 | −0.01588 | −0.02893 | 0.00613 | |
| 5 | 0.08272 | 0.00087 | −0.00692 | 0.00705 | −0.01596 | −0.02775 | 0.00550 | |
| 6 | 0.08283 | 0.00112 | −0.00485 | 0.00816 | −0.01641 | −0.02850 | 0.00548 | |
| 7 | 0.08233 | 0.00074 | −0.00662 | 0.00716 | −0.01613 | −0.02871 | 0.00536 | |
| 8 | 0.08276 | 0.00098 | −0.00522 | 0.00804 | −0.01624 | −0.02896 | 0.00554 | |
| 9 | 0.08253 | 0.00075 | −0.00633 | 0.00726 | −0.01611 | −0.02874 | 0.00545 | |
| 10 | 0.08276 | 0.00097 | −0.00543 | 0.00791 | −0.01621 | −0.02881 | 0.00554 | |
| Divt | 1 | 0.00818 | 0.03395 | 0.00800 | 0.00042 | −0.00458 | 0.00374 | −0.00414 |
| 2 | 0.01270 | 0.03319 | 0.00289 | −0.00408 | −0.00731 | 0.00300 | −0.00355 | |
| 3 | 0.01514 | 0.03405 | 0.00602 | 0.00043 | −0.00749 | 0.00096 | −0.00284 | |
| 4 | 0.01524 | 0.03295 | 0.00352 | −0.00276 | −0.00744 | 0.00156 | −0.00288 | |
| 5 | 0.01609 | 0.03381 | 0.00567 | −0.00055 | −0.00752 | 0.00168 | −0.00256 | |
| 6 | 0.01565 | 0.03330 | 0.00400 | −0.00218 | −0.00751 | 0.00216 | −0.00279 | |
| 7 | 0.01595 | 0.03372 | 0.00534 | −0.00094 | −0.00761 | 0.00193 | −0.00268 | |
| 8 | 0.01564 | 0.03339 | 0.00424 | −0.00188 | −0.00754 | 0.00204 | −0.00280 | |
| 9 | 0.01587 | 0.03363 | 0.00512 | −0.00115 | −0.00760 | 0.00189 | −0.00270 | |
| 10 | 0.01570 | 0.03344 | 0.00442 | −0.00172 | −0.00754 | 0.00200 | −0.00277 | |
| Dependent Variable | Period (Quarter) | Independent Variables | ||||||
|---|---|---|---|---|---|---|---|---|
| EDFt | Divt | Domet | Intert | GDPt | KOSPIt | It | ||
| EDFt | 1 | 0.04866 | 0.00000 | −0.00946 | 0.00842 | −0.01097 | −0.03156 | −0.00196 |
| 2 | 0.12140 | −0.00088 | −0.01391 | 0.01518 | −0.02564 | −0.06923 | 0.00201 | |
| 3 | 0.20222 | −0.00091 | −0.02185 | 0.02252 | −0.03984 | −0.10199 | 0.00793 | |
| 4 | 0.28590 | −0.00016 | −0.02599 | 0.03037 | −0.05572 | −0.13091 | 0.01406 | |
| 5 | 0.36861 | 0.00072 | −0.03291 | 0.03741 | −0.07167 | −0.15866 | 0.01956 | |
| 6 | 0.45144 | 0.00183 | −0.03776 | 0.04557 | −0.08808 | −0.18716 | 0.02505 | |
| 7 | 0.53376 | 0.00257 | −0.04439 | 0.05273 | −0.10421 | −0.21587 | 0.03040 | |
| 8 | 0.61652 | 0.00355 | −0.04961 | 0.06076 | −0.12044 | −0.24483 | 0.03594 | |
| 9 | 0.69905 | 0.00430 | −0.05594 | 0.06803 | −0.13656 | −0.27357 | 0.04140 | |
| 10 | 0.78181 | 0.00527 | −0.06137 | 0.07593 | −0.15276 | −0.30238 | 0.04693 | |
| Divt | 1 | 0.00818 | 0.03395 | 0.00800 | 0.00042 | −0.00458 | 0.00374 | −0.00414 |
| 2 | 0.02088 | 0.06713 | 0.01089 | −0.00366 | −0.01189 | 0.00674 | −0.00769 | |
| 3 | 0.03602 | 0.10118 | 0.01691 | −0.00323 | −0.01938 | 0.00770 | −0.01053 | |
| 4 | 0.05125 | 0.13413 | 0.02043 | −0.00599 | −0.02683 | 0.00927 | −0.01341 | |
| 5 | 0.06735 | 0.16794 | 0.02610 | −0.00654 | −0.03434 | 0.01094 | −0.01597 | |
| 6 | 0.08300 | 0.20124 | 0.03010 | −0.00871 | −0.04186 | 0.01310 | −0.01876 | |
| 7 | 0.09894 | 0.23496 | 0.03544 | −0.00965 | −0.04947 | 0.01503 | −0.02144 | |
| 8 | 0.11458 | 0.26835 | 0.03968 | −0.01153 | −0.05701 | 0.01707 | −0.02423 | |
| 9 | 0.13045 | 0.30199 | 0.04480 | −0.01268 | −0.06460 | 0.01896 | −0.02693 | |
| 10 | 0.14614 | 0.33543 | 0.04922 | −0.01440 | −0.07214 | 0.02096 | −0.02970 | |
| Dependent Variable | Period (Quarter) | Independent Variables | ||||||
|---|---|---|---|---|---|---|---|---|
| EDFt | Divt | Domet | Intert | GDPt | KOSPIt | It | ||
| EDFt | 1 | 0.04300 | 0.00667 | 0.00000 | 0.00000 | −0.00534 | 0.00000 | −0.00678 |
| 2 | 0.04712 | 0.02561 | −0.00081 | −0.00796 | −0.00534 | −0.00195 | −0.00138 | |
| 3 | 0.04451 | 0.02404 | −0.00110 | −0.00875 | −0.00401 | 0.00334 | 0.00004 | |
| 4 | 0.04171 | 0.02709 | −0.00051 | −0.01078 | −0.00439 | 0.00610 | −0.00086 | |
| 5 | 0.04001 | 0.02640 | −0.00100 | −0.01147 | −0.00508 | 0.00707 | −0.00177 | |
| 6 | 0.03984 | 0.02606 | −0.00053 | −0.01128 | −0.00542 | 0.00675 | −0.00212 | |
| 7 | 0.03999 | 0.02582 | −0.00088 | −0.01144 | −0.00541 | 0.00648 | −0.00218 | |
| 8 | 0.04021 | 0.02582 | −0.00059 | −0.01117 | −0.00539 | 0.00638 | −0.00207 | |
| 9 | 0.04021 | 0.02587 | −0.00084 | −0.01132 | −0.00533 | 0.00638 | −0.00207 | |
| 10 | 0.04024 | 0.02588 | −0.00064 | −0.01120 | −0.00535 | 0.00640 | −0.00203 | |
| Divt | 1 | 0.00000 | 0.06065 | 0.00000 | 0.00000 | −0.00170 | 0.00000 | 0.00533 |
| 2 | −0.00743 | 0.03835 | −0.00482 | 0.00248 | −0.00427 | −0.00010 | 0.00486 | |
| 3 | −0.00428 | 0.04044 | 0.00032 | 0.00496 | −0.00369 | −0.00364 | 0.00472 | |
| 4 | −0.00398 | 0.03999 | −0.00384 | 0.00251 | −0.00305 | −0.00338 | 0.00489 | |
| 5 | −0.00318 | 0.04042 | −0.00054 | 0.00517 | −0.00319 | −0.00340 | 0.00551 | |
| 6 | −0.00380 | 0.04055 | −0.00326 | 0.00311 | −0.00295 | −0.00336 | 0.00516 | |
| 7 | −0.00347 | 0.04039 | −0.00104 | 0.00464 | −0.00316 | −0.00324 | 0.00546 | |
| 8 | −0.00379 | 0.04054 | −0.00284 | 0.00343 | −0.00299 | −0.00329 | 0.00517 | |
| 9 | −0.00356 | 0.04041 | −0.00137 | 0.00437 | −0.00315 | −0.00325 | 0.00539 | |
| 10 | −0.00373 | 0.04050 | −0.00257 | 0.00366 | −0.00302 | −0.00329 | 0.00520 | |
| Dependent Variable | Period (Quarter) | Independent Variables | ||||||
|---|---|---|---|---|---|---|---|---|
| EDFt | Divt | Domet | Intert | GDPt | KOSPIt | It | ||
| EDFt | 1 | 0.04300 | 0.00667 | 0.00000 | 0.00000 | −0.00534 | 0.00000 | −0.00676 |
| 2 | 0.09012 | 0.03227 | −0.00081 | −0.00796 | −0.01068 | −0.00195 | −0.00814 | |
| 3 | 0.13464 | 0.05632 | −0.00190 | −0.01671 | −0.01469 | 0.00139 | −0.00810 | |
| 4 | 0.17634 | 0.08340 | −0.00241 | −0.02749 | −0.01908 | 0.00749 | −0.00896 | |
| 5 | 0.21636 | 0.10980 | −0.00342 | −0.03896 | −0.02415 | 0.01456 | −0.01073 | |
| 6 | 0.25620 | 0.13586 | −0.00395 | −0.05024 | −0.02958 | 0.02131 | −0.01284 | |
| 7 | 0.29619 | 0.16168 | −0.00483 | −0.06168 | −0.03499 | 0.02779 | −0.01502 | |
| 8 | 0.33640 | 0.18750 | −0.00542 | −0.07285 | −0.04037 | 0.03417 | −0.01710 | |
| 9 | 0.37661 | 0.21337 | −0.00625 | −0.08417 | −0.04571 | 0.04054 | −0.01916 | |
| 10 | 0.41685 | 0.23925 | −0.00689 | −0.09537 | −0.05106 | 0.04695 | −0.02119 | |
| Divt | 1 | 0.00000 | 0.06065 | 0.00000 | 0.00000 | −0.00170 | 0.00000 | 0.00533 |
| 2 | −0.00743 | 0.09900 | −0.00482 | 0.00248 | −0.00596 | −0.00010 | 0.01018 | |
| 3 | −0.01171 | 0.13944 | −0.00450 | 0.00743 | −0.00966 | −0.00374 | 0.01490 | |
| 4 | −0.01570 | 0.17943 | −0.00834 | 0.00994 | −0.01271 | −0.00711 | 0.01979 | |
| 5 | −0.01888 | 0.21984 | −0.00889 | 0.01512 | −0.01590 | −0.01051 | 0.02530 | |
| 6 | −0.02268 | 0.26039 | −0.01214 | 0.01822 | −0.01884 | −0.01387 | 0.03046 | |
| 7 | −0.02614 | 0.30078 | −0.01318 | 0.02286 | −0.02200 | −0.01711 | 0.03591 | |
| 8 | −0.02993 | 0.34132 | −0.01602 | 0.02629 | −0.02499 | −0.02040 | 0.04108 | |
| 9 | −0.03349 | 0.38172 | −0.01740 | 0.03066 | −0.02815 | −0.02364 | 0.04647 | |
| 10 | −0.03722 | 0.42222 | −0.01997 | 0.03429 | −0.03117 | −0.02694 | 0.05167 | |
© 2019 by the authors. Licensee MDPI, Basel, Switzerland. This article is an open access article distributed under the terms and conditions of the Creative Commons Attribution (CC BY) license (http://creativecommons.org/licenses/by/4.0/).
Share and Cite
Han, M.; Lee, S.; Kim, J. Effectiveness of Diversification Strategies for Ensuring Financial Sustainability of Construction Companies in the Republic of Korea. Sustainability 2019, 11, 3076. https://doi.org/10.3390/su11113076
Han M, Lee S, Kim J. Effectiveness of Diversification Strategies for Ensuring Financial Sustainability of Construction Companies in the Republic of Korea. Sustainability. 2019; 11(11):3076. https://doi.org/10.3390/su11113076
Chicago/Turabian StyleHan, Manchun, Sanghyo Lee, and Jaejun Kim. 2019. "Effectiveness of Diversification Strategies for Ensuring Financial Sustainability of Construction Companies in the Republic of Korea" Sustainability 11, no. 11: 3076. https://doi.org/10.3390/su11113076
APA StyleHan, M., Lee, S., & Kim, J. (2019). Effectiveness of Diversification Strategies for Ensuring Financial Sustainability of Construction Companies in the Republic of Korea. Sustainability, 11(11), 3076. https://doi.org/10.3390/su11113076