Abstract
In recent decades, building maintenance has been recognized as an important issue as the number of deteriorating buildings increases around the world. In densely populated cities, building maintenance is essential for ensuring sustainable living and safety for residents. Improper maintenance can not only cause enormous maintenance costs, but also negatively affect residents and their environment. As a first step, the service life of building components needs to be estimated in advance. Mechanical, electrical, and plumbing (MEP) components especially produce many maintenance-related problems compared to other components. In this research, a model was developed that applies the genetic algorithm (GA) and case-based reasoning (CBR) methodologies to estimating the service life of MEP components. The applicability of the model was tested by comparing the outputs of 20 randomly selected test cases with those of retrieved similar cases. The experimental results demonstrated that the overall similarity scores of the retrieved cases were over 90%, and the mean absolute error rate (MAER) of 10-NN was approximately 7.48%. This research contributes to the literature for maintenance management by not only presenting an approach to estimating the service life of building components, but also by helping convert the existing maintenance paradigm from reactive to proactive measures.
1. Introduction
In recent years, maintenance has become a key issue of concern for the life cycle of aged buildings around the world [,,]. Proper maintenance can not only preserve the building performance, but also improve the safety and quality of the residents’ lives by allowing deterioration to be recognized in advance [,,]. In particular, the service life or pattern of building components needs to be carefully examined because it can provide essential information for building management, such as managerial factors and the deteriorated status of components [,]. Considering the importance of maintenance for aging residential buildings, being able to estimate when major maintenance will be incurred during a building’s life cycle is important [,]. In the 1970s, massive numbers of apartment buildings were constructed in South Korea due to urbanization and industrialization [,,]. Such apartment buildings have increased because of the housing supply policy promoted by the government [] and make up the majority of housing in Korea []. According to the Ministry of Land, Infrastructure, and Transport [], outdated buildings over 30 years old account for 44.6% (3,205,774 buildings) of all buildings (7,191,912 buildings) in South Korea, and the proportion is expected to continue to increase [,]. As indicated in Table 1, residential buildings account for 64.3% (4,625,077 buildings) of all aged buildings [], which may lead to safety-related problems and degrade the original performance. These buildings can experience diverse problems such as concrete neutralization, corrosion of reinforcing steel, and equipment disorder that affect maintenance and commonly begin 10 years after the building is completed [,].

Table 1.
Status of deteriorating buildings depending on the region in Korea.
Especially, mechanical, electrical, and plumbing (MEP) components incur many of the maintenance-related problems of a building. MEP refers to nonstructural building facilities such as electricity, gas, water supply, heating, air conditioning, ventilation, and elevators [,,]. MEP-related maintenance costs may account for 50% of the total life cycle cost (LCC) for a large and complex building [,]. MEP is a significant part of buildings because it provides essential functions for the sustainable and comfortable living of residents. Therefore, appropriate maintenance management is required to preserve the original function and performance during its operation. Inadequate maintenance management can not only cause economic damage to residents because of building deterioration but also degrade the quality of the residents’ lives [,]. As a first step for building management, efforts need to be made to systematically estimate the service life in advance before significant deterioration begins.
Various studies and efforts have focused on estimating the optimal service life of components to determine when the maintenance of a building should be carried out. However, previous research presents limited performance towards estimating the service life from a long-term perspective because of the lack of collected past data and estimation methodologies. Furthermore, there has been limited consideration of various factors such as the building characteristics, maintenance types, number of maintenances, completion year, environment, and maintenance cost. Meanwhile, traditional building maintenance is based on fixed repair cycles of components, where each component is commonly repaired according to a predetermined mean time. However, such a deterministic approach has a limited ability to consider maintenance-related factors or uncertainties of building components. Furthermore, the scope of the maintenance is very extensive to be covered because a building comprises a number of components. This makes it more challenging to estimate the service life for maintenance and consequently deal with potential maintenance-related problems. In this respect, maintenance management based on previous data can be utilized as an alternative or supplement to current estimation approaches. This is because data from past projects have various types of information, such as the gross area, number of floors, number of households, parking lots, area for management, year of completion, and type and number of repairs, which enable reliable estimation. Thus, the present research focused on applying previous data regarding building maintenance to estimation. However, relevant past data are not systematically organized, and the factors associated with the service life of components and building maintenance have been inadequately examined.
To deal with this limitation, a model is developed for estimating the service life for maintenance based on previous data during the preconstruction phase. The scope of this research is limited to examining the service life of MEP components for which building repair occurs on a large scale, which would have a significant effect on the building performance. First, preliminary research is conducted on building maintenance and service life estimation based on an extensive literature review. Then, the limitations of existing approaches are identified. A model for estimating the service life for building maintenance is developed for application to current maintenance management. A database is established based on previous data or cases associated with the service life. Next, attributes are extracted and then weighted with the genetic algorithm (GA). Based on the weighted values of attributes, the similarity among cases is computed from the weighted Euclidean distance (WED). The most similar cases are extracted from the database in order to estimate the service life or pattern. Finally, the estimated values are validated by comparison with the original service life of the test cases. This estimation approach can be used to investigate the maintenance or repair that may be incurred by the aging or deterioration of building components; thus, it is expected to help contractors establish a preventive strategy for building maintenance in advance.
2. Preliminary Research
2.1. Literature Review
Building maintenance management is essential to ensuring the performance of a building during its life cycle and has been recognized as a major issue as the number of deteriorating buildings gradually increases [,]. Thus, proper management is needed to maintain the building performance and ensure residents’ safety and needs. However, this is a challenge because a building comprises various components that are affected by different factors such as the lifestyle, surrounding environment, usage pattern, and weather [,]. In particular, MEP components are an important part of buildings []. MEP components typically comprise diverse subsystems such as heating, ventilation, air conditioning, power distribution, fire protection, water supply, and drainage [,,]. In other words, they are combinations of subsystems complexly connected with equipment, wire, and pipes. Thus, inappropriate maintenance management may cause significant costs or degradation of the building performance. To deal with building maintenance problems, the service life or pattern should be identified as a first step towards establishing preventive measures. Many researchers have devoted a lot of efforts to improve current maintenance management and establishing management plans, as listed in Table 2.
Table 2.
Approaches and factors highlighted in previous research.
Park et al. [], Kim et al. [], and Lee and Ahn [] suggested probabilistic methods for estimating the maintenance cost and service life pattern of apartment buildings. Kim et al. [] used a loss distribution approach (LDA) to create a detailed matrix associated with the risk for maintenance. They thought that it is essential to consider the uncertainty when estimating the maintenance cost. Thus, they applied a Monte Carlo simulation (MCS) to deal with the uncertainty depending on the building conditions and characteristics. Based on the matrix, a distribution was derived for total the maintenance cost. The distribution demonstrated that maintenance 11–20 years after construction is closely associated with the repair cost. Park et al. [] and Lee and Ahn [] attempted to analyze service life patterns from a long-term perspective. They also adopted a probabilistic approach based on historical data to identify repair patterns in residential buildings. They focused on examining the service life for MEP and finishing components because these account for the majority of maintenance-related problems. They showed the service lives of building components based on a probabilistic distribution, and confirmed that each component has a different repair pattern depending on its characteristics. Their works are notable in that they suggested predictive methods for identifying maintenance-related costs and service life based on historical data. However, they merely focused on a stochastic approach towards maintenance management, so their ability to validate their results was limited. Furthermore, their research may have limited applicability to building maintenance because they only presented the probabilistic distribution for the maintenance cost or repair period; this is inadequate for site managers to recognize a specific degree of maintenance cost and service life.
Some groups have estimated the maintenance cost by focusing on the infrastructure. Sharma et al. [] estimated the maintenance cost of water treatment plants during the planning phase. They developed an equation for estimating the maintenance cost based on historical data updated with the construction cost index (CCI). They performed multiple regression analysis on the updated cost to develop a preliminary cost estimation model that includes operation and maintenance costs. They compared the estimated results with the original bidding cost to validate the proposed equation. Their model is a simple and convenient method for estimating the cost, but they did not ensure the accuracy because the cost estimation can change significantly depending on the site conditions, weather, competition among bidders, and economic conditions. Furthermore, the estimation scope addressed by the model is very extensive. These limitations may cause inaccurate results. Stenbeck [] elaborated upon the correlation between highway and maintenance costs during the winter season. In order to identify the linear relationship, the maintenance costs and snowfall based on weather data were utilized. The results confirmed that the cost and highway stations are correlated. This research is applicable to selecting the optimal location with regard to weather. However, there was limited consideration of various factors related to maintenance because the analysis focused only on snowfall data. Choi et al. [] developed a model for estimating future maintenance costs based on five factors: the pavement age, temperature, precipitation, thickness, and traffic loading. Statistical approaches, such as cluster analysis and regression analysis, were utilized to derive influential factors with regard to the maintenance cost. They found that the traffic load is the most critical factor that affects pavement degradation. However, some results regarding precipitation are limited because they may be changed depending on the data used in the experiment.
Other groups focused on strategic maintenance management and planning to support decision-making. Arif et al. [] proposed a framework for supporting decision-making regarding infrastructure maintenance investment. They adopted the multiattribute utility theory (MAUT), Markov decision process (MDP), and portfolio management to derive decision support results. They assessed their framework through case studies of four bridges in terms of three aspects: socioeconomic, infrastructure utilization, and physical condition. The developed framework provides useful data for infrastructure maintenance (i.e., performance trend curves, decision logic maps, and a network-level maintenance investment plan). Cho and Yoon [] developed a decision support model for estimating the best renovation time in terms of economics. They carried out a case study to identify the optimal cost-effective time. They analyzed five parameters to verify the developed model: the installation costs, energy costs, benefit, alternative value, and renovation time. The results demonstrated that the renovation time is closely associated with the initial installation cost. Elcheikh and Burrow [] developed an integrated maintenance model that considers data uncertainty. They performed a probabilistic approach based on MCS to identify the maintenance cost and deal with uncertainty related to building deterioration and repair cost. They found a large variation between preventive maintenance and repair costs, which represents larger uncertainty in assets. Their findings can be utilized in asset management to improve upon existing decision-making associated with cost budgeting and investment. These studies are noteworthy because factors from diverse perspectives were applied to the estimation. However, such approaches are limited at estimating the maintenance-related cost during preconstruction because they address extensive scopes such as economics and assets. Thus, the cases or data for validation are inadequate. This makes reliable estimation for repair cost and validation of the proposed approaches a challenge.
The previous literature can be summarized as follows. Some groups estimated the maintenance cost regarding infrastructure to establish strategies and plans for maintenance management, which can further support decision-making by maintenance managers. However, they covered extensive ranges to determine the maintenance cost or renovation time. Thus, there are insufficient data for estimating the cost or time of specific maintenance. In addition, a limited number of factors were considered. Other groups focused on estimating the maintenance cost and service life of apartment buildings. They used MCS as a primary methodology to deal with the uncertainty of building components. However, their works depended on the probabilistic approach, which has a limited ability to provide the specific maintenance cost or service life to building managers. Furthermore, it is challenging for managers to determine a specific maintenance cost or time for repair because the estimated results represent approximate tendencies according to a probabilistic distribution.
2.2. Case-Based Reasoning
In this research, case-based reasoning (CBR) was utilized to estimate the service life of a building component during the preconstruction phase. CBR is an artificial intelligence method that solves a given problem based on data and knowledge retrieved from past similar cases. It stems from cognitive science and is based on how humans think [,,,,]. This methodology has been widely adopted in diverse fields such as cost estimation, market selection, safety diagnosis, and building maintenance [,,,] because it can find solutions even when the current problems are well-structured or related data are insufficient or limited [,,]. Nevertheless, applying CBR to maintenance cost estimation is a challenge because relevant data have not been collected systematically. Therefore, a database needs to be established first. In general, CBR is composed of four phases: case retrieval, reuse, revision, and retention [,,]. Depending on the similarity score, the most similar cases to a given case are extracted. The extracted cases are reused to solve the current problem. If the estimated results are limited or inadequate as a solution, they should be revised to match the problem. Then, the revised results are retained as a new case in the database [,]. This research focuses on case retrieval and reuse because they are recognized as the critical phases of CBR [,,,]. This approach has the following benefits. First, CBR can address various attributes for the estimation, including numerical and nominal data (e.g., areas, building type, number of households, year of completion, and repair items) [,]. The results estimated from similar cases are reliable and accurate because they are based on actual cases in the past. CBR enables contractors or site managers to estimate the service life from a long-term perspective. In CBR, cases are retrieved based on similarity, which is determined by the distance measurement function and weights of the attributes [,]. Thus, the optimal weights of the attributes need to be determined [,]. Because of its importance to the retrieval phase, many researchers have focused on finding the optimal weight for extracting the most similar cases [,,,,]. Various weighting methods have been considered, such as feature counting (FC), the gradient descent method (GDM), the analytic hierarchy process (AHP), and multiple regression analysis (MRA) [,,]. However, such methods fail to search for the optimal weights or perform an unnecessary search process, which reduces the reliability of the retrieved cases [,,]. In this research, a genetic algorithm (GA) is utilized because it is recognized as the most effective weighting method [,,]. The attribute weighting is described in Section 3.3.
2.3. Genetic Algorithm
In this research, GA is adopted to calculate the weights. This is a heuristic optimization algorithm based on the evolutionary concepts of natural selection and genetics [,,,,]. Principles of biological evolution such as selection, crossover, mutation, and recombination are used to determine the optimal weights for explaining the relationships between the attributes and output [,]. GA has been widely applied to optimization problems in business, engineering, and the natural and social sciences because it has a powerful search ability and supports simple computations without derivatives of the objective function, even if a given problem is nonlinear or difficult to solve [,,,]. In GA, the fitness of a set of genes represents how well a solution satisfies a given problem [,]. GA performs a parallel search, while traditional algorithms start a search at one point. During evolution, genes of each generation exchange information accumulated by previous generations and start searching for a new area [,]. The search direction is determined probabilistically for each generation. Thus, GA can search for a global optimal solution and reduce the probability of falling into a local optimal solution [,]. A GA model sets the candidate solution and fitness function (i.e., objective function) to evaluate the solution. The candidate solution is a set of parameters that represent a proposed solution to the problem. In order to search for the optimal value, the parent population is first selected at random to include a chromosome with a dominant trait. The population size refers to how many chromosomes are in one generation. If there are too few chromosomes, GA has few possibilities for crossover, and only a small part of the search space is explored []. If there are too many chromosomes, GA slows down [,,]. The fitness function evaluates strings (chromosomes) in order to select dominant ones that continue into the next generation [,]. As illustrated in Figure 1, GA only selects genes suitable to a given problem. The genes are selected and crossed with each other to transfer better genes to the next generation [,]. Then, the chromosomes including genes are mutated because the selection of the best genes can cause a problem related to the local optimal point. Thus, stochastic mutation needs to be performed on a newly generated chromosome. Finally, the global optimal genes for a given problem remain. This process is repeated until the predetermined requirements are met [,].
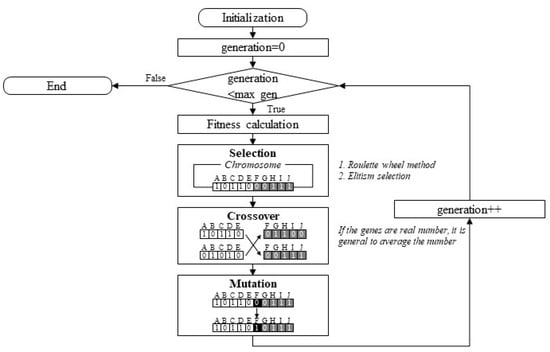
Figure 1.
Genetic algorithm process.
3. Model Development
As discussed in the previous sections, a model is developed for estimating the service life of MEP components based on previous data. The model comprises four different modules: (1) data collection, (2) attribute selection, (3) attribute weighting based on GA, and (4) case retrieval. In the data collection module, a case base is constructed from the maintenance-related data of past projects. The acquired cases need to be carefully reviewed because they have a major effect on the estimation accuracy [,,]. For research progress, GA and WED are adopted as component methodologies.
More specifically, the process of the estimation model is initiated by inputting the extracted attributes. Then, the optimal attributes are determined by changing iteratively attribute weights based on GA. The attribute weights representing each case need to be reliably computed because the weights are essential to measuring the degree of similarity between cases. Meanwhile, the case retrieval module computes the similarity scores for the test cases. In this process, similarity function based on the WED with attribute weights is used. According to the similarity scores, similar cases are extracted from database. The estimated and original service lives are compared to validate the developed model. In the following sections, the specific processes of the developed model illustrated in Figure 2 are explained.
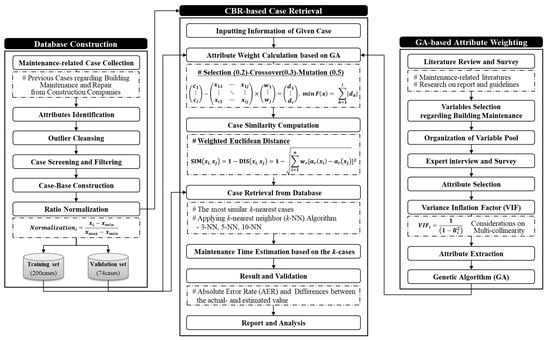
Figure 2.
Case-based reasoning (CBR)-based service life estimation model.
3.1. Data Collection
In order to examine the reliability and usefulness of the proposed model, a database is established based on previous data provided by Korea Land and Housing Corporation (LH). This is a recognized public corporation that has conducted and managed a number of construction projects over a long period of time. The acquired data from LH can be reliably used to estimate the service life for building maintenance because they include various maintenance-related activities and information that occurred in the past. A model based on such data will enable more accurate and reliable estimation. This research focused on the service life of MEP components because the related repairs account for a large portion of the total building maintenance []. MEP components consist of various subsystems including heating, air conditioning, ventilation, lighting, power, pipelines, elevators, electricity, and water pumps [,]. These components are closely associated with the quality and comfort of residents’ lives in apartment buildings.
In order to construct the database for estimating the service life of the building, historical cases that include the maintenance or repairs of buildings are carefully reviewed. The cases provide diverse information, such as the management area, heating system, areas for management, completion year, age of building, maintenance cost, and number of repairs, in addition to general building information such as the building coverage ratio, floor area ratio, number of buildings, number of floors, number of households, and number of parking lots. Apartment buildings completed from 1978 to 2009 are used to construct the database.
In total, 712 cases related to the maintenance of apartment buildings were collected to establish the database. However, cases including erroneous data or omitted values may not only decrease the reliability of the database but also negatively affect the accuracy of the estimated results [,]. To ensure the reliability and consistency of the collected cases, outliers with inappropriate data were excluded and screened from the database [,]. In total, 276 of the collected cases were selected. These were preprocessed for computing the case similarity and retrieving similar cases. More specifically, the raw data in the cases need to be standardized and normalized because the attributes are expressed on various scales [,]. Ratio standardization is applied because it is a commonly used method to present raw data from different cases on an equivalent scale [,,]. The normalization is an important process because it can reduce distortions in the similarity measurement that stem from data with different scales []. The raw data are normalized as follows.
where xi is the value of attribute i and xmin and xmax are the minimum and maximum values, respectively, of each attribute. The normalized data are used to compute the case similarity, which is discussed in the next section.
3.2. Attribute Selection
The process of selecting and extracting attributes is described here. In order to estimate the service life for building maintenance with CBR, the attributes affecting the repair and maintenance of apartment buildings should be selected and weighted with GA. This is because the weights of the attributes are essential to calculating the case similarity. Figure 3 illustrates the process of selecting and extracting the attributes. First, relevant variables are investigated. In order to establish a variable pool, various papers and reports in the literature addressing maintenance cost estimation methodology [,,], service life pattern identification [,], strategic planning for maintenance [,,], and statistics and guidelines regarding building maintenance and repair [,] are extensively reviewed.
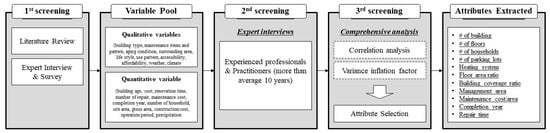
Figure 3.
Attribute selection and extraction process.
Based on the variables’ pool, maintenance-related factors are identified. The next step is to derive key attributes closely associated with maintenance. Twenty-three factors were extracted, then, 20 experts were interviewed to identify key attributes. These experts had experienced careers in the construction industry covering fields such as cost management (5 persons), construction management (4 persons), safety and health management (3 persons), environment management (3 persons), and maintenance management (5 persons). They are thought to be qualified to determine the key attributes. Based on the interviews, 11 attributes were selected for measuring the similarity and estimating the service life of MEP components. The selected attributes were divided into project-related general data and maintenance-related data. The maintenance-related data included the management area (MA), heating system (HS), completion year (CY), maintenance cost per unit area (MC), and service life (SL) because they are closely associated with the deterioration of a building. In addition, project-related data such as the number of buildings (NB), number of floors (NF), number of households (NH), parking lots (PL), floor–area ratio (FA), and building–coverage ratio (BC) were included to search for previous cases similar to a given case []. Furthermore, the multicollinearity among the extracted attributes was examined because the attributes comprising a case have a high possibility of covariance, which can reduce the accuracy and reliability of the estimated results [,,]. The variance inflation factor (VIF) was used to identify correlations among attributes. The degree of multicollinearity is calculated as follows.
where is the coefficient value obtained by regression of all independent attributes in the dataset. The VIF scores of NB, NF, NH, PL, FA, BC, HS, MA, CY, and MC were 2.004, 3.533, 1.507, 3.259, 2.274, 1.188, 1.180, 1.495, 1.736, and 1.219, respectively. Attributes with a VIF score of 5 were not observed, which indicates insignificant multicollinearity between the attributes [,,]. Thus, the final 10 input attributes were extracted: NB, NF, NH, PL, FA, BC, HS, MA, CY, and MC. In addition, SL was set as the output attribute. The remaining attributes that are excluded from the inputs and output were sorted as reference information.
3.3. Attribute Weighting Based on GA
As discussed previously, this research adopts a genetic algorithm (GA) to weight the extracted attributes. This is an optimization algorithm that simulates an evolutionary process [,,]. As shown in Figure 1, GA consists of four steps: initialization, fitness calculation, selection and crossover, and mutation.
- Initialization. In this research, values between 0 and 1 are used as a chromosome (i.e., a set of attribute weights). Randomly selected weights are utilized to initialize the optimization process. A chromosome is made up of nine genes representing the attribute weights.
- Fitness calculation. For an efficient search, it is necessary to select an appropriate fitness function for determining superior chromosomes. In this research, the error ratio of the training set was used as a fitness function to determine superior chromosomes.
- Selection and Crossover. Parent chromosomes with the highest fitness are generally selected to generate offspring. However, this method is not suitable for global optimization because it greatly degrades the diversity. In this study, the roulette wheel and elitism selection methods are employed to find superior chromosomes. Crossover is applied to the selected two chromosomes.
- Mutation. To avoid the problem of falling into a local optimal point, random mutation of a newly generated chromosome is necessary. Thus, the weights of some attributes in one chromosome are randomly changed.
In summary, GA is used to weight the attributes. One chromosome is produced based on the following ratio; roulette wheel (0.1), elitism (0.1), crossover (0.3), and mutation (0.5). The process is repeated to derive the optimal weights. Of the 276 total cases, 201 cases are used as a training set to find the optimal weight. The remaining cases are used to validate the developed model in the experiment. Table 3 indicates that CY (0.3530) and MC (0.3529) are critical attributes. This may be because these attributes are closely related to the deterioration of building maintenance.
Table 3.
Configuration of extracted attributes and weight based on genetic algorithm (GA).
3.4. Case Retrieval
The cases in the database can be represented as attributes and solutions []. The case similarity can be computed based on the attribute weights and similarity function. As described previously, GA is used as a method for assigning weights for the selected attributes. Then, the case similarity is computed based on data normalized with the NORMSDIST function of Microsoft Excel.
This is essential to the case retrieval phase of CBR [,,,,]. This is because previous cases are extracted depending on the similarity score, and an appropriate similarity measurement can reveal hidden relationships between attributes comprising cases [,]. Various similarity measurements are available, such as the WED, Minkowski distance, Mahalanobis distance, and arithmetic summation [,,,]. This research adopts WED to calculate the similarity because it is commonly used [,,,]. In Euclidean space, the similarity is computed based on the relative locations of attributes, which represent each case in the database [,]. The similarity distance between cases is determined by the square root of the sum of the squares of the differences between attributes [,]:
where SIM(xi, xj) is the similarity value for the independent cases xi and xj and DIS(xi, xj) is the relative distance between these cases. In addition, ar(x) is the value of the rth attribute of case xi and wr is the weight of the case determined from GA [,,,]. This equation is used to determine similarities between selected cases. The most similar cases are retrieved according to the similarity scores. The k-nearest neighbor (NN) algorithm is used to estimate the service life based on retrieved cases, where the estimated values are the average of k similar cases [,,]. In the estimation, the use of redundant nearest neighbors may cause the extraction of dissimilar cases, which can produce inaccurate results [,]. On the other hand, a limited number of nearest neighbors will also reduce the reliability and accuracy of the estimated results. Determining the optimal nearest neighbors is a concern in CBR. In this research, the service life is estimated based on outputs determined from 3, 5, and 10-NN.
4. Experiment
4.1. Experimental Process
This research focused on estimating the service life for maintenance based on previous cases. To verify the applicability of the developed model, an experiment was performed as schematized in Figure 4. First, 20 test cases were randomly selected. Second, GA was employed to weight attributes based on 201 cases in the training dataset. The weights were used to compute the similarity distance between the test cases and collected cases. The remaining 75 cases in the validation dataset were used to retrieve cases similar to the test case. Based on the similarity scores, k-similar cases were extracted from the database. In this research, ten similar cases were retrieved for each test case. The retrieved cases were used as the essential data to estimate the service life of the MEP components. Finally, the estimated values were validated by a comparison to the actual service life in terms of the absolute error ratio (AER) and difference.
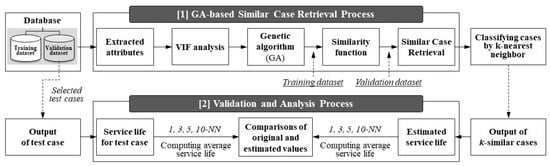
Figure 4.
Experiment Process.
4.2. Results and Discussion
As noted previously, 201 training cases were used to determine the attribute weights in the experiment. As indicated in Table 3, the weights were calculated in accordance with GA process in Java. The error rates were calculated for the training set based on leave-one-out validation (LOOCV), which is a type of k-fold cross-validation []. The error rates of 1-, 3-, 5-, and 10-NN were 8.84, 7.17, 6.96, and 7.43%, respectively (see Table 4). This indicates that the derived outcomes are reliable and accurate with an error ratio of about 7%. However, such results were determined based on the optimized weights for the training set. This implies that inaccurate results may be produced if they are applied to different datasets. Thus, a further experiment was performed on the validation dataset to confirm the applicability of the developed model.
Table 4.
Case similarity and error rate for 201 training sets
An experiment was carried out on 75 cases in the validation dataset based on the 20 randomly selected test cases. First, similarity scores were calculated based on WED. Then, cases similar to each test case were extracted. The estimated and real service lives were compared with 1-, 3-, 5-, and 10-NN. Table 5 presents the profile and input attributes that were randomly selected for model validation.
Table 5.
Profiles and input attributes for the test cases.
Table 6 presents the similarity scores summarized by the 1-, 3-, 5-, and 10-NN approaches. The similarities ranged from 85.2 to 99.8%, which are high similarity scores. The overall similarity and standard deviation (SD) of 10-NN were 97.4% and 0.033, respectively, which indicates that most cases extracted by 10-NN are similar to the given cases. However, some cases such as T8 showed a lower similarity score. The similarities of 1-, 3-, 5-, and 10-NN for T8 were 88.7, 86.7, 85.9, and 85.2%, respectively. This seems to be because the cases similar to the T8 are lack in the database. The similarity scores were used to extract cases and estimate the service life for building maintenance [,,].
Table 6.
Case similarity for 20 test cases.
Table 7 presents the experimental results for the actual and estimated service lives of the MEP components. The service lives estimated with 1-, 3-, 5-, and 10-NN were compared with the actual service life according to the AER and difference. The mean absolute error rates (MAERs) with 1-, 3-, 5-, and 10-NN were 8.19%, 6.92%, 6.63%, and 7.48%, respectively. The maximum and minimum AERs were 27.27% and 0%, respectively, for 1-NN; 24.24% and 0%, respectively, for 3-NN; 25.45% and 1.05%, respectively, for 5-NN; and 26.25% and 0.80%, respectively, for 10-NN. Overall, the estimated values showed reliable accuracy with an error rate of about 7%. However, the error rates with 1-, 3-, 5-, and 10-NN were high for several test cases: 12.50%, 20.83%, 15.00%, and 26.25%, respectively, for T2; 23.81%, 19.05%, 18.10%, and 17.14%, respectively, for T8; and 27.27%, 24.24%, 25.45%, and 17.27%, respectively, for T14. This may be because cases with low similarity were retrieved. However, this may not necessarily be due to low similarity scores []. The estimation results with CBR are case-sensitive, which implies that the estimated results can change depending on the output of the retrieved cases [,]. Therefore, even though the similarities between the test and retrieved cases were very high, the estimated output can differ from the actual value of the test case depending on the project conditions or unique characteristics. In this regard, the lower performance can be explained because some extreme cases with disparate service lives were included in the retrieved cases. According to Christensen and Dysert [], the general range for low variation is from −20% to −50%, and the range for upper variation is from +30% to +100%. Therefore, the slightly high AER in some cases may be even acceptable for estimation during the preconstruction phase for which relevant data are insufficient [,]. Therefore, this present that the developed model is applicable to estimating the service life of building components. The model can be used by building managers in the preconstruction phase to identify when major maintenance-related problems will occur.
Table 7.
Experiment results.
Table 8 presents reference information for T10 that can be utilized as important data for building maintenance management, such as component types for maintenance, number of maintenances, and overall maintenance cost. Managers can use this information to assume how much building maintenance will occur after completion. More specifically, the reference information shows that components such as M2 (27.87%), P2 (13.11%), and P3 (24.59%) should be carefully considered. In other words, managers can identify factors regarding which MEP components will primarily cause maintenance-related problems. Furthermore, Figure 5 illustrates the probability distributions of the service life and maintenance cost based on MCS, which is a computational approach that depends on random samplings to gain statistical results [,]. These distributions were determined based on the beta-PERT distribution, which is a recognized method for estimating values from insufficient information because it can handle diverse types of skewness [,,]. In this research, 10,000 iterations were carried out to determine the distributions of the components.
Table 8.
Reference information of retrieved cases for T10.
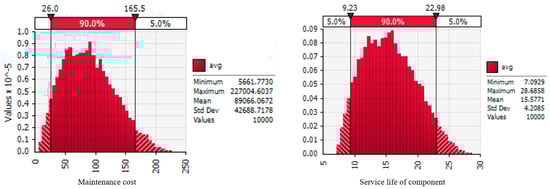
Figure 5.
Service life distribution for T10 (example).
The distributions indicate that the minimum, average, and maximum maintenance costs were 5661, 89,066, and 227,004 USD, respectively, and the minimum, average, and maximum service lives were 7.09, 15.57, and 28.68 years, respectively. By synthesizing the information with the estimated results, building managers can identify not only the specific service life of building components but also the number of repairs and approximate maintenance cost in a comprehensive manner. Therefore, the developed estimation model can support more systematic building maintenance than current approaches because the outcomes are determined based on reliable data extracted from previous cases. It also provides various useful information for a preventive approach towards building maintenance.
5. Conclusions
The number of maintenance-related problems continues to increase as aging buildings deteriorate, which may cause safety-related problems and increased maintenance costs. Thus, building maintenance is globally recognized as an issue of concern, especially in densely populated areas. In particular, MEP components account for a large portion of building maintenance because they are essential to ensuring a sustainable environment and lifestyle for residents. Thus, maintenance with regard to MEP components should be carefully carried out. As a first step, the time or period for maintenance needs to be estimated. Although various studies have focused on estimating the service life for maintenance, doing so during the planning phase is very challenging because maintenance-related data and a systematic estimation methodology have not been established. To address these limitations, a model was developed to estimate the service life for building components according to previous similar cases which utilized GA and CBR. To validate the developed model, experiments were performed with 20 test cases, and the estimated results of 1-, 3-, 5-, and 10-NN were compared with the actual service life in term of AER. The experimental results indicated that the MAERs with 1-, 3-, 5-, and 10-NN were 8.19%, 6.92%, 6.63%, and 7.48%, respectively. These results demonstrate that the developed model can be used to estimate the service life of MEP components with a high reliability. The model can be used by maintenance managers to identify and evaluate when maintenance-related problems will occur. Also, it can be utilized to develop preventive measures against building deterioration and establish a maintenance strategy. The developed estimation model will help enhance existing maintenance management of buildings. This research contributes to the literature on building maintenance by proposing a method of estimating the service life of building components. In order to improve the usability of the model, the more specific service lives of individual components need to be addressed, and the number of repairs for specific components and the maintenance cost of each component should also be considered. However, the collected data did not include such specific details. This seems to be because a building consists of very diverse and complex components, which makes it difficult to record or collect specific data and information related to building maintenance from a long-term perspective. Because of these limitations, the total number of repairs and maintenance cost were presented here as reference information. Future research should address more specific content such as the maintenance cost for each trade or components that are essential to building maintenance. Furthermore, this research was primarily carried out based on CBR, which depends on the collected cases. Thus, more cases need to be collected to improve the reliability and accuracy of the estimated results. Other attribute weighting methods should also be considered to ensure the applicability of the model. This study should improve current building maintenance and support managers in decision-making related to building repair by estimation of the service life of components.
Author Contributions
Conceptualization, N.K., M.P., Y.J., I.Y., and Y.A.; Investigation, K.S. and Y.J.; Methodology, N.K., K.S., I.Y., and Y.A.; Supervision, M.P., Y.J., and Y.A.; Validation, N.K., K.S., and I.Y.; Visualization, I.Y.; Writing—Original Draft, N.K., K.S., I.Y., and Y.A.; Writing—Review & Editing, N.K., M.P., and Y.A.
Funding
This research was funded by the Ministry of Science, ICT & Future Planning (No. 2015R1A5A1037548).
Acknowledgments
This research was supported by the Basic Science Research Program through the National Research Foundation of Korea (NRF). The authors wish to express their gratitude for the support.
Conflicts of Interest
The authors declare no conflicts of interest.
References
- Park, S.; Ahn, Y.; Lee, S. Analyzing the Finishing Works Service Life Pattern of Public Housing in South Korea by Probabilistic Approach. Sustainability 2018, 10, 4469. [Google Scholar] [CrossRef]
- Chanter, B.; Swallow, P. Building Maintenance Management, 2nd ed.; Wiley Blackwell Publishing: Hoboken, NJ, USA, 2008. [Google Scholar]
- Kim, S.; Lee, S.; Ahn, Y. Evaluating Housing Maintenance Costs with Loss-Distribution Approach in South Korean Apartment Housing. J. Manag. Eng. 2019, 35. [Google Scholar] [CrossRef]
- Kim, J.; Han, S.; Hyun, C. Minimizing fluctuation of the maintenance, repair, and rehabilitation cost profile of a building. J. Perform. Constr. Facil. 2016, 30. [Google Scholar] [CrossRef]
- Yang, I.T.; Hsieh, Y.M.; Kung, L.O. Parallel computing platform for multi-objective simulation optimization of bridge maintenance planning. J. Constr. Eng. Manag. 2012, 138. [Google Scholar] [CrossRef]
- Ali, A.S.; Kamaruzzaman, S.N.; Sulaiman, R.; Peng, Y.C. Factors affecting housing maintenance cost in Malaysia. J. Facil. Manag. 2010, 8, 285–298. [Google Scholar] [CrossRef]
- Kim, S.; Frangopol, D.M.; Soliman, M. Generalized probabilistic framework for optimum inspection and maintenance planning. J. Struct. Eng. 2013, 139, 435–447. [Google Scholar] [CrossRef]
- Eom, C.S.; Paek, J.H. Risk index model for minimizing environmental disputes in construction. J. Constr. Eng. Manag. 2009, 135, 34–41. [Google Scholar] [CrossRef]
- Ministry of Land, Infrastructure, and Transport (MOLIT). Statistics Annual Rep; MOLIT: Sejong, Korea, 2019. [Google Scholar]
- Park, M.; Kwon, N.; Lee, J.; Lee, S.; Ahn, Y. Probabilistic Maintenance Cost Analysis for Aged Multi-Family Housing. Sustainability 2019, 11, 1843. [Google Scholar] [CrossRef]
- Shohet, I.M.; Puterman, M.; Gilboa, E. Deterioration patterns of building cladding components for maintenance management. Constr. Manag. Econ. 2002, 20, 305–314. [Google Scholar] [CrossRef]
- Lee, S.; Ahn, Y. Analyzing the Long-Term Service Life of MEP Using the Probabilistic Approach in Residential Buildings. Sustainability 2018, 10, 3803. [Google Scholar] [CrossRef]
- Ministry of Land, Infrastructure, and Transport (MOLIT). Korean Apartment Housing Management Act; MOLIT: Sejong, South Korea, 2016. [Google Scholar]
- Khanzode, A.; Fischer, M.; Reed, D. Benefits and lessons learned of implementing building virtual design and construction (VDC) technologies for coordination of mechanical, electrical, and plumbing (MEP) system on a large healthcare project. J. Inf. Technol. Constr. 2008, 13, 324–342. [Google Scholar]
- Ho, D.C.; Gao, W. Collective action in apartment building management in Hong Kong. Habitat Int. 2013, 38, 10–17. [Google Scholar] [CrossRef]
- Mohamad, S.B.H.S.; Rhaman, M.A.A.; Akasah, Z.A. A review of the maintenance performance factors for heritage buildings. In Proceedings of the International Civil and Infrastructure Engineering Conference, Kota Kinabalu, Malaysia, 28 September–1 October 2014; Springer: Singapore, 2014; pp. 177–187. [Google Scholar]
- Sharma, J.; Najafi, M.; Qasim, S. Preliminary cost estimation models for construction, operation, and maintenance of water treatment plants. J. Infrastruct. Syst. 2013, 19, 451–464. [Google Scholar] [CrossRef]
- Stenbeck, T. Budgeting performance-based winter maintenance: Snow influence on highway maintenance cost. J. Infrastruct. Syst. 2009, 15, 251–260. [Google Scholar] [CrossRef]
- Choi, K.; Kim, Y.H.; Bae, J.; Lee, H.W. Determining Future Maintenance Costs of Low-Volume Highway Rehabilitation Projects for Incorporation into Life-Cycle Cost Analysis. J. Comput. Civ. Eng. 2016, 30, 04015055. [Google Scholar] [CrossRef]
- Arif, F.; Bayraktar, M.E.; Chowdhury, A.G. Decision support framework for infrastructure maintenance investment decision making. J. Manag. Eng. 2015, 32, 04015030. [Google Scholar] [CrossRef]
- Cho, K.; Yoon, Y. Decision Support Model for Determining Cost-Effective Renovation Time. J. Constr. Eng. Manag. 2015, 32, 04015051. [Google Scholar] [CrossRef]
- Elcheikh, M.; Burrow, M.P.N. Uncertainties in forecasting maintenance costs for asset management: Application to an aging canal system. J. Risk Uncertainty Eng. Syst. 2017, 3, 04016014. [Google Scholar] [CrossRef]
- Aamodt, A.; Plaza, E. Case-based reasoning: Foundational issues, methodological variations, and system approaches. AI Commun. 1994, 7, 39–59. [Google Scholar]
- Kolodner, J. Case-Based Reasoning; Morgan Kaufmann: San Mateo, CA, USA, 2014. [Google Scholar]
- Kwon, N.; Park, M.; Lee, H.S.; Ahn, J.; Shin, M. Construction Noise Management Using Active Noise Control Techniques. J. Constr. Eng. Manag. 2016, 142, 04016014. [Google Scholar] [CrossRef]
- Riesbeck, C.K.; Schank, R.S. Inside Case-Based Reasoning; Lawrence Erlbaum Associates: Hillsdale, NJ, USA, 1989. [Google Scholar]
- Watson, I.; Marir, F. Case-based reasoning: A review. Knowl. Eng. Rev. 1994, 9, 327–354. [Google Scholar] [CrossRef]
- Arditi, D.; Tokdemir, O.B. Comparison of case-based reasoning and artificial neural networks. J. Comput. Civ. Eng. 1999, 13, 162–169. [Google Scholar] [CrossRef]
- Goh, Y.M.; Chua, D. Case-based reasoning for construction hazard identification: Case representation and retrieval. J. Constr. Eng. Manag. 2009, 135, 1181–1189. [Google Scholar] [CrossRef]
- Morcous, G.; Rivard, H.; Hanna, A.M. Case-based reasoning system for modeling infrastructure deterioration. J. Comput. Civ. Eng. 2002, 16, 104–114. [Google Scholar] [CrossRef]
- Kwon, N.; Lee, J.; Park, M.; Yoon, I.; Ahn, Y. Performance Evaluation of Distance Measurement Methods for Construction Noise Prediction Using Case-Based Reasoning. Sustainability 2019, 11, 871. [Google Scholar] [CrossRef]
- Kim, B.; Hong, T. Revised case-based reasoning model development based on multiple regression analysis for railroad bridge construction. J. Constr. Eng. Manag. 2011, 154–162. [Google Scholar] [CrossRef]
- Pereira, E.; Hermann, U.; Han, S.; AbouRizk, S. Case-based reasoning approach for assessing safety performance using safety-related measures. J. Constr. Eng. Manag. 2018, 144, 04018088. [Google Scholar] [CrossRef]
- Kwon, N.; Park, M.; Lee, H.S.; Ahn, J.; Kim, S. Construction Noise Prediction Model Based on Case-Based Reasoning in the Preconstruction Phase. J. Constr. Eng. Manag. 2017, 143, 04017008. [Google Scholar] [CrossRef]
- Ahn, J.; Ji, S.H.; Park, M.; Lee, H.S.; Kim, S.; Suh, S.W. The attribute impact concept: Applications in case-based reasoning and parametric cost estimation. Autom. Constr. 2014, 43, 195–203. [Google Scholar] [CrossRef]
- Watson, I. Applying Case-Based Reasoning: Techniques for Enterprise System; Morgan Kaufmann: San Francisco, CA, USA, 1997. [Google Scholar]
- Pal, S.K.; Shiu, S.C. Foundations of Soft Case-Based Reasoning; John Wiley & Sons: Hoboken, NJ, USA, 2004. [Google Scholar]
- Ji, S.H.; Park, M.; Lee, H.S.; Ahn, J.; Kim, N.; Son, B. Military facility cost estimation system using case-based reasoning in Korea. J. Comput. Civ. Eng. 2011, 218–231. [Google Scholar] [CrossRef]
- Doğan, S.Z.; Arditi, D.; Günaydin, H.M. Determining Attribute Weights in a CBR Model for Early Cost Prediction of Structural Systems. J. Constr. Eng. Manag. 2006, 132, 1092–1098. [Google Scholar] [CrossRef]
- Doğan, S.Z.; Arditi, D.; Günaydin, H.M. Using decision trees for determining attribute weights in a case-based model of early cost prediction. J. Constr. Eng. Manag. 2008, 134, 146–152. [Google Scholar] [CrossRef]
- Ji, S.H.; Park, M.; Lee, H.S. Case adaptation method of case-based reasoning for construction cost estimation in Korea. J. Constr. Eng. Manag. 2012, 138, 43–52. [Google Scholar] [CrossRef]
- Jin, R.; Cho, K.; Hyun, C.; Son, M. MRA-based revised CBR model for cost prediction in the early stage of construction projects. Expert Syst. Appl. 2012, 39, 5214–5222. [Google Scholar] [CrossRef]
- Kwon, N.; Cho, J.; Lee, H.S.; Yoon, I.; Park, M. Compensation Cost Estimation Model for Construction Noise Claims Using Case-Based Reasoning. J. Constr. Eng. Manag. 2019. accepted. [Google Scholar]
- Koo, C.; Hong, T.; Hyun, C.; Koo, K. A CBR-based hybrid model for predicting a construction duration and cost based on project characteristics in multi-family housing projects. Can. J. Civ. Eng. 2010, 37, 739–752. [Google Scholar] [CrossRef]
- Kim, J.K.; Kim, K. Preliminary Cost Estimation Model Using Case-Based Reasoning and Genetic Algorithms. J. Comput. Civ. Eng. 2010, 24, 499–505. [Google Scholar] [CrossRef]
- Albright, S.C.; Winston, W.L. Management Science Modeling; Thomson South-Western College Publishing: Mason, OH, USA, 2007. [Google Scholar]
- Gen, M.; Cheng, R. Genetic Algorithms and Engineering Design; Wiley: New York, NY, USA, 1997. [Google Scholar]
- RazaviAlavi, S.; AbouRizk, S. Site layout and construction plan optimization using an integrated genetic algorithm simulation framework. J. Comput. Civ. Eng. 2017, 31, 04017011. [Google Scholar] [CrossRef]
- Kim, S. Dual-Optimization Method for Improving Accuracy in GA-CBR Cost Estimating Model. Ph.D. Thesis, Seoul National University, Seoul, Korea, February 2017. [Google Scholar]
- Mitchell, M. An Introduction to Genetic Algorithm; MIT Press: Cambridge, MA, USA, 1999. [Google Scholar]
- Feng, C.W.; Liu, L.; Burns, S.A. Using genetic algorithms to solve construction time-cost trade-off problems. J. Comput. Civ. Eng. 1997, 11, 184–189. [Google Scholar] [CrossRef]
- Golberg, D.E. Genetic Algorithms in Search, Optimization, and Machine Learning; Addison Wesley: Boston, MA, USA, 1989. [Google Scholar]
- Ahn, J.; Park, M.; Lee, H.S.; Ahn, S.J.; Ji, S.H.; Song, K. Covariance effect analysis of similarity measurement methods for early construction cost estimation using case-based reasoning. Autom. Constr. 2017, 81, 254–266. [Google Scholar] [CrossRef]
- Han, J.; Kamber, M.; Pei, J. Data Mining: Concept and Techniques; Morgan Kaufmann: Waltham, MA, USA, 2011. [Google Scholar]
- Bod, R.; Hay, J.; Jannedy, S. Probabilistic Linguistics; MIT Press: Cambridge, MA, USA, 2003. [Google Scholar]
- Marquez, A.C. The Maintenance Management Framework, Methods and Models for Complex Systems Maintenance; Springer: London, UK, 2007. [Google Scholar]
- Du, J.; Bormann, J. Improved similarity measure in case-based reasoning with global sensitivity analysis: An example of construction quantity estimating. J. Comput. Civ. Eng. 2014, 28, 04014020. [Google Scholar] [CrossRef]
- Rogerson, P.A. Statistical Methods for Geography; SAGE Publications Inc.: London, UK, 2001. [Google Scholar]
- Vu, D.H.; Muttaqi, K.M.; Agalgaonkar, A.P. A variance inflation factor and backward elimination based robust regression model for forecasting monthly electricity demand using climatic variables. Appl. Energy 2015, 140, 385–394. [Google Scholar] [CrossRef]
- Fu, Y.; Shen, R. GA based CBR approach in Q&A system. Expert Syst. Appl. 2004, 26, 167–170. [Google Scholar]
- Burkhard, H.D. Similarity and distance in case-based reasoning. J. Fundam. Inf. 2001, 47, 201–215. [Google Scholar]
- Zhang, Y.; Ding, L.; Love, P.E.D. Planning of deep foundation construction technical specifications using improved case-based reasoning with weighted k-nearest neighbors. J. Comput. Civ. Eng. 2017, 31, 04017029. [Google Scholar] [CrossRef]
- Salleh, S.S.; Aziz, N.A.A.; Mohamad, D.; Omar, M. Combining Mahalanobis and Jaccard Distance to Overcome Similarity Measurement Constriction on Geometrical Shapes. IJCSI 2012, 9, 124–132. [Google Scholar]
- Christensen, P.; Dysert, L.R. Cost Estimate Classification System—As Applied in Engineering, Procurement, and Construction for the Process Industries; AACE International Recommended Practices 18R-97; AACE International Recommended Practices: Morgantown, WV, USA, 2011. [Google Scholar]
- Asmar, M.E.; Hanna, A.S.; Chang, C.K. Monte Carlo simulation approach to support alliance team selection. J. Constr. Eng. Manag. 2009, 135, 1087–1095. [Google Scholar] [CrossRef]
- Kwon, N.; Song, K.; Lee, H.S.; Kim, J.; Park, M. Construction Noise Risk Assessment Model Focusing on Construction Equipment. J. Constr. Eng. Manag. 2018, 144. [Google Scholar] [CrossRef]
- Pawan, P.; Lorterapong, P. A Fuzzy-Based Integrated Framework for Assessing Time Contingency in Construction Projects. J. Constr. Eng. Manag. 2015, 142. [Google Scholar] [CrossRef]
- Salling, K.B. Risk Analysis and Monte Carlo Simulation within Transport Appraisal; CTT-DTU, Technical University of Denmark: Lyngby, Denmark, 2007. [Google Scholar]
© 2019 by the authors. Licensee MDPI, Basel, Switzerland. This article is an open access article distributed under the terms and conditions of the Creative Commons Attribution (CC BY) license (http://creativecommons.org/licenses/by/4.0/).