Monitoring Long-Term Trends in the Anthropogenic Night Sky Brightness


Abstract
1. Introduction
2. Materials and Methods
2.1. Night Sky Brightness: Definition and Measurement
- , the spectral radiance (Wm−2sr−1nm−1) of the incident light field along the direction described by the vector of angular components , where is the zenith angle and the azimuth;
- , the elementary solid angle element (sr) around the direction , which in spherical coordinates is given by ;
- , the field-of-view function of the device (units sr−1) normalized such that , where Ω stands for the angular half-space subtended by the forward-facing hemisphere; and
- , the spectral sensitivity band of the detector (unitless, and normalized to 1 at its maximum), where is the wavelength, the NSB measured by the detector, in units of band-weighted radiance (Wm−2sr−1), is given by:
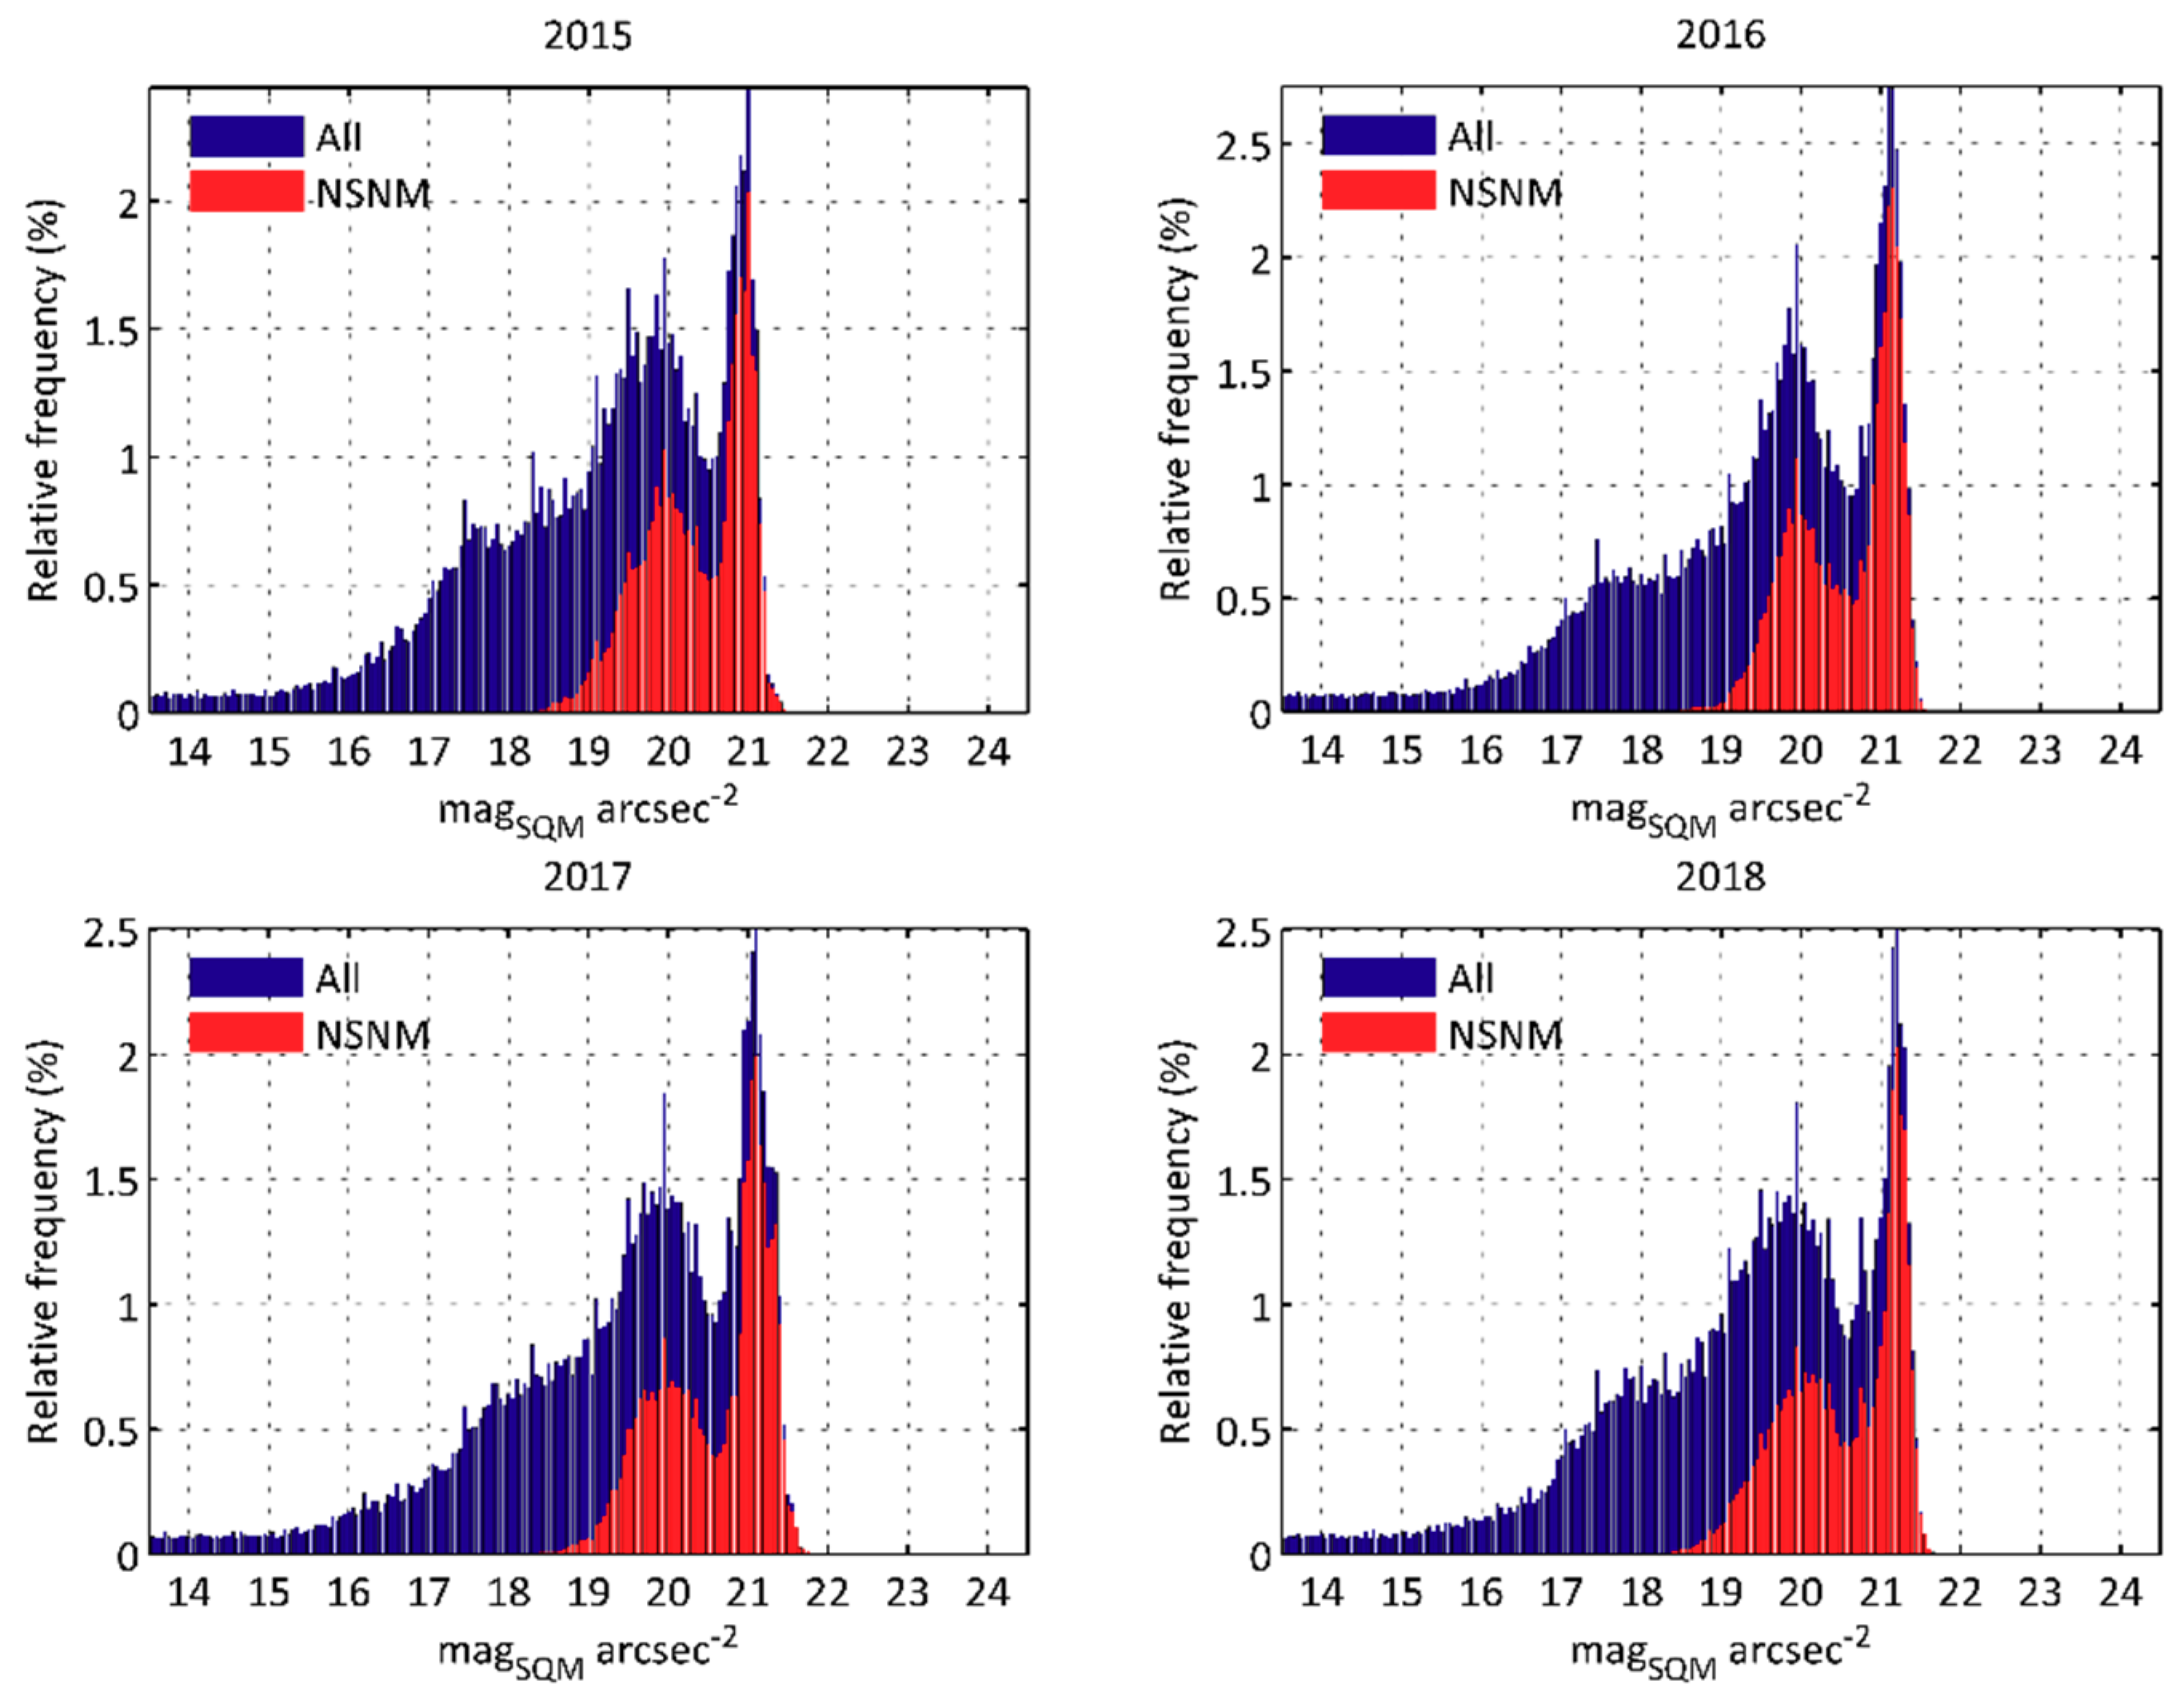
2.2. Night Sky Brightness Statistics
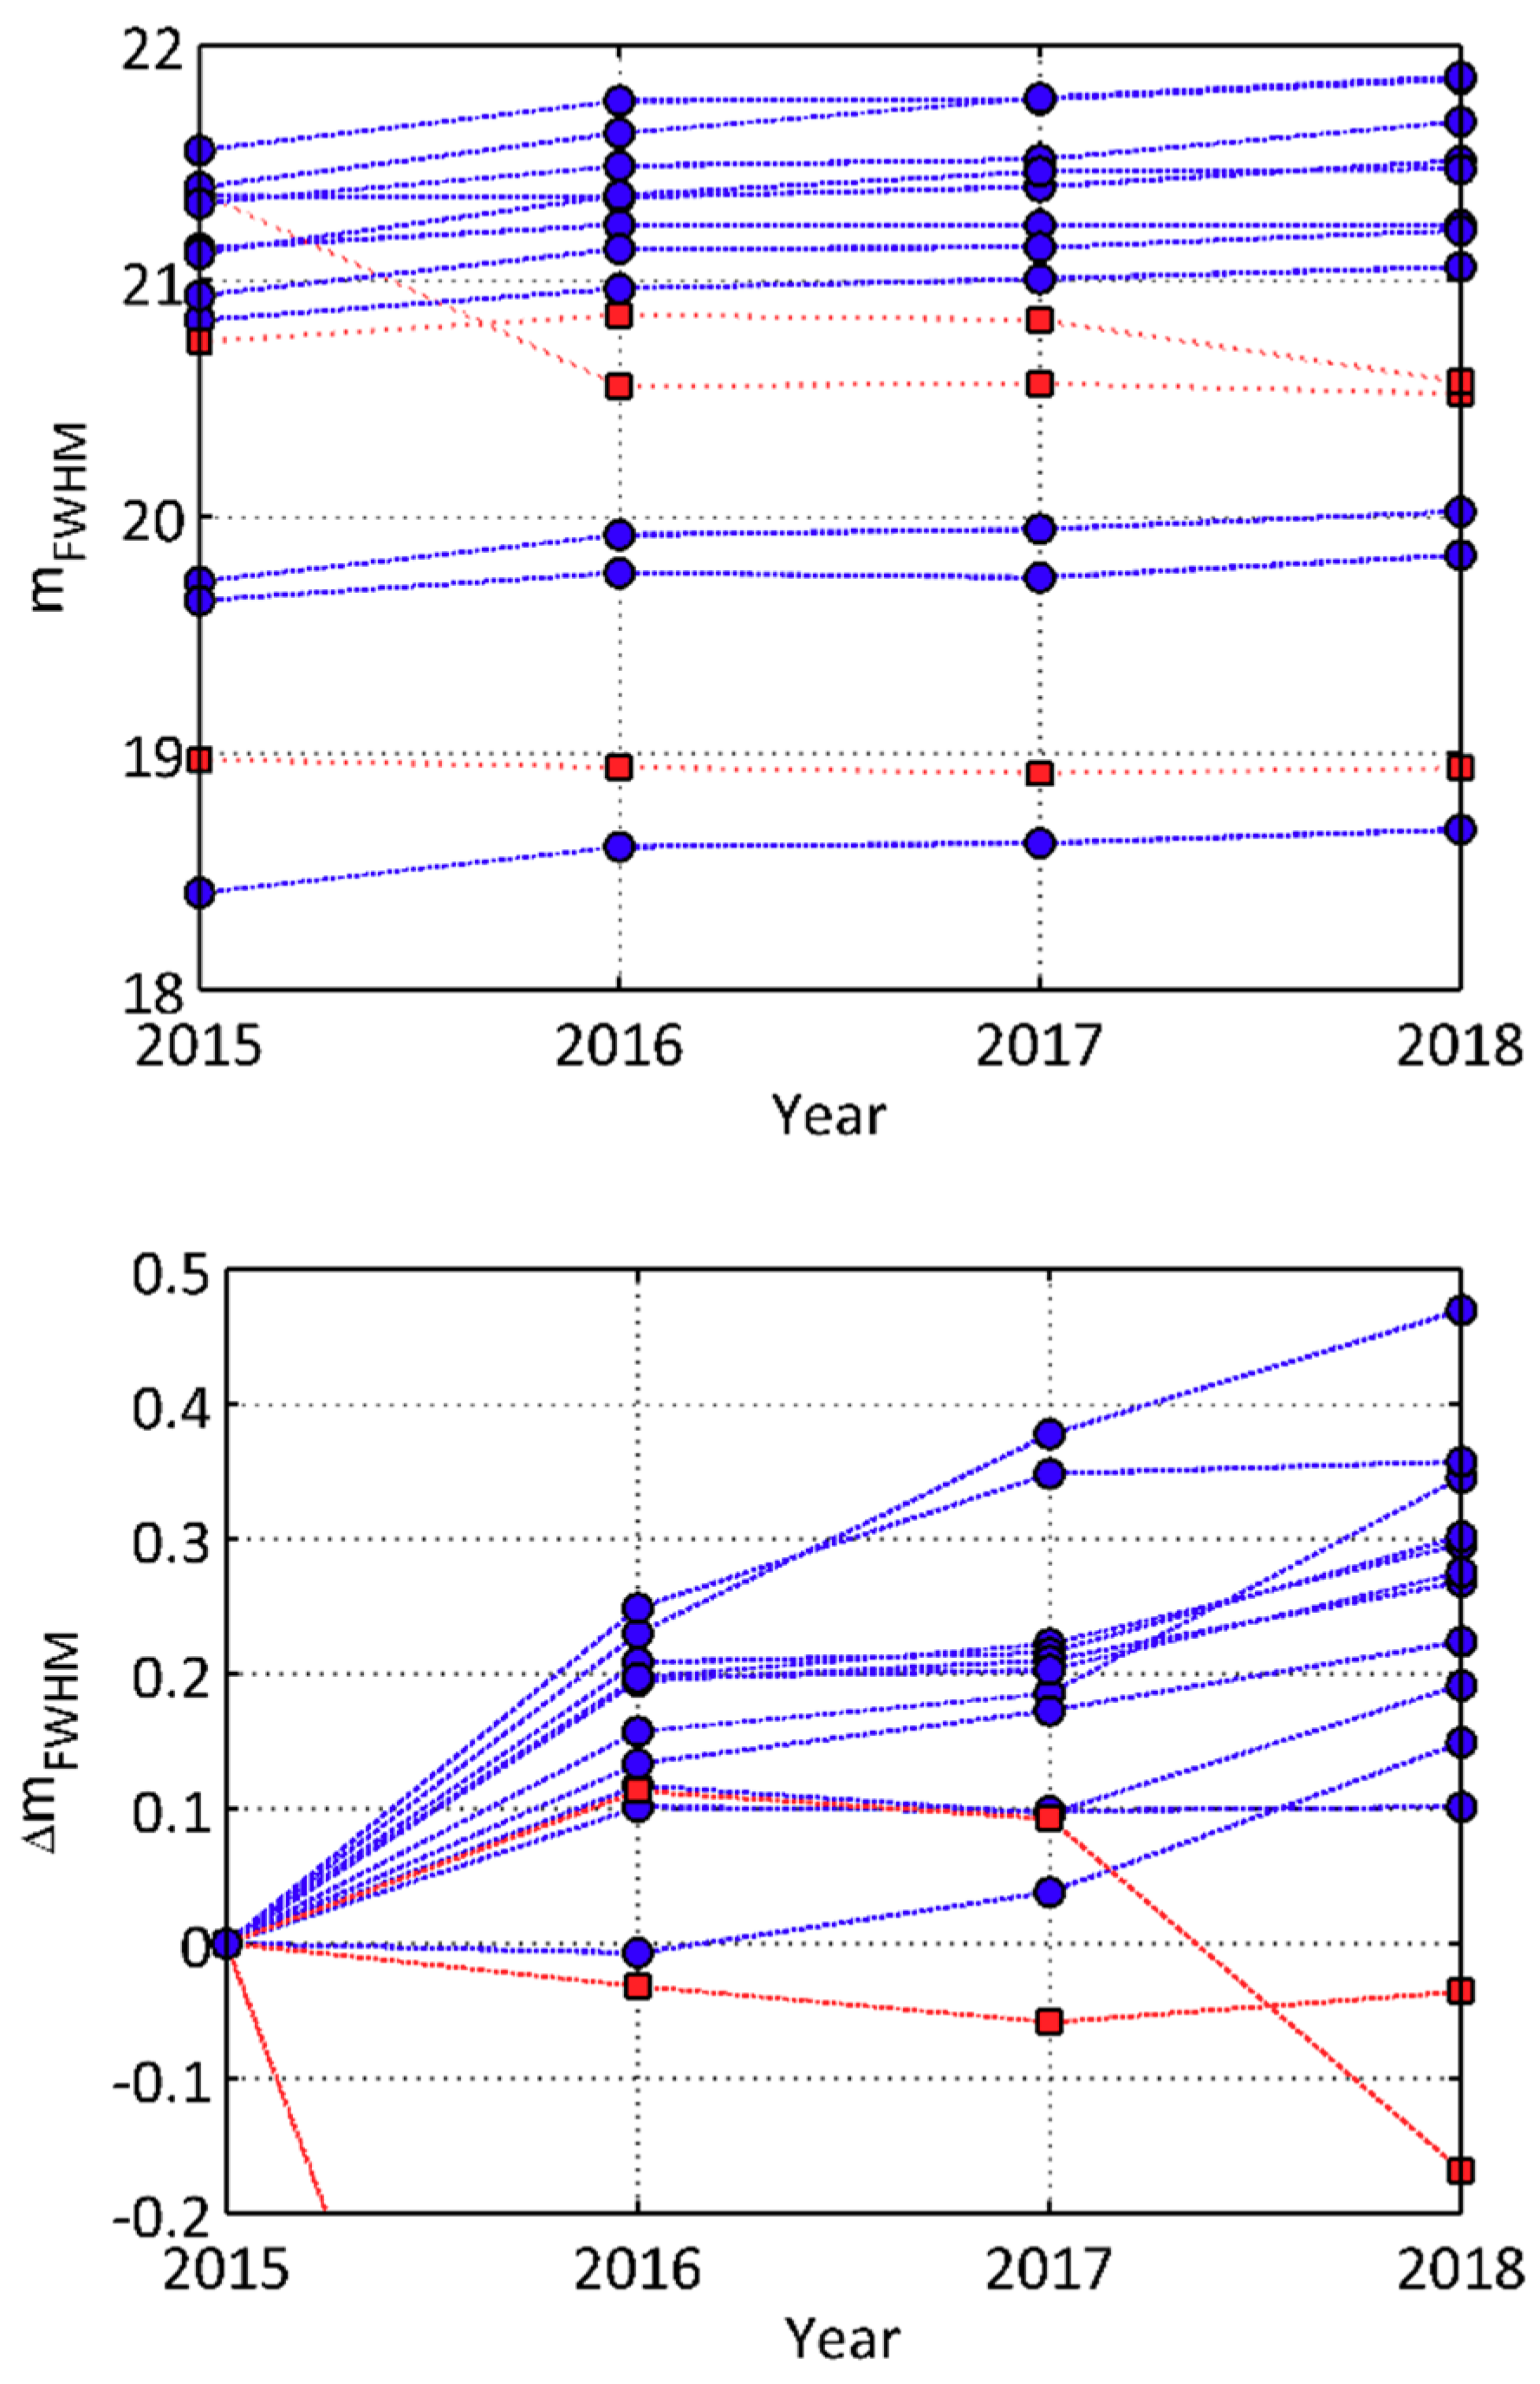
2.3. Long-Term NSB Evolution Indicators
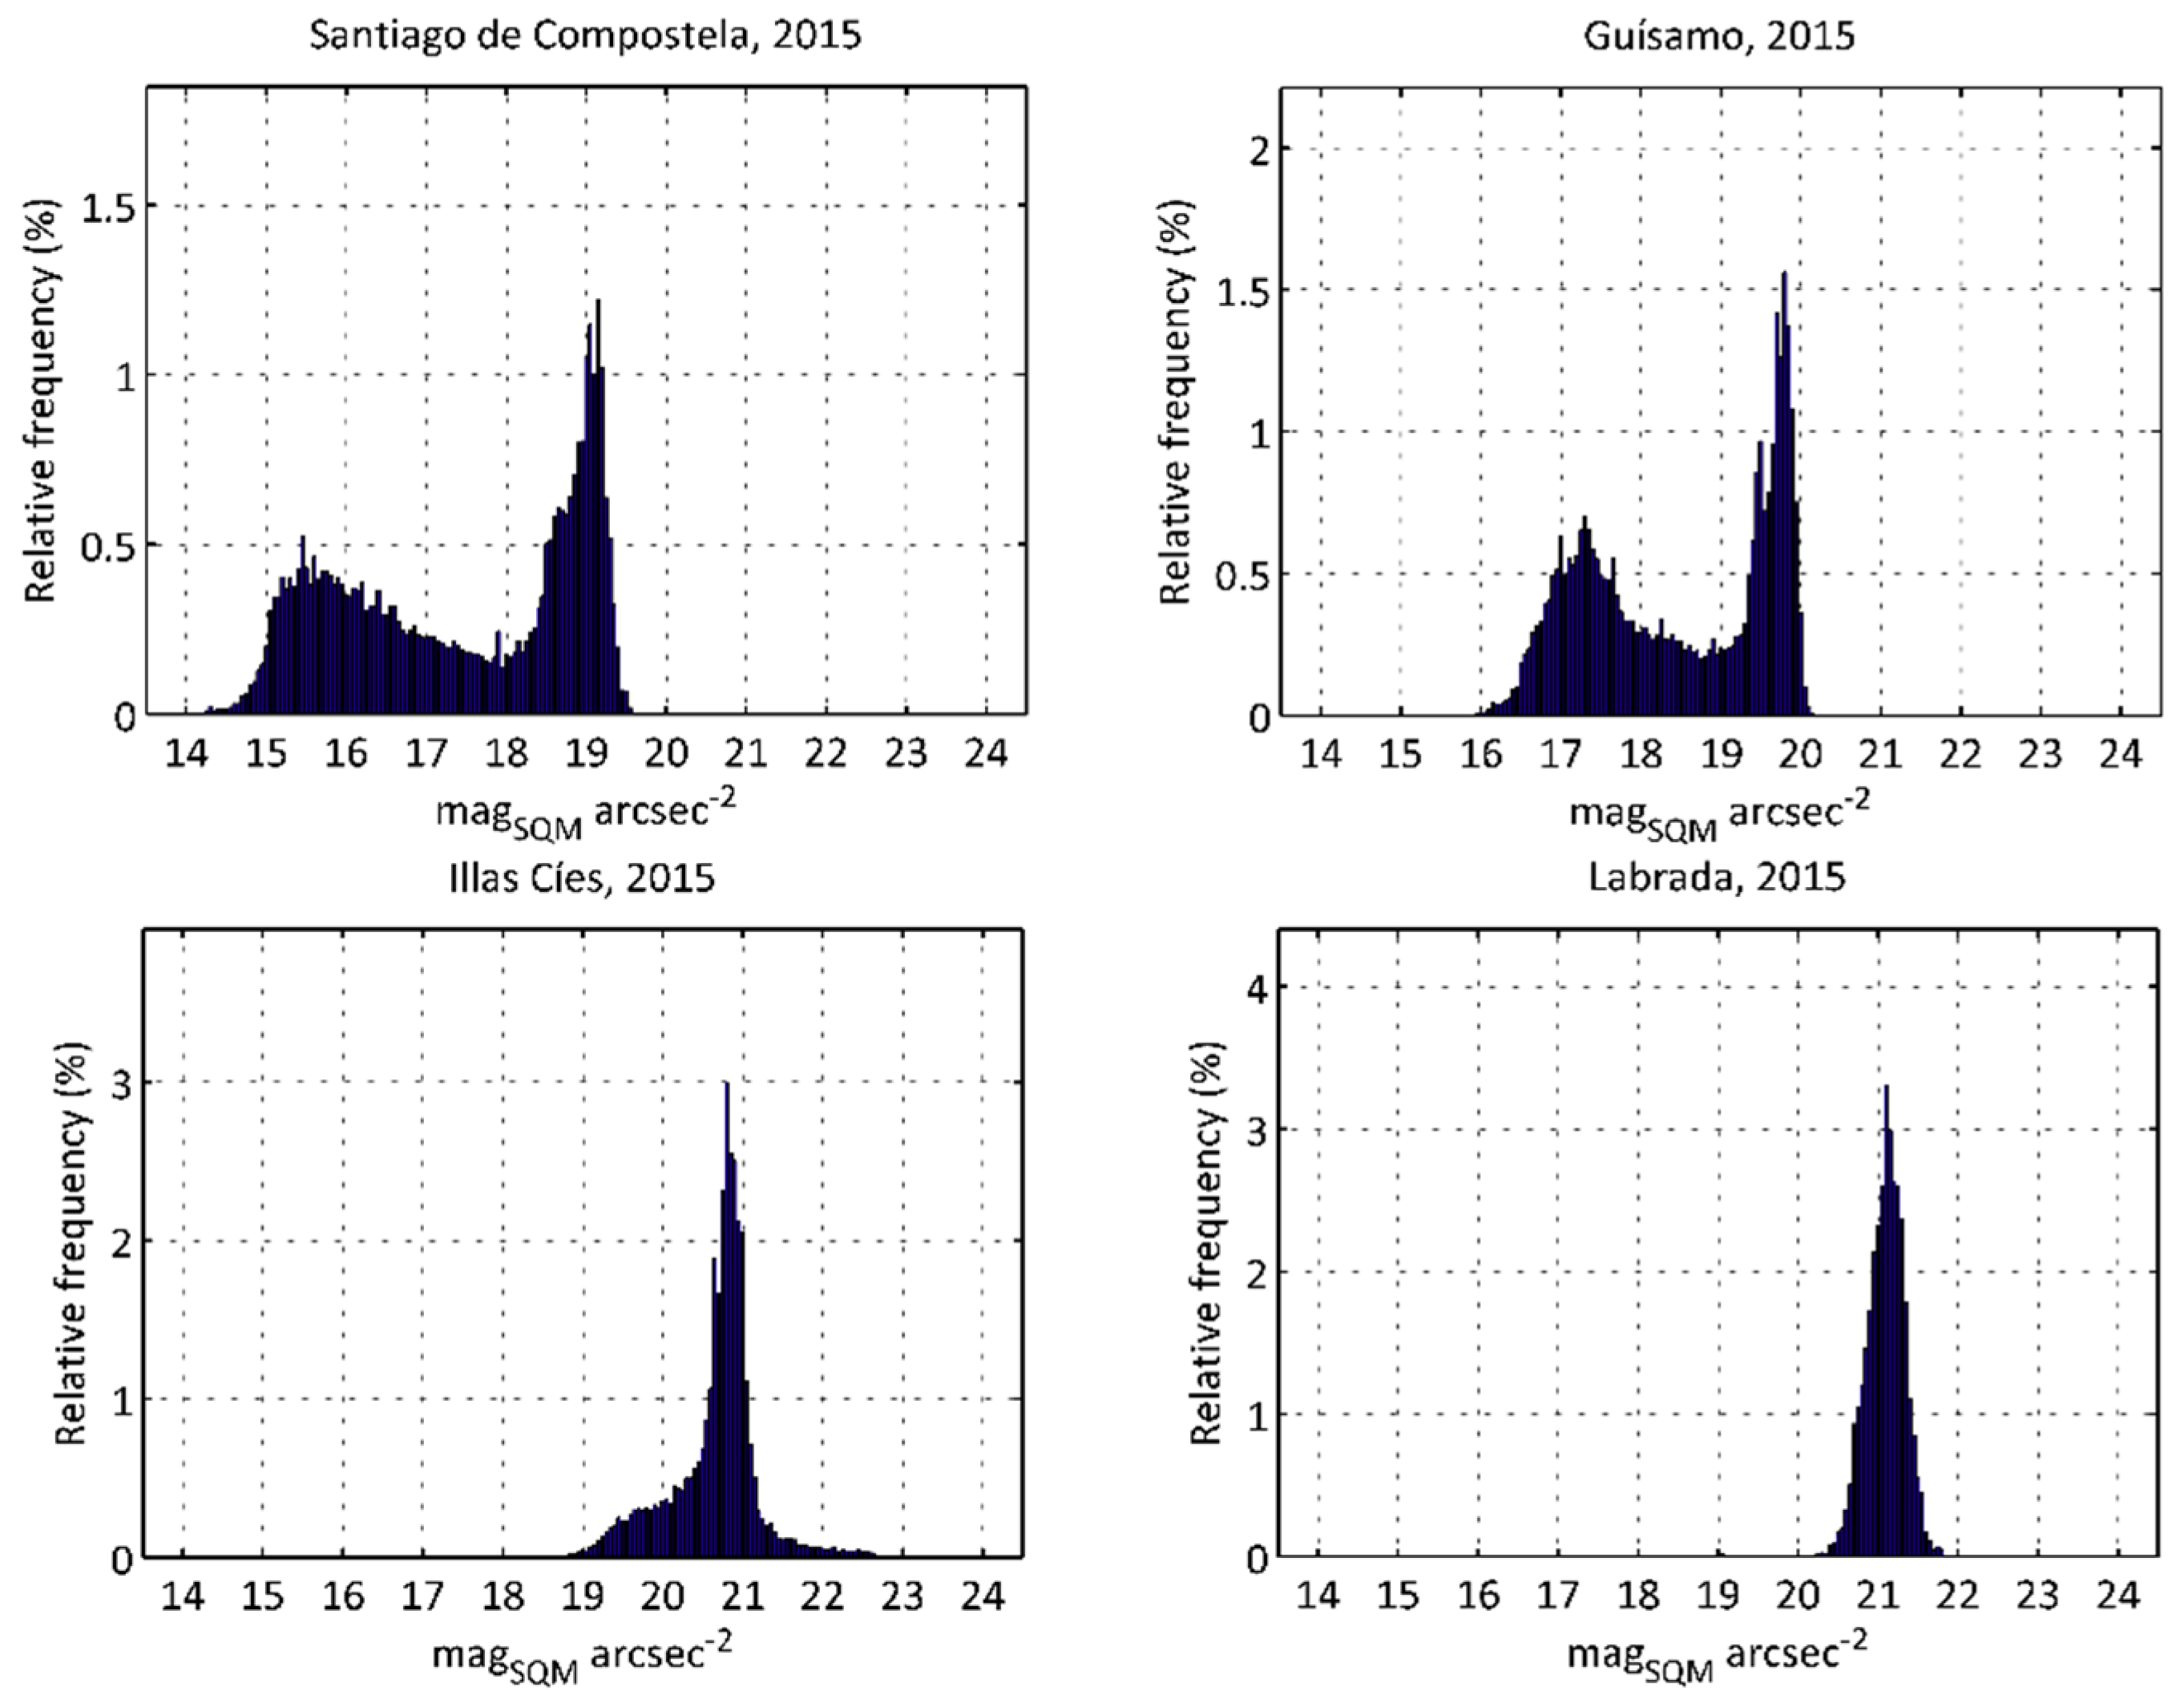
2.4. A Case Study: The NSB Evolution (2015–2018) in the Galician Night Sky Brightness Monitoring Network
3. Results
4. Discussion
5. Conclusions
Author Contributions
Funding
Acknowledgments
Conflicts of Interest
References
- Longcore, T.; Rich, C. Ecological light pollution. Front. Ecol. Environ. 2004, 2, 191–198. [Google Scholar] [CrossRef]
- Hölker, F.; Wolter, C.; Perkin, E.K.; Tockner, K. Light pollution as a biodiversity threat. Trends Ecol. Evol. 2010, 25, 681–682. [Google Scholar] [CrossRef]
- Gaston, K.J.; Duffy, J.P.; Gaston, S.; Bennie, J.; Davies, T.W. Human alteration of natural light cycles: Causes and ecological consequences. Oecologia 2014, 176, 917–931. [Google Scholar] [CrossRef] [PubMed]
- Organisation for Economic Co-operation and Development (OECD); International Energy Agency (IEA). Light’s Labour’s Lost—Policies for Energy-Efficient Lighting; OECD/IEA: Paris, France, 2006. [Google Scholar]
- Gallaway, T.; Olsen, R.N.; Mitchell, D.M. The economics of global light pollution. Ecol. Econ. 2010, 69, 658–665. [Google Scholar] [CrossRef]
- Marín, C.; Jafari, J. StarLight: A Common Heritage; StarLight Initiative La Palma Biosphere Reserve, Instituto De Astrofísica De Canarias, Government of The Canary Islands, Spanish Ministry of The Environment, UNESCO-MaB: Canary Islands, Spain, 2008. [Google Scholar]
- Pauley, S.M. Lighting for the human circadian clock: Recent research indicates that lighting has become a public health issue. Med. Hypotheses 2004, 63, 588–596. [Google Scholar] [CrossRef] [PubMed]
- IARC (International Agency for Research on Cancer). Painting, Firefighting, and Shiftwork: IARC Monographs on the Evaluation of Carcinogenic Risks to Humans; World Health Organization: Lyon, France, 2010; Volume 98, p. 764. [Google Scholar]
- AMA (American Medical Association). Light Pollution: Adverse health effects of nighttime lighting. In Proceedings of the American Medical Association House of Delegates, 161st Annual Meeting, Chicago, IL, USA, 16–20 June 2012; pp. 265–279. [Google Scholar]
- Haim, A.; Portnov, B. Light Pollution as a New Risk Factor for Human Breast and Prostate Cancers; Springer: Heidelberg, Germany, 2013. [Google Scholar]
- Fonken, L.K.; Nelson, R.J. The Effects of Light at Night on Circadian Clocks and Metabolism. Endocr. Rev. 2014, 35, 648–670. [Google Scholar] [CrossRef] [PubMed]
- Zubidat, A.E.; Haim, A. Artificial light-at-night—A novel lifestyle risk factor for metabolic disorder and cancer morbidity. J. Basic Clin. Physiol. Pharmacol. 2017, 28, 295–313. [Google Scholar] [CrossRef]
- Touitou, Y.; Reinberg, A.; Touitou, D. Association between light at night, melatonin secretion, sleep deprivation, and the internal clock: Health impacts and mechanisms of circadian disruption. Life Sci. 2017, 173, 94–106. [Google Scholar] [CrossRef]
- Russart, K.L.G.; Nelson, R.J. Light at night as an environmental endocrine disruptor. Physiol. Behav. 2018, 190, 82–89. [Google Scholar] [CrossRef]
- Elvidge, C.D.; Baugh, K.; Zhizhin, M.; Hsu, F.C.; Ghosh, T. VIIRS night-time lights. Int. J. Remote Sens. 2017, 38, 5860–5879. [Google Scholar] [CrossRef]
- Stefanov, W.L.; Evans, C.A.; Runco, S.K.; Wilkinson, M.J.; Higgins, M.D.; Willis, K. Astronaut Photography: Handheld Camera Imagery from Low Earth Orbit. In Handbook of Satellite Applications; Pelton, J.N., Madry, S., Camacho-Lara, S., Eds.; Springer International Publishing: New York, NY, USA, 2017. [Google Scholar]
- Sánchez de Miguel, A. Spatial, Temporal and Spectral Variation of the Light Pollution and its Sources: Methodology and Results. Ph.D. Thesis, Universidad Complutense de Madrid, Madrid, Spain, 2015. [Google Scholar] [CrossRef]
- Cinzano, P.; Falchi, F.; Elvidge, C. The first world atlas of the artificial night sky brightness. Mon. Not. R. Astron. Soc. 2001, 328, 689–707. [Google Scholar] [CrossRef]
- Falchi, F.; Cinzano, P.; Duriscoe, D.; Kyba, C.C.M.; Elvidge, C.D.; Baugh, K.; Portnov, B.A.; Rybnikova, N.A.; Furgoni, R. The new world atlas of artificial night sky brightness. Sci. Adv. 2016, 2, e1600377. [Google Scholar] [CrossRef] [PubMed]
- Bará, S. Anthropogenic disruption of the night sky darkness in urban and rural areas. R. Soc. Open Sci. 2016, 3, 160541. [Google Scholar] [CrossRef] [PubMed]
- Globe at Night. Available online: https://www.globeatnight.org/ (accessed on 25 April 2019).
- Hänel, A.; Posch, T.; Ribas, S.J.; Aubé, M.; Duriscoe, D.; Jechow, A.; Kollath, Z.; Lolkema, D.E.; Moore, C.; Schmidt, N.; et al. Measuring night sky brightness: Methods and challenges. J. Quant. Spectrosc. Radiat. Transf. 2018, 205, 278–290. [Google Scholar] [CrossRef]
- Zamorano, J.; García, C.; González, R.; Tapia, C.; Sánchez de Miguel, A.; Pascual, S.; Gallego, J.; González, E.; Picazo, P.; Izquierdo, J.; et al. STARS4ALL Night Sky Brightness Photometer. Int. J. Sustain. Light. 2016, 35, 49–54. [Google Scholar] [CrossRef]
- Bará, S.; Tapia, C.E.; Zamorano, J. Absolute Radiometric Calibration of TESS-W and SQM Night Sky Brightness Sensors. Sensors 2019, 19, 1336. [Google Scholar] [CrossRef]
- Kyba, C.C.M.; Wagner, J.M.; Kuechly, H.U.; Walker, C.E.; Elvidge, C.D.; Falchi, F.; Ruhtz, T.; Fischer, J.; Hölker, F. Citizen Science Provides Valuable Data for Monitoring GlobalNight Sky Luminance. Sci. Rep. 2013, 3, 1835. [Google Scholar] [CrossRef]
- CIE (Commission Internationale de l’Eclairage). CIE 1988 2° Spectral Luminous Efficiency Function for Photopic Vision; CIE: Vienna, Austria, 1990. [Google Scholar]
- Bessell, M.S. Standard Photometric Systems. Annu. Rev. Astron. Astrophys. 2005, 43, 293–336. [Google Scholar] [CrossRef]
- Aceituno, J.; Sánchez, S.F.; Aceituno, F.J.; Galadí-Enríquez, D.; Negro, J.J.; Soriguer, R.C.; Sánchez-Gómez, G. An all-sky transmission monitor: ASTMON. Publ. Astron. Soc. Pac. 2001, 123, 1076–1086. [Google Scholar] [CrossRef]
- Jechow, A.; Kolláth, Z.; Lerner, A.; Hölker, F.; Hänel, A.; Shashar, N.; Kyba, CCM. Measuring Light Pollution with Fisheye Lens Imagery from A Moving Boat, A Proof of Concept. Available online: https://arxiv.org/abs/1703.08484 (accessed on 22 March 2017).
- Jechow, A.; Ribas, S.J.; Canal-Domingo, R.; Hölker, F.; Kolláth, Z.; Kyba, CCM. Tracking the dynamics of skyglow with differential photometry using a digital camera with fisheye lens. J. Quant. Spectrosc. Radiat. Transf. 2018, 209, 212–223. [Google Scholar] [CrossRef]
- Jechow, A. Observing the Impact of WWF Earth Hour on Urban Light Pollution: A Case Study in Berlin 2018 Using Differential Photometry. Sustainability 2019, 11, 750. [Google Scholar] [CrossRef]
- Kolláth, Z.; Dömény, A. Night sky quality monitoring in existing and planned dark sky parks by digital cameras. Int. J. Sustain. Light. 2017, 19, 61–68. [Google Scholar] [CrossRef]
- Jechow, A.; Hölker, F.; Kyba, C.M.M. Using all-sky differential photometry to investigate how nocturnal clouds darken the night sky in rural areas. Sci. Rep. 2019, 9, 1391. [Google Scholar] [CrossRef]
- Bará, S. Variations on a classical theme: On the formal relationship between magnitudes per square arcsecond and luminance. Int. J. Sustain. Light. 2017, 19, 104–111. [Google Scholar] [CrossRef]
- Puschnig, J.; Posch, T.; Uttenthaler, S. Night sky photometry and spectroscopy performed at the Vienna University Observatory. J. Quant. Spectrosc. Radiat. Transf. 2014, 139, 64–75. [Google Scholar] [CrossRef]
- Puschnig, J.; Schwope, A.; Posch, T.; Schwarz, R. The night sky brightness at Potsdam-Babelsberg including overcast and moonlit conditions. J. Quant. Spectrosc. Radiat. Transf. 2014, 139, 76–81. [Google Scholar] [CrossRef]
- Kyba, C.C.; Tong, K.P.; Bennie, J.; Birriel, I.; Birriel, J.J.; Cool, A.; Danielsen, A.; Davies, T.W.; Peter, N.; Edwards, W.; et al. Worldwide variations in artificial skyglow. Sci. Rep. 2015, 5, 8409. [Google Scholar] [CrossRef]
- Posch, T.; Binder, F.; Puschnig, J. Systematic measurements of the night sky brightness at 26 locations in Eastern Austria. J. Quant. Spectrosc. Radiat. Transf. 2018, 211, 144–165. [Google Scholar] [CrossRef]
- Davies, T.W.; Bennie, J.; Inger, R.; Gaston, K.J. Artificial light alters natural regimes of night-time sky brightness. Sci. Rep. 2013, 3, 1722. [Google Scholar] [CrossRef]
- Kyba, C.C.M.; Kuester, T.; Sánchez de Miguel, A.; Baugh, K.; Jechow, A.; Hölker, F.; Bennie, J.; Elvidge, C.D.; Gaston, K.J.; Guanter, L. Artificially lit surface of Earth at night increasing in radiance and extent. Sci. Adv. 2017, 3, e1701528. [Google Scholar] [CrossRef]
- Dobler, G.; Ghandehari, M.; Koonin, S.E.; Nazari, R.; Patrinos, A.; Sharma, M.S.; Tafvizi, A.; Vo, H.T.; Wurtele, J.S. Dynamics of the urban nightscape. Inf. Syst. 2015, 54, 115–126. [Google Scholar] [CrossRef]
- Bará, S.; Rodríguez-Arós, A.; Pérez, M.; Tosar, B.; Lima, R.C.; Sánchez de Miguel, A.; Zamorano, J. Estimating the relative contribution of streetlights, vehicles, and residential lighting to the urban night sky brightness. Light. Res. Technol. 2018. [Google Scholar] [CrossRef]
- Meier, J. Temporal profiles of urban lighting: Proposal for a research design and first results from three sites in Berlin. Int. J. Sustain. Light. 2018, 20, 11–28. [Google Scholar] [CrossRef]
- Kyba, C.C.M.; Ruhtz, T.; Fischer, J.; Hölker, F. Red is the new black: How the colour of urban skyglow varies with cloud cover. Mon. Not. R. Astron. Soc. 2012, 425, 701–708. [Google Scholar] [CrossRef]
- Ribas, S.J.; Torra, J.; Figueras, F.; Paricio, S.; Canal-Domingo, R. How Clouds are Amplifying (or not) the Effects of ALAN. Int. J. Sustain. Light. 2016, 35, 32–39. [Google Scholar] [CrossRef]
- Ribas, S.J. Caracterització de la contaminació lumínica en zones protegides i urbanes. Ph.D. Thesis, Universitat de Barcelona, Catalonia, Spain, 2017. Available online: http://www.tdx.cat/handle/10803/396095 (accessed on 23 April 2019).
- Bará, S.; Lima, R.C. Photons without borders: Quantifying light pollution transfer between territories. Int. J. Sustain. Light. 2018, 20, 51–61. [Google Scholar] [CrossRef]
- MeteoGalicia, Main Page. Available online: https://www.meteogalicia.gal (accessed on 20 April 2019).
- Pun, C.S.J.; So, C.W. Night-sky brightness monitoring in Hong Kong. Environ. Monit. Assess. 2012, 184, 2537–2557. [Google Scholar] [CrossRef]
- Espey, B.; McCauley, J. Initial Irish light pollution measurements and a new sky quality meter-based data logger. Light. Res. Technol. 2014, 46, 67–77. [Google Scholar] [CrossRef]
- Lima, R.C.; da Cunha, J.P.; Peixinho, N. Light Pollution: Assessment of Sky Glow on two Dark Sky Regions of Portugal. J. Toxicol. Environ. Health Part A 2016, 79, 307–319. [Google Scholar] [CrossRef]
- Zamorano, J.; de Miguel, A.S.; Nievas, M.; Tapia, C.; Ocaña, F.; Izquierdo, J.; Gallego, J.; Pascual, S.; Colomer, F.; Bará, S.; et al. Light Pollution Spanish REECL SQM Network. XXIX IAU FM 21: Mitigating Threats of Light Pollution & Radio Frequency Interference, Honolulu (Hawaii) 3-14/8/2015. Available online: https://www.noao.edu/education/files/Zamorano_IAU2015_REECL-SQM.pdf (accessed on 11 March 2019).
- MeteoGalicia. Brillo do ceo nocturno. Available online: https://www.meteogalicia.gal/Caire/brillodoceo.action (accessed on 20 April 2019).
- Den Outer, P.; Lolkema, D.; Haaima, M.; van der Hoff, R.; Spoelstra, H.; Schmidt, W. Stability of the Nine Sky Quality Meters in the Dutch Night Sky Brightness Monitoring Network. Sensors 2015, 15, 9466–9480. [Google Scholar] [CrossRef]
- Duriscoe, D.M.; Anderson, S.J.; Luginbuhl, C.B.; and Baugh, K.E. A simplified model of all-sky artificial sky glow derived from VIIRS Day/Night band data. J. Quant. Spectrosc. Radiat. Transf. 2018, 21, 133–145. [Google Scholar] [CrossRef]
- Sánchez de Miguel, A.; Aubé, M.; Zamorano, J.; Kocifaj, M.; Roby, J.; Tapia, C. Sky Quality Meter measurements in a colour-changing world. Mon. Not. R. Astron. Soc. 2017, 467, 2966–2979. [Google Scholar] [CrossRef]


| Station | 2015 | 2016 | 2017 | 2018 | 2018–2015 1 | Per Year |
|---|---|---|---|---|---|---|
| Urban centers | ||||||
| Santiago de Compostela | 18.97 | 18.94 | 18.91 | 18.94 | −0.04 | −0.012 |
| Vigo (Harbor) | 18.41 | 18.60 | 18.62 | 18.68 | 0.27 | 0.090 |
| Periurban sites | ||||||
| Guísamo | 19.73 | 19.92 | 19.95 | 20.02 | 0.30 | 0.099 |
| Areeiro | 19.65 | 19.76 | 19.74 | 19.84 | 0.19 | 0.064 |
| Transition regions | ||||||
| Illas Cíes | 20.83 | 20.97 | 21.01 | 21.06 | 0.22 | 0.075 |
| Illa de Ons (*) | 20.74 | 20.85 | 20.83 | 20.57 | −0.17 | −0.056 |
| Illa de Sálvora | 21.11 | 21.36 | 21.46 | 21.47 | 0.36 | 0.119 |
| Paramos | 20.94 | 21.14 | 21.14 | 21.21 | 0.28 | 0.092 |
| Rural and mountain sites | ||||||
| Labrada | 21.14 | 21.24 | 21.24 | 21.24 | 0.10 | 0.034 |
| Fontaneira | 21.33 | 21.49 | 21.51 | 21.67 | 0.35 | 0.115 |
| O Cebreiro | 21.38 | 20.55 | 20.56 | 20.52 | −0.85 | −0.284 |
| Lardeira | 21.36 | 21.35 | 21.40 | 21.51 | 0.15 | 0.050 |
| Xares | 21.40 | 21.63 | 21.77 | 21.87 | 0.47 | 0.157 |
| Cabeza de Manzaneda | 21.55 | 21.76 | 21.77 | 21.85 | 0.30 | 0.101 |
© 2019 by the authors. Licensee MDPI, Basel, Switzerland. This article is an open access article distributed under the terms and conditions of the Creative Commons Attribution (CC BY) license (http://creativecommons.org/licenses/by/4.0/).
Share and Cite
Bará, S.; Lima, R.C.; Zamorano, J. Monitoring Long-Term Trends in the Anthropogenic Night Sky Brightness. Sustainability 2019, 11, 3070. https://doi.org/10.3390/su11113070
Bará S, Lima RC, Zamorano J. Monitoring Long-Term Trends in the Anthropogenic Night Sky Brightness. Sustainability. 2019; 11(11):3070. https://doi.org/10.3390/su11113070
Chicago/Turabian StyleBará, Salvador, Raul C. Lima, and Jaime Zamorano. 2019. "Monitoring Long-Term Trends in the Anthropogenic Night Sky Brightness" Sustainability 11, no. 11: 3070. https://doi.org/10.3390/su11113070
APA StyleBará, S., Lima, R. C., & Zamorano, J. (2019). Monitoring Long-Term Trends in the Anthropogenic Night Sky Brightness. Sustainability, 11(11), 3070. https://doi.org/10.3390/su11113070