Article

Monitoring Long-Term Trends in the Anthropogenic Night Sky Brightness

1
Departmento Física Aplicada, Universidade de Santiago de Compostela, 15782 Santiago de Compostela, Galicia
2
Physics, School of Health of the Polytechnic Institute of Porto, 4200-072 Porto, Portugal
3
CITEUC—Centre for Research on Earth and Space of the University of Coimbra, Observatório Astronómico da Universidade de Coimbra, 3030-004 Coimbra, Portugal
4
Departamento de Física de la Tierra y Astrofísica, Instituto de Física de Partículas y del Cosmos (IPARCOS), Universidad Complutense de Madrid, 28040 Madrid, Spain
*
Author to whom correspondence should be addressed.
Sustainability 2019, 11(11), 3070; https://doi.org/10.3390/su11113070
Submission received: 26 April 2019 / Revised: 27 May 2019 / Accepted: 28 May 2019 / Published: 31 May 2019

Abstract

:
Monitoring long-term trends in the evolution of the anthropogenic night sky brightness is a demanding task due to the high dynamic range of the artificial and natural light emissions and the high variability of the atmospheric conditions that determine the amount of light scattered in the direction of the observer. In this paper, we analyze the use of a statistical indicator, the mFWHM, to assess the night sky brightness changes over periods of time larger than one year. The mFWHM is formally defined as the average value of the recorded magnitudes contained within the full width at half-maximum region of the histogram peak corresponding to the scattering of artificial light under clear skies in the conditions of a moonless astronomical night (sun below −18°, and moon below −5°). We apply this indicator to the measurements acquired by the 14 SQM detectors of the Galician Night Sky Brightness Monitoring Network during the period 2015–2018. Overall, the available data suggest that the zenithal readings in the Sky Quality Meter (SQM) device-specific photometric band tended to increase during this period of time at an average rate of +0.09 magSQM/arcsec2 per year.

1. Introduction

Light pollution is increasingly recognized as a relevant threat to a sustainable world. The detrimental consequences of an inadequate use of artificial light at night are known to negatively affect the environment [1,2,3], overall public expenditure and energy consumption [4,5], the intangible heritage associated with the contemplation of the starry skies [6] and, potentially, human health [7,8,9,10,11,12,13,14].
Assessing the evolution of these unwanted effects is a pre-requisite for evaluating public lighting policies and making informed decisions on the social use of artificial light at night, particularly in regards to outdoor light sources. Two complementary approaches can be adopted, both of which provide relevant information on this issue. On the one hand, the evolution of the overall amount of artificial light emissions can be estimated from data provided by instruments operating on Earth orbiting platforms, such as the Visible Infrared Imaging Radiometer Suite Day/Night Band (VIIRS-DNB) [15], or the radiometrically calibrated RGB images taken with off-the-shelf digital single-lens reflex cameras from the International Space Station [16,17]. On the other hand, some particular light pollution effects can be quantitatively measured from ground sites. One of these effects, probably the most conspicuous one for the majority of the population, is the increase in the night sky brightness (NSB) above its expected natural levels [18,19,20]. The anthropogenic NSB is due to the scattering of artificial light by the air molecules and the aerosols present in the atmosphere, as well as by the enhanced reflections in the clouds. This NSB represents in itself a problem, since the artificially bright sky acts as a secondary light source that increases both the brightness within the visual field of nocturnal species and ground-level irradiance, modifying the rules of the struggle for survival, and reducing, for humans and non-humans alike, the visibility of the starry sky.
The NSB can be measured in different photometric bands, either visually [21] or by using an ample variety of detectors [22,23,24]. The widespread availability of these tools facilitates use by a high number of research institutions, public meteorological agencies, and social scientists alike, to perform routine measurements of the NSB, contributing to building large-size databases that can be used to monitor the evolution of the anthropogenic sky brightness [25].
Given the extreme variability of the NSB signal, with characteristic multi-scale oscillation times ranging from seconds to years, the detection of small overall changes over time is a demanding task. Any such goal requires the choice of some numerical indicator with small intrinsic variance and acceptable robustness. In this work, we describe the use of one such indicators, the zenithal mFWHM, based on the NSB data acquired under clear skies in the conditions of a moonless astronomical night (sun below −18°, and moon below −5°). This indicator allows one to overcome some drawbacks of the m1/3 significant magnitude used in previous works [20], which in dark-sky locations can be potentially biased toward darker values by the readings taken during extreme weather conditions (snow or dense fogs).

2. Materials and Methods

2.1. Night Sky Brightness: Definition and Measurement

“Night sky brightness” (NSB) is a short-hand term for the spectral radiance of the night sky, integrated across wavelengths within the photometric band of the detector and angularly averaged across its field-of-view (FOV) [20].
Denoted by
  • L λ ( ω ) , the spectral radiance (Wm−2sr−1nm−1) of the incident light field along the direction described by the vector of angular components ω = ( z , φ ) , where z is the zenith angle and φ the azimuth;
  • d 2 ω , the elementary solid angle element (sr) around the direction ω , which in spherical coordinates is given by d 2 ω = sin ( θ ) d θ d φ ;
  • P ( ω ) , the field-of-view function of the device (units sr−1) normalized such that Ω P ( ω ) d 2 ω = 1 , where Ω stands for the angular half-space subtended by the forward-facing hemisphere; and
  • T ( λ ) , the spectral sensitivity band of the detector (unitless, and normalized to 1 at its maximum), where λ is the wavelength, the NSB measured by the detector, in units of band-weighted radiance (Wm−2sr−1), is given by:
    NSB = λ = 0 T ( λ ) [ Ω P ( ω ) L λ ( ω ) d 2 ω ] d λ
According to Equation (1), any numerical value of the NSB only has a definite physical meaning if both the spectral sensitivity T ( λ ) and the field-of-view function of the detector P ( ω ) are clearly specified. Several common detectors display very different characteristics. The human eye, for instance, has photoreceptoral FOVs of the order of a few arcmin wide, and an overall spectral sensitivity described by the CIE photopic V ( λ ) curve [26]. When the NSB is perceived or measured in this spectral band (and only in this case), the NSB can be equivalently expressed in visual units of cd/m2 by multiplying the radiance in Equation (1) by the luminous efficacy factor 683 lm/W. CCD- or CMOS-based all-sky detectors imaging the celestial hemisphere typically have large numbers of pixels with small individual FOVs (a few arcmin, depending on the optics) and detect the incoming radiation in a variety of bands, as, e.g., the Johnson–Cousins B, V and R [27] of the All-Sky Transmission Monitor (ASTMON) [28] or the standard RGB of digital single-lens reflex (DSLR) cameras [29,30,31,32,33]. The NSB is also measured with dedicated devices such as the Sky Quality Meter (SQM) of Unihedron (Grimsby, ON, Canada), or the Telescope Encoder and Sky Sensor (TESS-W) developed by the European Union’s Stars4All project [23]. The SQM and the TESS have FOVs of approximately Gaussian shape with full width at half-maximum (FWHM) of 20° and 17°, respectively, and measure the NSB in their own specific photometric bands [24]. A review of the main features of several commonly used NSB detectors can be found in [22].
NSB radiances are frequently expressed in the negative logarithmic scale of ‘magnitudes per square arcsecond’ (mag/arcsec2) within the corresponding photometric band. The use of this non-SI compliant system of units requires the choice of a reference radiance that defines the ‘zero-point’ of the magnitude scale. The reference radiances for the SQM and TESS detectors in the absolute (AB) magnitude scale are described in [24]. A rigorous definition of this scale for the human visual system, based on the V(λ) photopic sensitivity band, can be found in [34].

2.2. Night Sky Brightness Statistics

At any given site and for any observation direction, say, the zenithal one, the NSB is a variable strongly dependent on time. Its time course is determined by the changing contributions of both natural and artificial light sources, as well as by the changes in the state of the atmosphere. Wide oscillations in the NSB can be observed at different time scales. The basic 24-h NSB cycle of day and night [20,35,36,37,38] is significantly modulated by the monthly cycle of moonlight [20,39] and by the different length of the days and nights associated with the seasons of the year [20,38]. Seasonal variations are also associated with the different celestial bodies present in the upper hemisphere. Longer period inter-year variations do also exist, correlated with solar activity and its influence on the values of the natural skyglow, and with the extension of the systems of outdoor lighting [40].
At ultradian time scales, the zenithal NSB varies due to the time course of the artificial light emissions throughout the night [41,42,43] and the varying zenithal distance of celestial objects, including the Milky Way. At even shorter scales, the amount of scattered light varies according to the changes in aerosol concentration profiles, and, in times from minutes to seconds, the zenithal NSB can vary significantly due to the presence of broken clouds. The cloud cover has been shown to significantly increase the NSB in light-polluted areas, due to the reflection of artificial light in the base of the clouds, producing the opposite effect in pristine dark sites, where the reflections are very faint or inexistent and the clouds block the propagation of natural starlight [20,33,38,44,45,46].
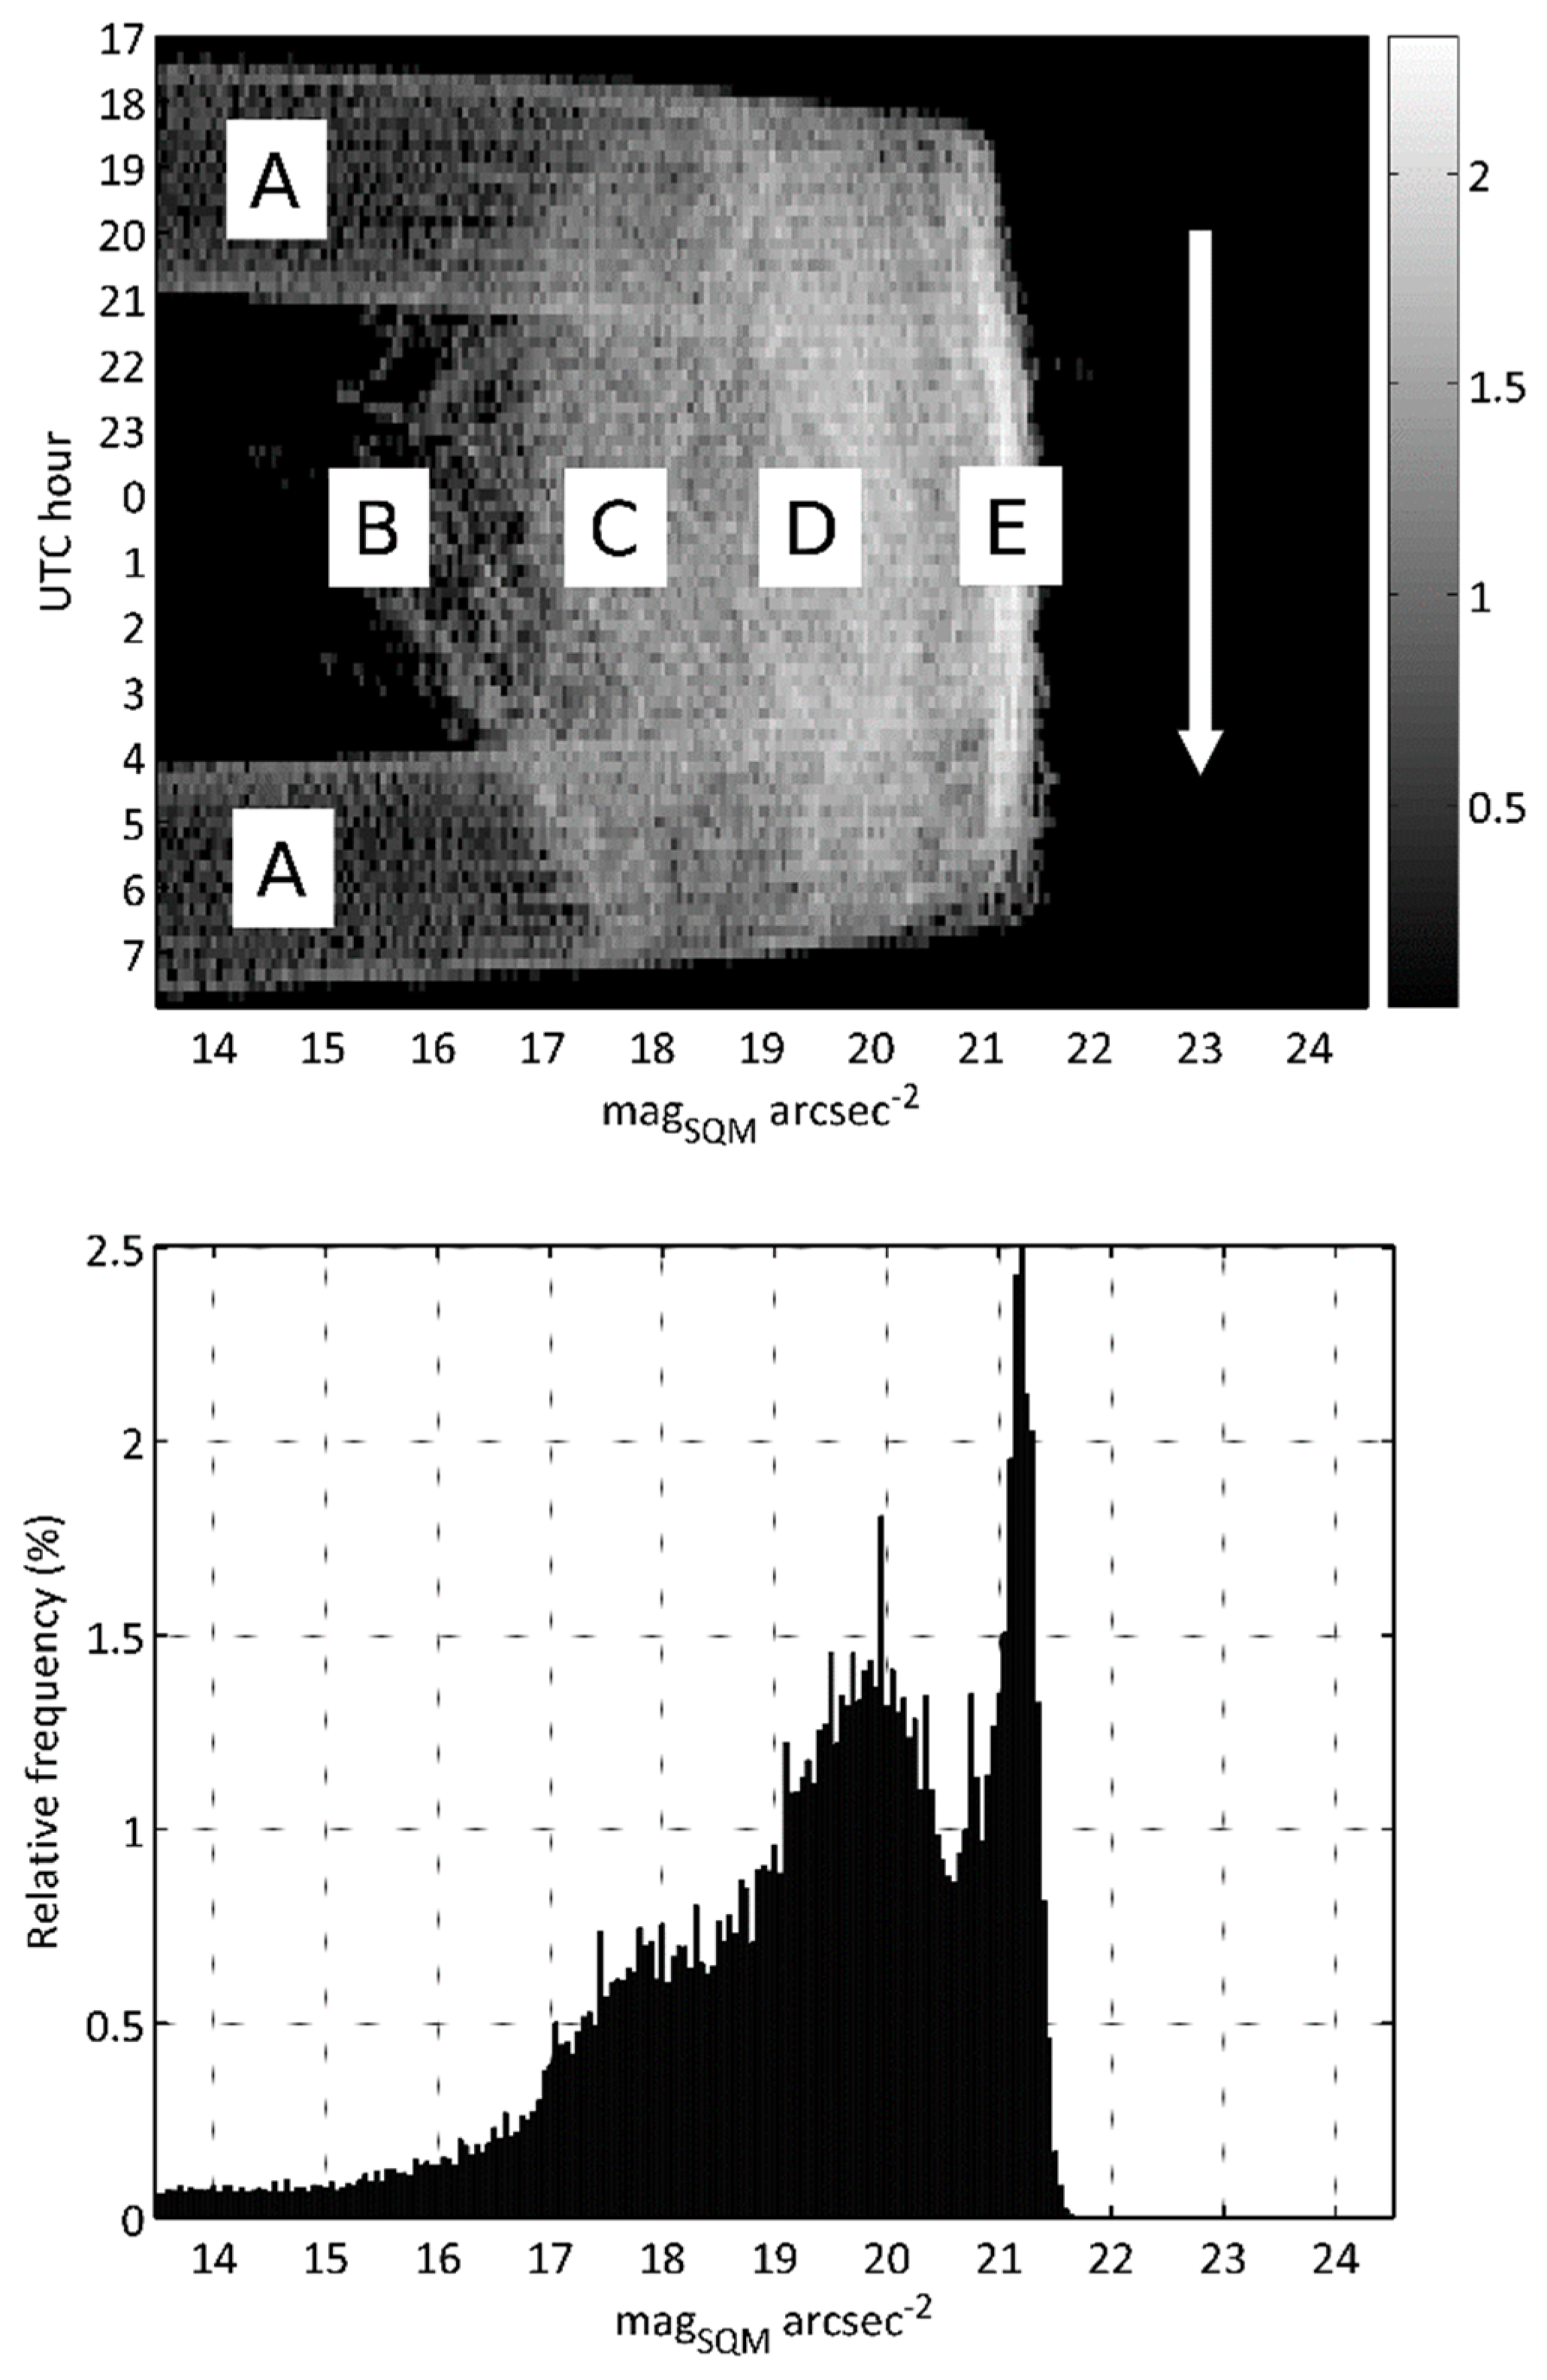
Any detailed description of the actual NSB conditions at a given site has to be made in statistical terms. Several graphic representations can be instrumental to obtain some insights into the NSB distribution. One particularly useful one is the densitogram (or ‘jellyfish diagram’, according to Posch et al. [38]). In this matricial representation (Figure 1), the horizontal axis corresponds to the time of the day (with, e.g., 10-min bin resolution), and the vertical one to the NSB measured in the magnitudes per square arcsecond scale (with, e.g., 0.05 mag/arcsec2 resolution bins). The value of each pixel is the number of measurements recorded along the year within each time-magnitude bin.
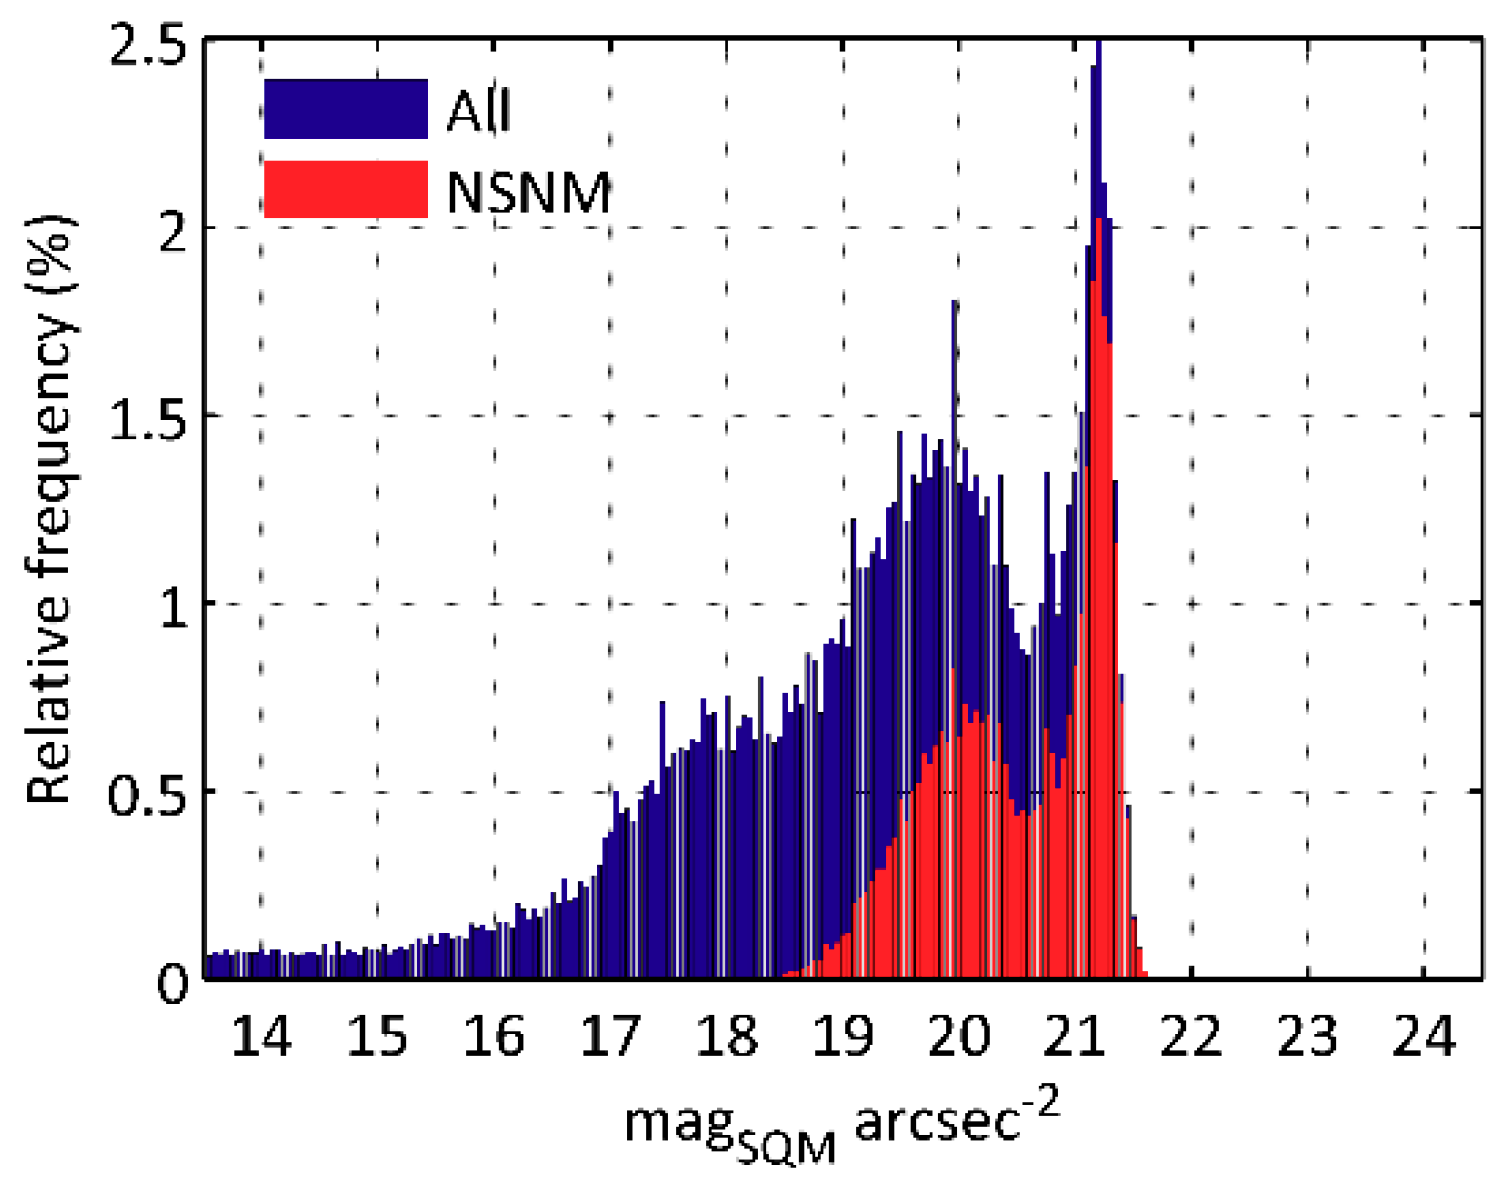
The annual NSB histogram can be easily obtained by integrating the densitogram values along the time axis (Figure 2). The different features visible in the densitogram (twilight periods, moon within the field of view, scattered moonlight, cloud reflections, and atmospheric scattering in clear and moonless periods of the night) project into distinguishable histogram features. In order to monitor the yearly evolution of the NSB and detect trends in the artificial emissions of light at night, it is advantageous to remove from the NSB sample those values obtained during the twilight periods as well as those recorded when moonlight is present. This can be done by selecting the NSB values corresponding to the moonless astronomical night, operatively defined for this work as the times when the sun altitude with respect to the horizon is below −18° (i.e., after the end of the dusk astronomical twilight and before the beginning of the dawn astronomical twilight) and the moon is below −5°. This subset of NSB records will be denoted henceforth as the No-Sun No-Moon values (NSNM). This way, only the NSB due to the artificial emissions of light and the weakest natural sources (starlight and airglow), including cloud reflections and scattering under variable atmospheric conditions, are displayed in the histogram (Figure 3).
It is clear that no single value of the NSB can be taken as fully representative of the variety of conditions at any given observation site, much like no single air temperature of wind speed could be attributed to it with a claim of completeness. As a matter of fact, the NSB results from the interaction between the light emitted by artificial and natural sources and the changing meteorological conditions, whose combined variability is larger than of any of its individual factors. This, however, does not prevent defining some statistical indicators that can be used to track the NSB changes along extended periods of time, some of which are analyzed in the Section 2.3.

2.3. Long-Term NSB Evolution Indicators

The detection and quantification of the NSB evolution trends is a demanding task due to the extreme short-term variability of the NSB signal and the relatively small overall changes expected over time periods of order ~1 year. To reduce the variability, three complementary steps can be taken: (i) using evolution indicators based on averages over a high number of individual NSB records, (ii) restricting the sample to the NSB values obtained in the conditions of a moonless astronomical night (NSNM), defined as described above, and (iii) further restricting the sample to those records obtained under comparable atmospheric conditions.
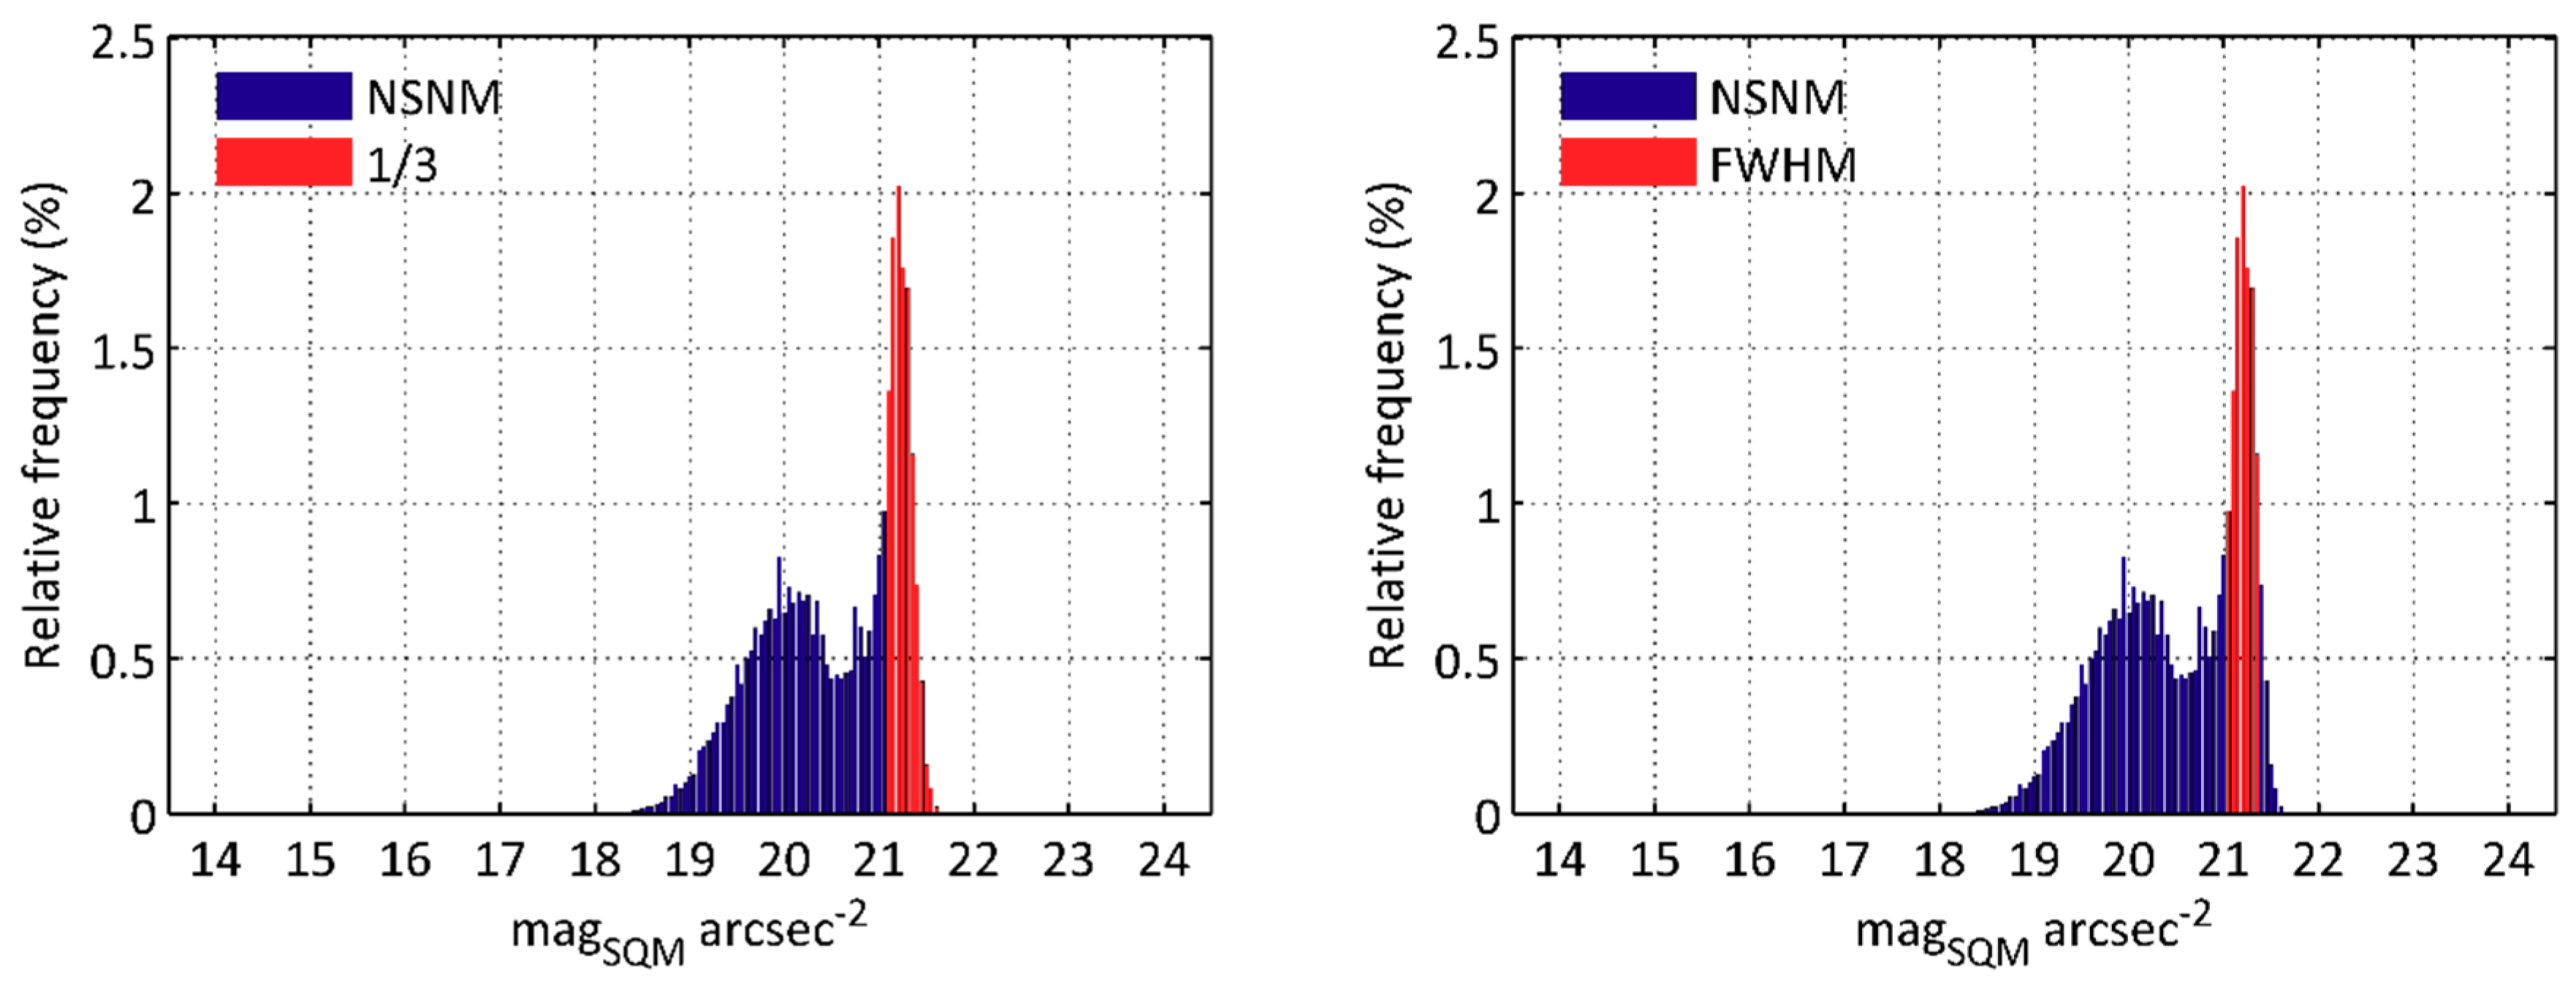
In previous works [20], the use of the m1/3 significant magnitude was proposed. The m1/3 is defined as the average of the upper tertile of NSNM values, which are highlighted in red in the NSNM histogram shown in Figure 4 (left). This is an easy to calculate, useful, and well-behaved indicator for most urban and periurban sites, where the darkest values of the NSB correspond to the scattering of artificial light in clear and moonless nights. However, the detailed analyses of these data received from NSB measuring stations located in darker sites has shown that some extreme weather phenomena, occurring with different frequency from year to year, can give rise to very dark NSB values that tend to distort the descriptive value of the m1/3. Thick snow cover in mountains or dense fog episodes in oceanic islands sometimes add a non-negligible amount of measurements to the region above 22.0 mag/arcsec2, biasing the m1/3 estimates of the years toward darker values when these phenomena are experienced with particular strength.
An alternative possibility, explored in this work, is the use of an indicator based on the NSB values contained within the narrow and darkest peak of the NSNM histograms. This peak corresponds to artificial light scattered under clear skies in the conditions of a moonless astronomical night plus the weakest natural sources of light. The relative height of this peak at any particular site depends on the balance between clear and cloudy nights at that observation place, and its width depends on the combined effect of the variable amount of artificial light emissions along the night and the variability of the aerosol concentration profiles at that site in clear nights. The peak location along the mag/arcsec2 axis is indicative of the amount of artificial light emitted from the territories that build up the NSB at that site [47].
One such possible indicator of the overall quality of the zenithal night sky is the mFWHM, defined as the average value of the NSB records contained within the full width at half-maximum interval of the clear nights’ peak, the region shown highlighted in red in Figure 4 (right).
The inspection of NSB data acquired across several years suggests that the mFWHM is highly insensitive to the unequal frequency occurrence of extreme weather phenomena, since the NSB records obtained during such episodes tend to fall outside the FWHM interval and are not taken into account in the calculation of this indicator. Section 3 of this paper presents the results of the mFWHM 2015–2018 evolution at the 14 SQM detectors of the Galician Night Sky Brightness Monitoring Network, whose principal features are described in Section 2.4.

2.4. A Case Study: The NSB Evolution (2015–2018) in the Galician Night Sky Brightness Monitoring Network

The Galician Night Sky Brightness Monitoring Network (GNSBMN) is the NSB measuring service of MeteoGalicia, the Galician Government public meteorological agency [48]. The backbone of the network is composed of 14 SQM detectors (model SQM-LR, with serial numbers comprised between 2381 and 2410) installed in automated weather stations located in urban, periurban, transition regions, and rural and mountain sites across the country. A general description of the network can be found in [20]. SQM detectors are presently used in several NSB measurement networks and campaigns worldwide, powered by public, academic, and non-governmental actors [20,49,50,51,52].
In this paper, we report on the 2015–2018 evolution of the zenithal night sky brightness in the GNSBMN stations, using the mFWHM calculated on a yearly basis from the NSB datasets recorded at each location. These data are continuously acquired at a rate of one reading per minute and are corrected from the losses due to Fresnel reflections in the glass windows of the protecting enclosures (−0.1 magSQM/arcsec2). The raw data provided by each sensor, corresponding to the original manufacturer’s calibration, were corrected for minor inter-detector variability by the means of linear regressions to the network’s reference detector. This procedure improves the inter-station reproducibility of the NSB datasets, although it is of no relevance for the detection and quantification of the NSB evolution trends in each individual station (excepting for ensuring the consistency of the temporal series in case of detector replacement due to failure).
The zenithal NSB data acquired by the GNSBMN detectors are publicly available in real time, as ten-minute averages corrected from glass reflection losses, in the specific MeteoGalicia webpage [53]. They can be freely downloaded for any time period from each station’s page. It is also possible to download time-series of any other meteorological variable recorded at the stations that the user may deem of interest. One-minute full resolution NSB datasets are freely available upon request.

3. Results

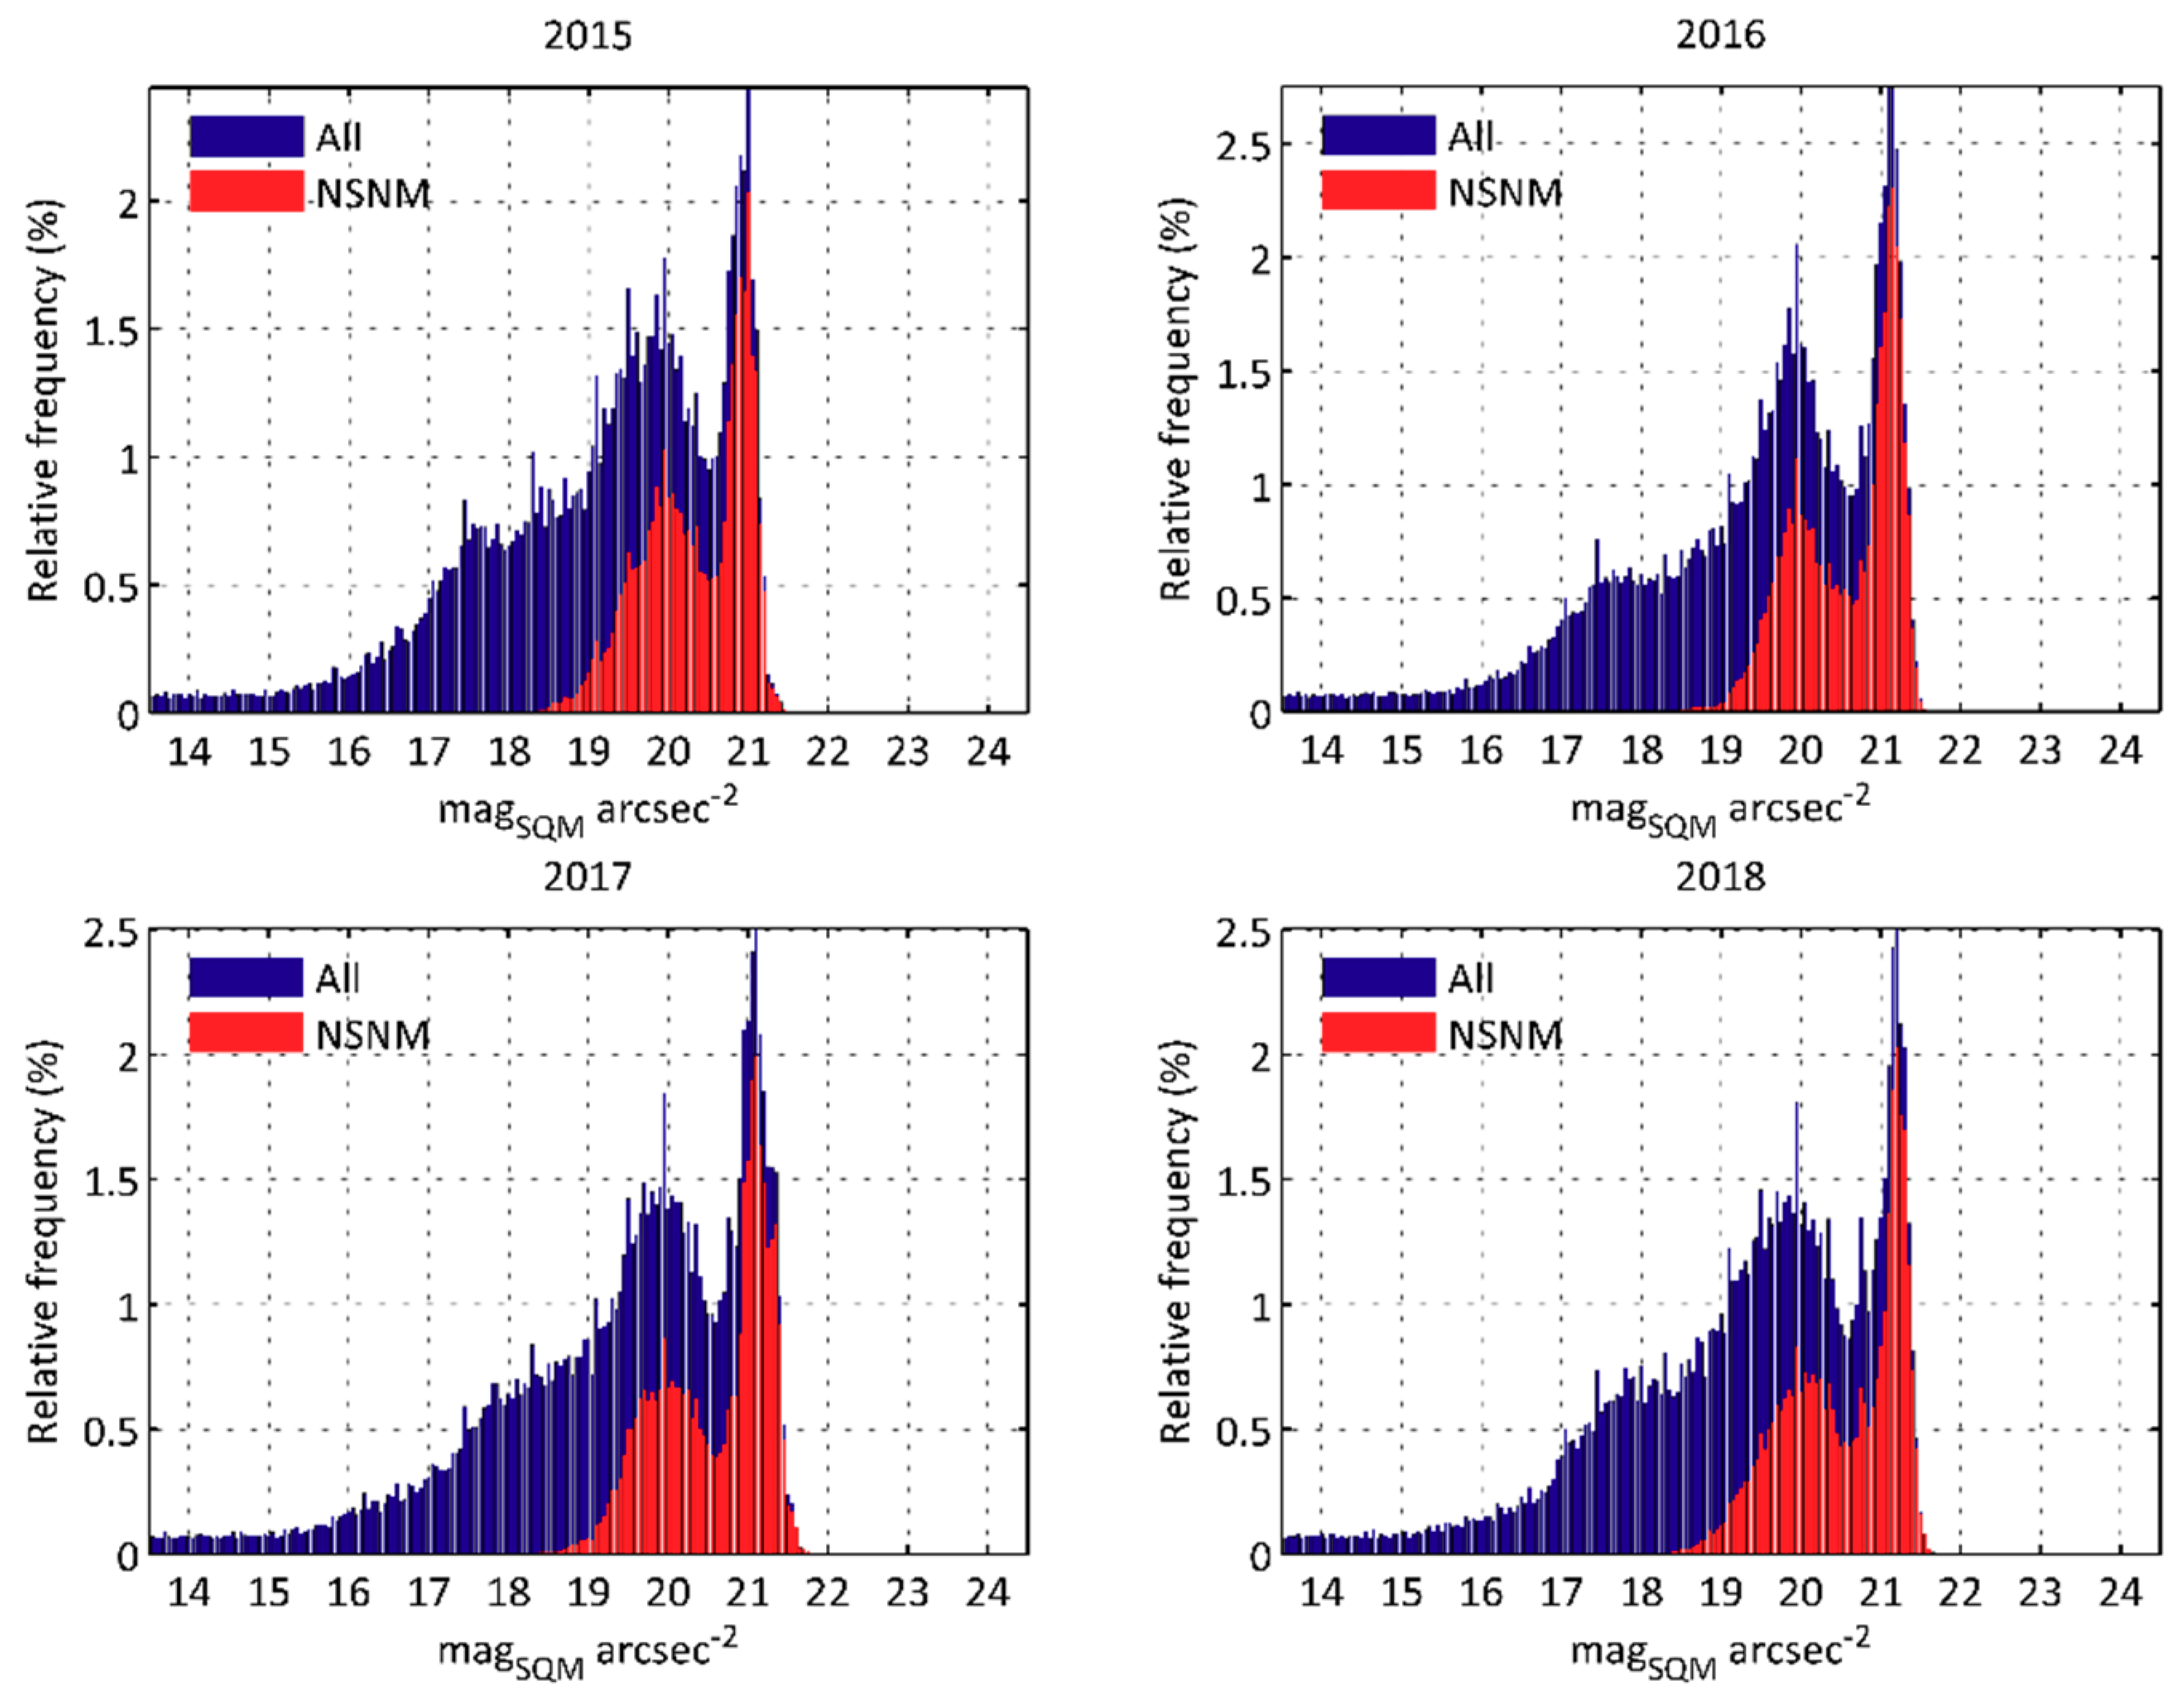
The zenithal NSB data recorded by the 14 SQM detectors of the GNSBMN between 1 January 2015 and 31 December 2018 were used for this study (14 × 4 datasets). The yearly histograms of each station, both for the full set of NSB measurements and for the NSNM subset, show a reasonable constancy over the years, as illustrated in Figure 5 with data from the Paramos station. Only in a few particular instances the histograms showed noticeable differences, due to changes experienced in the detectors proximity, for instance, before and after the installation of new light sources close to them, as in the station of O Cebreiro in February 2016.
The definite shape of the NSNM histogram is different for each station, according to the particular strength of the emissions of artificial light from its area of influence [47] and the prevailing meteorological conditions, especially in regards to the statistics of the cloud cover. Figure 6 displays some of these histograms, corresponding to the stations of Santiago de Compostela (urban), Guísamo (periurban), Illas Cíes (transition), and Labrada (rural and mountain), for year 2015. The reader may consult the full NSB data version of these histograms, for the same year, which is shown in Figure 3 of [20]. The location of the darker (clear skies) scattering peak in the magnitude axis, where the mFWHM is calculated, is informative of the typical light pollution level at the site, and its area is indicative of the proportion of clear nights. The location of the brighter peak (cloud reflections), relative to the clear nights’ one, gives us a measure of the typical cloud amplification factor at the site [20,44]. Note that as we approach darker places, the light reflected from the clouds tends to be weaker and the peak corresponding to overcast nights approaches (until it is eventually confounded with, and can even surpass, as commented above) the one for clear nights.
The average number of NSB data per individual station and year, contained within the FWHM interval of the NSNM clear nights’ peak, was ~37,700, with a standard deviation of ~11,400. The largest number of records used to compute the yearly mFWHM was 66,562 (Labrada station, 2018), and the smallest one 17,710 (Illa de Sálvora station, 2015). To avoid artifacts, the control condition that the FWHM records span less than one magSQM/arcsec2 at either side of the peak maximum was checked before computing the mFWHM. To attenuate the effects of random histogram noise, the center of the clear nights’ peak on the magnitude axis can be estimated from a weighted average of the positions of its five largest NSB values, and the corresponding peak value can be estimated from the average of the three largest values. From these data, the FWHM interval can be defined, and the mFWHM is computed as the average of all individual NSNM records contained within this interval. Averaged over the four years and within the stations belonging to each area type (standard deviation in parenthesis), the FWHM was 0.61 (0.08) magSQM/arcsec2 in urban centers, 0.38 (0.08) magSQM/arcsec2 in periurban sites, 0.37 (0.04) magSQM/arcsec2 in transition regions excluding Illa de Ons due to the artifacts associated with the change of detector (see below), and 0.54 (0.19) magSQM/arcsec2. in rural and mountain sites.
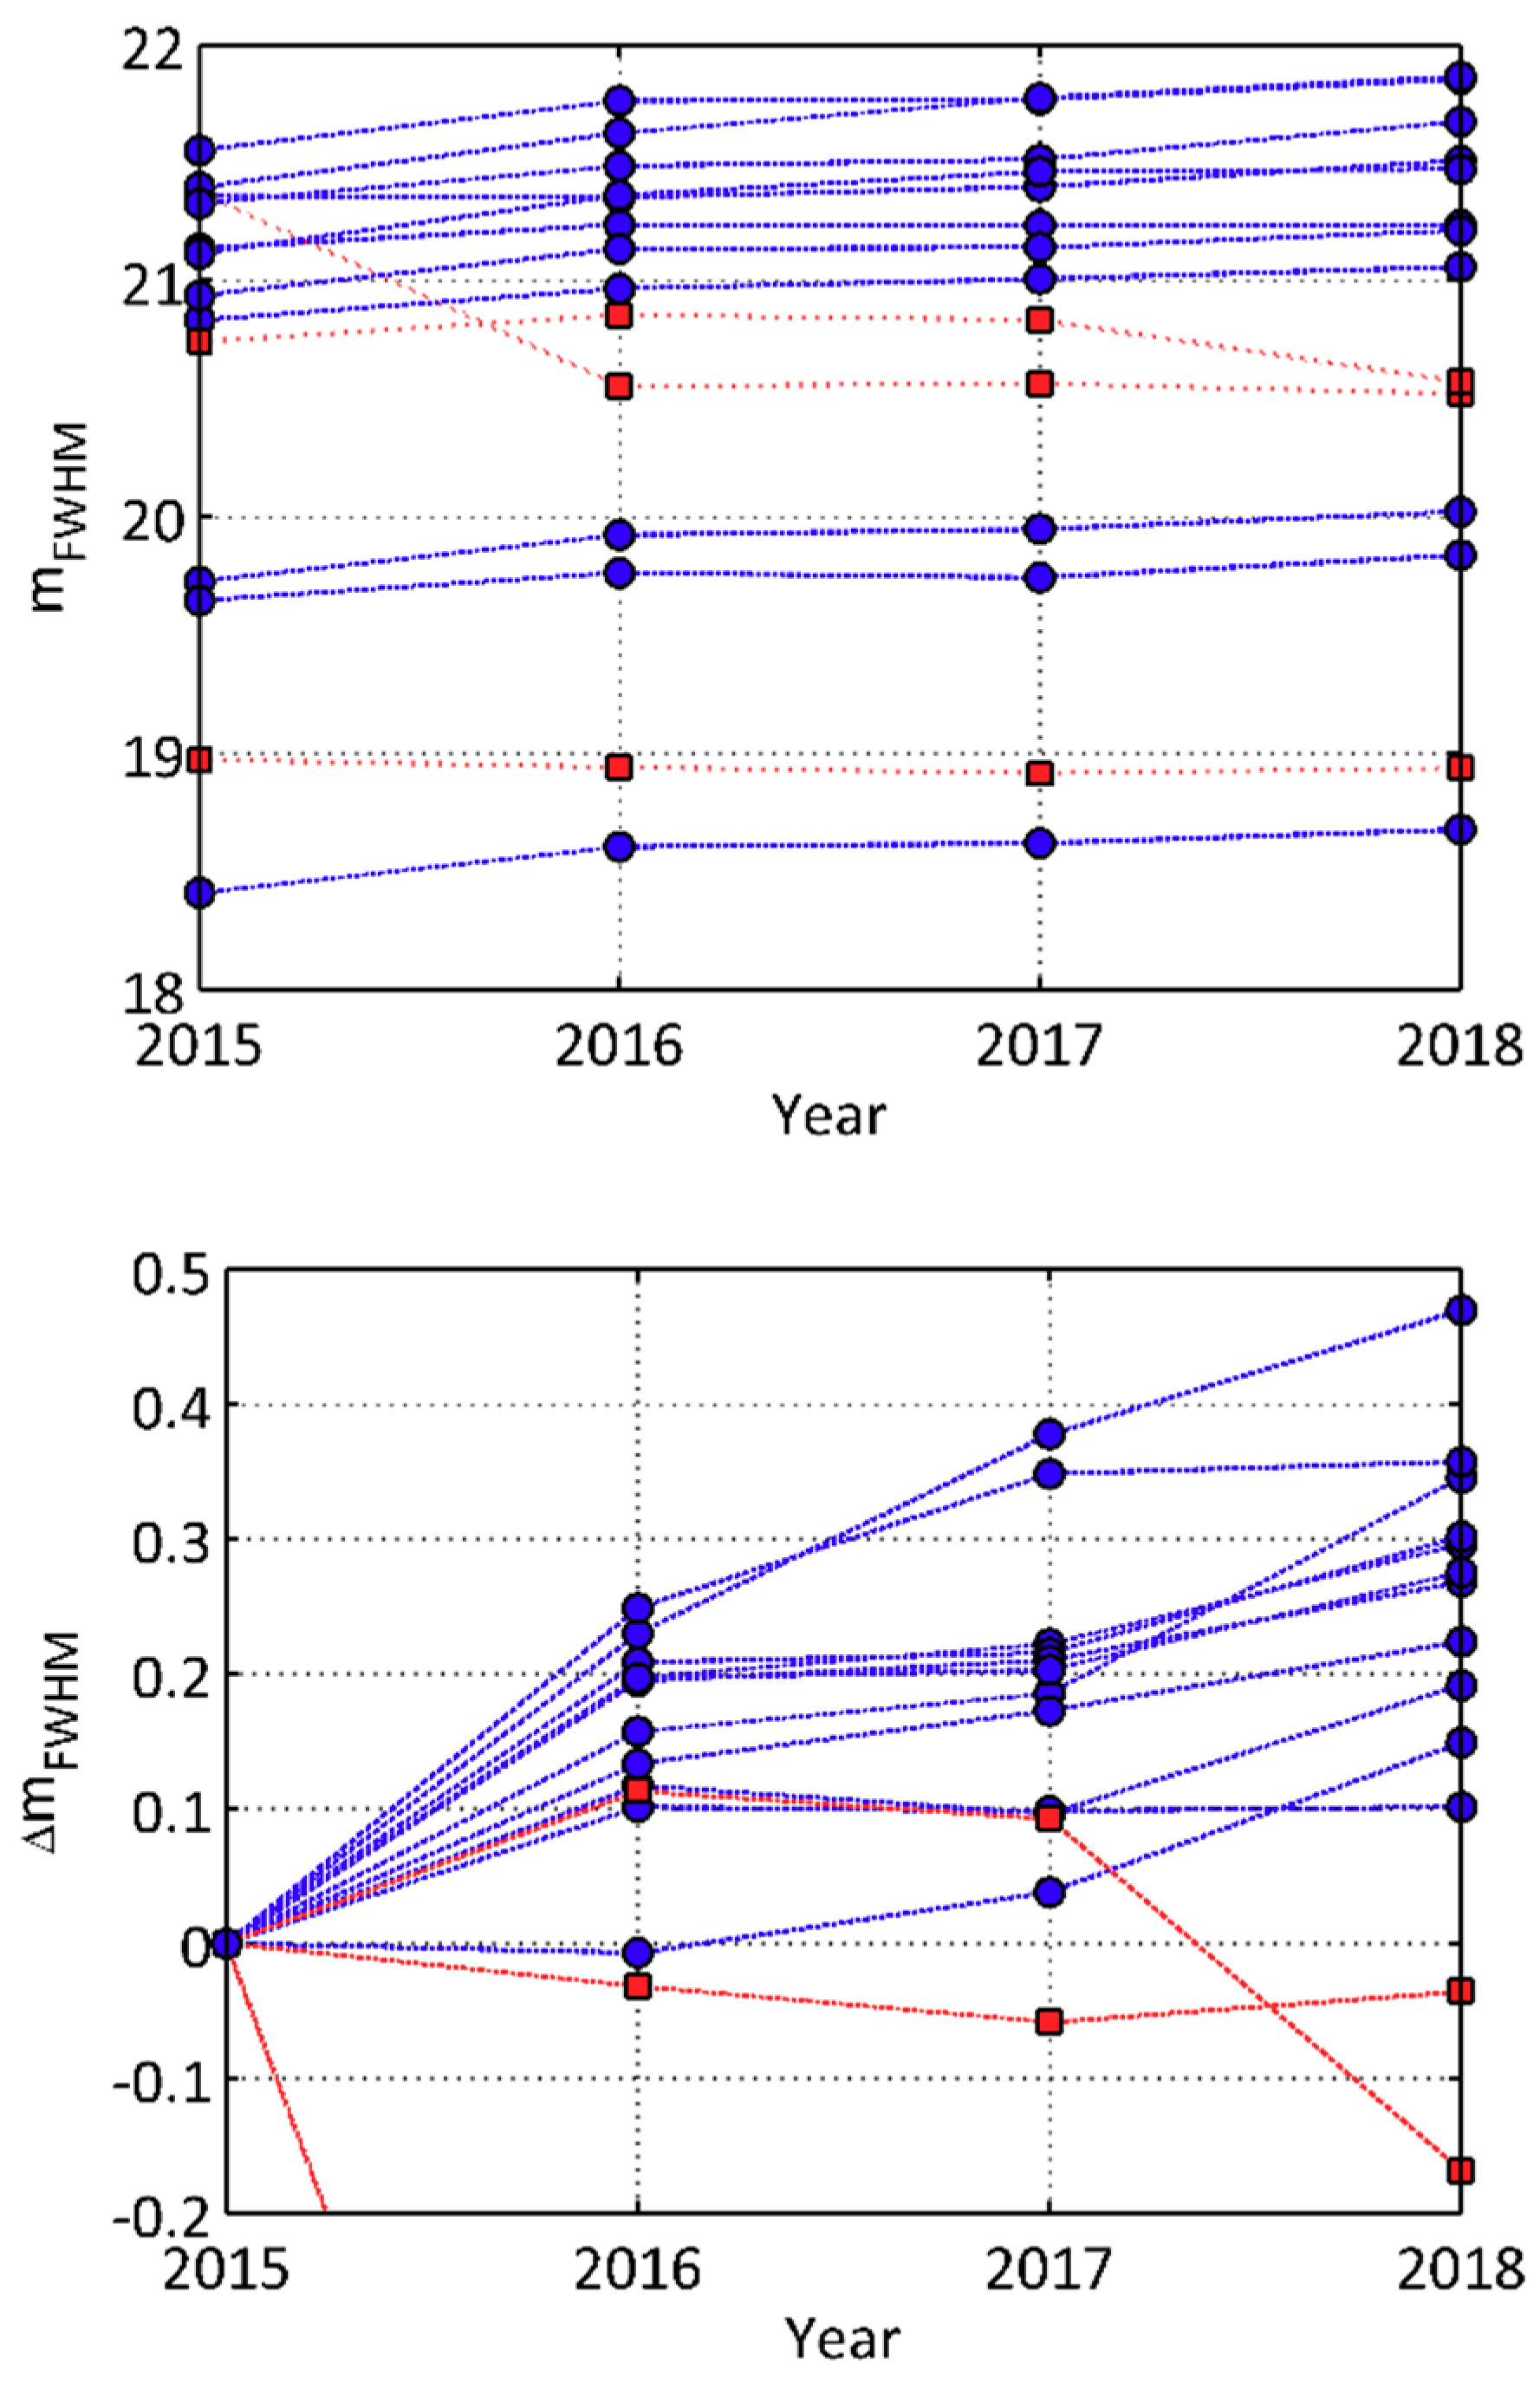
Table 1 summarizes the results. The mFWHM for each station and year, its overall change in the period 2015–2018, and its average change per year are indicated in columns 2 to 7 in units magSQM/arcsec2. The uncertainty of the yearly mFWHM results is 0.029 magSQM/arcsec2 (one standard deviation). This uncertainty is basically due to the limited precision of the SQM readings, since the standard deviation of the mean of the individual readings is one to two orders of magnitude smaller. The temporal evolution is graphically depicted in Figure 7.
Eleven out of the fourteen stations showed a net increase in the mFWHM at the end of the period, compared with its initial value (p < 0.001). This suggests that the skies, in the SQM photometric band, tended to become darker. In three stations, the overall evolution was toward brighter values (net magnitude decrease). In two of these stations, the brightening is significant to a p-value smaller than 0.001, and they correspond to two particular cases: O Cebreiro, where, as on commented above, new light sources strongly influenced the detector readings from February 2016 onwards; and Illa de Ons, where a faulty detector was replaced in 2018, causing a sudden 0.3-magSQM/arcsec2 drop in the records very likely due to an unintended change in the pointing direction of the device. The remaining station with a negative magSQM/arcsec2 net change is Santiago de Compostela, whose readings tended to be fairly constant across this period. This latter change is significant only to a p-value smaller than 0.25. If only the stations with positive darkening are considered, the inter-stations average overall change during the period 2015–2018 is 0.27 magSQM/arcsec2 (with an average standard deviation 0.13 magSQM/arcsec2; that is, the skies seem to be darkening in the SQM photometric band at a relevant rate of 0.09 magSQM/arcsec2 per year.

4. Discussion

The results presented in the section above suggest the existence of a significant trend toward darker readings in the majority of the stations of the GNSBMN. Darker readings may arise from causes intrinsic to detectors themselves (aging of the optics or some optoelectronic components), long-term changes in the average aerosol concentration profiles over the observation site and surrounding territories, and/or actual changes of the artificial light emissions toward the upper hemisphere within the spectral sensitivity band of the detector.
Regarding the first possibility, the readings of the SQM detectors have been shown to be stable over long periods of time, with small annual drifts [54]. The glass windows of the GNSBMN detectors are periodically maintained according to the MeteoGalicia operating protocols, much like the remaining optical instruments installed in their stations. Visual inspection performed in some of them by the authors did not reveal any significant amount of deposits that could contribute to darkening the readings of the detectors. Besides dedicated maintenance, a positively contributing factor is the high amount of rainfall and the regime of moderate to strong winds prevailing in Galicia during extended periods of the year. The possibility of long-term changes in the aerosol concentration profiles, averaged over the clear and moonless astronomical nights of the year, cannot be ruled out, although it does not seem very likely that such a significant reduction in the aerosol content of the atmosphere took place during these years as to explain the recorded NSB values. The third possibility, actual reductions of the artificial light emissions toward the upper hemisphere within the spectral sensitivity band of the detector, is not implausible. The current trend of the replacement of gas discharge lamps by LED sources in Galicia is characterized by several features that give rise to contradictory NSB effects: (i) the substitution of low CCT high-pressure sodium lamps (~2000 K) by typically cold white light LEDs (4000 K) tends to increase the absolute amount of light scattered in the vicinity of the sources and hence to produce brighter skies in these places; (ii) this same substitution could allow a better delineation of the specific areas to be lit, reducing light spill and the overall amount of light sent to the upper hemisphere (strongly limited, in current ordinances), which affects the NSB in the opposite direction; and (iii) this substitution process takes place under a framework of lighting regulations that generally require achieving average lighting levels smaller than the pre-existing ones (albeit still greater than needed). This last factor, together with the fact that many outdoor public lighting installations are presently managed by private energy service companies (ESCO), whose net earnings depend on the savings on the overall energy consumption, may contribute a mild pressure toward smaller lighting levels. However, we cannot provide a closed conclusion for the time being. A detailed quantitative modeling of this transition process is currently underway and will be reported as soon as available.
It is worth mentioning that substantially similar results (not shown here) for the 2015–2018 evolution are obtained if the m1/3 significant magnitude is used as the indicator, instead of the mFHWM. As a matter of fact, only one station, Xares, shifts from positive to negative m1/3 change for this period. The net brightening observed in Xares using the m1/3 indicator is due to the episodic strong snowfalls experienced in year 2015 in this mountain region that gave rise to a non-negligible number of SQM readings in the extremely dark region of the histogram, thus biasing toward larger magnitudes the initial m1/3 value. During the remaining years, this phenomenon did not occur, and the Xares m1/3 show a trend of monotonic darkening. The average darkening for the ten stations with net positive change, estimated by the means of the m1/3, amounts to 0.09 magSQM/arcsec2 per year, the same value obtained with the mFWHM.
This study has been performed using the whole datasets acquired at the native sampling rate of the GNSBMN detectors (one reading per minute). However, the same results could be obtained with longer sampling periods. Reprocessing the datasets by taking one sample every 5 min, the maximum absolute difference of the mFWHM for all stations and all years, with respect to those obtained with the original one-minute readings, is smaller than 0.0009 magSQM/arcsec2, well below the uncertainty of the final results. If the sampling period is increased to one reading every 10 min, the maximum absolute difference is below 0.0017 magSQM/arcsec2.
The mFWHM metric used in this work is affected by some limitations. First, its calculation depends on the selection of the FWHM region of the clear nights’ histogram peak. Our histograms were calculated from densitograms with 0.05-magSQM/arcsec2 NSB resolution bins and ten-minute time resolution, each individual densitogram value being the ten-minute average of the one-minute detector readings. Coarser or finer bins may give rise to slightly different definitions of the FWHM interval. It is not expected, however, that these choices will give rise to systematic artifactual changes in the temporal evolution trends. Second, our measurements correspond to the NSB angularly averaged around the zenith, within the FOV of the SQM detectors, and the reported trends apply specifically to this photometric magnitude. Specific evolution indicators, following an approach similar to the one used here for the zenithal mFWHM, could equally be defined for other NSB metrics such as the average magnitude of the celestial vault and the all-sky average light pollution ratio [55], among others. Finally, let us also recall that the brightness evolution recorded in the SQM device-specific photometric band does not necessarily represent the evolution experienced in the human visual band. As recently shown by Sánchez de Miguel et al., changes in the spectral content of the light incident on the detectors may give rise to different evolution trends depending on the spectral band in which they are measured [56].

5. Conclusions

We describe in this paper the use of the mFWHM, a convenient indicator for assessing the time changes of the anthropogenic night sky brightness over periods larger than one year. This indicator overcomes some limitations of the previously used m1/3 significant magnitude, which in dark sites may be potentially biased toward still darker values by the sporadic occurrence of extreme weather events such as strong snowfalls or dense fogs. The zenithal NSB data recorded by the 14 SQM detectors of MeteoGalicia during the period 2015–2018 suggest the existence of a trend toward progressively darker magSQM/arcsec2 values. Further research is required to ascertain whether the apparent darkening detected in the SQM spectral band corresponds to an effective reduction of the artificial light emissions in the surrounding territories, and whether or not it is also accompanied by a net darkening in the human visual V ( λ ) sensitivity band.

Author Contributions

Conceptualization and methodology, S.B., R.C.L. and J.Z.; software, S.B.; formal analysis, and investigation, S.B., R.C.L. and J.Z.; resources, data curation, and Writing—original draft preparation, S.B.; Writing—review and editing, S.B., R.C.L. and J.Z.; supervision and project administration, S.B.; funding acquisition, S.B., R.C.L. and J.Z.

Funding

This research was funded by Xunta de Galicia/FEDER, grant number ED431B 2017/64 (S.B.). J.Z. acknowledges the support from ACTION, a project funded by the European Union H2020-SwafS-2018-1-824603. CITEUC is funded by National Funds through FCT—Foundation for Science and Technology (project: UID/MULTI/00611/2019) and FEDER—European Regional Development Fund through COMPETE 2020—Operational Programme Competitiveness and Internationalization, project: POCI-01-0145-FEDER-006922 (R.C.L.)

Acknowledgments

Special thanks are given to the executive and technical staff of MeteoGalicia, the Galician Government public meteorological agency, for their efficient management of the Galician Night Sky Brightness Monitoring Network and for the public dissemination of its results. Our warmest memories are for our late colleague Thomas Posch, who developed groundbreaking and extensive research in this field, as well as for Abraham Haim, two recent losses for the light pollution science community.

Conflicts of Interest

The authors declare no conflict of interest. The funders had no role in the design of the study; in the collection, analyses, or interpretation of data; in the writing of the manuscript, or in the decision to publish the results.

References

  1. Longcore, T.; Rich, C. Ecological light pollution. Front. Ecol. Environ. 2004, 2, 191–198. [Google Scholar] [CrossRef]
  2. Hölker, F.; Wolter, C.; Perkin, E.K.; Tockner, K. Light pollution as a biodiversity threat. Trends Ecol. Evol. 2010, 25, 681–682. [Google Scholar] [CrossRef]
  3. Gaston, K.J.; Duffy, J.P.; Gaston, S.; Bennie, J.; Davies, T.W. Human alteration of natural light cycles: Causes and ecological consequences. Oecologia 2014, 176, 917–931. [Google Scholar] [CrossRef] [PubMed]
  4. Organisation for Economic Co-operation and Development (OECD); International Energy Agency (IEA). Light’s Labour’s Lost—Policies for Energy-Efficient Lighting; OECD/IEA: Paris, France, 2006. [Google Scholar]
  5. Gallaway, T.; Olsen, R.N.; Mitchell, D.M. The economics of global light pollution. Ecol. Econ. 2010, 69, 658–665. [Google Scholar] [CrossRef]
  6. Marín, C.; Jafari, J. StarLight: A Common Heritage; StarLight Initiative La Palma Biosphere Reserve, Instituto De Astrofísica De Canarias, Government of The Canary Islands, Spanish Ministry of The Environment, UNESCO-MaB: Canary Islands, Spain, 2008. [Google Scholar]
  7. Pauley, S.M. Lighting for the human circadian clock: Recent research indicates that lighting has become a public health issue. Med. Hypotheses 2004, 63, 588–596. [Google Scholar] [CrossRef] [PubMed]
  8. IARC (International Agency for Research on Cancer). Painting, Firefighting, and Shiftwork: IARC Monographs on the Evaluation of Carcinogenic Risks to Humans; World Health Organization: Lyon, France, 2010; Volume 98, p. 764. [Google Scholar]
  9. AMA (American Medical Association). Light Pollution: Adverse health effects of nighttime lighting. In Proceedings of the American Medical Association House of Delegates, 161st Annual Meeting, Chicago, IL, USA, 16–20 June 2012; pp. 265–279. [Google Scholar]
  10. Haim, A.; Portnov, B. Light Pollution as a New Risk Factor for Human Breast and Prostate Cancers; Springer: Heidelberg, Germany, 2013. [Google Scholar]
  11. Fonken, L.K.; Nelson, R.J. The Effects of Light at Night on Circadian Clocks and Metabolism. Endocr. Rev. 2014, 35, 648–670. [Google Scholar] [CrossRef] [PubMed]
  12. Zubidat, A.E.; Haim, A. Artificial light-at-night—A novel lifestyle risk factor for metabolic disorder and cancer morbidity. J. Basic Clin. Physiol. Pharmacol. 2017, 28, 295–313. [Google Scholar] [CrossRef]
  13. Touitou, Y.; Reinberg, A.; Touitou, D. Association between light at night, melatonin secretion, sleep deprivation, and the internal clock: Health impacts and mechanisms of circadian disruption. Life Sci. 2017, 173, 94–106. [Google Scholar] [CrossRef]
  14. Russart, K.L.G.; Nelson, R.J. Light at night as an environmental endocrine disruptor. Physiol. Behav. 2018, 190, 82–89. [Google Scholar] [CrossRef]
  15. Elvidge, C.D.; Baugh, K.; Zhizhin, M.; Hsu, F.C.; Ghosh, T. VIIRS night-time lights. Int. J. Remote Sens. 2017, 38, 5860–5879. [Google Scholar] [CrossRef]
  16. Stefanov, W.L.; Evans, C.A.; Runco, S.K.; Wilkinson, M.J.; Higgins, M.D.; Willis, K. Astronaut Photography: Handheld Camera Imagery from Low Earth Orbit. In Handbook of Satellite Applications; Pelton, J.N., Madry, S., Camacho-Lara, S., Eds.; Springer International Publishing: New York, NY, USA, 2017. [Google Scholar]
  17. Sánchez de Miguel, A. Spatial, Temporal and Spectral Variation of the Light Pollution and its Sources: Methodology and Results. Ph.D. Thesis, Universidad Complutense de Madrid, Madrid, Spain, 2015. [Google Scholar] [CrossRef]
  18. Cinzano, P.; Falchi, F.; Elvidge, C. The first world atlas of the artificial night sky brightness. Mon. Not. R. Astron. Soc. 2001, 328, 689–707. [Google Scholar] [CrossRef]
  19. Falchi, F.; Cinzano, P.; Duriscoe, D.; Kyba, C.C.M.; Elvidge, C.D.; Baugh, K.; Portnov, B.A.; Rybnikova, N.A.; Furgoni, R. The new world atlas of artificial night sky brightness. Sci. Adv. 2016, 2, e1600377. [Google Scholar] [CrossRef] [PubMed]
  20. Bará, S. Anthropogenic disruption of the night sky darkness in urban and rural areas. R. Soc. Open Sci. 2016, 3, 160541. [Google Scholar] [CrossRef] [PubMed] [Green Version]
  21. Globe at Night. Available online: https://www.globeatnight.org/ (accessed on 25 April 2019).
  22. Hänel, A.; Posch, T.; Ribas, S.J.; Aubé, M.; Duriscoe, D.; Jechow, A.; Kollath, Z.; Lolkema, D.E.; Moore, C.; Schmidt, N.; et al. Measuring night sky brightness: Methods and challenges. J. Quant. Spectrosc. Radiat. Transf. 2018, 205, 278–290. [Google Scholar] [CrossRef]
  23. Zamorano, J.; García, C.; González, R.; Tapia, C.; Sánchez de Miguel, A.; Pascual, S.; Gallego, J.; González, E.; Picazo, P.; Izquierdo, J.; et al. STARS4ALL Night Sky Brightness Photometer. Int. J. Sustain. Light. 2016, 35, 49–54. [Google Scholar] [CrossRef]
  24. Bará, S.; Tapia, C.E.; Zamorano, J. Absolute Radiometric Calibration of TESS-W and SQM Night Sky Brightness Sensors. Sensors 2019, 19, 1336. [Google Scholar] [CrossRef]
  25. Kyba, C.C.M.; Wagner, J.M.; Kuechly, H.U.; Walker, C.E.; Elvidge, C.D.; Falchi, F.; Ruhtz, T.; Fischer, J.; Hölker, F. Citizen Science Provides Valuable Data for Monitoring GlobalNight Sky Luminance. Sci. Rep. 2013, 3, 1835. [Google Scholar] [CrossRef]
  26. CIE (Commission Internationale de l’Eclairage). CIE 1988 2° Spectral Luminous Efficiency Function for Photopic Vision; CIE: Vienna, Austria, 1990. [Google Scholar]
  27. Bessell, M.S. Standard Photometric Systems. Annu. Rev. Astron. Astrophys. 2005, 43, 293–336. [Google Scholar] [CrossRef] [Green Version]
  28. Aceituno, J.; Sánchez, S.F.; Aceituno, F.J.; Galadí-Enríquez, D.; Negro, J.J.; Soriguer, R.C.; Sánchez-Gómez, G. An all-sky transmission monitor: ASTMON. Publ. Astron. Soc. Pac. 2001, 123, 1076–1086. [Google Scholar] [CrossRef]
  29. Jechow, A.; Kolláth, Z.; Lerner, A.; Hölker, F.; Hänel, A.; Shashar, N.; Kyba, CCM. Measuring Light Pollution with Fisheye Lens Imagery from A Moving Boat, A Proof of Concept. Available online: https://arxiv.org/abs/1703.08484 (accessed on 22 March 2017).
  30. Jechow, A.; Ribas, S.J.; Canal-Domingo, R.; Hölker, F.; Kolláth, Z.; Kyba, CCM. Tracking the dynamics of skyglow with differential photometry using a digital camera with fisheye lens. J. Quant. Spectrosc. Radiat. Transf. 2018, 209, 212–223. [Google Scholar] [CrossRef] [Green Version]
  31. Jechow, A. Observing the Impact of WWF Earth Hour on Urban Light Pollution: A Case Study in Berlin 2018 Using Differential Photometry. Sustainability 2019, 11, 750. [Google Scholar] [CrossRef]
  32. Kolláth, Z.; Dömény, A. Night sky quality monitoring in existing and planned dark sky parks by digital cameras. Int. J. Sustain. Light. 2017, 19, 61–68. [Google Scholar] [CrossRef]
  33. Jechow, A.; Hölker, F.; Kyba, C.M.M. Using all-sky differential photometry to investigate how nocturnal clouds darken the night sky in rural areas. Sci. Rep. 2019, 9, 1391. [Google Scholar] [CrossRef]
  34. Bará, S. Variations on a classical theme: On the formal relationship between magnitudes per square arcsecond and luminance. Int. J. Sustain. Light. 2017, 19, 104–111. [Google Scholar] [CrossRef]
  35. Puschnig, J.; Posch, T.; Uttenthaler, S. Night sky photometry and spectroscopy performed at the Vienna University Observatory. J. Quant. Spectrosc. Radiat. Transf. 2014, 139, 64–75. [Google Scholar] [CrossRef] [Green Version]
  36. Puschnig, J.; Schwope, A.; Posch, T.; Schwarz, R. The night sky brightness at Potsdam-Babelsberg including overcast and moonlit conditions. J. Quant. Spectrosc. Radiat. Transf. 2014, 139, 76–81. [Google Scholar] [CrossRef] [Green Version]
  37. Kyba, C.C.; Tong, K.P.; Bennie, J.; Birriel, I.; Birriel, J.J.; Cool, A.; Danielsen, A.; Davies, T.W.; Peter, N.; Edwards, W.; et al. Worldwide variations in artificial skyglow. Sci. Rep. 2015, 5, 8409. [Google Scholar] [CrossRef]
  38. Posch, T.; Binder, F.; Puschnig, J. Systematic measurements of the night sky brightness at 26 locations in Eastern Austria. J. Quant. Spectrosc. Radiat. Transf. 2018, 211, 144–165. [Google Scholar] [CrossRef] [Green Version]
  39. Davies, T.W.; Bennie, J.; Inger, R.; Gaston, K.J. Artificial light alters natural regimes of night-time sky brightness. Sci. Rep. 2013, 3, 1722. [Google Scholar] [CrossRef]
  40. Kyba, C.C.M.; Kuester, T.; Sánchez de Miguel, A.; Baugh, K.; Jechow, A.; Hölker, F.; Bennie, J.; Elvidge, C.D.; Gaston, K.J.; Guanter, L. Artificially lit surface of Earth at night increasing in radiance and extent. Sci. Adv. 2017, 3, e1701528. [Google Scholar] [CrossRef] [Green Version]
  41. Dobler, G.; Ghandehari, M.; Koonin, S.E.; Nazari, R.; Patrinos, A.; Sharma, M.S.; Tafvizi, A.; Vo, H.T.; Wurtele, J.S. Dynamics of the urban nightscape. Inf. Syst. 2015, 54, 115–126. [Google Scholar] [CrossRef]
  42. Bará, S.; Rodríguez-Arós, A.; Pérez, M.; Tosar, B.; Lima, R.C.; Sánchez de Miguel, A.; Zamorano, J. Estimating the relative contribution of streetlights, vehicles, and residential lighting to the urban night sky brightness. Light. Res. Technol. 2018. [Google Scholar] [CrossRef]
  43. Meier, J. Temporal profiles of urban lighting: Proposal for a research design and first results from three sites in Berlin. Int. J. Sustain. Light. 2018, 20, 11–28. [Google Scholar] [CrossRef]
  44. Kyba, C.C.M.; Ruhtz, T.; Fischer, J.; Hölker, F. Red is the new black: How the colour of urban skyglow varies with cloud cover. Mon. Not. R. Astron. Soc. 2012, 425, 701–708. [Google Scholar] [CrossRef]
  45. Ribas, S.J.; Torra, J.; Figueras, F.; Paricio, S.; Canal-Domingo, R. How Clouds are Amplifying (or not) the Effects of ALAN. Int. J. Sustain. Light. 2016, 35, 32–39. [Google Scholar] [CrossRef]
  46. Ribas, S.J. Caracterització de la contaminació lumínica en zones protegides i urbanes. Ph.D. Thesis, Universitat de Barcelona, Catalonia, Spain, 2017. Available online: http://www.tdx.cat/handle/10803/396095 (accessed on 23 April 2019).
  47. Bará, S.; Lima, R.C. Photons without borders: Quantifying light pollution transfer between territories. Int. J. Sustain. Light. 2018, 20, 51–61. [Google Scholar] [CrossRef]
  48. MeteoGalicia, Main Page. Available online: https://www.meteogalicia.gal (accessed on 20 April 2019).
  49. Pun, C.S.J.; So, C.W. Night-sky brightness monitoring in Hong Kong. Environ. Monit. Assess. 2012, 184, 2537–2557. [Google Scholar] [CrossRef]
  50. Espey, B.; McCauley, J. Initial Irish light pollution measurements and a new sky quality meter-based data logger. Light. Res. Technol. 2014, 46, 67–77. [Google Scholar] [CrossRef]
  51. Lima, R.C.; da Cunha, J.P.; Peixinho, N. Light Pollution: Assessment of Sky Glow on two Dark Sky Regions of Portugal. J. Toxicol. Environ. Health Part A 2016, 79, 307–319. [Google Scholar] [CrossRef]
  52. Zamorano, J.; de Miguel, A.S.; Nievas, M.; Tapia, C.; Ocaña, F.; Izquierdo, J.; Gallego, J.; Pascual, S.; Colomer, F.; Bará, S.; et al. Light Pollution Spanish REECL SQM Network. XXIX IAU FM 21: Mitigating Threats of Light Pollution & Radio Frequency Interference, Honolulu (Hawaii) 3-14/8/2015. Available online: https://www.noao.edu/education/files/Zamorano_IAU2015_REECL-SQM.pdf (accessed on 11 March 2019).
  53. MeteoGalicia. Brillo do ceo nocturno. Available online: https://www.meteogalicia.gal/Caire/brillodoceo.action (accessed on 20 April 2019).
  54. Den Outer, P.; Lolkema, D.; Haaima, M.; van der Hoff, R.; Spoelstra, H.; Schmidt, W. Stability of the Nine Sky Quality Meters in the Dutch Night Sky Brightness Monitoring Network. Sensors 2015, 15, 9466–9480. [Google Scholar] [CrossRef]
  55. Duriscoe, D.M.; Anderson, S.J.; Luginbuhl, C.B.; and Baugh, K.E. A simplified model of all-sky artificial sky glow derived from VIIRS Day/Night band data. J. Quant. Spectrosc. Radiat. Transf. 2018, 21, 133–145. [Google Scholar] [CrossRef]
  56. Sánchez de Miguel, A.; Aubé, M.; Zamorano, J.; Kocifaj, M.; Roby, J.; Tapia, C. Sky Quality Meter measurements in a colour-changing world. Mon. Not. R. Astron. Soc. 2017, 467, 2966–2979. [Google Scholar] [CrossRef]
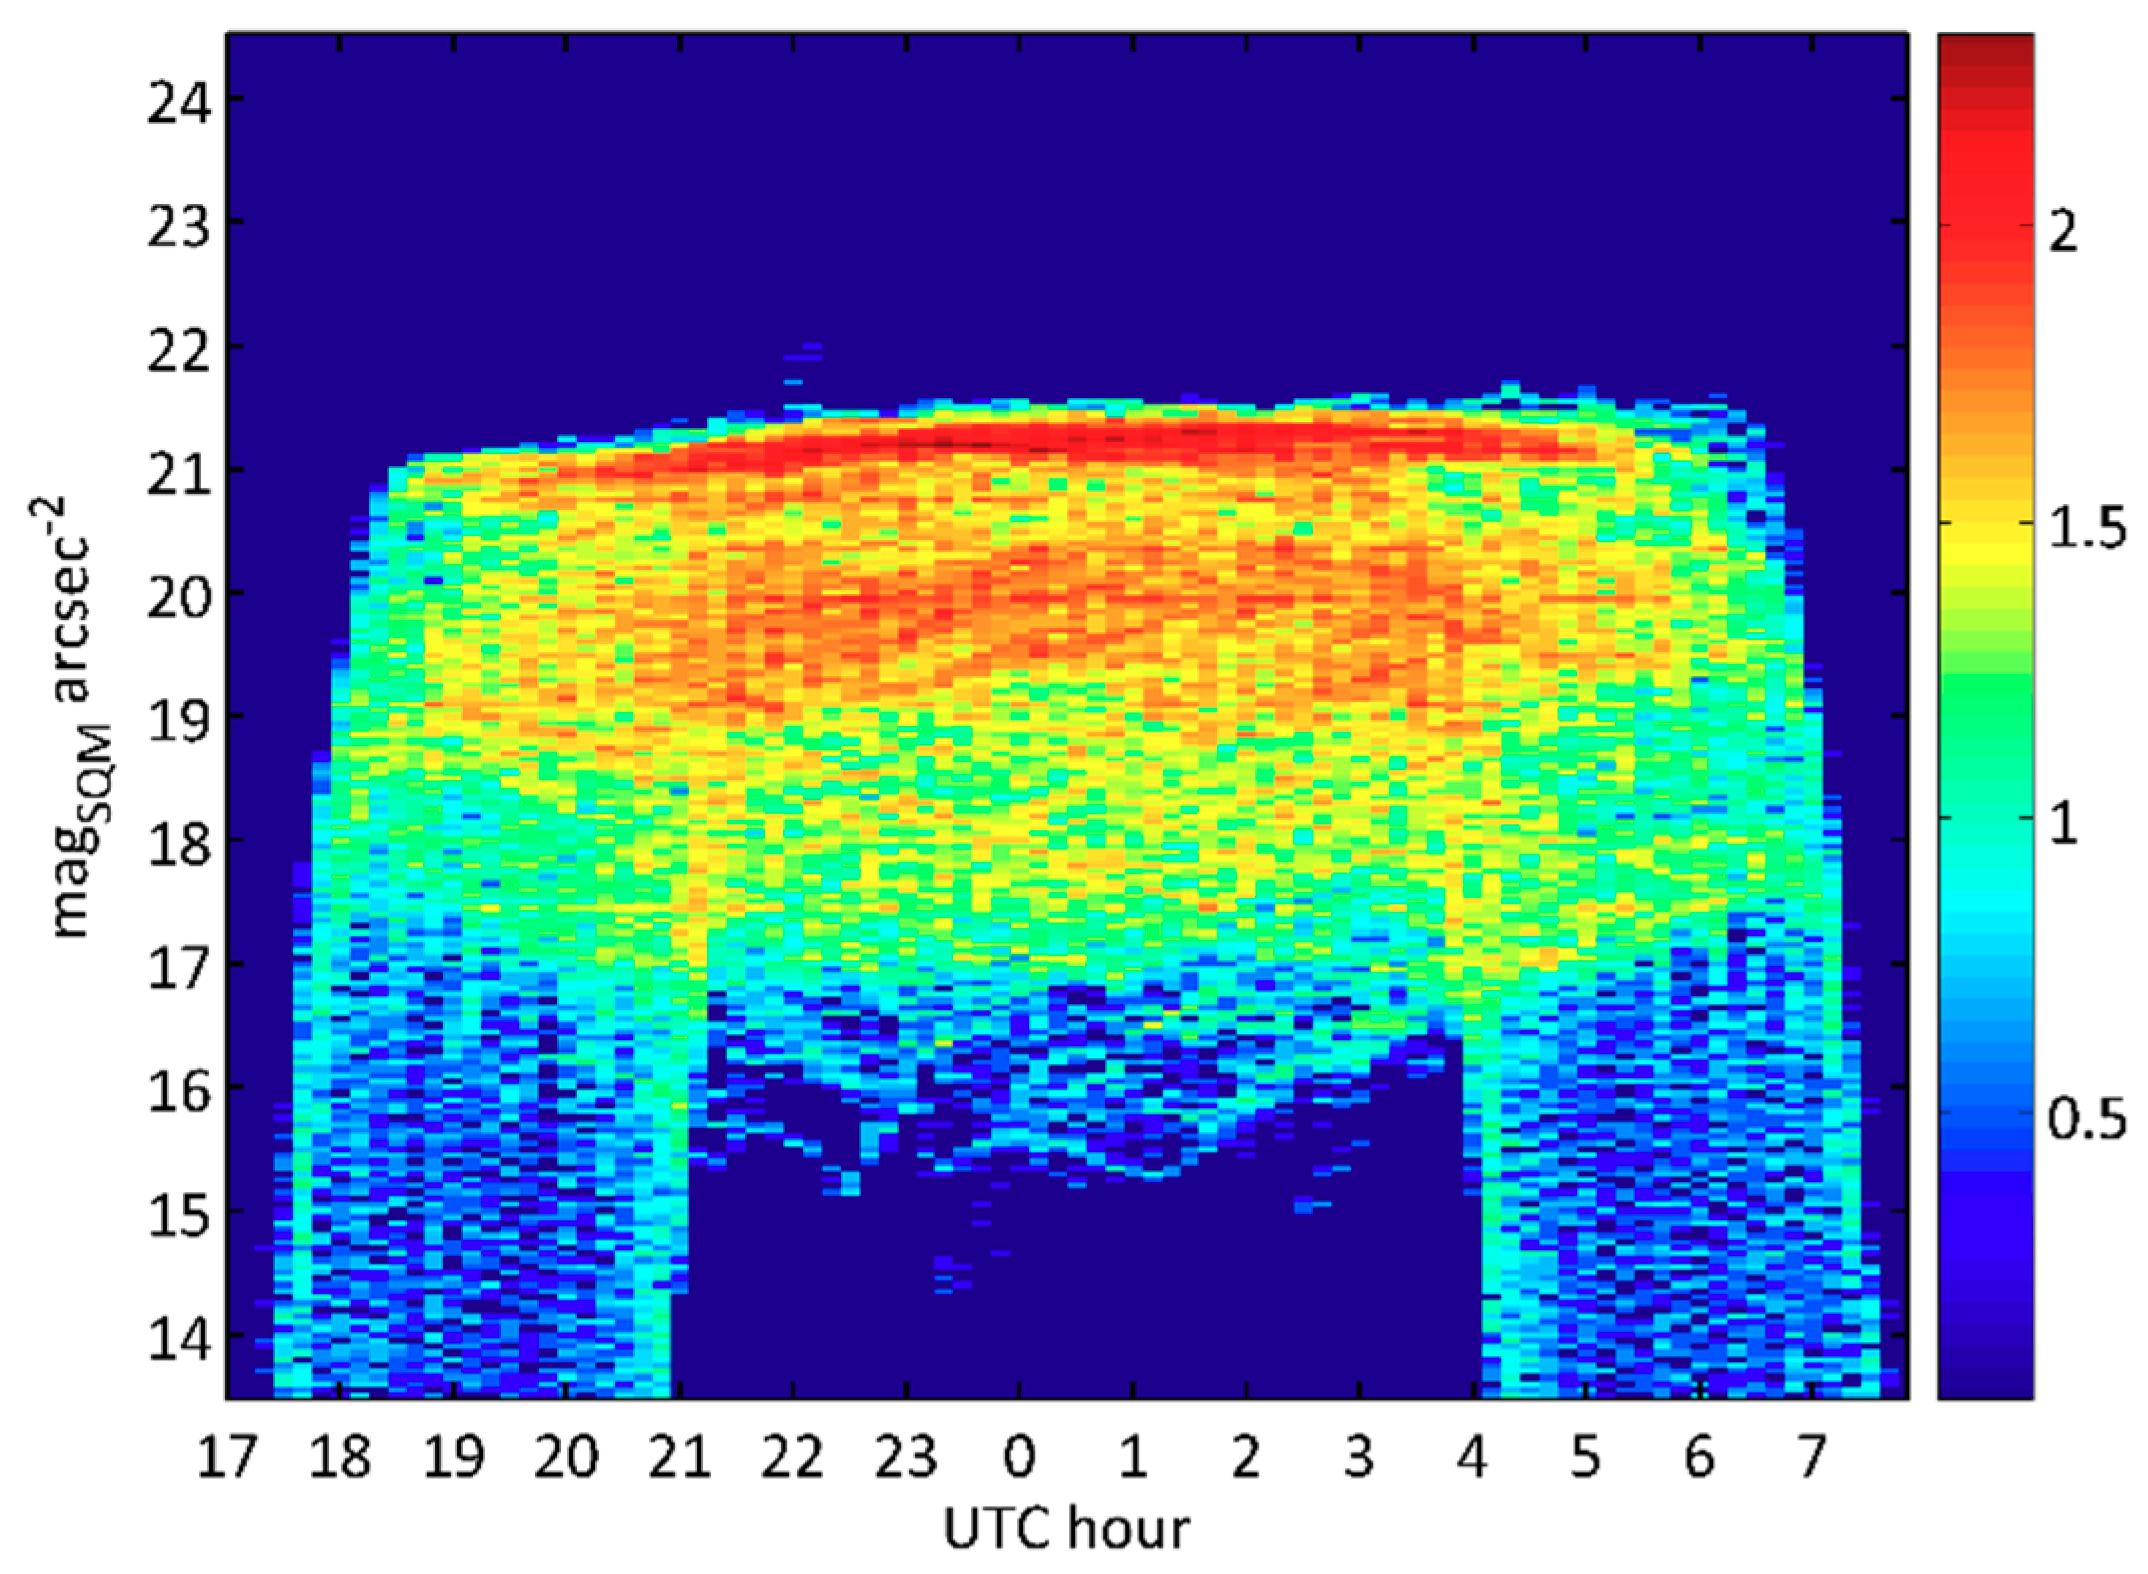
Figure 1. Night sky brightness (NSB) densitogram of the MeteoGalicia weather station of Paramos, corresponding to the year 2018. Horizontal axis: daily UTC time, with 10-min bin resolution. Vertical axis: zenithal NSB, with 0.05-magSQM/arcsec2 resolution bins. Colors indicate the number of values recorded throughout the year in each time-magnitude bin, in base 10 log scale.
Sustainability 11 03070 g001
Figure 2. Integrating the yearly NSB densitogram along the time axis in which the NSB histogram is obtained. A: twilight signal; B: moon within the field-of-view of the detector; C: scattered moonlight; D: cloud reflections; E: atmospheric scattering of artificial light in clear and moonless nights. Note in E the progressive darkening of the sky as the artificial light sources are switched off along the night.
Sustainability 11 03070 g002
Figure 3. NSB histograms for the MeteoGalicia weather station of Paramos, year 2018. (Blue) full dataset; (Red) values recorded in No-Sun No-Moon conditions (NSNM, sun below −18°, and moon below −5°). Note that the NSNM histogram is basically bimodal, with a narrow peak of darker values corresponding to the NSB recorded in clear and moonless nights, and a broader peak of brighter values due to cloud reflections (see also [38]). Paramos is located in a transition region between periurban areas and natural dark sites and although it is a relatively dark place, its zenithal NSB in overcast conditions is significantly increased by the reflections of artificial light at the base of the clouds.
Sustainability 11 03070 g003
Figure 4. (Left) The upper tertile region of the NSNM histogram. (Right) The full width at half-maximum (FWHM) region of the NSNM aerosol scattering peak. Based on the values recorded at the Paramos NSB measuring station during year 2018.
Sustainability 11 03070 g004
Figure 5. Annual histograms (all measurements, and NSNM subset) of the NSB data recorded at the MeteoGalicia station in Paramos, during the period 2015–2018.
Sustainability 11 03070 g005
Figure 6. The NSNM histograms (year 2015) corresponding to the GNSBMN stations of Santiago de Compostela (urban), Guísamo (periurban), Illas Cíes (transition), and Labrada (rural and mountain). The all-data NSB histograms for the same stations and year can be found in Figure 3 of [20].
Sustainability 11 03070 g006
Figure 7. (Top) NSB mFWHM evolution 2015–2018 in the 14 SQM detectors of the GNSBMN. (Bottom) Evolution of mFWHM relative to its initial values in 2015. The data of O Cebreiro (steep descending line in the left of the bottom figure, corresponding to a sudden drop of almost 0.9 magSQM/arcsec2 in 2016) are not included in order to facilitate the visualization of the remaining stations. Blue circles correspond to stations with net sky darkening, and red squares to stations with net sky brightening. All values are in magSQM/arcsec2. For detailed numerical data, see Table 1.
Sustainability 11 03070 g007
Table 1. Zenithal night sky brightness evolution 2015–2018 (mFWHM, magSQM/arcsec2).
Station20152016201720182018–2015 1Per Year
Urban centers
Santiago de Compostela18.9718.9418.9118.94−0.04−0.012
Vigo (Harbor)18.4118.6018.6218.680.270.090
Periurban sites
Guísamo19.7319.9219.9520.020.300.099
Areeiro19.6519.7619.7419.840.190.064
Transition regions
Illas Cíes20.8320.9721.0121.060.220.075
Illa de Ons (*)20.7420.8520.8320.57−0.17−0.056
Illa de Sálvora21.1121.3621.4621.470.360.119
Paramos20.9421.1421.1421.210.280.092
Rural and mountain sites
Labrada21.1421.2421.2421.240.100.034
Fontaneira21.3321.4921.5121.670.350.115
O Cebreiro21.3820.5520.5620.52−0.85−0.284
Lardeira21.3621.3521.4021.510.150.050
Xares21.4021.6321.7721.870.470.157
Cabeza de Manzaneda21.5521.7621.7721.850.300.101
1 All values p < 0.001, except for Santiago de Compostela (p < 0.25). (*) Illa de Ons detector was replaced in 2018.