1. Introduction
A common revenue-generating strategy for protected areas is charging a fee for admission to the site. These entrance fees serve a variety of purposes, including offsetting the costs of visitation, rationing visitor numbers at popular or fragile sites, or providing general funding for the costs of site maintenance [
1,
2,
3,
4,
5,
6,
7]. Unfortunately, many other protected areas, particularly in mid- and lower-income countries, set fees below the cost of providing the necessary infrastructure for tourism, despite a lack of consistent alternative funding sources. This may be done to encourage tourism, through fear of competition from other sites or countries, or a lack of information about what visitors would actually be willing to pay to visit the site [
1,
6,
8,
9,
10,
11,
12].
Mexican protected areas face many of these same challenges, with declining funding allocations from the federal government and entrance fee revenues unable to make up the difference [
13,
14,
15,
16,
17,
18]. In 2011, the World Bank estimated that Mexico would have to increase conservation funding by at least 50% to meet basic current needs, and over 100% to meet optimal funding needs; however, under the Peña Nieto administration, there were substantial cuts in funding for conservation agencies [
15,
16,
17,
18]. Former heads of National Commission of Natural Protected Areas (CONANP) estimate that the agency needs to approximately double its current labor force in order to adequately fulfill its conservation mission [
18]. The National Institute of Archaeology and History (INAH), which manages Mexico’s cultural heritage sites, has also experienced degradation at sites it manages due to funding problems [
19,
20,
21]. However, with the exception of Chichén Itza, no Mexican protected area charges visitors more than US
$10 for entry, and almost all charge less than US
$4. This is the case even for the many other world-class protected areas in Mexico’s south-east, within reach of the millions of tourists visiting Cancun and the Riviera Maya [
22,
23,
24,
25].
It can be challenging to set visitor entrance fees at an appropriate level. Different protected areas can have widely-varied site amenities and visitor profiles, and fee levels appropriate at one site can be inappropriate at others. Fees can be too high, depleting visitor numbers, or too low, failing to capture potential revenue [
1,
2,
6,
8,
26]. Through stated preference (SP) surveys, the maximum price that visitors would be willing to pay for entry can be estimated, but it can be inaccurate to simply apply the findings from one protected area to others, even within the same country or region. For this reason, a survey of a number of different protected sites within one country or region, using identical methodology, would better identify how visitor willingness to pay varies between sites and what a realistic fee policy might look like. In addition, these stated preference surveys can estimate potential changes in visitation numbers if entrance fees were to be changed. While this type of methodologically consistent, multi-site study is rare, there are a few previous examples from Costa Rica, South Africa, and Tanzania [
26,
27,
28].
This study aims to add to this small body of research, with 877 respondents surveyed at five south-eastern Mexican protected areas, using a double-bounded dichotomous choice contingent valuation survey, combined with extensive questions on visitor characteristics. The use of identical survey methodology at five different sites allows for valid and systematic comparisons between site results. The collection of data on visitor attributes permits examination of the impact of demographic, attitudinal, and logistical characteristics on visitor willingness to pay, and to what extent different types of visitors are drawn to different sites. All of these have important implications for protected area pricing policy, including the relative price elasticity of visitor demand, the ability of multi-site systems to set relatively uniform prices, and how different types of visitors may respond to entrance fee increases.
2. Sites Surveyed
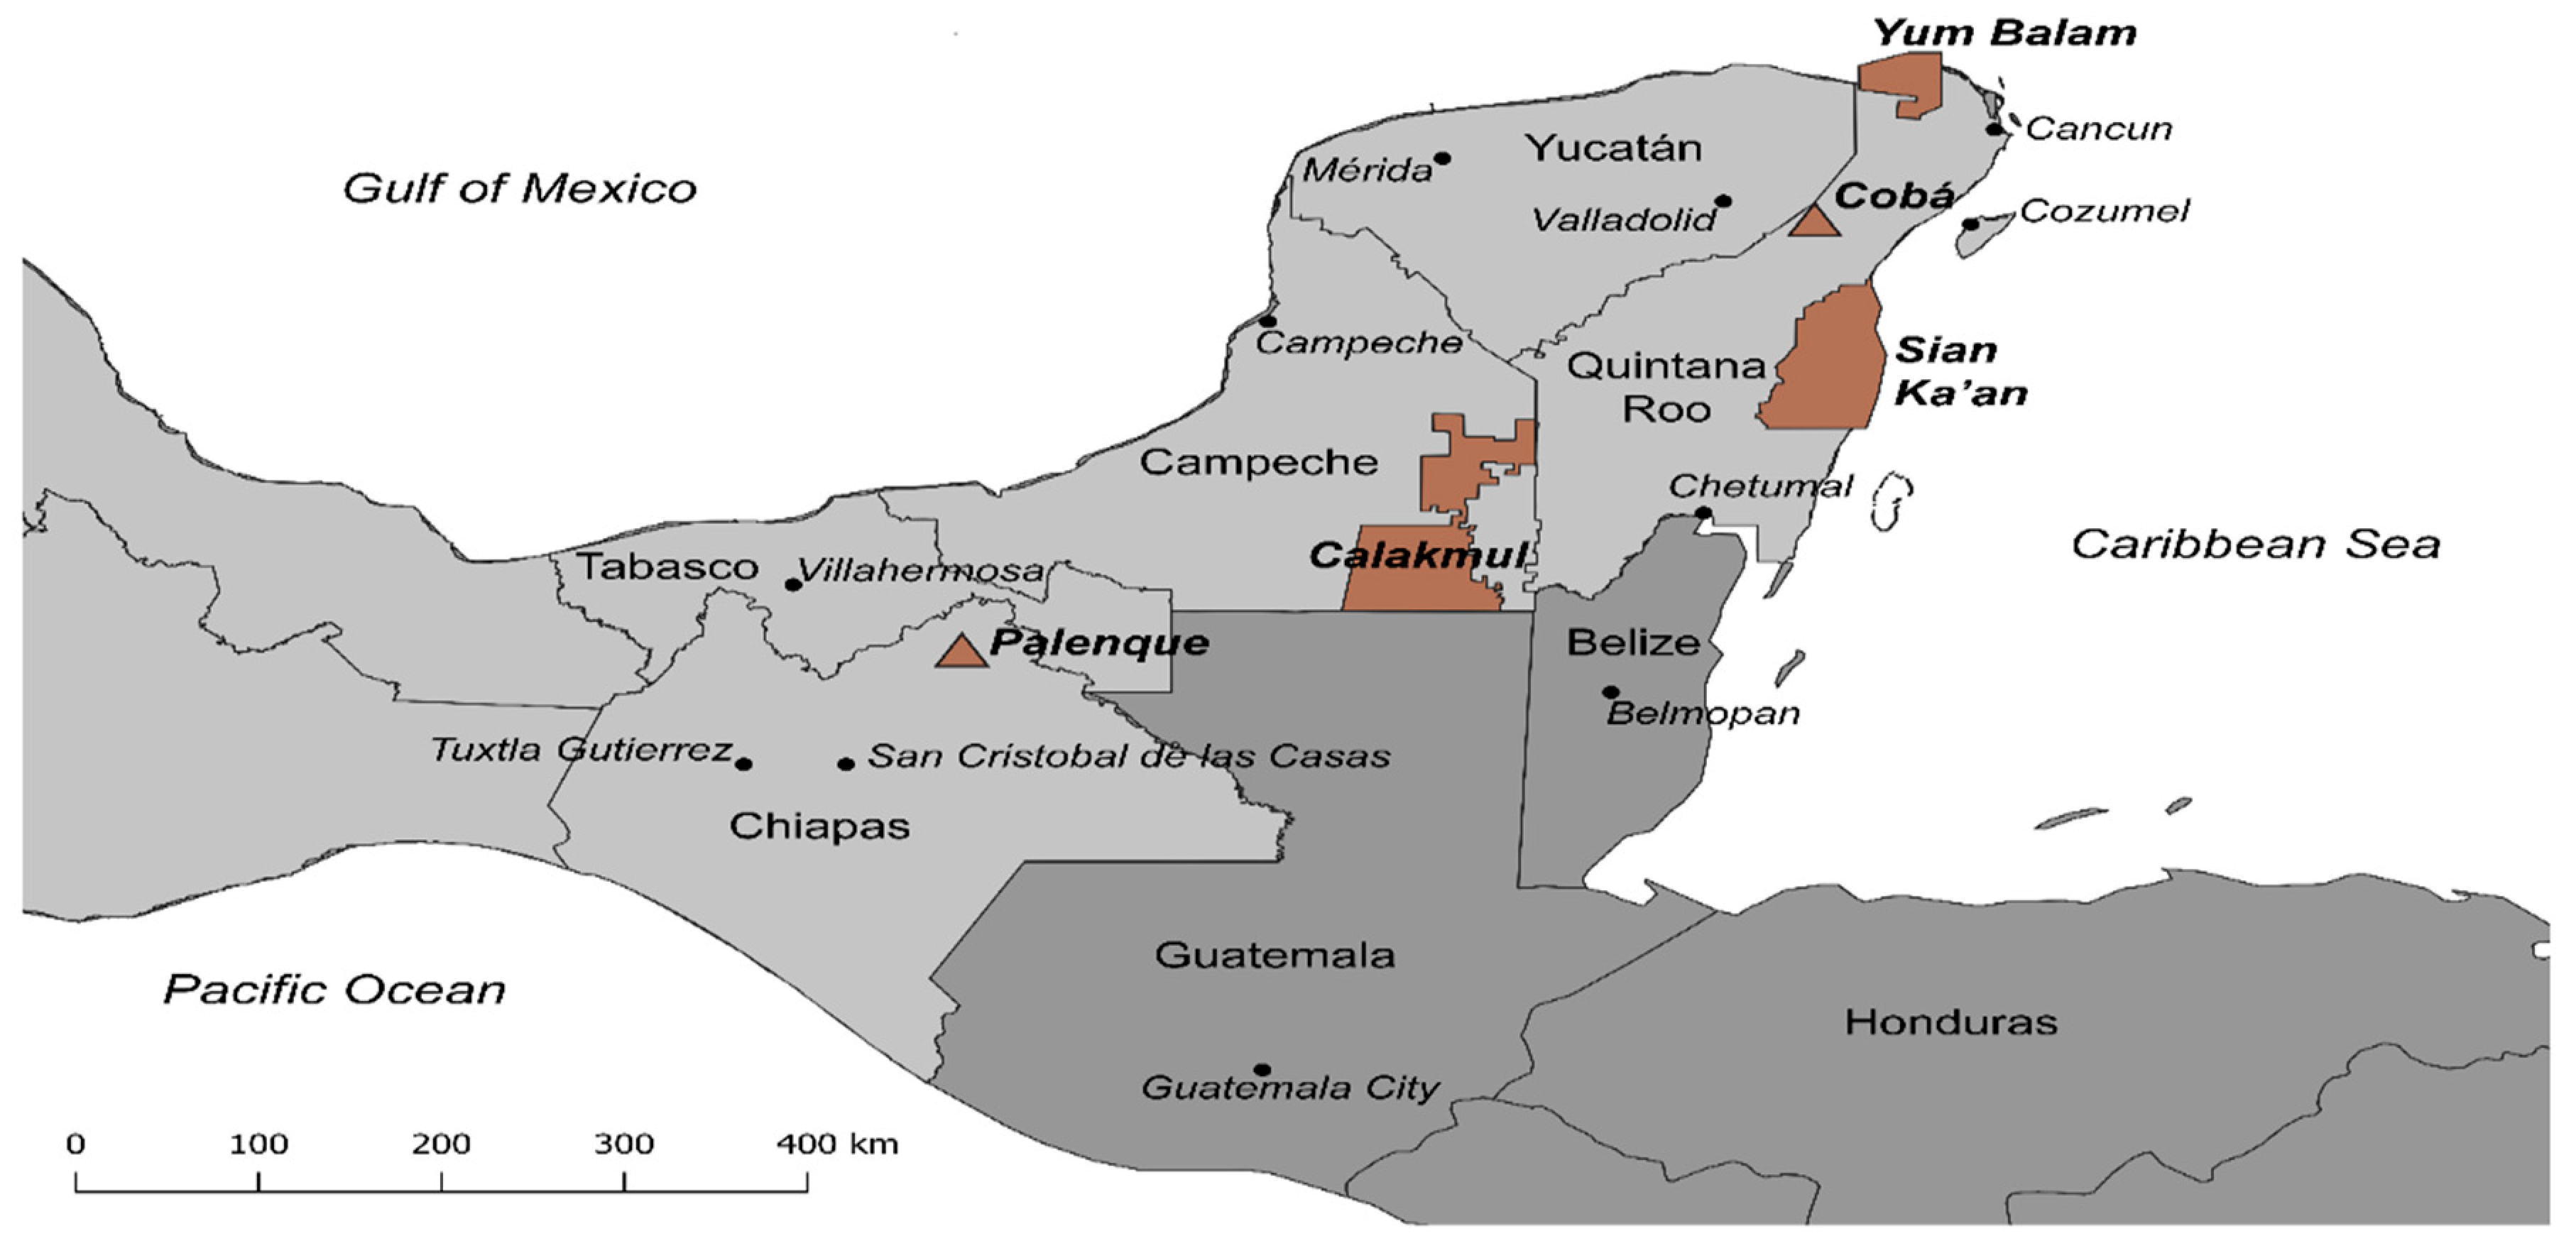
The areas of focus for this study are five protected areas located in south-eastern Mexico, in the Yucatan Peninsula states of Campeche and Quintana Roo and the adjacent state of Chiapas. South-eastern Mexico is the tourism hotspot of the country, with around half of Mexico’s roughly 40 million international tourists visiting the Yucatan and Chiapas, in addition to significant numbers of domestic tourists [
22,
23,
24,
25]. The primary attractions for tourists are the beaches and accompanying resorts lining the Caribbean coast from Cancun down the Riviera Maya to Tulum, but tourists are also drawn to the region’s cultural and natural sites. The location of the five protected sites examined in this study can be seen in
Figure 1.
Calakmul Biosphere Reserve, with the adjacent Maya Biosphere Reserve in Guatemala, contains the largest contiguous tract of rainforest in North America, as well as a number of important Maya sites, which has led to it being designated a UNESCO World Heritage site [
20,
29,
30]. Another two of the protected areas are also World Heritage Sites: Palenque National Park, one of the largest and best-preserved Maya civic-ceremonial sites and the Sian Ka’an Biosphere Reserve, which is made up of sweeping wetlands and mangrove forests, as well as a significant part of the Mesoamerica Barrier Reef [
20,
21,
29,
31]. Cobá Archaeological Zone is another important Maya site, one of the closest large sites to the tourist areas of the Riviera Maya and Cancun [
29]. Yum Balam Nature Reserve is a large wetland and mangrove forest and extremely important stopping point for migratory birds. In addition, its offshore waters include the world’s most important summertime breeding ground for whale sharks [
32,
33,
34].
As seen in
Table 1, the protected areas range in size from Calakmul’s massive 7231 km
2 (2792 mi
2) to the small area surrounding Palenque’s archaeological zone 17.72 km
2 (6.84 mi
2). Visitor numbers vary greatly between the sites, with Palenque attracting over 900,000 visitors each year, and Cobá over 700,000, while Calakmul gets only around 35,000. Ease of access greatly varies between the sites, with Calakmul located quite far from the main tourist centers, while Cobá and Yum Balam are easily reached from the Riviera Maya. Palenque, located in the jungles of lowland Chiapas, is also quite removed from the major coastal tourist centers, but a well-developed infrastructure of buses and shuttles exists to take visitors to the site from popular colonial cities such as San Cristobal de Las Casas.
The sites are managed jointly by a variety of Mexican federal, state, and local agencies, often with the input of local communities, which leads to a complicated and opaque entrance pricing structure. At the time of writing (2018), visitor entrance fees for the sites ranged from a low of MX$30 (US$1.60) at Yum Balam to a high of MX$105 (US$5.60) at Calakmul, with Sian Ka’an, Cobá, and Palenque charging intermediate amounts of MX$45 (US$2.40), MX$64 (US$3.41), and MX$84 (US$4.48), respectively.
3. Methodology
In order to assess the feasibility of raising revenue through increasing the price of entry, contingent valuation (CVM) surveys were administered to visitors at each of the protected sites. Contingent valuation is a stated-preference form of non-market valuation designed to measure how much individuals would maximally pay in scenarios where normal market forces are not operating or are operating sub-optimally. Continent valuation surveys ask respondents to state whether they are willing to pay (WTP) a particular price for a marginal change in the quantity or quality of an environmental good or amenity [
35,
36,
37].
An in-person questionnaire survey was conducted between December of 2016 and August of 2018 of visitors to Calakmul, Cobá, Palenque, Sian Ka’an, and Yum Balam. Before the full surveys were given, several weeks of pilot testing was undertaken in October and November of 2016, which permitted the survey questionnaire to be amended and refined. Surveys were conducted for a few days at a time during periods of peak touristic activity in south-eastern Mexico: between Christmas and the New Year, American Spring Break in March, Easter Week, and the premier international tourism season between mid-June and mid-August. Visitors to the sites were surveyed at the main gateways to Calakmul, Cobá and Palenque, and Sian Ka’an and the ferry docks on Isla Holbox and in Chiquilá for Yum Balam. The sample procedure consisted of date-based cluster sampling, with every group of visitors visiting the given protected area through the given entrance on the date of surveying being asked to complete the survey. When a site had sufficiently high visitor numbers, such as at Cobá or Palenque, this was changed to every third or fourth group of visitors, until a sufficient quota of visitors had been successfully surveyed. Each protected area was visited multiple times, at the busiest visitation periods of the year, and thus had multiple survey dates. The expected error for this type of sampling is expected to be relatively small, as the majority of the variation is found within the cluster, that is, between different people visiting the site on a given day, rather than between potential clusters, that is, people visiting on the survey day collectively compared to people visiting on different days collectively [
38,
39]. The only limitation on a respondent’s participation was a requirement to be at least 18 years old, have at least a basic proficiency in English or Spanish, and be a resident of Mexico, the United States, Canada, or the European Union. These limitations were designed to ensure that respondents could ask questions of the interviewer, and to ensure that income data was sufficiently comparable. The included countries represent over 90% of all tourists in south-eastern Mexico, so the impact of these restrictions on subsequent results is likely to be minimal [
40]. Respondents were exclusively interviewed at the beginning of their visit to the site, to remove the impact of their visit experience from their willingness to pay estimate. This also represents a more realistic approximation of the purchasing-decision experience of most visitors, as the studied sites tend to attract one-time visits. A copy of the survey questionnaire can be seen in
Supplementary Materials.
For each group of visitors, one individual per group was asked to complete the survey, which was offered in English or Spanish, along with an informed consent form. The survey was given face-to-face, giving respondents the opportunity to ask questions. Respondents were asked to answer a series of demographic questions, four questions on conservation, and a series of questions about their trip to the protected sites. Respondents were read a paragraph explaining briefly the funding issues affecting Mexican protected areas, using neutral language. Respondents were also reminded to consider their overall budget and other spending obligations, to increase the realism of subsequent bids.
Respondents were then asked upper and lower-bounded dichotomous-choice questions regarding their willingness to pay a particular price to enter the protected site, as shown in
Table 2.
The dichotomous choice bid mechanism, often referred to as a referendum bid mechanism, consists of stating a starting price to respondents, which they have the opportunity to accept or decline. Following Hanemann, (1984), Hanemann et al. (1991), Asafu-Adjaye and Tapsuwan (2008), and Baral et al. (2008), the probability
P(
A) of a respondent accepting price
p in a dichotomous choice bid question can been seen as:
where
G(
p;
θ) is a statistical distribution function with the parameter vector
θ [
41,
42,
43,
44]. In a double-bounded dichotomous choice bid format, there are four possible outcomes: a respondent accepts both the starting price and the higher subsequent price, a respondent accepts the starting price and rejects the higher subsequent price, the respondent rejects the starting price and accepts the lower subsequent price, or a respondent rejects both the starting price and the lower subsequent price. Following Hanemann et al. (1991), the probability
P(
AA) of a respondent accepting both the starting price
p and second price 2
p can be seen as:
the probability
P(
AR) of a respondent accepting the starting price
p and rejecting the second price 2
p can be seen as:
the probability
P(
RA) of a respondent rejecting the starting price
p and accepting the second price 1/2
p can be seen as:
and the probability
P(
RR) of a respondent rejecting both the starting price
p and the second price 1/2
p can be seen as:
where
G(
p;
θ) is a statistical distribution function with the parameter vector
θ [
42].
As this survey used a double-bounded variant of the dichotomous-choice methodology, respondents were first asked if they would be willing to pay a specified price p to enter the site; if they answered yes, they were then also asked if they would be willing to pay the price 2p to enter the site. If they were not willing to pay the price p, they were asked whether they would be willing to pay the price ½p to enter the site. If respondents indicated that they would be unwilling to pay price ½p, they were asked to state the primary reason they would be unwilling to pay, in order to identify protest bids. Five different versions of the survey instrument were distributed sequentially, offering varying starting prices p, with initial prices of US$6, US$8, US$10, US$12, and US$16, thus follow-up prices ranging from US$3 to US$32.
In terms of limitations in the study methodology, the two most important are limited data on the target population (visitors to the five sites) and the inherent biases associated with stated preference studies, and contingent valuation in particular. Unfortunately, no information is available about the demographic makeup of all visitors to the five protected sites. This makes it impossible to compare the demographics of the survey sample against the demographic of the overall pool of visitors, to ensure the representativeness of the sample. However, by using multi-date cluster samplings with a sample size of 877 respondents, with no observed pattern of non-response behavior, it seems likely that the survey sample offers a reasonable characterization of the visitor pool at the sites in question [
45,
46,
47].
Contingent valuation, as a methodology, also has some known weaknesses, particularly the hypothetical nature of payment and starting point biases, where respondents’ willingness to pay estimates are impacted by the price suggested by the interviewer. While willingness to pay questions are intrinsically hypothetical, the use of dichotomous-choice rather than open-ended questions better approximates real purchasing decisions, as does the use of site entrance fees as a payment mechanism [
36,
37,
39,
40,
41]. The pool of respondents for the surveys was drawn exclusively from site visitors, who were asked to estimate the value of a good that they had already demonstrated their willingness to purchase. This makes their task of estimating consumer surplus much more realistic than for an intangible good, reducing the impact of hypothetical bias on the respondents’ willingness to pay estimates. [
27,
36,
48,
49,
50].
The double-bounded choice format was chosen to increase the statistical efficiency of the resulting willingness to pay estimations, allowing sufficiently large samples for each site and survey instrument combination, given the 25 different potential combinations. While single-bounded dichotomous choice formats are somewhat more commonly employed in contingent valuation, the use of a double-bounded format does not violate incentive compatibility, provided the respondent is not aware that they will be asked a follow-up valuation question when the first valuation question is posed, a condition that this study meets [
36,
37,
39,
40]. The double-bounded bid mechanism also helps to mitigate the impact of starting point bias, as a subsequent higher price choice mitigates against a starting choice that was too low, while a subsequent lower price choice mitigates against an excessively high starting choice [
42].
4. Results
Between December of 2016 and August of 2018, 877 visitors were surveyed at the five sites under consideration. Approximately equal samples were interviewed at each site, ranging from 170 visitors at Yum Balam to 179 at Palenque. As there is considerable variation in visitor numbers between the sites (as seen in
Table 1) and relatively uniform sample sizes, all aggregated willingness to pay estimates and regression variables were weighted to reflect the relative distribution of visitors.
4.1. Respondent Demographics
The 877 respondents were asked a variety of demographic questions, the aggregation of which can be seen in
Table 3.
Just over 64% of the respondents were international visitors, and just over 55% were male. Cobá and Yum Balam had the highest percentages of foreign visitors, while Palenque had only a slight majority of foreign visitors. The gender ratio for all of the sites was quite similar, with only Palenque standing out for having near parity in male and female respondents.
A slim majority (50.1%) of visitors were between the ages of 30 and 49, with smaller numbers under 30 and between 50 and 59, and few visitors over the age of 60. There was some variation in the age composition at the different sites, with Cobá and Sian Ka’an attracting considerably older visitors than the other three parks. The difficulty in getting to Palenque and Calakmul contributes to their younger demographics, as does their focus on adventure tourism.
Due to the varied origins of the respondents, the household income question was adjusted based on the respondent’s country of residence. US and Canadian residents were asked their annual household income in US or Canadian dollars, respectively, UK residents in pounds sterling, and EU respondents in euros, with the respective figures given at approximate 2017 exchange rates. The income cutoffs for each category were based on Pew Research Center’s estimation of the annual household income qualifying an individual with an average sized family to be upper, upper-middle, lower-middle, or lower class in the United States, rounded for ease of questioning [
51]. Mexican respondents were asked their annual household income in Mexican pesos, but the categories were based on approximate 2017 exchange rates reduced to 66% of their starting value, to reflect the 2017 OECD estimation of purchasing power equivalence [
52]. This was done to ensure that the income categories better reflected relative socio-economic status.
An approximately equal number of respondents were found in the upper- and upper-middle-income categories, with fewer in the lower-middle category, and less than 10% in the lower-income category. The variation in the respondents’ incomes between the sites was relatively low, with the highest income samples found at Palenque and Sian Ka’an, reflecting in part the expensive tours offered to those sites, and the lowest income sample found at Yum Balam, with its backpacker-friendly appeal.
Respondents were also sorted into three categories based on their educational qualifications, with the lower category including those with no post-secondary education, the middle category those with some post-secondary education and non-postgraduate tertiary degrees, including Bachelor’s degrees and Licenciatura, and the upper category including all post-graduate education levels, including Master’s, Doctorate, and higher professional degrees. Over half of the respondents indicated that they had an education level corresponding to the middle category, with somewhat more respondents belonging in the upper category than the lower. Calakmul and Palenque stood out for the higher education level of the respondents surveyed.
4.2. Respondent Attitudes and Logistics
Survey respondents were also asked a variety of attitudinal and logistical questions, as seen in
Table 4.
Respondents were asked to state their primary motivation for travel to Mexico (or to south-eastern Mexico in the case of Mexican respondents) from four categories: resort activities (all-inclusive dining, luxurious amenities, rest and relaxation at one’s resort, etc.), beach tourism (relaxing on a beach, swimming, sailing, aquatic activities, etc.), cultural tourism (archaeological sites, experiencing traditional culture, local dining, etc.), or ecological tourism (bird-watching, hiking, exploring cenotes, etc.). Ecological tourism and beach tourism were the most popular, with around a third of respondents each, followed by cultural tourism and then resort activities. There was a wide variation between sites, with respondents at Calakmul and Palenque overwhelmingly choosing ecological tourism or cultural tourism, while beach tourism was the most popular option for visitors at Cobá, Sian Ka’an, and Yum Balam.
Package tourists made up a majority of the respondent sample, for an overall total of about 60% of respondents. At four of the sites (Calakmul, Cobá, Palenque, and Sian Ka’an), visitors on organized tours are usually not responsible for paying the site entry fee separately, as it is generally included in the tour price, while at Yum Balam, the norm is to pay the full entrance fee separately. The highest percentage of respondents on organized tours was found at Cobá and Sian Ka’an. On the other hand, less than half the sample at Palenque and Yum Balam had arrived at the site on an organized tour.
Respondents were also asked to estimate how much their visit to the site cost, including transportation, organized tour (if applicable), extra lodgings if needed, and any other miscellaneous expenses. The sample was almost evenly split between those paying more or less than US$100, with the largest number (30%) spending less than US$50, and only 10.9% spending more than US$150. Visit costs were highest at Palenque and Calakmul, which are much farther removed from tourist centers than the other sites. On the other hand, respondents at Cobá spent the least money, and generally visited the site on a tour taking less than two hours to arrive, and did not spend the night near the site.
In order to gauge their level of investment in visiting the site, respondents were asked whether they made the decision to visit the site before their arrival in Mexico (or south-eastern Mexico for Mexican respondents) or after their arrival. A majority (57%) of respondents made their decision to visit the sites after their arrival in Mexico, a choice that was most common at Cobá, Sian Ka’an, and Yum Balam. At Calakmul and Palenque on the other hand, most respondents made their decision before arrival in Mexico, in keeping with the greater prominence of those sites and the amount of investment involved in visiting.
Finally, respondents were asked to answer four questions concerning conservation and preservation: (a) whether conservation of sites of natural and cultural significance should be a priority regardless of cost; (b) whether conservation of sites of natural and cultural significance should sometimes take precedence over economic growth and job creation, (c) whether or not they believed their government and other governments were devoting enough resources towards conservation and preservation in their own countries and (d) in emerging and developing countries. As respondents’ answers to each of the conservation questions showed high internal consistency with their responses to the other conservation questions, their answers to the four questions were averaged, giving scores ranging from 1 to 5. Overall, a majority of respondents (60%) scored a 4 or above, indicating strong support for using resources towards conservation and preservation. There was not a great deal of variation between the five sites, with the lowest score of 3.74 at Yum Balam and the highest of 4.22 at Calakmul.
4.3. Visitor Willingness to Pay
The 1754 responses to the double-bounded dichotomous choice scenario (877 starting proposed entrances fees and 877 subsequent proposed entrances fees) were calculated for each site separately, and then aggregated together after adjusting for the differences in visitor numbers between sites. Using Microsoft Excel and StataIC 15, a demand curve was then modeled from the respondents’ responses to the willingness to pay questions on the survey questionnaire at each of the prices asked in the survey (US
$3, 4, 5, 6, 8, 10, 12, 16, 32), with a model fitted to the curve, using the least squares method, by the function
v = 132.32e
−0.071p, where
v is the percentage of current visitors who are willing to pay price
p to enter. This equation represents the best-fit function for the observed data for the impact of entrance fee price on aggregate visitor demand at variable entrance fee prices. A similar best fit function
v =
ae
−bp, where
v is the percentage of current visitors who are willing to pay price
p to enter, and
a and
b are constants, was subsequently fitted for each protected site, allowing the estimation of the mean and median maximum amounts which the respondents would be willing to pay to enter each protected site. Given the visitation numbers at each site, the sample sizes of the surveys result in a confidence interval of approximately ±7.5% for estimations at the individual sites, and ±3.3% for aggregate estimations, at a 95% confidence level. These visitor demand models can be seen in
Figure 2.
Using the best-fit function
v = 132.32e
−0.071p, it was estimated that the aggregate mean maximum willingness to pay across all sites was
$18.02 and the aggregate median maximum willingness to pay was US
$13.71. Median maximum willingness to pay represents the price
p at which visitor percentage
v is equal to 50%. Following Jakobsson and Dragun (1996), the mean was calculated by the integration of the demand function, having been truncated between the prices offered to respondents [
36]. Site-specific best-fit models were then used to estimate mean and median maximum willingness to pay for each site, which ranged from a mean of US
$15.70 at Yum Balam to US
$25.83 at Calakmul, and from a median of US
$ 11.38 at Yum Balam to US
$18.98 at Calakmul, as can be seen in
Table 5.
These results outline the potential for raising visitor entrance fees with relation to the predicted impact on visitation numbers, as can further be see in in the aggregate and site-specific bid curves in
Figure 2. Entrance fee prices could be raised 44% at Palenque, 71% at Sian Ka’an, and 46% at Yum Balam with only a 5% drop-off in visitor numbers. At Calakmul and Coba, on the other hand, prices could be raised less than 1% and 8%, respectively, to maintain 95% of current visitor numbers. If the protected sites were willing to accept a 25% reduction in visitor numbers, prices could be raised substantially higher, with increases of 88% at Calakmul, 100% at Coba, 115% at Palenque, 203% at Sian Ka’an, and 254% at Yum Balam.
Thus, while the willingness to pay estimates at Calakmul show the highest ceiling, those from Sian Ka’an and Yum Balam show the highest proportional growth possibility. At Sian Ka’an and Yum Balam, fees would have to be raised over 3 times their current levels in order to experience a 25% decrease in visitor numbers. Despite having current entrance fees considerably below the other sites, their willingness to pay estimates are broadly in line with those at Cobá and Palenque, although somewhat below Calakmul. Approximately 13% of respondents were willing to pay the absolute highest bid amount of $32, including 30% of those visiting Calakmul.
These results suggest that visitor demand is relatively price inelastic (change in demand is less than increase in price), at least within the price ranges estimated in the survey.
4.4. Revenue Maximization
Using the same function
v = 132.32e
−0.071p, aggregated across the surveyed sites, and weighted for the differences in visitor numbers, revenue would be maximized at an entrance fee of US
$13.59. The site-specific revenue-maximizing fees ranged from Calakmul, with a revenue-maximizing fee of US
$20.83 to Cobá, with US
$13.33, as can be seen in
Table 6.
The overall maximum potential revenue as a percentage of current revenue, based on zero marginal cost per additional visitor, stands at 177% of current revenue, and ranges from a low of 170% of current revenue at Calakmul to a high of 363% of current revenue at Yum Balam. If some marginal cost is assumed per each additional visitor, the corresponding revenue maximizing fee rises accordingly. While Calakmul stands out for its high potential revenue maximizing fee, it is Sian Ka’an and Yum Balam that stand to generate the proportionally most additional revenue with fee increases. However, aiming for revenue maximization may be suboptimal, particularly when revenue maximizing fees would represent such a large increase in current fee levels, given the knock-on effects on related tourist industries [
6,
10,
11].
4.5. Impact of Respondent Characteristics on Willingness to Pay
With respondents’ answers to both the willingness to pay questions and those categorizing demographic, attitudinal, and logistical characteristics, it is possible to analyze how those characteristics impact maximum willingness to pay estimates. Respondents’ characteristics, collected via the survey questionnaire, were coded to facilitate analysis as dummy or scalar variables, as seen in
Table 7, along with mean value and standard error for each of the characteristics based on the coding system, weighted for the differences in visitor numbers between sites.
Age, income, and education information was taken by respondents in the form of categorical choices, rather than their numerical age, income, or years of education. This choice reflected the results of pilot testing, which found respondents more comfortable offering this information within relatively broad categories, rather than providing specifics. Given the ordinal nature of these responses, age, income and education were broken down into dummy variables for statistical analysis. The baseline for each variable was chosen as the most common response, which for age was 40–49, for income was over US$90,000/year, and for education was some college/tertiary + bachelor’s degree or equivalent. The only non-dummy variables are Visit Cost, which was given by respondents in numerical form, and Con Attitude, which is scalar.
An interval-data model, or ordered probit model, as per Alberini (1995), was determined to be most appropriate given the double-bounded bid mechanism [
53]. An interval-data model was chosen over a bivariate model based on its greater efficiency and lower potential mean square error, provided respondents maintain the same true maximum willingness to pay estimate across questions [
44]. Given that the follow-up price is determined by the respondent’s response to the starting price, this is an integral element of the double-bounded survey design.
The bounds on respondents’ willingness to pay were expressed based on their answers to the two willingness to pay questions they were given, a yes–no response to starting price p, where p varied from US$6 to US$16 based on the survey variant, and then a yes–no response to either 2p or ½p.
Thus:
- (a)
If respondents answered yes–yes, then: WTP ≥ 2p
- (b)
If respondents answered yes–no, then: p ≤ WTP < 2p
- (c)
If respondents answered no–yes, then: ½p ≤ WTP < p
- (d)
If respondents answered no–no, then: WTP < ½p.
As shown by Hanemann et al. (1991) and Asafu-Adjaye and Tapsuwan (2008), the probability
P(
A) that a respondent will accept price p can be represented as:
where
is the intercept, and
β represents the coefficients of the price (
p), current entrance fee (
CF), demographic variables (
D), and logistical and attitudinal variables (
LA) [
42,
43]. The regression model was evaluated using demographic, attitudinal, and logistical variables, as can be seen in
Table 8.
Nationality, age, cost of visit, and participation in an organized tour were not found to have significant influence on a respondent’s willingness to pay increased entrance fees.
Household income in one of the two lowest categories (under US$40,000/year and US$45,000–65,000/year), on the other hand, had a statistically significant, negative impact on a particular respondent’s willingness to pay estimate, when compared to the baseline income category (more than US$90,000/year). The lowest education category (no college or tertiary education) also a had statistically significant, negative impact of willingness to pay, when compared to the baseline education level (some college/tertiary + bachelor’s degree or equivalent). Cultural or ecological tourism, as a motivation in traveling to Mexico, were also associated with significant, positive impacts on willingness to pay, as were positive attitudes towards conservation and, particularly, a decision to visit a site before arriving in Mexico.
The starting proposed entrance fee, determined by the survey variant a particular respondent was given, as well as the site at which the respondent was surveyed, to a lesser degree, were also found to be statistically significant in determining willingness to pay.
5. Discussion
Entrance fees for publicly administered cultural and natural attractions are often set at a price point below their market clearing rate. This may be the result of a deliberate policy decision to subsidize access or it may be the result of incorrect pricing information. When funding from other governmental or non-governmental entities consistently makes up for foregone revenue, this might be a reasonable tradeoff [
4,
5,
7,
8]. However, the fiscal difficulties impacting Mexican protected sites underscores the need to adopt more sustainable entrance fee policies [
13,
14,
15,
16,
17,
18].
The results of the surveys at the five protected sites suggest that visitor demand is relatively inelastic at and around current prices. Small across-the-board increases in entrance fees would raise revenue with minimal loss in visitor numbers. For instance, a US$1 increase in the entrance fees at each site would result in a 20% increase in revenue, at a 4.5% decrease in visitor numbers. Examining each of the sites, there is the largest potential for a relative increase in prices at Palenque, Sian Ka’an, and Yum Balam, where entrance fees could be raised 44%, 71%, and 46%, respectively, with an estimated 5% drop-off in visitation numbers. This pattern largely holds at a more substantial, 25% reduction in visitor numbers, with a potential price increase of 88% at Calakmul, 100% at Cobá, 115% at Palenque, 203% at Sian Ka’an, and 254% at Yum Balam. Thus, Sian Ka’an and Yum Balam, with the lowest current entrance fees, have the greatest potential to raise fees relative to their current level, with lower potential increases at Palenque, Cobá, and, particularly, Calakmul.
However, even at Calakmul, entrance fees would have to be raised 238% relative to the current price (US$18.98) in order to see visitor numbers drop off 50%, with Yum Balam requiring an entrance fee increase of up to 700% (US$11.38) for a similar decrease. Although considerable caution should be taken with fee increases of such a magnitude, the revenue maximizing fee levels estimated for the sites represented an increase of around 300% (Palenque) to 750% (Yum Balam) relative to the current entrance fees (US$13.33–US$20.83).
5.1. Study Results in a Comparative Context
The results of this survey are in line with plausible expectations based on other published contingent valuation surveys of visitors to protected areas, including other multi-site studies such as Chase (1998), Bruner et al. (2015), and Dikgang and Muchapondwa (2017), as can be seen in
Table 9 below [
26,
27,
28].
When comparing the five Mexican protected areas surveyed against other studied sites, the mean maximum willingness to pay is well within the bounds of protected sites with similar amenities and visitor profiles. Thus, it is unsurprising that visitors to Calakmul estimated a higher willingness to pay than those to the other Mexican sites, given their more comparable visitor profile with the Costa Rican parks and Eduardo Avaroa Reserve in Bolivia [
26,
55,
56].
Some of the Mexican sites surveyed in this study, particularly Sian Ka’an and Yum Balam, show quite high estimated visitor mean maximum willingness to pay when compared to their current entrance fees, 605% and 881% of current levels, respectively. While these are some of the higher potential increases examined, there are other sites with comparable or even higher comparative willingness to pay estimates, including Komodo National Park in Indonesia (1245%), Taman Negara National Park in Malaysia (1204%), and Eduardo Avaroa Reserve in Bolivia (818%), not to mention those sites that currently charge no entrance fee. Komodo National Park and Eduardo Avaroa Reserve, in particular, share many similarities with the Mexican sites surveyed in this study: they attract a relatively large number of foreign or wealthy domestic tourists, but have pricing levels commensurate with exclusively local or low-end domestic tourism, with entrance fees of US
$0.87 and US
$4, respectively [
48,
55]. Although Taman Negara National Park attracts predominately domestic Malaysian tourists, its entrance fee level is set at a low level for an upper-middle income country such as Malaysia [
68].
An important consideration in understanding why visitors are willing to pay more in entrance fees is how low such fees are compared to comparable touristic activities in their region. For instance, Xcaret, a privately-operated ecotourism park on the Riviera Maya which competes with Sian Ka’an and Cobá for resort visitors, charges US$100 for admission. The similar Xel-Ha park charges US$90 for entrance, while the popular Dos Ojos cenote charges US$130 to dive within it. Even compared to the actual prices paid by tourists to visit the surveyed sites on organized tours, the site entrance fee constitutes a small proportion of the total cost to the visitor. For example, at the time of writing (2018), the most popular tour from the Riviera Maya resorts to Cobá cost US$67, compared to a site entrance fee of US$3.41. This does not even factor in the high lodging costs at all-inclusive resorts, which average several hundred US dollars per person, per night.
5.2. Possible Pricing Strategies
A primary benefit in surveying visitors at a number of different sites with an identical methodology is the ability to directly compare the results. As Alpízar (2006) suggests, price-setting site management agencies will invariably have limited information about the specific elasticity of visitor demand at each site under their jurisdiction, making a quasi-uniform price policy very likely [
72]. Despite different amenities, visitor profiles, and current entrance fees, four of the sites (Cobá, Palenque, Sian Ka’an, and Yum Balam) showed relatively similar patterns in their visitors’ willingness to pay estimates, with Calakmul an outlier with higher current and potential entrance fee levels. This suggests that there is indeed the potential for a relatively uniform entrance fee policy across sites, despite the level of current fee differentiation. However, the potential revenue increases over current levels would be highest at those sites with the lowest current entrance fees.
One possible fee structure would be an across-the-board fee increase of around US$1–2. This would lead to a potential decrease in visitor numbers of 4.5–8%, while increasing revenue around 20–35%. An entrance fee increase of this magnitude would seek to minimize the potential impact of the fee increase on tourism-related businesses and related disruptions. If visitor demand remains steady or increases, fees could be adjusted upwards carefully.
Another possible fee structure would be a uniform entrance fee of around US$5–6, with a supplemental surcharge of around US$4 at Calakmul and US$2 at Palenque. This would result in a more substantial potential fall-off in visitor numbers (approximately 25% of current numbers) and a revenue increase of around 50%, based on the survey of park visitors. This would likely have a greater negative impact on tourism-related businesses. If visitor demand falls off by less than expected, fees could be maintained or even adjusted upwards carefully.
Another alternative fee structure would be a uniform entrance fee of around US$10, with a supplemental surcharge of US$8 at Calakmul and US$4 at Palenque. This would result in a much steeper drop in visitor numbers (approximately 45% of current numbers) and a revenue increase of around 75%, based on the survey of park visitors. This would come close to maximizing potential revenue for the sites themselves, but would likely have correspondingly detrimental negative impacts on tourism-related businesses, such as tour operators, hotels, and restaurants, as well as other tourist attractions near harder-to-reach sites such as Palenque. This is compounded by the increasing challenge of estimating the impacts of price increases the further they rise from current price levels.
It is possible for protected areas to implement relatively dramatic price increases in short time spans. Botswana, Bhutan, and Rwanda implemented large fee increases with immediate effect in the late 1980s and early 1990s, including an over 900% increase in the case of Botswana, and saw tourist numbers still increase [
2,
4,
11]. Realistically, however, such a large-scale price increase has often proven difficult to implement when attempted, attracting opposition, particularly from tourism-related businesses concerned with potential drop-offs in tourist numbers [
1,
11]. For example, entrance fee increases in Costa Rica in the mid-1990s deemed too high were met by waves of protests from hotels and tour operators, leading to the cancelation of the fee increase [
26,
49]. Studies in Nepal, western Mexico, and Tanzania also suggest that gradual implementation, starting with moderate fee increases, has the potential to generate support for the increase among local communities and tourism businesses [
27,
44,
73]. These experiences suggest that a pricing policy that is in-keeping with either of the lower fee increases would be more realistically applicable.
Another important consideration when determining appropriate fee levels is the capacity of sites to handle their current visitor numbers; if sites are experiencing visitation levels that are potentially damaging to natural or cultural amenities, high entrance fees would have the added benefit of rationing visitor numbers. At the moment, only Cobá is experiencing the beginnings of negative impacts from having too many visitors; the other sites are generally considered to be within their current visitor capacity [
74]. However, with talks of a trans-Yucatan “tourist train” connecting Cancun with Sian Ka’an, Calakmul, and Palenque, this could change very rapidly in the direction of much higher visitor levels, leading to negative consequences for the sites [
75,
76].
5.3. Broader Impacts and Future Research
By examining the results of the regression analysis, it is also possible to examine how different types of visitors might respond to across-the-board fee increases. The pool of visitors would likely be somewhat wealthier and better educated than it is currently. However, at the price points outlined above, this would be unlikely to reflect limitations on visitors’ ability to pay, given the small relative price difference when compared to overall vacation cost. It would instead reflect the stronger preferences of those visitors who selected Mexico as a destination for cultural and environmental amenities, those with strongly pro-conservation viewpoints, and, particularly, those already invested in visiting particular protected sites before arrival. The visitors most likely to be turned off of visiting because of fee increases are those with more casual interests in visiting the sites, those with less favorable views on conservation, and those primarily interested in beach and resort tourism. Further research on the spending patterns and visit lengths of these different types of tourists would be helpful in predicting the impact of fee increases on other tourism-related businesses.
It is noteworthy that rather than income, or other demographic attributes, it is attitudinal characteristics, such as views on conservation or prior investment in visiting a particular site, that were the strongest predictors of visitors’ willingness to pay. Tourism campaigns aimed at attracting visitors to Mexican protected sights, therefore, should focus on attracting those pro-conservation, cultural and environmental tourists who are likely to be the most indifferent to price increases. This suggests focusing advertising towards media sources specifically consumed by these potential visitors. In particular, effectively showcasing sites to potential tourists and building investment in visitation before arrival in Mexico is more likely to produce motivated visitors, with higher willingness to pay thresholds.
While the results of this study are of relevance to entrance pricing policy in south-eastern Mexico, they also have broader implications in other contexts as well. As can be seen in
Table 9, the mismatch between visitor willingness to pay and current entrance fee pricing at protected sites is a global phenomenon. Thus, the results of this study should add additional weight to the growing body of research suggesting the need for a world-wide re-evaluation of protected area entrance fee levels.
As the nature of tourism and types of protected sites in a given region or country will influence the degree and nature of this divergence between current fee levels and visitor willingness to pay, the results of this study should be of particular interest to policy-makers in contexts similar to those found in the Yucatan: high levels of resort-based tourism occurring in proximity to naturally- and/or culturally-significant protected sites. Within lower-and middle-income countries, some areas where this might be particularly relevant include Belize, the Dominican Republic, Gambia, Senegal, the Aegean and Mediterranean coasts of Turkey, the Andaman cost of Thailand, and some Indonesians islands, especially Bali [
77,
78,
79,
80,
81].
There is also need for further contingent valuation studies of entrance fee pricing in these resort/beach tourism contexts. As seen in
Table 9, the majority of studies have been conducted in areas such as Southern/Eastern Africa or Coast Rica where high-end, nature-based tourism is the primary driving factor, with very different site and visitor profiles. In addition to examining the visitor side, there is need of broader and more systematic cross-national studies, examining whether there are particular site or national characteristics, such as visitation numbers, UNESCO World Heritage status, natural vs. cultural amenities, management structure, etc., that influence the entrance fee pricing strategy and divergence from visitor willingness to pay.
6. Conclusions
With protected sites around the world facing serious funding crises and demands for alternative, extractive use of their land, revenue from visitor entrance fees must go further to provide the necessary infrastructure and labor for effective management and conservation. However, if entrance fees are raised too high, the decline in visitor numbers would offset any revenue gains made. For this reason, establishing visitors’ willingness to pay is an essential step in crafting an informed entrance pricing policy.
This survey of 877 visitors to five Mexican protected sites found that visitors were willing to pay a mean entrance fee of US$18.02 and a median entrance fee of US$13.71, well above the current fees at any of the sites. Overall, the revenue maximizing fee aggregated across the sites would be US$13.59, which would represent a potential 77% increase in revenue over current levels. Visitor demand was found to be relatively inelastic, with price increases not matched by equivalent drops in visitor numbers. For instance, if each site increased entrance fees by US$1, overall revenues would increase 20% at a drop of 4.5% in visitor numbers.
Additionally, these surveys showcased how different visitor characteristics impacted willingness to pay estimates. Nationality, age, and visiting on a tour were not found to impact a visitor’s willingness to pay. Income, education, attitudes towards conservation, cost of visiting a site, motivation for traveling to Mexico, and, particularly, prior decision to visit the site in question were found to significantly impact a visitor’s maximum willingness to pay.


