Article

Inhibition of Photosynthetic Activity in Wastewater-Borne Microalgal–Bacterial Consortia under Various Light Conditions

1
Gyeonggi-do Institute of Health & Environment, 324-1, Pajang-Dong, Jangan-Gu, Suwon, Gyeonggi-do 16444, Korea
2
Department of Environmental & Energy Engineering, Suwon University, 17 Wauan-gil, Bongdam-eup, Hwaseong-si, Gyeonggi-do 18323, Korea
3
Department of Information & Statistics, Chungbuk National University, Chungdae-Ro 1, SeoWon-Gu, Cheongju 28644, Korea
4
Department of Environmental Engineering and Energy, Myongji University, 116 Myongji-ro, Cheoin-gu, Yongin-si, Gyeonggi-do 03674, Korea
5
Department of Biotechnology, University of Tokyo, 1-1-1 Yayoi, Bunkyo-ku, Tokyo 113-8657, Japan
6
K-Water Research Institute, Korea Water Resources Corporation, 200 Sintanjin-Ro, Daedeok-Gu, Daejeon 34350, Korea
*
Author to whom correspondence should be addressed.
These authors contributed equally to this work.
Sustainability 2019, 11(10), 2951; https://doi.org/10.3390/su11102951
Submission received: 7 April 2019 / Revised: 8 May 2019 / Accepted: 21 May 2019 / Published: 24 May 2019
(This article belongs to the Section Environmental Sustainability and Applications)

Abstract

:
Microalgal–bacterial consortia are considered an alternative method to conventional wastewater treatment processes with several benefits, such as low oxygen production cost and reduced emission of carbon dioxide resulting from photosynthetic activity. Besides, microalgae effectively remove various emerging contaminants and heavy metals that are hardly removed by conventional wastewater treatment processes. The purpose of this study is finding optimal operation conditions (e.g., light wavelengths, light intensity, microalgal–bacterial consortia biomass) when applying microalgae in wastewater treatment system. Firstly, reduced transmittance was monitored at four different wavelengths (i.e., blue, green, red, and white light) and at various concentrations of microalgal–bacterial consortia. Light transmittance rates were rapidly reduced as the biomass increased, where the highest transmittance was observed in green light. Secondly, the reduction of oxygen production over time, by the inhibition of the photosynthetic activity, was tested as the light intensity increased at four different wavelengths and at low (100 mg L−1) and high (500 mg L−1) concentrations of microalgal–bacterial consortia. The observations and subsequent statistical analyses verify that microalgal–bacterial consortia show the strongest resistance to the inhibition of the photosynthetic activity in green light, with white coming next, when the intensity of light is increased.

1. Introduction

Microalgae are a natural component of ecosystems, whereas an overgrowth of algae, i.e., algal bloom, is often undesirable and has been considered one of the important issues in water supply systems. In recent years, however, the value of microalgae as a useful resource for energy production or wastewater treatment has gained increasing attention. Microalgae have been considered a noteworthy source of biofuel production with the benefit that they can be cultivated on water surfaces or closed reactor systems, and thus, unlike for other oilseed crops, no wide area of land is required [1,2,3]. Microalgae also have several benefits when applied to wastewater treatment processes. Firstly, the cost for oxygen (O2) supply is reduced in wastewater treatment processes in which microalgae are integrated [3,4,5,6]. In the conventional wastewater treatment process, nutrients such as phosphorus (P) and nitrogen (N) are removed by the microorganisms, which consume O2 to degrade the nutrients. Thus, an artificial supply of O2 is required, which contributes up to 75% of the energy cost of the wastewater treatment process [7]. In the microalgae integrated wastewater treatment systems O2 is supplied from the photosynthetic activity of microalgae, where required carbon dioxide (CO2) is supplied from the atmosphere or degradation processes of nutrients by the microorganisms [3,4,5,6]. In practice, microalgae integrated wastewater treatment systems also present environmental friendly processes as microalgae consume CO2 and act as oxygen donors; where the CO2 is supplied by nearby power plants [3]. The reduced emission of CO2, a typical greenhouse gas, to the open air is an additional important benefit of using microalgae for wastewater treatment. Secondly, microalgae have been found to effectively remove various emerging contaminants and heavy metals by sorption and biodegradation [8,9,10,11]. Moreover, microalgae are possible candidates for the production of several useful by-products and biofuel [3].
The application of microalgae has been considered a promising technique for the sustainable development of an environmentally friendly industry including biofuel production and wastewater treatment [12,13,14]. One of the major issues in using microalgae for industrial purposes is finding optimal conditions for the mass cultivation of microalgae. Open air systems have a low energy cost for cultivation as they utilize solar energy. However, there are limitations to controlling operation conditions such as light intensity or temperature, and thus optimal periods for algal cultivation and the selective cultivation of specific algal groups are limited [15,16,17,18]. Thus, closed systems are preferred to optimize algal cultivation conditions for biofuel production and nutrient removal in wastewater treatment plants as the operational parameters, such as characteristics and intensities of light, are controllable [19,20,21,22].
Previous studies suggested artificial light, especially light-emitting diodes (LEDs), can be an attractive method for effective cultivation of algal groups [23,24,25]. Although the optimal wavelengths of LEDs considering both algal cultivation and operation cost are still unclear, several studies have verified the effect and characteristics of different wavelengths of light (e.g., blue, green, red, and white) on algal cultivation [24,25,26,27,28].
Kang et al. (2018) [29] tested the effect of different wavelengths (light colors) on the oxygen production and nutrient removal rate of microalgal–bacterial consortia in a closed system. Four different wavelengths were applied to two microalgal–bacterial consortia with concentrations of 100 mg L−1 and 500 mg L−1, respectively. The four different wavelengths (colors of light) used for the test were blue, green, red, and white. They reported that white and red light was most effective for nutrient (i.e., total nitrogen and total phosphorus) removal [29]. However the optimal wavelength can be varied considering the photoinhibition effect, the variation of algal photosynthetic activities at different light intensities, which is also affected by the concentration of microalgae–bacteria. The photosynthetic oxygen production ability of microalgae can be inhibited by excessive light intensities as the internal photosynthetic system of the microalgae is damaged [30].
This study tested the effect of photoinhibition on the photosynthetic oxygen production process of microalgal–bacterial consortia by illumination with light of different wavelengths (light colors) and intensities. The differences in the oxygen production rate under different operation conditions (i.e., wavelength, light intensity, and microalgal–bacterial concentration) were quantified by statistical analysis.

2. Materials and Methods

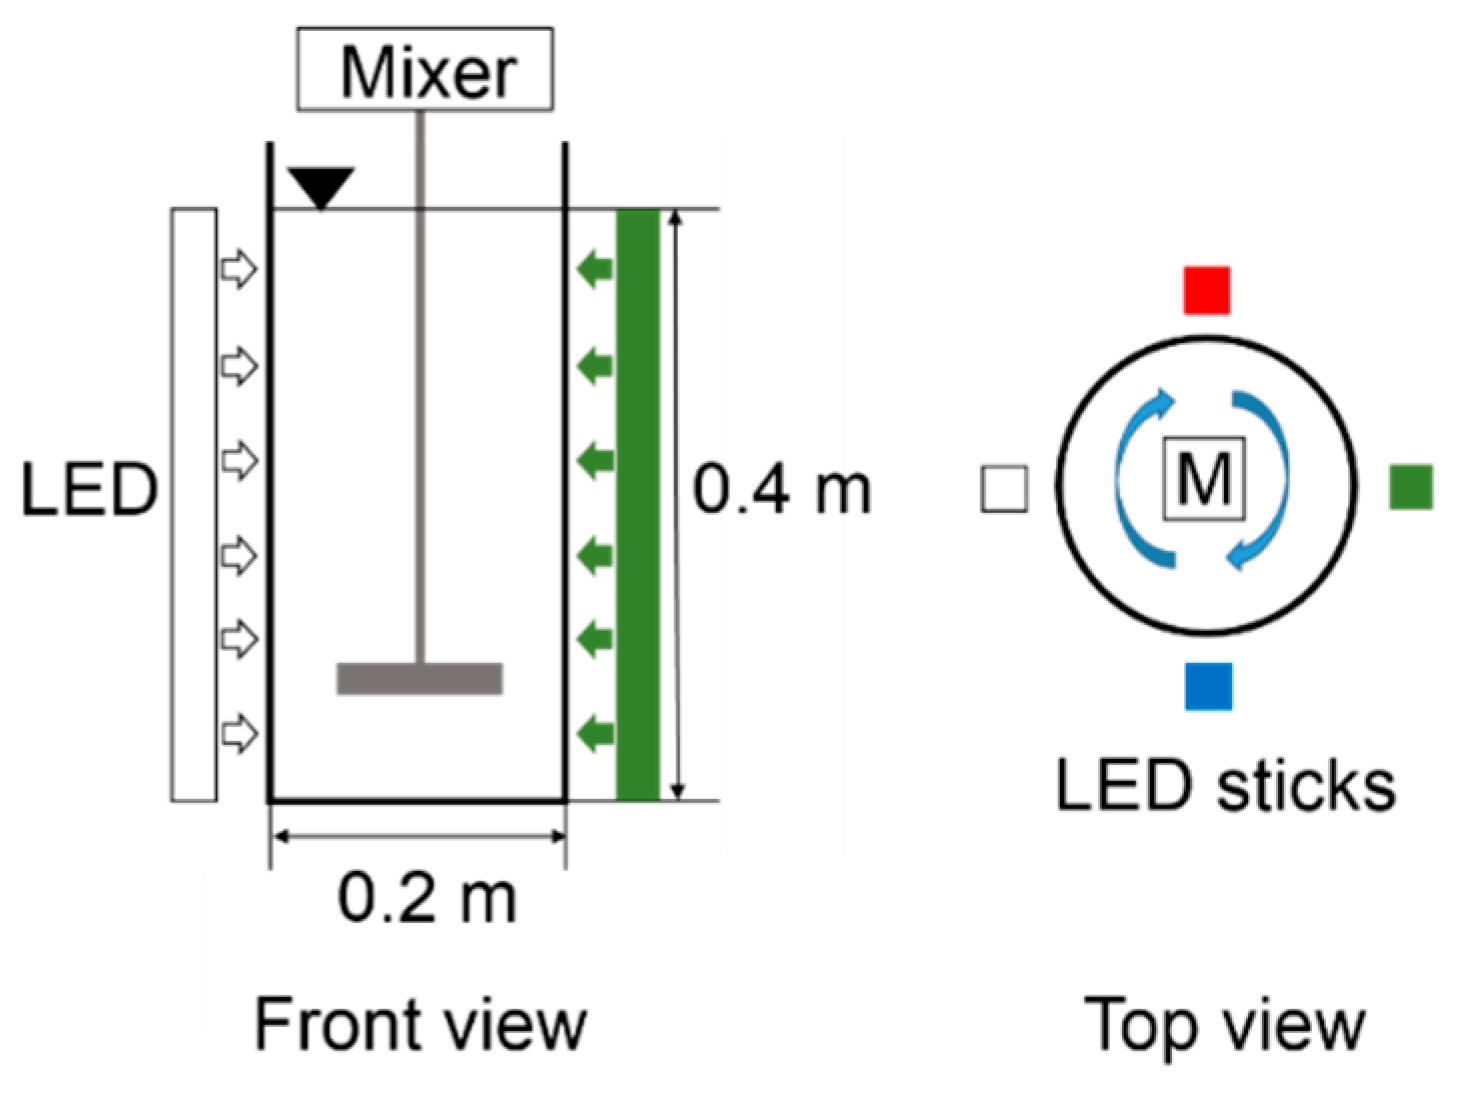
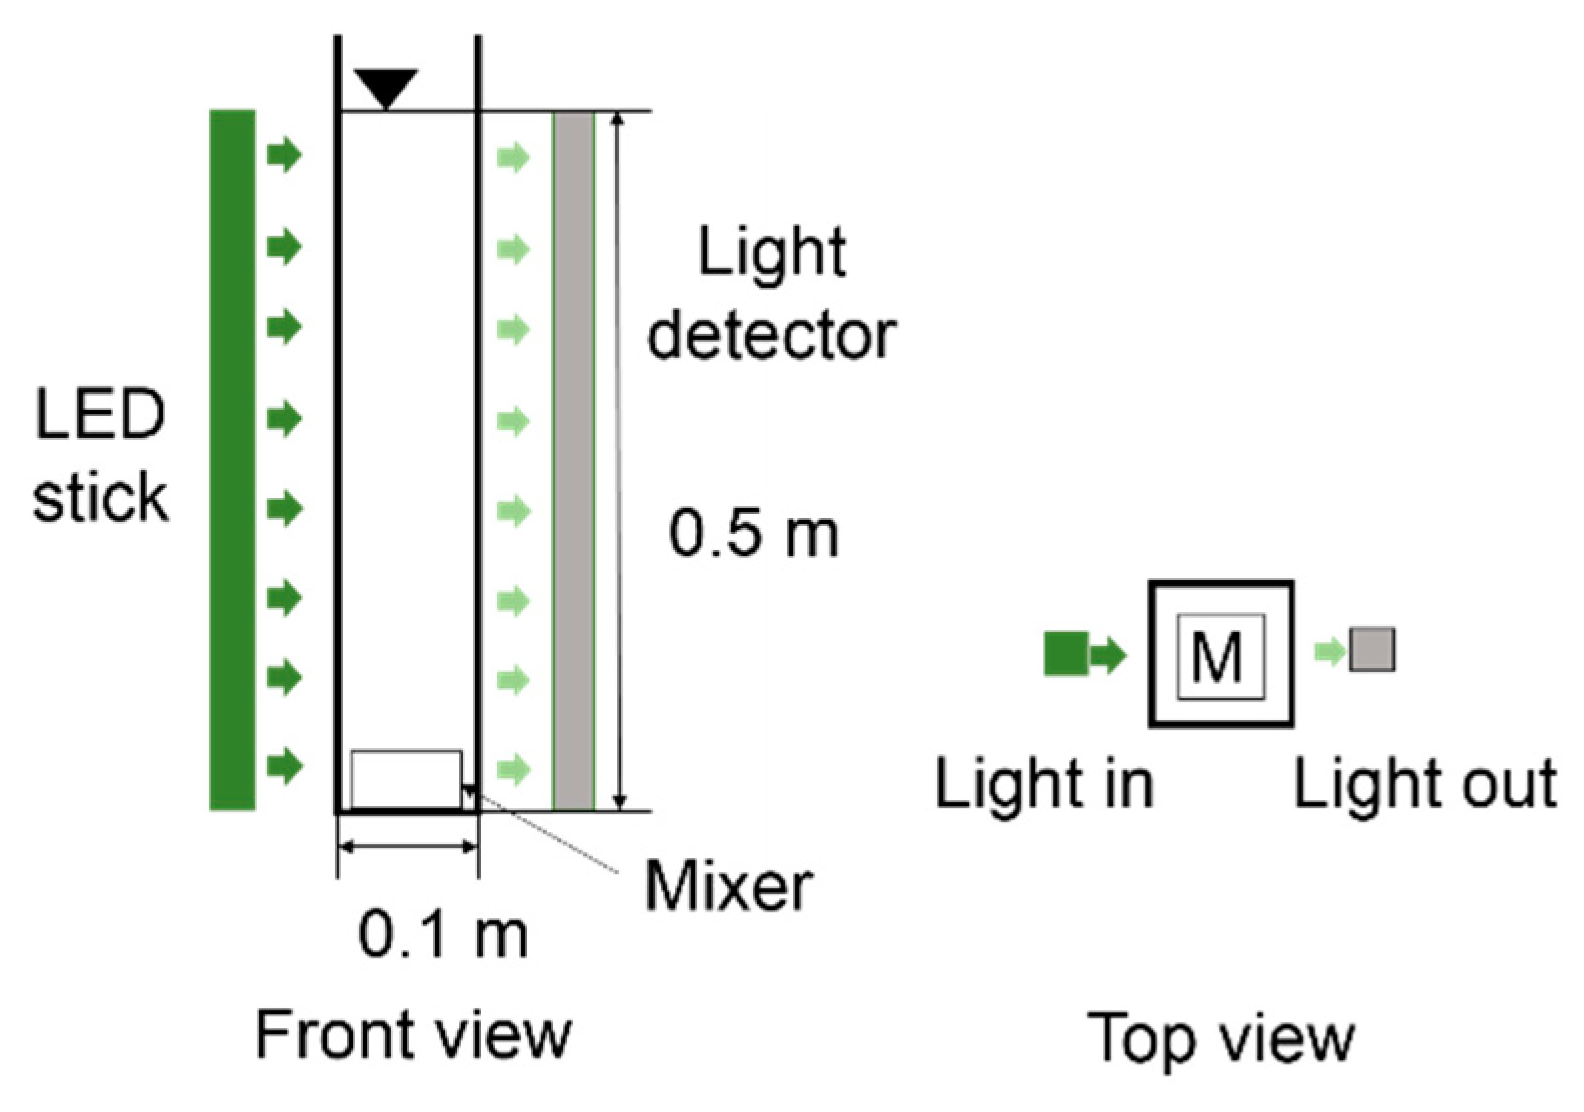
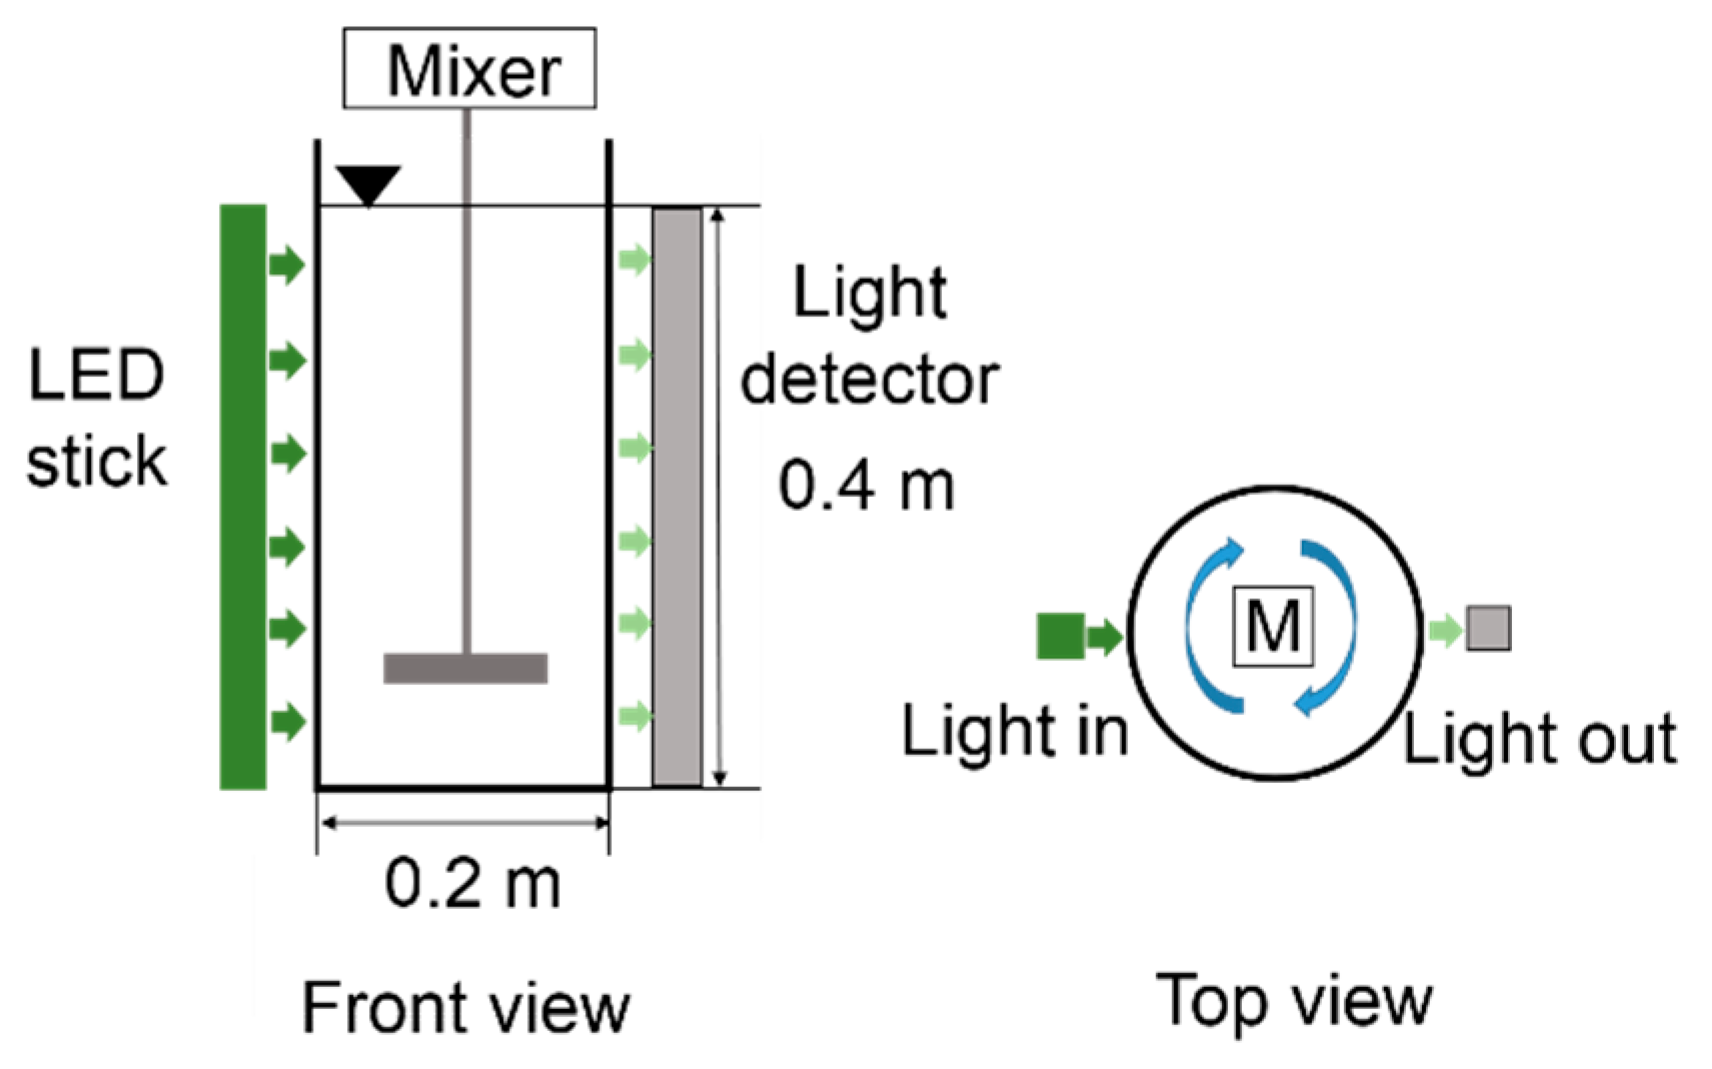
2.1. Cultivation of Microalgal–Bacterial Consortia

The microalgal–bacterial consortia were cultured in a semibatch reactor with an effective volume of 12.6 L for two months; light of four different wavelengths was emitted continuously at the same time during the cultivation period (Figure 1). The wastewater, sampled from a wastewater treatment plant in Yongin city, GyeongGi-Do, South Korea, was used for the cultivation of microalgal–bacterial consortia after being filtered by a 75-μm mesh screen. During the cultivation, the hydraulic retention time (HRT) and solid retention time (SRT) of the reactor were maintained at four days by replacement of 25% of the total volume of the reactor with the wastewater every day. The biochemical oxygen demand (BOD), and concentrations of total nitrogen (TN), total phosphorus (TP), ammonium nitrogen (NH3N), nitrogen oxides (NOx-N), and suspended solid (SS) in the wastewater were 255.5 ± 30.2 mg L−1, 61.4 ± 7.8 mg L−1, 7.5 ± 0.7 mg L−1, 31.8 ± 3.4 mg L−1, 0.4 ± 0.4 mg L−1, and 144.4 ± 30.1 mg L−1, respectively.
The four different light wavelengths of LEDs (manufactured by Oshino Lamps Ltd., Tokyo, Japan) used for the cultivation were 450–470 nm (blue color), 510–540 nm (green color), 610–680 nm (red color), and 380–760 nm (white color). To maintain the microalgal–bacterial consortia in suspension, the reactor was stirred by an impeller at 150 rpm. The cultivated microalgal–bacterial consortia stabilized after two months of cultivation, with the microalgal–bacterial consortia concentration at 500 ± 100 mg L−1 as total suspended solid concentration (hereafter 500 mg L−1), which is 6.7 ± 0.2 mg L−1 as chlorophyll-a concentration with a pH of 7.2 ± 0.6.

2.2. Transmittance of Light

The transmittance of light of the four different wavelengths (i.e., blue, green, red, and white) in microalgal–bacterial consortia was tested at various biomass concentrations. A rectangular reactor (L 0.1 m × W 0.1 m × H 0.5 m) was filled with microalgal–bacterial consortia at various concentrations, from 0 to 1482 mg L−1 (Figure 2). Microalgal–bacterial consortia with a concentration of 1482 mg L−1 were prepared by settling and concentrating microalgal–bacterial consortia with a concentration of 500 mg L−1, and then the concentrated sample was repeatedly diluted two-fold with distilled water for the experiment. Thus, the 11 concentration of microalgal–bacterial consortia used for the test were 1482 mg L−1, 741 mg L−1, 370.5 mg L−1, 185.3 mg L−1, 92.6 mg L−1, 46.3 mg L−1, 23.2 mg L−1, 11.6 mg L−1, 5.8 mg L−1, 2.9 mg L−1, and 0.0 mg L−1 (blank). As blank, a distilled water sample was also used for the test. Light of four different wavelengths was emitted from the side of the reactor and the intensity of light transmitted was measured by a photometer at the opposite side. A constant internal concentration of the microalgal–bacterial consortia was maintained by stirring the consortia with a magnetic bar at 100 rpm (Figure 2).

2.3. Inhibition of Photosynthetic Activity

Inhibition of the photosynthetic activity in the microalgal–bacterial consortia by various wavelengths (colors) and intensities of light were tested at two different concentrations (100 mg L−1 and 500 mg L−1, respectively) of microalgal–bacterial consortia. The microalgal–bacterial consortia were washed with distilled water, and then concentrated by centrifugation at 2500 rpm. This process was repeated three times. Microalgal–bacterial consortia with a concentration of 100 mg L−1 were obtained by dilution of the 500 mg L−1 consortia with effluent from the wastewater treatment plant in Yongin city, GyeongGi-Do, South Korea. The wastewater was filtered with a 1.2 μm mesh GF/C filter. The concentrations of NH4+–N, PO4–P, and HCO3 were maintained at 50 mg L−1, 5 mg L−1 and 500 mg L−1, respectively. To prevent nitrification using the oxygen produced by photosynthetic activities, 3 mg L−1 of arylthiourea was added as an inhibitor of nitrification. The initial dissolved oxygen (DO) concentration was maintained at zero by adding N2 gas (99.9% V/V) for 10 min before starts the test.
Four batch reactors with an effective volume of 12.6 L were filled with microalgal–bacterial consortia at concentrations of 500 mg L−1 (Figure 3). Each reactor was exposed to lights at four different wavelengths (blue, green, red, and white) for 60 min, respectively. The same experiment was repeated with 100 mg L−1 microalgal–bacterial consortia to test the inhibition effect at lower concentrations of biomass. The concentration of DO in the batch reactor was measured with 1 min intervals in both reactors by a DO probe (YSI 5100, Yellow Springs, OH, USA).

2.4. Statistical Analysis

The effect of various light intensity and light color conditions on oxygen production was quantitatively analyzed by statistical analysis using two-way analysis of variance (ANOVA) with data measured as described in Section 2.3; the effect of the interaction between light intensity and color on the photosynthetic oxygen production rate was also analyzed. An open-source library R program was used for this statistical analysis.
For the two-way ANOVA, the changes in light color and intensity over time were considered as independent variables. The oxygen production rate per unit time, unit microalgal–bacterial consortia mass as chlorophyll-a concentration, and intensity of light (hereafter unit oxygen production rate) were considered as dependent variables.

3. Results

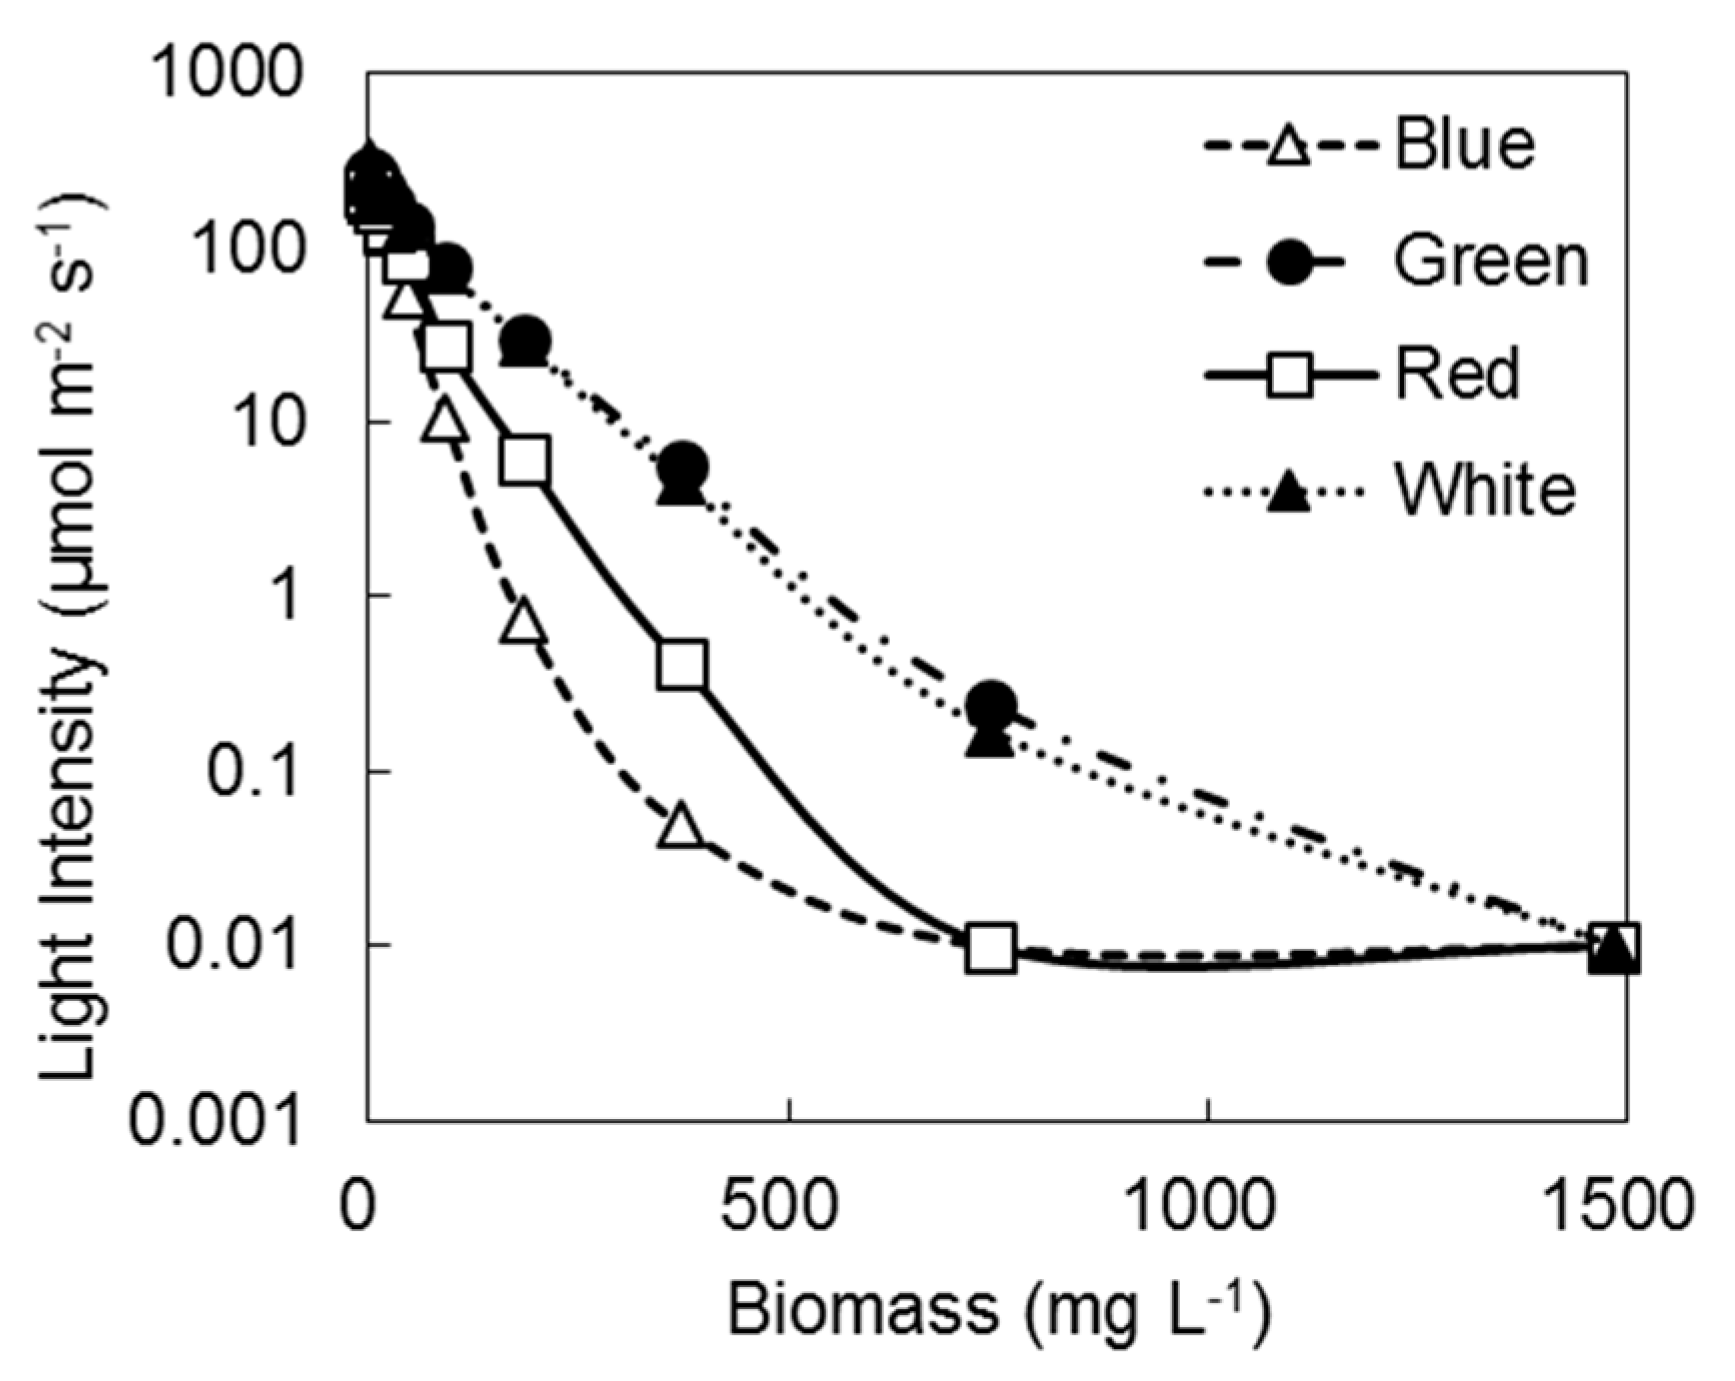
3.1. Transmittance of Light

The differences in the transmittance rate of the four different light colors (i.e., blue, green, red, and white) were tested in 11 microalgal–bacterial consortia groups with concentrations between 0 and 1482 mg L−1. The light intensity in distilled water was 267 μmol m−2 s−1, 215 μmol m−2 s−1, 269 μmol m−2 s−1, and 306 μmol m−2 s−1 for blue, green, red, and white light, respectively. The transmittance was observed to decrease as the concentration of biomass increased from 0 to 1482 mg L−1. The steepest reduction of transmittance by the increasing biomass was observed in blue light, and red light came next. The green and white light showed similar, but relatively lower reductions of transmittance with increasing biomass, where the highest transmittance was observed in green light (Figure 4). The transmittance rates were reduced to less than 11% of the input intensities when the biomass became larger than 185.3 mg L−1 at all four colors of light (Appendix A: Table A1).

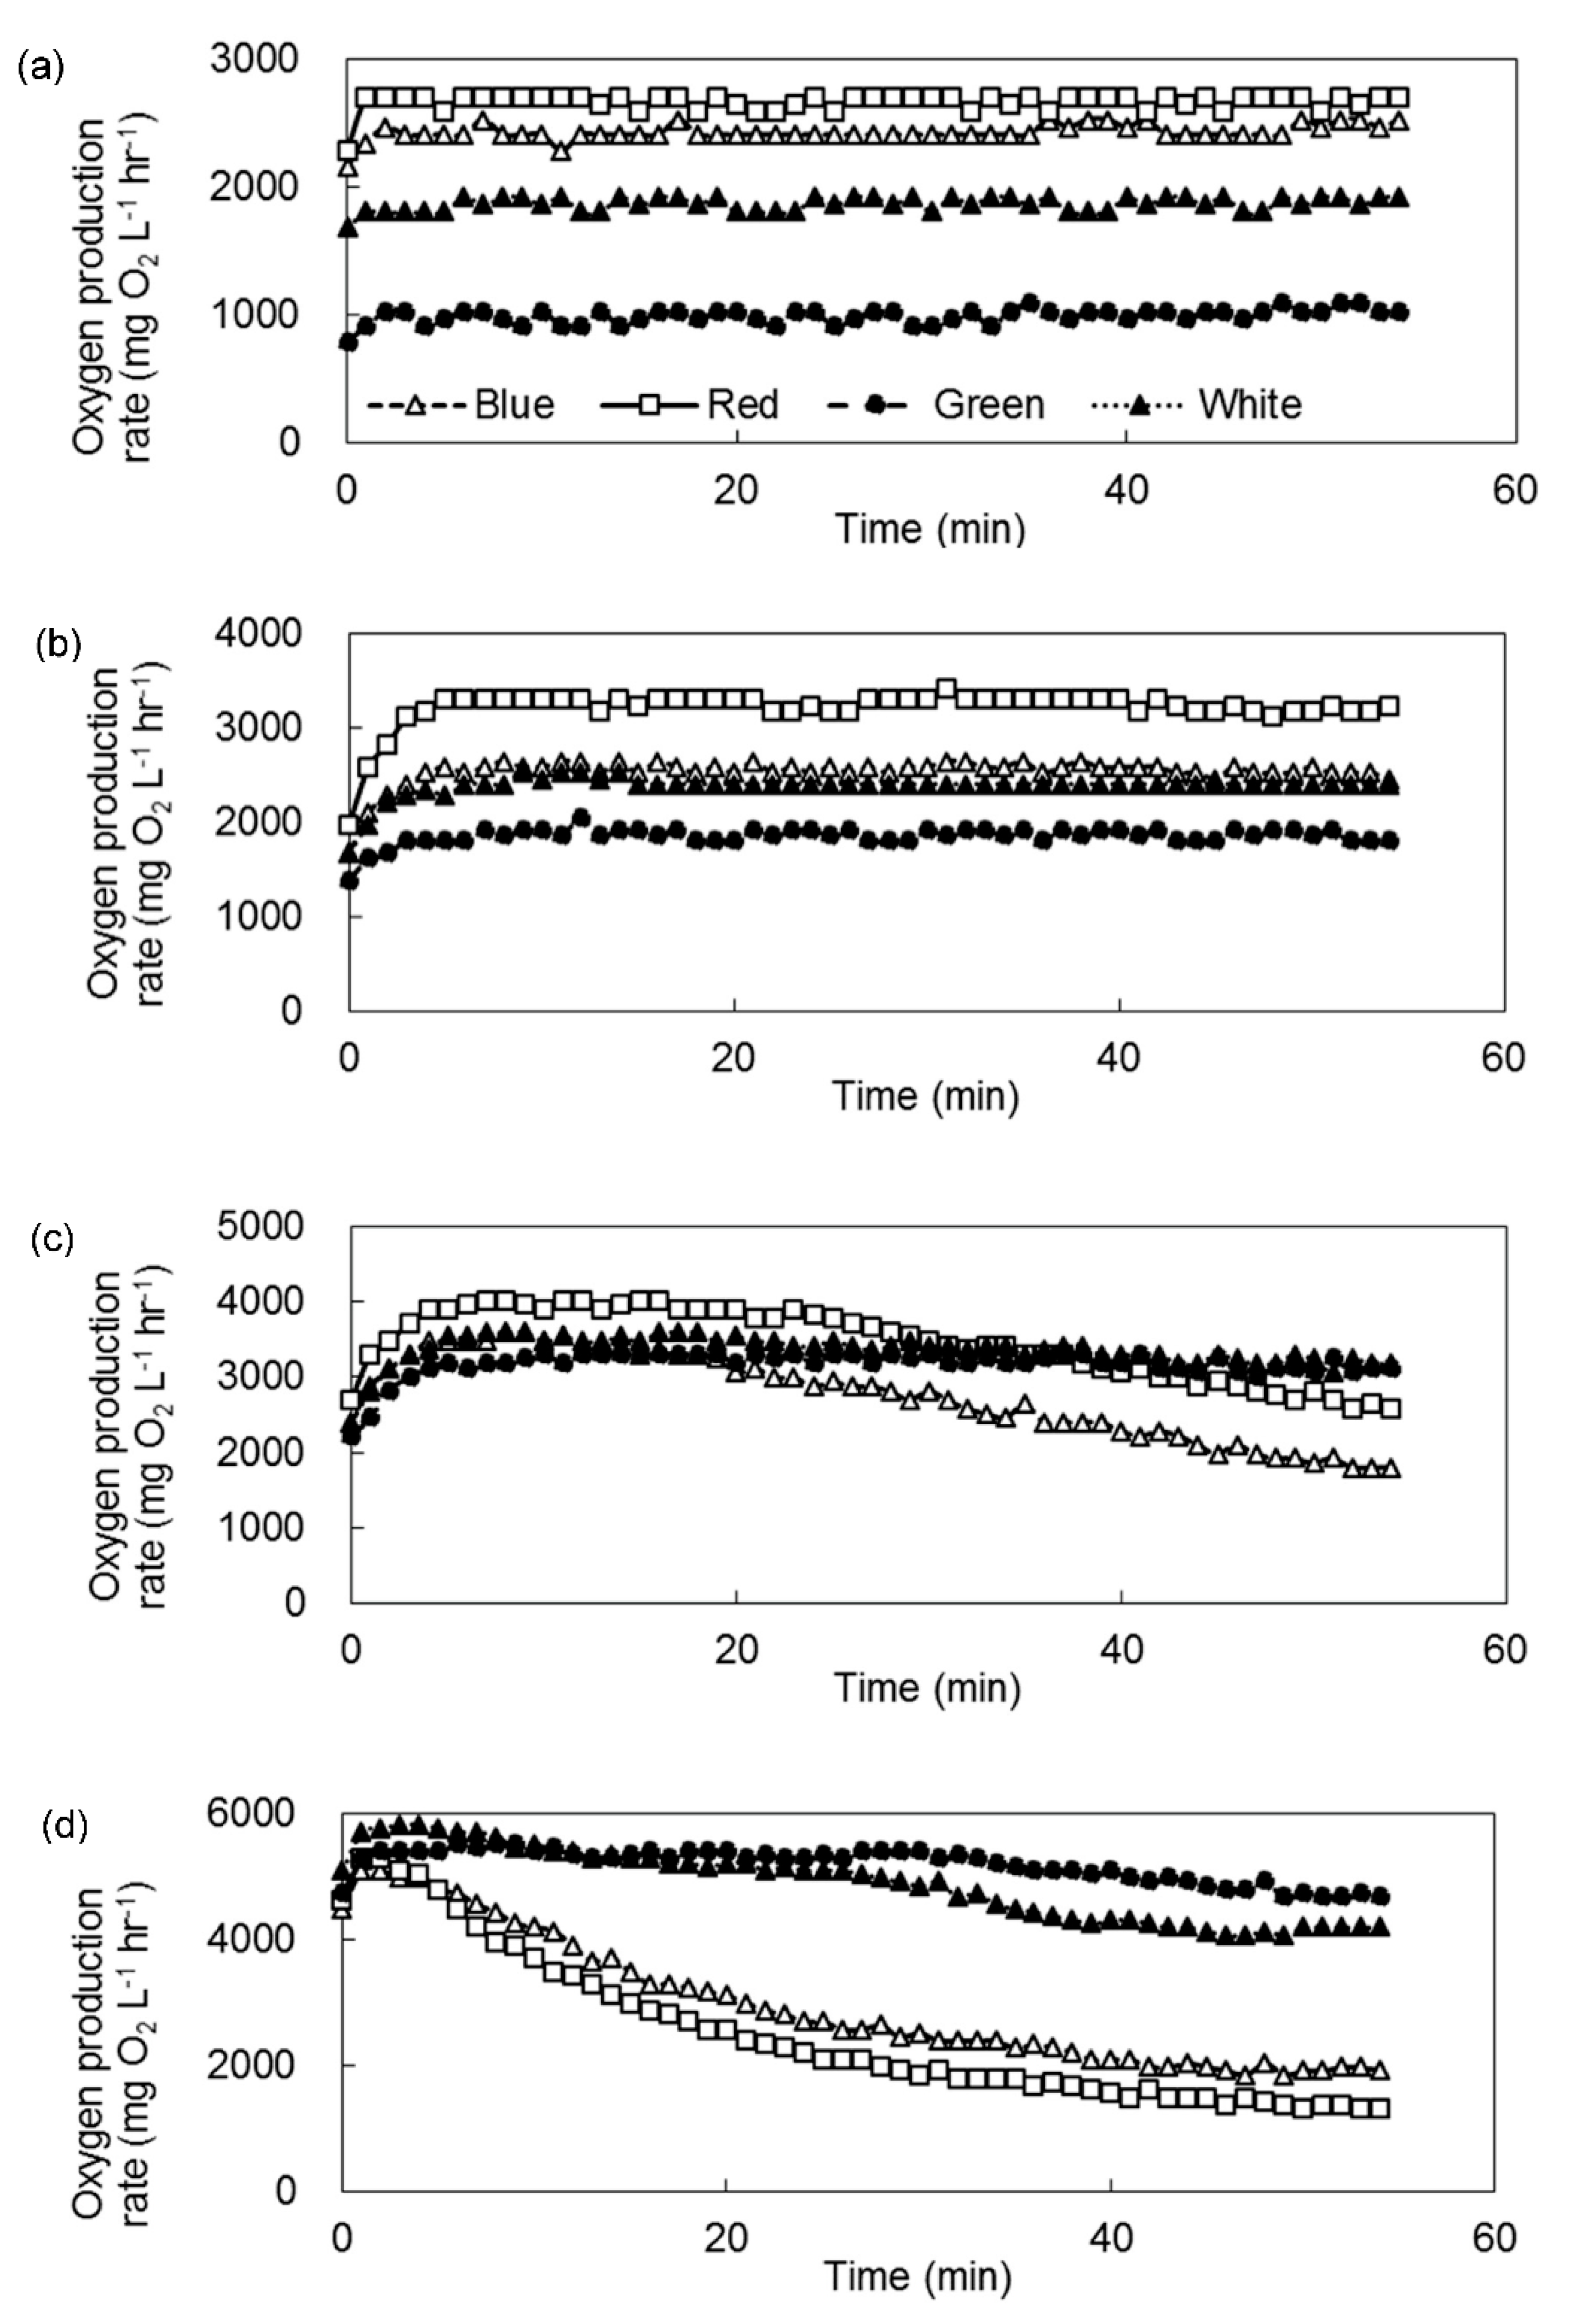
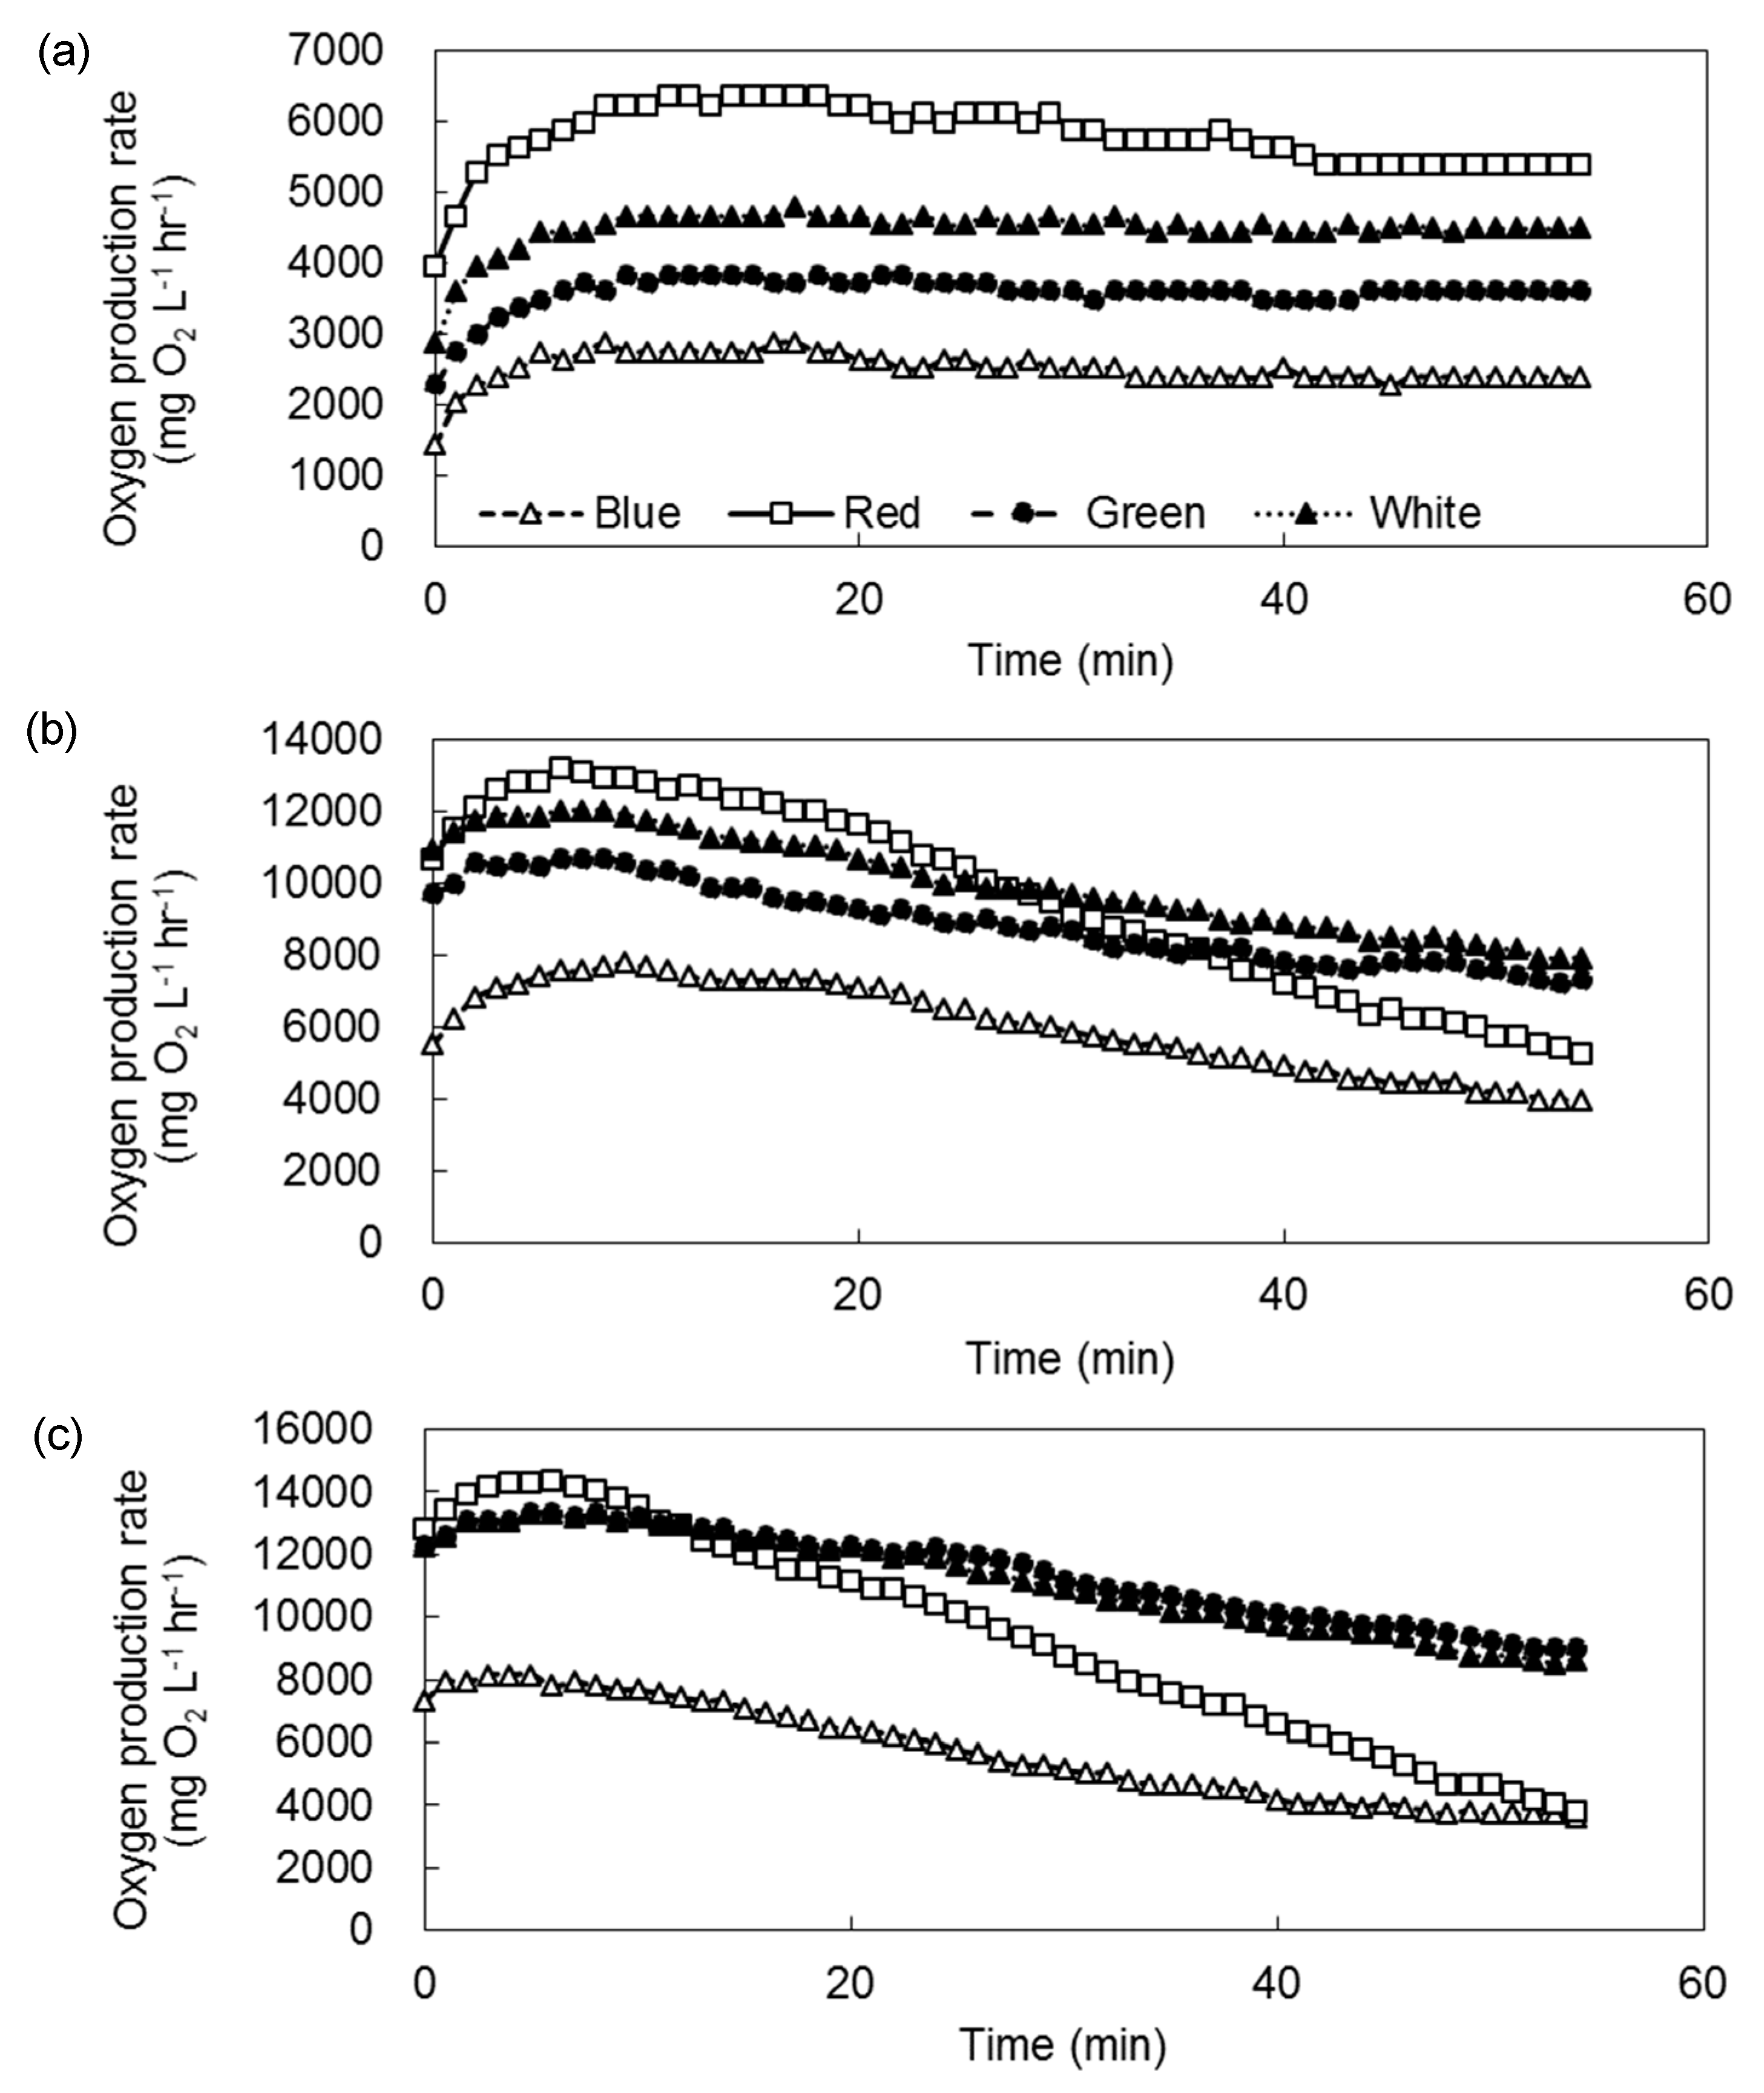
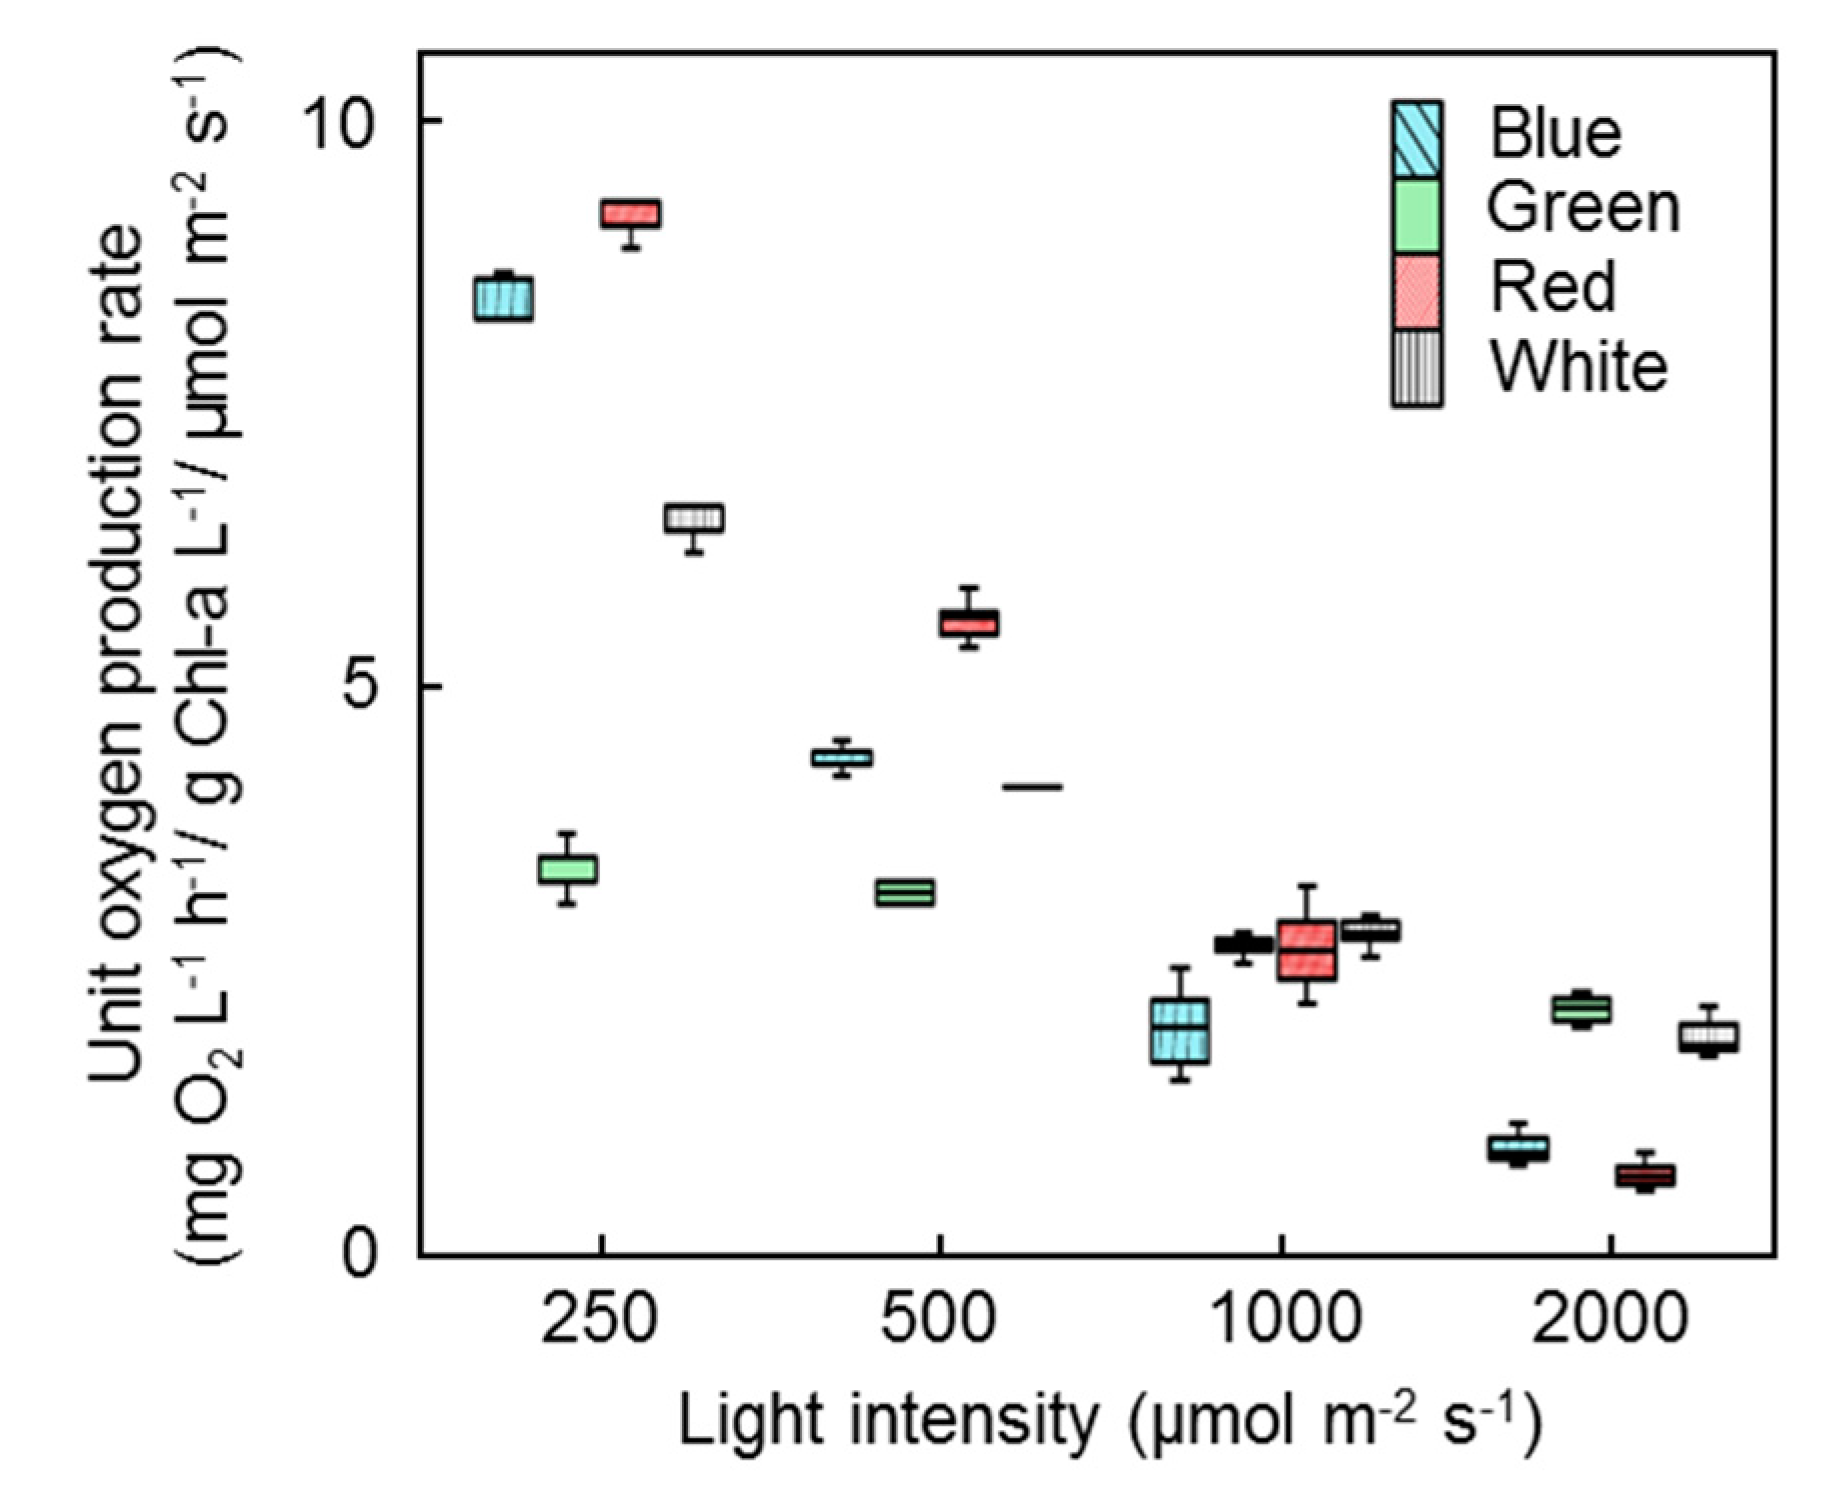
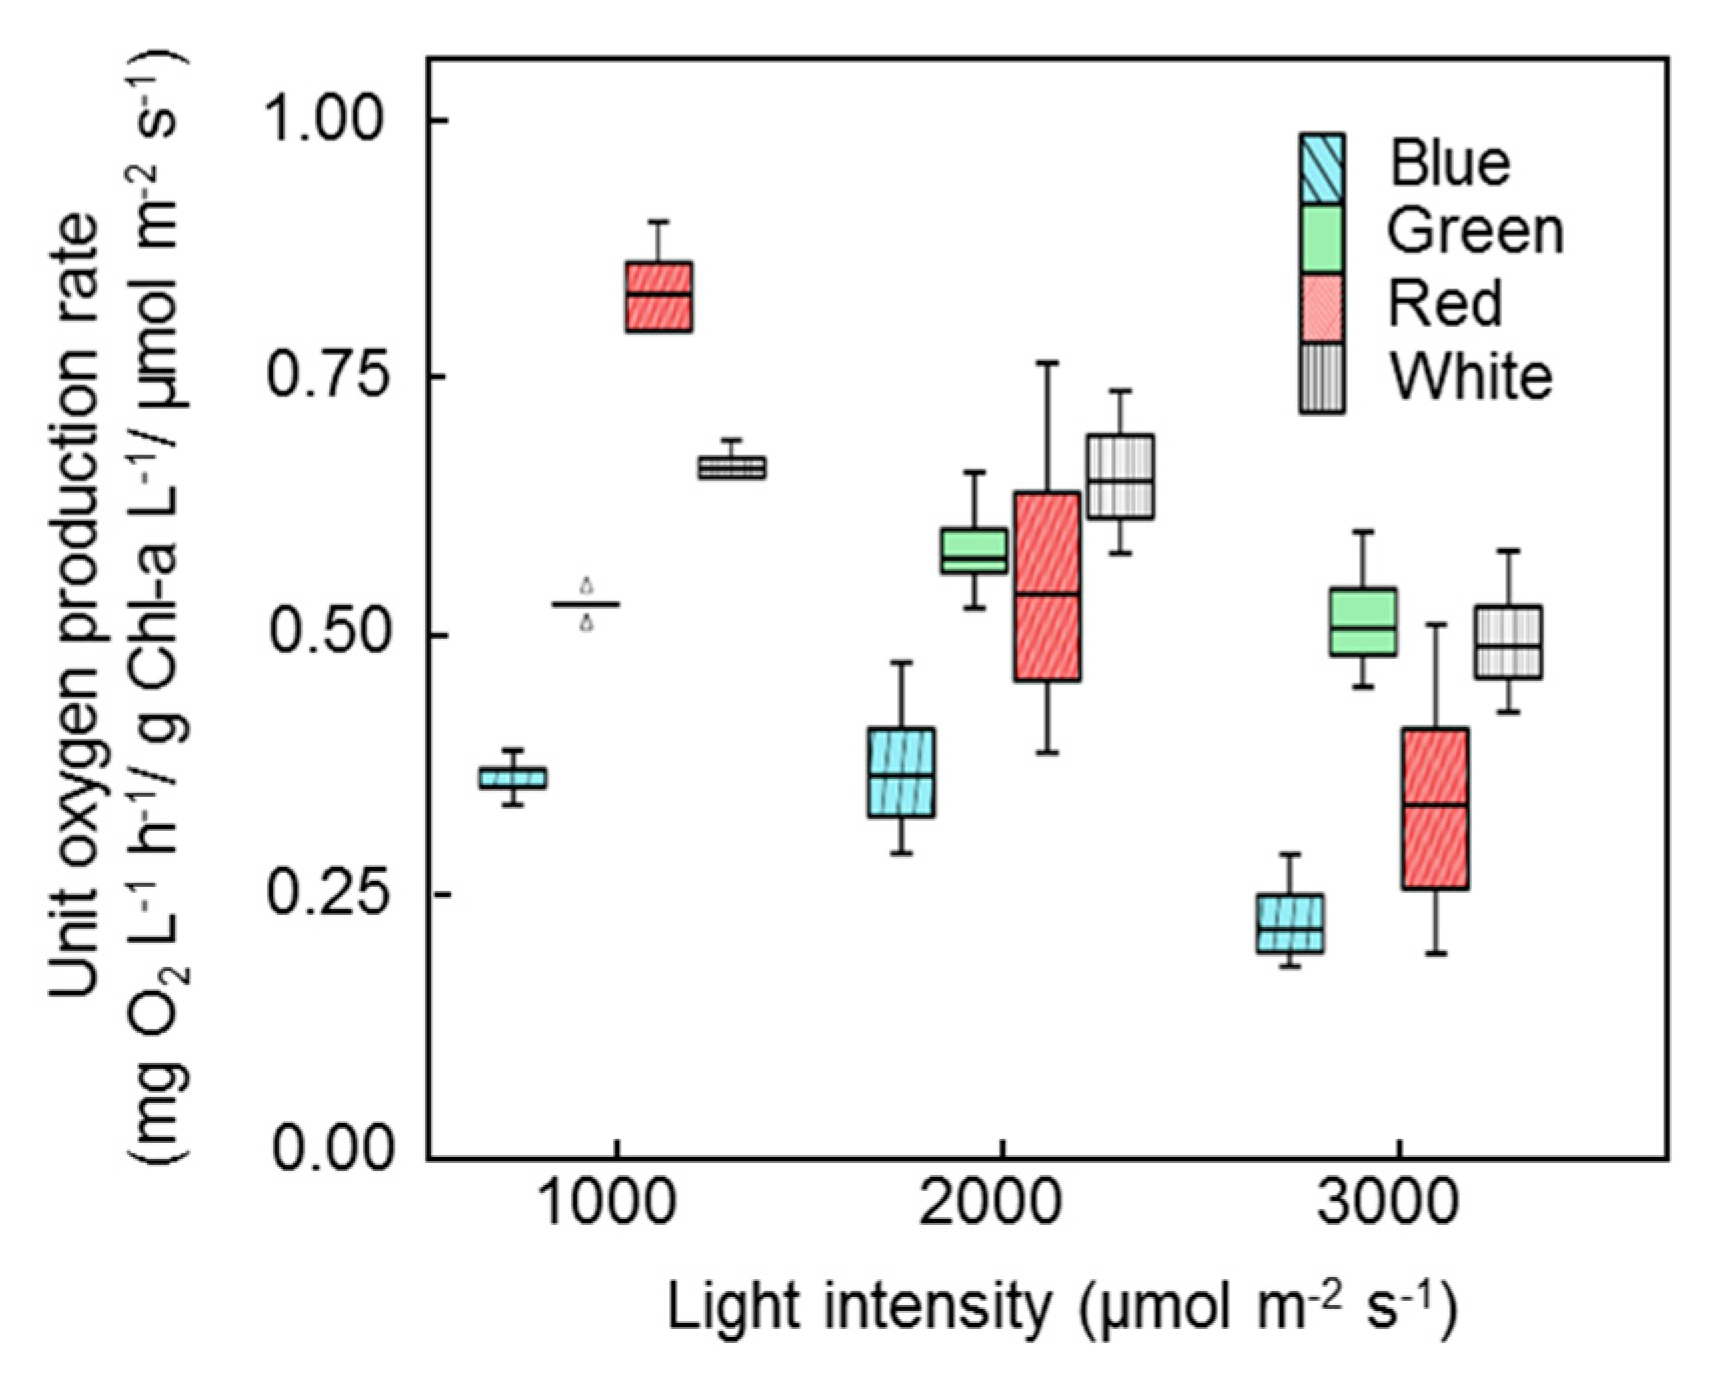
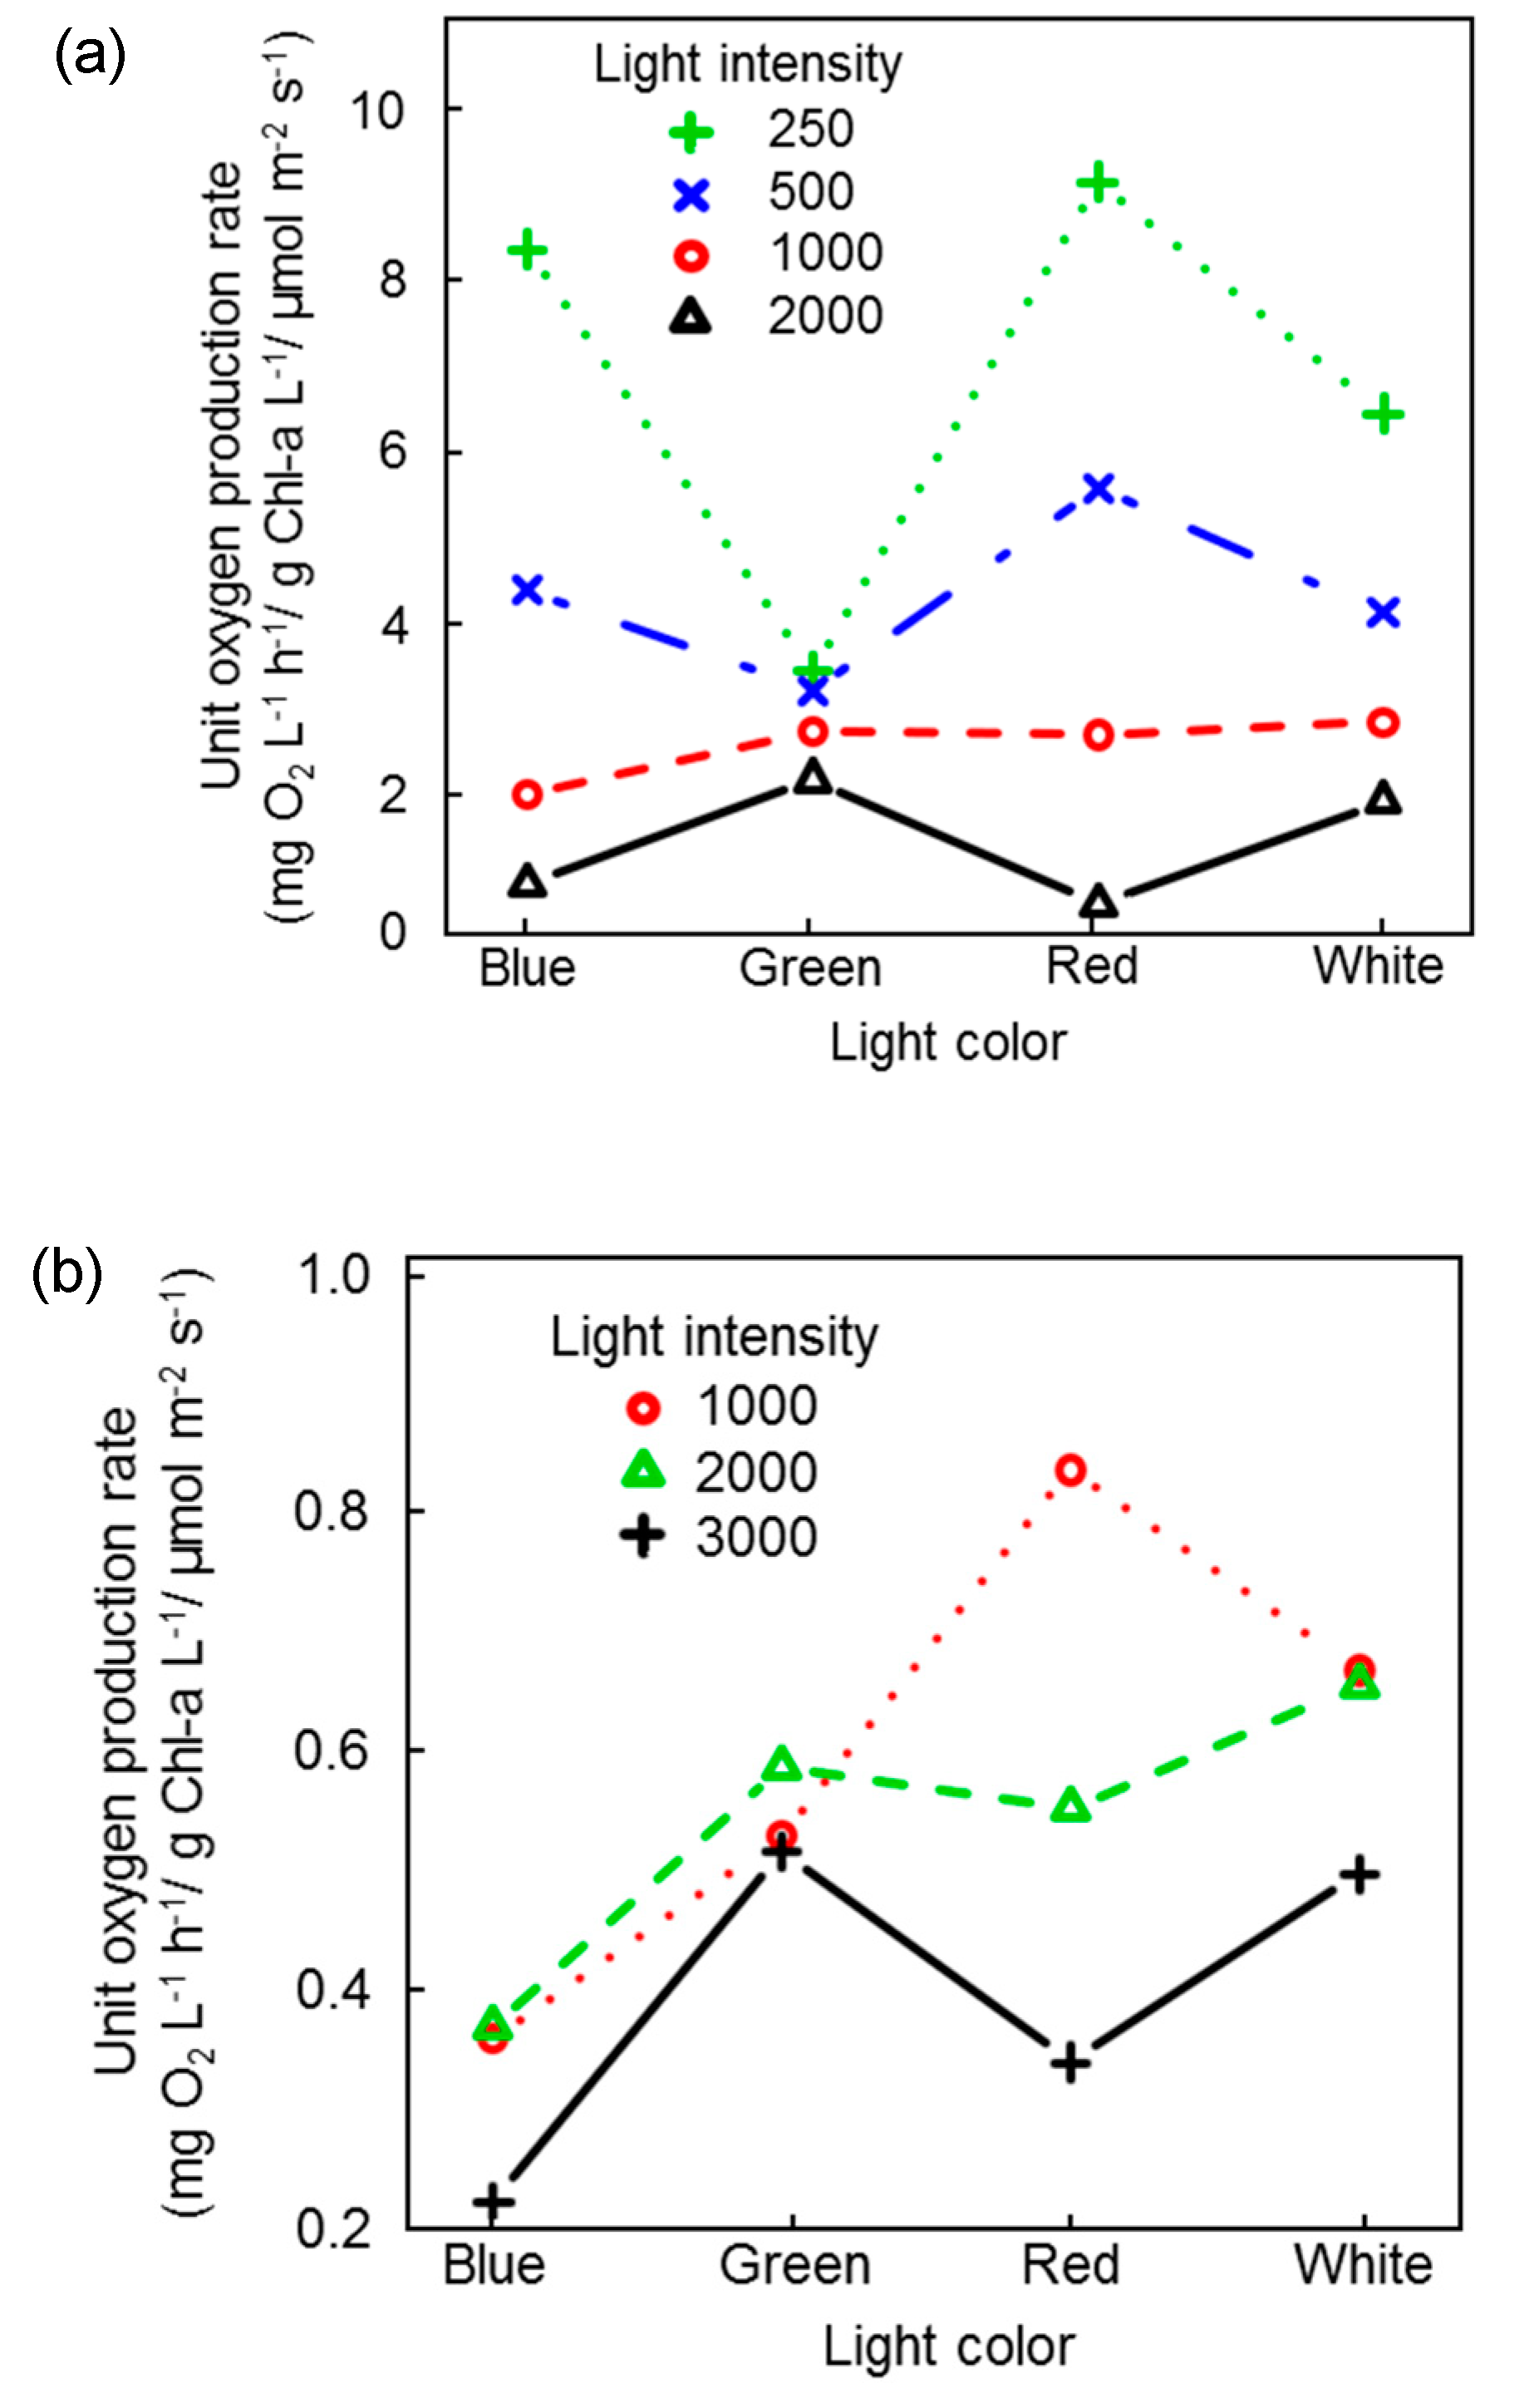
3.2. Inhibition of Photosynthetic Activities

The changes in oxygen production rate in microalgal–bacterial consortia were measured for 60 min and sequences of five data were averaged for the data analysis. Thus, a total of 55 data from 0 min to 54 min were used to analyze the inhibition of the photosynthetic activity.
At low microalgal–bacterial consortia concentrations, the oxygen production rate was stable at the lower light intensities of 250 and 500 μmol m−2 s−1, where the oxygen production rates in different colors of light decreased in the order red > blue > white > green during the entire illumination period of 54 min (Figure 5). On the other hand, at a higher light intensity of 1000 μmol m−2 s−1, higher oxygen production rates were observed in the order white > green > red > blue after ~30 min of illumination. The order was green > white > blue > red at a light intensity of 2000 μmol m−2 s−1 after ~10 min of illumination. At a light intensity of 1000 μmol m−2 s−1, the highest oxygen production rate was observed in red light at the beginning of illumination, while the oxygen production rate decreased rapidly over time in blue and red color conditions, whereas the oxygen production rate was maintained stably in green and white light. At a light intensity of 2000 μmol m−2 s−1, a rapid decrease of the oxygen production rate through time was also observed in blue and red light while the oxygen production rate was also stable in green and white light. The maximum oxygen production rate was observed in green light at a light intensity of 2000 μmol m−2 s−1; at 54 min illumination, the oxygen production rate at a light intensity of 2000 μmol m−2 s−1 was 4680 mg O2 L−1 h−1, 4200 mg O2 L−1 h−1, 1920 mg O2 L−1 h−1, and 1320 mg O2 L−1 h−1 in green, white, blue, and red light, respectively.
At high concentrations of the microalgal–bacterial consortia, the oxygen production rate was maintained stable at a light intensity of 1000 μmol m−2 s−1. It is likely that the higher biomass provides more resistance to the increase of light intensity than at low concentrations of the microalgal–bacterial consortia (Figure 6), where the oxygen production rate was higher in the order red > white > green > blue. On the other hand, at the higher light intensities of 2000 μmol m−2 s−1 and 3000 μmol m−2 s−1, a rapid decrease in the oxygen production rate was also observed over time, especially under blue and red light conditions. The oxygen production rate was higher as the light intensity increased in all four light color conditions at the start of the illumination, whereas the oxygen production rate rapidly decreased over time especially in blue and red light. Thus, in blue and red light the oxygen production rate was lower at the end of the illumination at a light intensity of 3000 μmol m−2 s−1 than at a light intensity of 2000 μmol m−2 s−1 (Figure 6). The oxygen production rates at a light intensity of 2000 μmol m−2 s−1 were 3960 mg O2 L−1 h−1 and 5280 mg O2 L−1 h−1 at the end of illumination in blue and red light, respectively, while they were reduced to 3600 mg O2 L−1 h−1 and 3840 mg O2 L−1 h−1 at the higher light intensity of 3000 μmol m−2 s−1. Much stronger resistance to the inhibition of photosynthetic activities by an increase of the light intensity was observed in green and white than in blue and red light, where maximum oxygen production rates were observed at a highest light intensity of 3000 μmol m−2 s−1 in green and white light, at 9000 mg O2 L−1 h−1 and 8640 mg O2 L−1 h−1, respectively.
These results show that the oxygen production capacity of microalgal–bacterial consortia was decreased through time especially by increasing the light intensity; the minimum inhibition effect, and thus the maximum oxygen production rate, was observed in green light.

3.3. Statistical Analysis of the Effect of Light Conditions on Photosynthetic Activities

The effect of the color and intensity of light on the oxygen production rate was statistically quantified by two-way ANOVA, where oxygen production rate was used as a dependent variable and color and intensity of light as independent variables.

3.3.1. Low Microalgal–Bacterial Consortia Concentration

The result of the two-way ANOVA with interaction at a low microalgal–bacterial consortia concentration (100 mg L−1) shows that the model is valid (p-value < 0.05) with R2 = 0.9956; thus more than 99% of the entire variation is explainable (Appendix A: Table A2).
The two-way ANOVA analysis for each variable at low microalgal–bacterial consortia concentration shows that the differences in the oxygen production rate at different intensities or colors of light are valid (p-value < 0.0001). The interaction of the two variables (light intensity and color) also has an effect on the oxygen production rate (p-value < 0.0001) (Appendix A: Table A3).
The oxygen production rate is higher in red and blue than in green and white light at low light intensity (less than 500 μmol m−2 s−1), whereas the oxygen production rate becomes higher in green and white light as the intensity of light is increased to higher than 1000 μmol m−2 s−1, as shown in a boxplot of the oxygen production rate (Figure 7). The oxygen production rate is higher in the order green > white > blue > red at a light intensity of 2000 μmol m−2 s−1 (Figure 7).
These results verify that the microalgal–bacterial consortia show the highest resistance to the photoinhibition effect when the light intensity is increased in the green light condition.

3.3.2. High Microalgal–Bacterial Consortia Concentration

The result of the two-way ANOVA with interaction at a high microalgal–bacterial consortia concentration also shows that the model is valid (p-value < 0.05) with R2 is 0.8998, thus 89% of the entire variation is explainable (Appendix A: Table A4).
The two-way ANOVA analysis for each variable at high microalgal–bacterial consortia concentration shows that the differences in the oxygen production rate at different intensities or colors of light are also valid (p-value < 0.0001). The interaction of the two variables (light intensity and color) also has an effect on the oxygen production rate (p-value < 0.0001) (Appendix A: Table A5).
The oxygen production rate is higher in green and white than in blue and red light as the light intensity is increased to higher than 2000 μmol m−2 s−1, and the microalgal–bacterial consortia are also verified to show the highest resistance to the photoinhibition effect when the light intensity is increased in the green color condition, as shown in the boxplot of the oxygen production rate (Figure 8). The oxygen production rates decrease in the order green > white > red > blue at a light intensity of 3000 μmol m−2 s−1 (Figure 8).

3.3.3. Interaction of Variables

Statistical analysis of the effect of the interaction between light intensity and wavelength on oxygen production shows that the smallest effect of light intensity on oxygen production was observed under green light conditions both in low and high microalgal–bacterial consortia concentrations (Figure 9). The minimum reduction of the oxygen production rate as a result of an increase in the light intensity was observed in green light, whereas a maximum reduction was observed in red. These results also verify that microalgal–bacterial consortia have the strongest resistance capacity to increases in light intensity in green light.

4. Discussion

The oxygen production rate of microalgae is affected by the color and intensity of light and the microalgae biomass, where the oxygen production tends to increase at higher light intensities and higher microalgae biomasses [28,29]. Although several studies have tested the effect of different light colors on the oxygen production rate of microalgae, no clear mechanism or conclusive result was suggested yet [23,28,29,31] and interaction of these factors makes it more complicated to understand the oxygen production process in microalgae. For example, an increase in light intensity increases the oxygen production rate, but also causes inhibition of the photosynthetic activities of microalgae for oxygen production over time. Besides, although more oxygen is expected to be produced at higher microalgae biomass, this is not always true as an increase in biomass also reduces the light transmittance by the shading effect, and thus causes inhibition of the oxygen production [28,29,30].
Thus, finding optimal operational conditions is essential both considering the efficiency of oxygen production by increasing the light intensity while also considering possible inhibition effects at various light color conditions of an increased light intensity on microalgal–bacterial consortia for practical application of microalgae in the process of wastewater treatment. The results in this study show that green light has several benefits over other colors of light. Firstly, higher transmittance rate was observed in green light when increasing the concentration of microalgal–bacterial consortia. Previous studies suggested that green light tends to penetrate deeper, and thus shows a stronger resistance to photoinhibition in microalgal–bacterial consortia [29,32]; a conclusion that is also supported by the results of this study. Besides, microalgal–bacterial consortia are less sensitive to an increase of light intensity in green light conditions. Thus, maximum oxygen production rates were observed at the end of the illumination period in green light, with white coming next, at higher light intensities of 1000 and 2000 μmol m−2 s−1 in low microalgal–bacterial consortia concentrations, and at higher light intensities of 2000 and 3000 μmol m−2 s−1 in high microalgal–bacterial consortia concentrations, which is an obvious benefit of using green light when microalgal bacteria consortia are applied in wastewater treatment processes.
The statistical analysis of oxygen production in this study also supports this result as the highest oxygen production rates were observed in green light in both low and high microalgal–bacterial consortia, with white coming next. From the analysis in this study, it is concluded that green light is promising for increasing the efficiency of oxygen production in practice (e.g., wastewater treatment plants) by microalgal–bacterial consortia; the possibility of increased operation power may alter the decision as illumination with green light consumes about 160–220% more power than blue, red, or white light, whereas the power consumption for illumination with the other three colors are comparable [29]. Thus, white color may be an alternative suggestion with the second-strongest resistance, next to green light, to the photoinhibition effect on the oxygen production rate.
Further studies are required to improve the applicability of microalgal–bacterial consortia in practice such as in wastewater treatment plants. A larger scale (i.e., pilot scale) test would be needed as light penetration depth may be different in larger scale reactors. Besides, a larger scale test can also provide more precise information about the power consumption rate and related operational cost. Thus, further studies with a larger scale test are suggested for the future to find the optimal operational conditions for the practical application of microalgal–bacterial consortia.

5. Conclusions

The complicated effect of interactions between wavelength and intensity of light on oxygen production of microalgal–bacterial consortia at different concentrations was studied here.
In the first part of this study, the transmittance of light when increasing the biomass of microalgal–bacterial consortia was tested, and the highest transmittance was observed in green light. This result suggests that green light is least affected by the shading effect in microalgal–bacterial consortia.
Evaluation of the changing photosynthetic oxygen production rate at different wavelengths and intensities of light shows that microalgal–bacterial consortia exhibit the strongest resistance to the inhibition of photosynthetic activities when increasing the light intensity in green light. The maximum oxygen production rate was observed at the highest light intensity with green light both at low and high microalgae concentrations. Subsequent statistical analysis also verified that both the wavelength and intensity of light affect the oxygen production rate and that microalgal–bacterial consortia show the strongest resistance to photoinhibition when increasing the light intensity in green light.

Author Contributions

Conceptualization: D.K., K.T.K. and J.P.; Methodology: D.K. and K.T.K.; Formal Analysis: D.K., K.T.K., T.-Y.H., G.K., C.L. and J.P.; Investigation: D.K., K.T.K., T.-Y.H., G.K., C.L. and J.P.; Resources: D.K. and K.T.K.; Statistical Analysis: T.-Y.H.; Writing—Original Draft Preparation: D.K., K.T.K., T.-Y.H. and J.P.; Writing—Review and Editing: J.P.; Visualization: D.K., K.T.K. and J.P.; Supervision: J.P., Project Administration: D.K., K.T.K. and J.P.

Funding

This work was supported in part by Korea Ministry of Environment as “Global Top Project” (Project No.: 2016002190007).

Conflicts of Interest

The authors declare no conflicts of interest. The funders had no role in the design of the study; in the collection, analyses, or interpretation of data; in the writing of the manuscript, or in the decision to publish the results.

Appendix A

Table A1. Transmittance rate (%).
Biomass (mg/L)Transmittance Rate (%)
BlueGreenRedWhite
1482.00.00.00.00.0
741.00.00.10.00.1
370.50.02.10.21.8
185.30.211.42.910.8
92.63.529.212.928.5
46.317.650.840.950.8
23.240.067.962.968.8
11.658.881.581.083.4
5.873.589.189.691.0
2.985.495.290.098.1
0.0100.0100.0100.0100.0
Table A2. Result of the two-way ANOVA analysis for the change in the oxygen production rate at low microalgal–bacterial consortia concentrations.
SourceSum of SquaresDFMean SquareF ValuePr > F
Model2747.42115183.16147039.51<0.0001
Error12.072844640.026019
Total2759.494479
R2 = 0.9956
Table A3. Result of the two-way ANOVA analysis of each variable for changes in the oxygen production rate at low microalgal–bacterial consortia concentrations.
SourceType I SSDFMean SquareF ValuePr > F
Intensity2014.5853671.528225809.1<0.0001
Color168.1905356.063512154.71<0.0001
Intensity * Color564.6458962.738432411.25<0.0001
Table A4. Result of the two-way ANOVA analysis for changes in the oxygen production rate at high microalgal–bacterial consortia concentrations.
SourceSum of SquaresDFMean SquareF ValuePr > F
Model9.392768110.853888284.2<0.0001
Error1.0455913480.003005
Total10.43836359
R2 = 0.8998
Table A5. Result of the two-way ANOVA analysis of each variable for changes in the oxygen production rate at low microalgal–bacterial consortia concentrations.
SourceType I SSDFMean SquareF ValuePr > F
Intensity2.65478521.327393441.79<0.0001
Color4.66236131.55412517.25<0.0001
Intensity * Color2.07562260.345937115.14<0.0001

References

  1. Dismukes, G.C.; Carrieri, D.; Bennette, N.; Ananyev, G.M.; Posewitz, M.C. Aquatic phototrophs: Efficient alternatives to land-based crops for biofuels. Curr. Opin. Biotechnol. 2008, 19, 235–240. [Google Scholar] [CrossRef]
  2. Christenson, L.B.; Sims, R.C. Rotating algal biofilm reactor and spool harvester for wastewater treatment with biofuels by-products. Biotechnol. Bioeng. 2012, 109, 1674–1684. [Google Scholar] [CrossRef] [PubMed]
  3. Hwang, J.-H.; Church, J.; Lee, S.-J.; Park, J.; Lee, W.H. Use of microalgae for advanced wastewater treatment and sustainable bioenergy generation. Environ. Eng. Sci. 2016, 33, 882–897. [Google Scholar] [CrossRef]
  4. Liu, X.; Saydah, B.; Eranki, P.; Colosi, L.M.; Mitchell, B.G.; Rhodes, J.; Clarens, A.F. Pilot-scale data provide enhanced estimates of the life cycle energy and emissions profile of algae biofuels produced via hydrothermal liquefaction. Bioresour. Technol. 2013, 148, 163–171. [Google Scholar] [CrossRef] [PubMed]
  5. Lananan, F.; Hamid, S.H.A.; Din, W.N.S.; Ali, N.; Khatoon, H.; Jusoh, A.; Endut, A. Symbiotic bioremediation of aquaculture wastewater in reducing ammonia and phosphorus utilizing Effective Microorganism (EM-1) and microalgae (Chlorella sp.). Int. Biodeterior. Biodegrad. 2014, 95, 127–134. [Google Scholar] [CrossRef]
  6. Beuckels, A.; Smolders, E.; Muylaert, K. Nitrogen availability influences phosphorus removal in microalgae-based wastewater treatment. Water Res. 2015, 77, 98–106. [Google Scholar] [CrossRef]
  7. Rosso, D.; Larson, L.E.; Stenstrom, M.K. Aeration of large-scale municipal wastewater treatment plants: State of the art. Water Sci. Technol. 2008, 57, 973–978. [Google Scholar] [CrossRef]
  8. Kumar, K.S.; Dahms, H.-U.; Won, E.-J.; Lee, J.-S.; Shin, K.-H. Microalgae—A promising tool for heavy metal remediation. Ecotoxicol. Environ. Saf. 2015, 113, 329–352. [Google Scholar] [CrossRef]
  9. Norvill, Z.N.; Shilton, A.; Guieysse, B. Emerging contaminant degradation and removal in algal wastewater treatment ponds: Identifying the research gaps. J. Hazard. Mater. 2016, 313, 291–309. [Google Scholar] [CrossRef]
  10. Matamoros, V.; Gutiérrez, R.; Ferrer, I.; García, J.; Bayona, J.M. Capability of microalgae-based wastewater treatment systems to remove emerging organic contaminants: A pilot-scale study. J. Hazard. Mater. 2015, 288, 34–42. [Google Scholar] [CrossRef] [Green Version]
  11. Cuellar-Bermudez, S.P.; Aleman-Nava, G.S.; Chandra, R.; Garcia-Perez, J.S.; Contreras-Angulo, J.R.; Markou, G.; Muylaert, K.; Rittmann, B.E.; Parra-Saldivar, R. Nutrients utilization and contaminants removal. A review of two approaches of algae and cyanobacteria in wastewater. Algal Res. 2017, 24, 438–449. [Google Scholar] [CrossRef]
  12. Oswald, W.J. My sixty years in applied algology. J. Appl. Phycol. 2003, 15, 99–106. [Google Scholar] [CrossRef]
  13. Brennan, L.; Owende, P. Biofuels from microalgae—A review of technologies for production, processing, and extractions of biofuels and co-products. Renew. Sustain. Energy Rev. 2010, 14, 557–577. [Google Scholar] [CrossRef]
  14. Shafiee, S.; Topal, E. A long-term view of worldwide fossil fuel prices. Appl. Energy 2010, 87, 988–1000. [Google Scholar] [CrossRef]
  15. Kumar, K.; Mishra, S.K.; Shrivastav, A.; Park, M.S.; Yang, J.-W. Recent trends in the mass cultivation of algae in raceway ponds. Renew. Sustain. Energy Rev. 2015, 51, 875–885. [Google Scholar] [CrossRef]
  16. Craggs, R.; Park, J.; Sutherland, D.; Heubeck, S. Economic construction and operation of hectare-scale wastewater treatment enhanced pond systems. J. Appl. Phycol. 2015, 27, 1913–1922. [Google Scholar] [CrossRef]
  17. Handler, R.M.; Canter, C.E.; Kalnes, T.N.; Lupton, F.S.; Kholiqov, O.; Shonnard, D.R.; Blowers, P. Evaluation of environmental impacts from microalgae cultivation in open-air raceway ponds: Analysis of the prior literature and investigation of wide variance in predicted impacts. Algal Res. 2012, 1, 83–92. [Google Scholar] [CrossRef]
  18. Dahmani, S.; Zerrouki, D.; Ramanna, L.; Rawat, I.; Bux, F. Cultivation of Chlorella pyrenoidosa in outdoor open raceway pond using domestic wastewater as medium in arid desert region. Bioresour. Technol. 2016, 219, 749–752. [Google Scholar] [CrossRef] [Green Version]
  19. Arias, D.M.; Uggetti, E.; García-Galán, M.J.; García, J. Cultivation and selection of cyanobacteria in a closed photobioreactor used for secondary effluent and digestate treatment. Sci. Total Environ. 2017, 587, 157–167. [Google Scholar] [CrossRef] [PubMed]
  20. Prajapati, S.K.; Kumar, P.; Malik, A.; Vijay, V.K. Bioconversion of algae to methane and subsequent utilization of digestate for algae cultivation: A closed loop bioenergy generation process. Bioresour. Technol. 2014, 158, 174–180. [Google Scholar] [CrossRef]
  21. Tredici, M.R.; Bassi, N.; Prussi, M.; Biondi, N.; Rodolfi, L.; Zittelli, G.C.; Sampietro, G. Energy balance of algal biomass production in a 1-ha “Green Wall Panel” plant: How to produce algal biomass in a closed reactor achieving a high Net Energy Ratio. Appl. Energy 2015, 154, 1103–1111. [Google Scholar] [CrossRef]
  22. Li, T.; Liu, L.-N.; Jiang, C.-D.; Liu, Y.-J.; Shi, L. Effects of mutual shading on the regulation of photosynthesis in field-grown sorghum. J. Photochem. Photobiol. B Biol. 2014, 137, 31–38. [Google Scholar] [CrossRef] [Green Version]
  23. Yan, C.; Luo, X.; Zheng, Z. Effects of various LED light qualities and light intensity supply strategies on purification of slurry from anaerobic digestion process by Chlorella vulgaris. Int. Biodeterior. Biodegrad. 2013, 79, 81–87. [Google Scholar] [CrossRef]
  24. Yan, C.; Muñoz, R.; Zhu, L.; Wang, Y. The effects of various LED (light emitting diode) lighting strategies on simultaneous biogas upgrading and biogas slurry nutrient reduction by using of microalgae Chlorella sp. Energy 2016, 106, 554–561. [Google Scholar] [CrossRef]
  25. Schulze, P.S.C.; Barreira, L.A.; Pereira, H.G.C.; Perales, J.A.; Varela, J.C.S. Light emitting diodes (LEDs) applied to microalgal production. Trends Biotechnol. 2014, 32, 422–430. [Google Scholar] [CrossRef]
  26. Wagner, I.; Steinweg, C.; Posten, C. Mono-and dichromatic LED illumination leads to enhanced growth and energy conversion for high-efficiency cultivation of microalgae for application in space. Biotechnol. J. 2016, 11, 1060–1071. [Google Scholar] [CrossRef]
  27. Zhao, Y.; Wang, J.; Zhang, H.; Yan, C.; Zhang, Y. Effects of various LED light wavelengths and intensities on microalgae-based simultaneous biogas upgrading and digestate nutrient reduction process. Bioresour. Technol. 2013, 136, 461–468. [Google Scholar] [CrossRef]
  28. Blair, M.F.; Kokabian, B.; Gude, V.G. Light and growth medium effect on Chlorella vulgaris biomass production. J. Environ. Chem. Eng. 2014, 2, 665–674. [Google Scholar] [CrossRef]
  29. Kang, D.; Kim, K.; Jang, Y.; Moon, H.; Ju, D.; Jahng, D. Nutrient removal and community structure of wastewater-borne algal-bacterial consortia grown in raw wastewater with various wavelengths of light. Int. Biodeterior. Biodegrad. 2018, 126, 10–20. [Google Scholar] [CrossRef]
  30. Jeong, H.; Lee, J.; Cha, M. Energy efficient growth control of microalgae using photobiological methods. Renew. Energy 2013, 54, 161–165. [Google Scholar] [CrossRef]
  31. Johkan, M.; Shoji, K.; Goto, F.; Hahida, S.; Yoshihara, T. Effect of green light wavelength and intensity on photomorphogenesis and photosynthesis in Lactuca sativa. Environ. Exp. Bot. 2012, 75, 128–133. [Google Scholar] [CrossRef]
  32. Terashima, I.; Fujita, T.; Inoue, T.; Chow, W.S.; Oguchi, R. Green light drives leaf photosynthesis more efficiently than red light in strong white light: Revisiting the enigmatic question of why leaves are green. Plant. Cell Physiol. 2009, 50, 684–697. [Google Scholar] [CrossRef]
Figure 1. Schematic diagram of a batch reactor for cultivation of microalgal–bacterial consortia.
Sustainability 11 02951 g001
Figure 2. Schematic diagram of a rectangular reactor for light transmittance study.
Sustainability 11 02951 g002
Figure 3. Schematic diagram of a batch reactor for inhibition of photosynthetic activities.
Sustainability 11 02951 g003
Figure 4. Reduction of transmittance at different light colors.
Sustainability 11 02951 g004
Figure 5. The oxygen production rate at low concentration of the microalgal– bacterial consortia where the light intensity is (a) 250, (b) 500, (c) 1000, and (d) 2000 μmol m−2 s−1.
Sustainability 11 02951 g005
Figure 6. The oxygen production rate at a high microalgal–bacterial consortia concentration, where the light intensity is (a) 1000, (b) 2000, and (c) 3000 μmol m−2 s−1.
Sustainability 11 02951 g006
Figure 7. The average oxygen production rate at low microalgal–bacterial consortia concentrations during the 54 min illumination period.
Sustainability 11 02951 g007
Figure 8. The average oxygen production rate at high microalgal–bacterial consortia concentrations during the 54 min illumination period.
Sustainability 11 02951 g008
Figure 9. Interaction between light intensity (μmol m−2 s−1) and color. (a) Low microalgal–bacterial consortia concentrations and (b) high microalgal–bacterial consortia concentrations.
Sustainability 11 02951 g009

