Article

Interactive Effects of Chemical Composition of Food Waste during Anaerobic Co-Digestion under Thermophilic Temperature

1
College of Agronomy, Northwest A & F University, Yangling 712100, China
2
Shaanxi Engineering Research Center of Circular Agriculture, Yangling 712100, China
*
Author to whom correspondence should be addressed.
Sustainability 2019, 11(10), 2933; https://doi.org/10.3390/su11102933
Submission received: 21 April 2019 / Revised: 19 May 2019 / Accepted: 20 May 2019 / Published: 23 May 2019

Abstract

:
The effects of chemical composition (carbohydrates, lipids, and protein) on the anaerobic co-digestion performance of food wastes (FW) were investigated from the viewpoints of methane production, dynamic parameters, and microbial community structure. The results of this study showed that a notable gasification rate was positively correlated with the proportion of the composition. A T2 reactor, which consisted of 60% carbohydrates, 20% lipids, and 20% protein, held a higher gasification rate of 65.09% compared to other groups, while its process parameters showed some deficiency regarding the stability of digestion, especially for low biochemical methane potential (BMP), which was not beneficial for the actual practice. A T4 reactor, with a highest gasification rate of 70.68%, held the maximum BMP (497.44 mL/g VS). The stable chemical parameters achieved the optimal proportion, consisting of 40% carbohydrates, 40% lipids, and 20% protein. Furthermore, its microbial populations were rich and achieved a balance of the two main dominant communities of acetoclastic methanogens and hydrogenotrophic methanogens, whose relative abundance was close. It was obvious that interactive effects were caused by different proportional composition, which led to constantly changing chemical parameters and microbial community.

1. Introduction

Organic waste, as the result of the ever-increasing numbers of human population and the intensification of livestock and agriculture, has caused severe environmental problems and resource wastage. Food waste (FW) is a large portion of organic waste and is not very satisfactory for landfill, composting, or animal feed due to its complex composition, high moisture, and perishability [1]. Anaerobic digestion (AD) is an environmentally friendly technology that has been widely used to solve organic waste problems, while producing clean energy and achieve sustainable development. Accordingly, the AD process of FW was extensively investigated in the laboratory and implemented in the industry.
FW for anaerobic digestion is a non-conservative substrate with high lipid, protein, and carbohydrate content [1]. The goal is the degradation of FW and AD is an effective way to achieve this. It achieves high biochemical methane production (BMP) of 467–529 mL/g VSadded (VS, volatile solid) due to its high protein and lipid content [2,3]. Moreover, other studies showed that lipid-rich FW has a higher BMP than carbohydrate-rich FW and protein-rich FW [4]. It has been suggested that AD with high lipid and protein contents of slaughterhouse wastes had a positive contributing effect to the methane yield, achieving 43% higher yield than expected and better microorganism environment balance [5]. When fish lipids (total concentration of 5%) was added to a cattle waste anaerobic reactor, the methane yield increased from 25–50 m3 biogas/m3 [6]. This means that mixing lipids with different substrates could enhance the performance of AD. However, some studies have shown that lipid-rich FW could inhibit the methanogenic activity due to long chain fatty acids (LCFAs) during lipid substrate decomposition [7,8]. The inhibitory effects are usually contributed by LCFAs, which are absorbed by the microbial biomass surface, thus causing mass transfer problems [9,10]. Cirne et al. [9] reported the acute inhibition by a lipid content of 31–47% (w/w, COD basis). Furthermore, Sun et al. [8] reported the strong inhibition when the lipid content reached 65% (w/w, VS basis). Except for lipid-rich FW, carbohydrate-rich and protein-rich FW causes various problems. Carbohydrate-rich FW yields more hydrogen and accelerates acidification due to unbalanced carbon/nitrogen (C/N) ratio and limited nutrient content [11,12]. Protein-rich FW is required to alleviate the high concentration of ammonia which inhibits methanogens [12]. Generally, the performance of FW for AD, was easily affected by composition and scarce trace elements in FW [13,14,15,16]. Thus, researching the mixing composition of FW for AD is contributing to improve AD performance.
The complex organic compounds in AD and FW rely on conversion into simpler and smaller molecules via nature-driven microbial processes to produce valuable energy sources and nutrients as well as minimizing waste [12]. Furthermore, due to synergistic effects, anaerobic co-digestion could realize the intensification of the specific methane yield of single substrates and the improvement of methane yield parameters [17]. Either way, the substrate composition had a decisive effect on microbial activity and community structure [10,18], thus indirectly effecting the lag phase, BMP, and stability [3,19]. With regard to the inner particulate organic matter, few reports show how composition proportion influences the yield and quality of biogas for FW in AD processes. Different researchers reported varied results because a universal conclusion about the interaction among different composition is missing.
This paper investigates how three principal components (carbohydrates, lipids, and proteins) of FW interact with each other and affect the methane production at different proportions. Interactive effects of these components on anaerobic digestion performance of FW were then analyzed from the viewpoints of methane production, dynamic model parameters (e.g., Rmax, λ), process parameters (e.g., pH, VFAs, NH4+-N), and microbial community (bacterial and archaeal community) under thermophilic temperature. In other words, the interactive effects among different composition-rich FW is investigated to provide a theoretical basis toward universal principles of co-digestion. Furthermore, it is important to provide a scheme that guides the mixture of different composition-rich materials for AD.

2. Materials and Methods

2.1. Inoculum and Substrate

The inoculum was obtained from a well-run mesophilic biogas digester in the local village of Yangling, China. Cattle manure (CM) was collected from a local cattle farm in Yangling, which had a C/N ratio of 15.51. Cooked rice (CR), waste pork (WP), and plant oil (PO) were collected from daily FW of the Nanyuan restaurant of the Northwest Agriculture and Forestry University (NWAFU), Yangling, Shaanxi, China. CR was collected and frozen daily and mixed before utilization. WP was separated daily from dishes and frozen for storage. After accumulation of the center amount, WP was mixed and minced. The characteristics of these substrates are shown in Table 1.

2.2. Experimental Design

Anaerobic batch co-digestion tests were conducted in triplicate at a thermophilic temperature (55 °C) for 45 days according to the method described by Wang et al. [20]. One-liter laboratory fabricated glass reactors of 700 mL working volume were placed in a thermostatic water bath to maintain the digestion system. The total concentration of substrates was 17.5 g VS/L under a substrate to inoculum ratio of 2:1 based on VS. The ratios of CR, WP, and PO were then adjusted according to the VS proportions of the three chemical composition (Table 2) and their contents in the raw substrates (Table 1).

2.3. Analytic Methods

2.3.1. Process Parameters Measurement

The APHA Standard Methods (1995) were used for the routine analysis conducted in this study, including total solid (TS), VS, total organic carbon (TOC), total organic nitrogen (TON), total ammonium nitrogen (TAN), and VFAs. Furthermore, crude carbohydrates, lipids, and proteins were measured and calculated according to the method of Ebner et al. [16]. The pH was measured via hand-held pH meter. The daily biogas volume was determined via water replacement method. A methane analyzer (Gasboard-3200P, Wuhan, China) was used to measure the methane content. IBM SPSS statistics software (Version 19) was used to analyze the relationship between the parameters via Pearson correlative analysis.

2.3.2. Microbial Community Measurement

The samples for DNA extraction and MiSeq sequencing of 16S rRNA gene amplicons were homogeneously mixed before collection. The Fast DNA Kit for Soil (MP Biomedicals, SantaAna, USA) was used to extract DNA from samples according to the manufacturer’s instructions. PCR amplification of bacterial and archaeal 16S rRNA gene used the universal primers 338F (5′-ACTCCTACGGGGAGGCAGCA-3′) and 806R (5′-GGACTACHVGGGTWTCTAAT-3′). Sequence amplification was conducted on Illumina’s MiSeq-PE250 platform by Personal Biotechnology Co., Ltd., Shanghai, China. The Greengenes database [21] was used as template sequences for classification and identification of operational taxonomic units (OTUs).

2.4. Modified Gompertz Model

The modified Gompertz equation (Equation (1)) was used to evaluate the dynamic characteristics of co-digestion, including lag phase, methane production potential and growth of microorganisms [22]:
M ( t ) = M 0 · exp { exp [ R m · e M 0 ( λ t ) + 1 ] }
where M(t) represents the cumulative methane yield (mL/g VS) at the anaerobic digestion time t (d); M0 represents the methane potential maximum production (mL/g VS); Rmax represents the maximum methane production rate (mL/g VS−d); λ represents the lag phase (d); t represents the duration of the assay (d); and e represents the Euler’s number (2.71828).

2.5. Gasification Rate

Gasification rate (GR) could be due to the synergistic effect, representing the positive direction of different substrate composition under anaerobic co-digestion [23]. The GR was calculated according to Equation (2) [24]:
Gasification   rate   =   Biochemical   methane   potential   ( BMP ) Theoretical   methane   potential   ( TMP ) × 100 %
In this study, the value of TMP was calculated via Equation (3), obtained for organic substrates as VFAs (as C2H4O2), lipids (as C57H104O6), carbohydrates (as C6H10O5), protein (C5H7NO2), and lignin (as C10H13O3) [23]:
TMP   ( mL CH 4 g VS )   =   373   VFA + 1014   Lipids + 415   Carbohydrates + 496   Protein + 727   Lignin 100

3. Results and Discussion

3.1. Methane Production

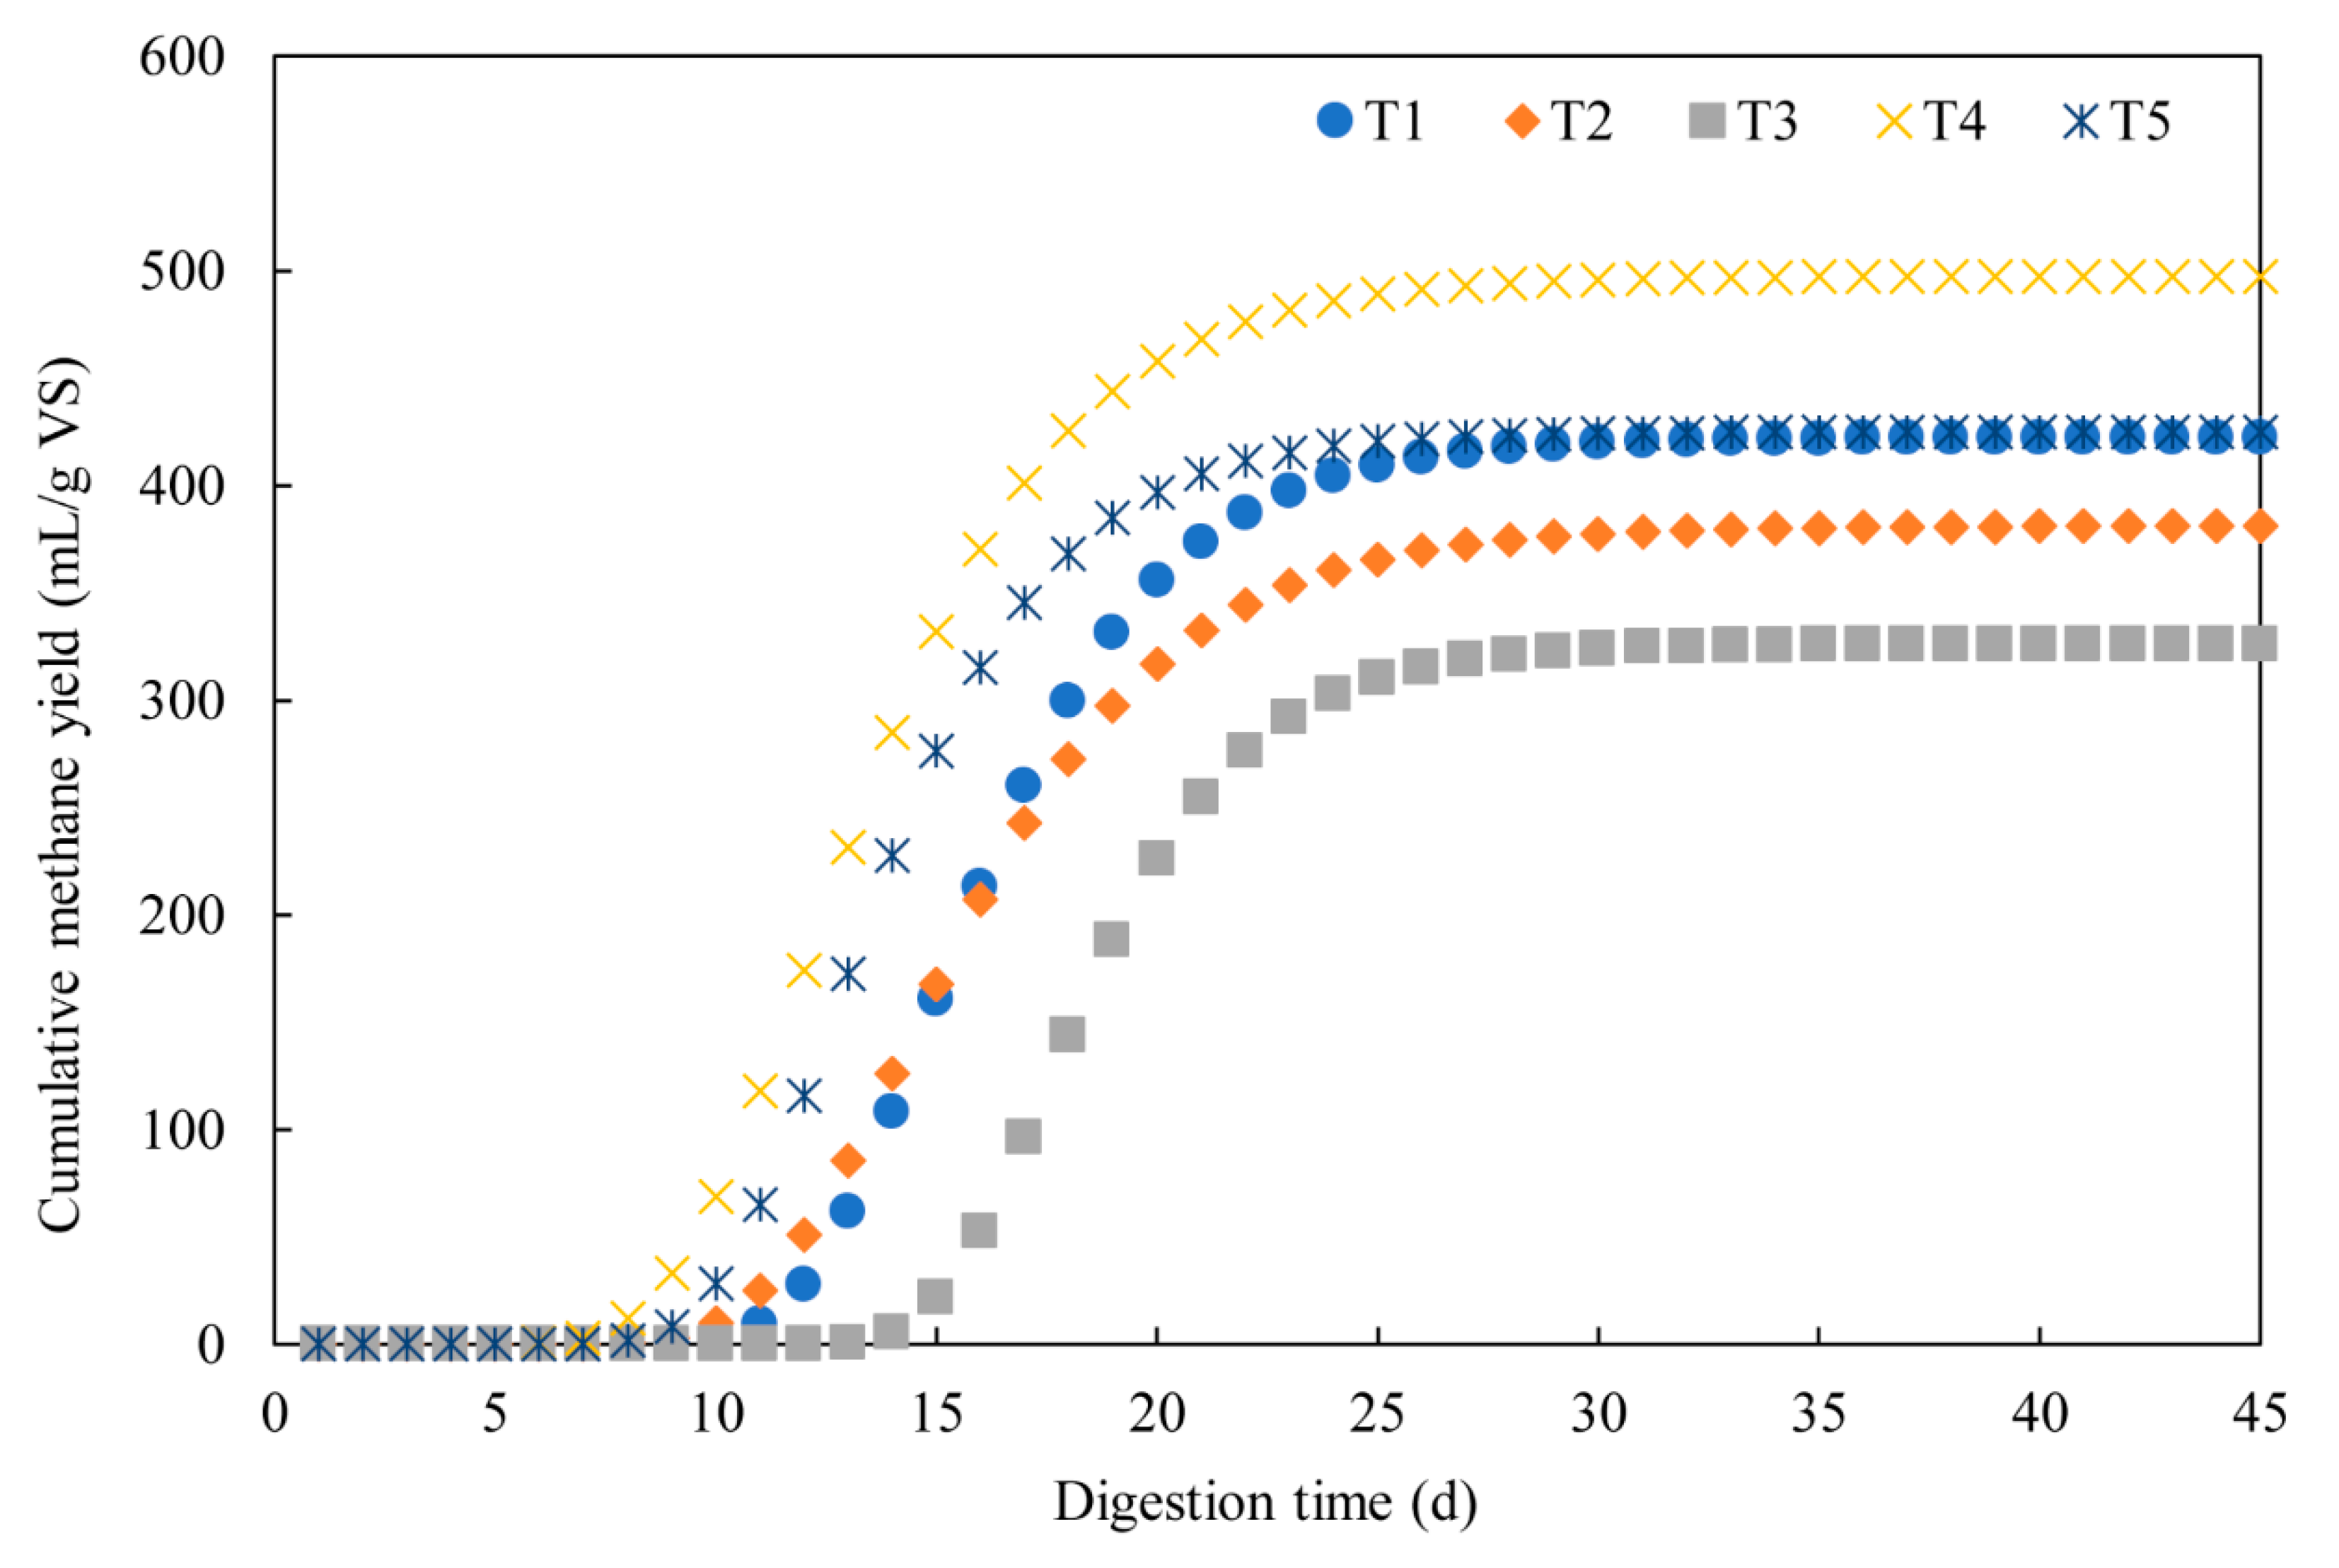
During the AD process, substrates with different chemical proportions showed various biogas and methane production patterns (Figure 1). T2 achieved the highest carbohydrate proportion and remained high levels of biogas and methane production during the early stage of fermentation from day 6 to day 25, with cumulative biogas and methane yields of 7361 mL and 5115.14 mL, respectively, during this period, accounting for 86.79% and 97.36% of the values obtained from the whole 45 days digestion. At the late stage, the daily methane production remained as low as 50 mL/d for T2, mainly attributed to its low lipid content. In comparison, T1 and T3 with low carbohydrate and high lipid and protein proportions produced the most biogas and methane from day 18 to day 35, accounting for 64.11% to 79.37% of the total values. T4 possessed relatively balanced chemical composition and showed three peaks at days 8, 14, and 20, with biogas and methane yields of 510 mL/d, 988 mL/d, 626 mL/d, and 327.42 mL/d, 713.34 mL/d, 443.83 mL/d, respectively. Throughout the whole fermentation process, T4 retained relatively high biogas and methane production levels, especially from days 7 to day 36. T4 had the longest peak period compared to other treatments. T4 and T5 had the same lipid content but different carbohydrate and protein proportions. T5 showed similar anaerobic digestion performance prior to day 15 and after day 23 compared to T4; however, from days 16 to day 22, T5 produced only about half the biogas and methane compared to T4. Evidently, the three principal components in substrates interact, which significantly affects their anaerobic co-digestion performance. In general, the results were similar to the reports that showed that the hydrolysis of carbohydrates is more rapid than the hydrolysis of proteins and lipids [8,24].
The BMP test was conducted to evaluate the methane production potential of substrates before and after co-digestion. The T4 reactor had the highest BMP of 497.44 mL/g VS, followed by T5, T1, and T2 reactors with BMP values of 424.96 mL/g VS, 422.25 mL/g VS, and 381.03 mL/g VS, respectively, and the lowest values by the T3 reactor with a value of 326.12 mL/g VS. However, for TMP, the highest value was obtained by the T1 reactor, followed by T3, T5, T4, and T2 reactors. It has been suggested that the BMPs of carbohydrate, protein, and lipid are 415, 496, and 1014 mL/g VS, respectively [4]. Thus, TMPs of the mixture sets were consistent with the lipid contents, as lipid achieved relatively higher BMP than protein and carbohydrate. However, the actual BMPs of the mixture sets were not consistent with their TMPs or the lipid contents. For example, the T1 reactor, with the highest lipid content of 70%, had the maximum TMP, but a lower BMP than T4 and T5 reactors, both of which had a lipid content of 50%. Accordingly, T4 and T5 both had higher GR, which reflected a better ratio of BMP to TMP than T1. Sun et al. [8] reported that, for a lipid concentration of 65% or higher, methane yields decreased sharply, pointing out that methane yields increased with increasing lipid concentration when it was below 60% [8]. Indeed, methane production was positively correlated with lipid reduction and increasing of the lipid ratio in the substrate would result in the growth of methane production [25]. Obviously, its content must be limited within a certain range to avoid inhibition by long chain fatty acids. Despite remaining within the safety range, T3 had a 20% higher lipid content than T2, but showed lower BMP and GR (Table 3). Consequently, the lipid content was not the solely factor affecting methane production. Higher proportion of protein in T3 might result in the accumulation of other primary inhibitors, such as ammonium nitrogen during protein breakdown, which might be the reason why T3 had a worse digestion performance. For T3, T4, and T5 with the same lipid contents, BMP, TMP, and GR values were positively correlated to carbohydrate contents but negatively correlated with protein contents. In other words, although lipid had the highest BMP of the three chemical composition, for food waste, high BMP, and GR strongly relied on the appropriate ratios of these chemical composition, as well as their interactive effects.
In general, the appropriate C/N ratio was used to enhance the performance of the anaerobic digestion, to improve the buffering capacity, to afford primary or secondary and trace nutrient elements, to dilute potential inhibitory or toxic composition, and the balance the system microenvironment [26]. Several reports agreed that the optimal value of C/N ratio ranges from 20–30 for anaerobic digestion [20,27]. Although the C/N ratios of five sets in this experiment exceeded the optimal range, synergistic effects among three principal composition were obvious according to the analysis of GR. From the viewpoint of C/N ratio, T1, and T4 reactors had similar C/N ratios, but were strongly different from GR. Since the T1 and T4 reactors had the same protein content, their difference in AD performance might be attributed to particularly high lipids in the T1 reactor, resulting in an inhibition of the methane production. For T3, T4, and T5 reactors, with increasing C/N ratio, GR increased. Thus, combined with the effects of C/N ratio and chemical composition in substrates on AD performance, although balanced C/N ratio is extremely essential for well-performed anaerobic digestion, the chemical composition were also important indictors for an optimized AD process. In summary, optimization of chemical composition and C/N ratios for better AD performance would be interesting and expected.

3.2. Dynamic Model Parameters

Figure 2 shows that the cumulative methane yield can simulate the methanogenic bacteria growth line. The cumulative methane yield increased rapidly after the lag phase, which reflects the delayed response of microbes including bacteria and archaea to change and adapt to the environment [5]. The maximum methane production rate (Rmax) of 58.23 mL/g VS−d was obtained at the T4 reactor, which was similar to that of the T5 reactor, both of which had the same lipid proportion of 50% VS (Table 4). Although the T3 reactor used the same ratio of lipids, it was 10.07 mL/g VS−d lower than the T4 reactor due to the high ratio of protein. The lag period time of the T3 reactor was 12.75 days, matching the research that the higher protein mass percentage in the substrate had the longer fermentation period [8,24]. Despite several studies reporting that protein can increase the methane content, it has been also suggested that hydrolyzing protein required sufficient time [4,24]. However, the maximum M0 of T4 reactor had the same protein ratio as the T1 reactor, which was 75.19 mL/g VS lower and took 5 days longer than the T4 reactor. The long λ can be the cause for the accumulation of VFAs and ammonia nitrogen [5], while short λ can be due to high activity and quantity of microorganisms that can quickly convert the VFAs into biogas [28]. Substrate composition played an important role in the activity of microbe and lag phase.

3.3. Chemical Parameters and Process Stability

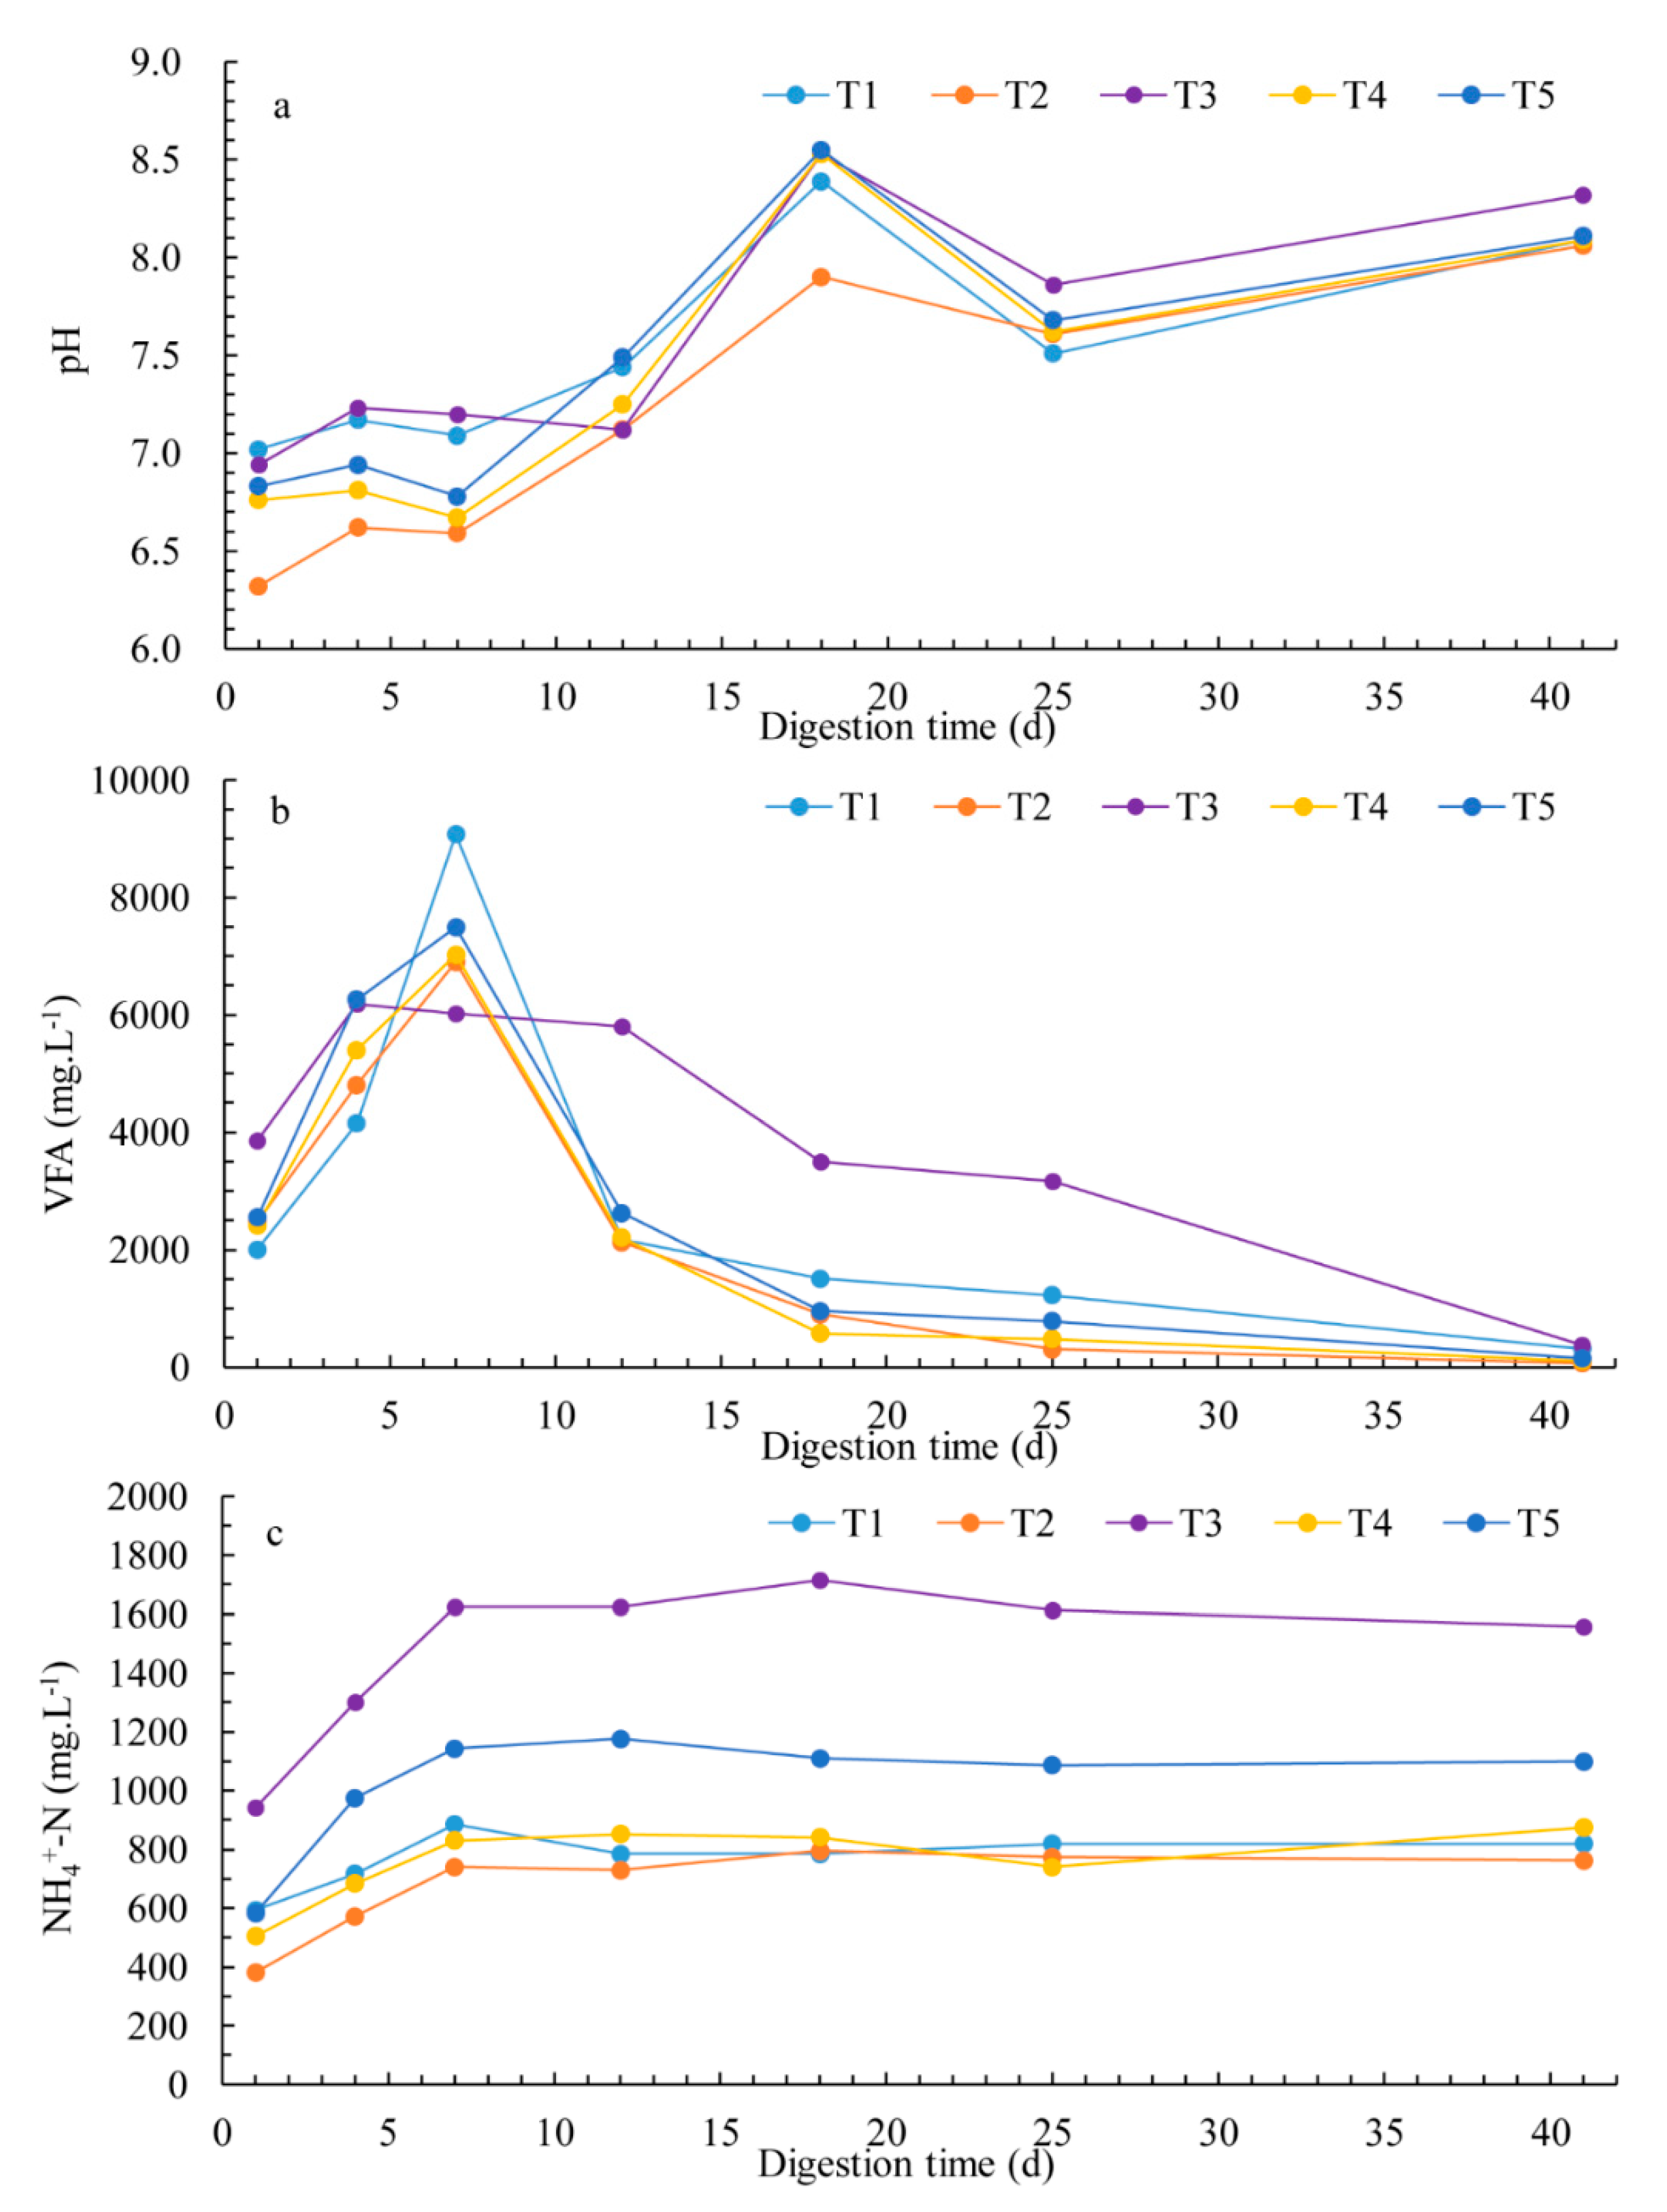
pH directly affects microorganism activity [29] and is one of the primary factors during anaerobic digestion process. According to Figure 3a, the variation trends were basically consistent in pH for all five reactors throughout the digestion process. Especially, the T2 reactor, with higher carbohydrate content, showed a lower pH value compared to other treatments. In general, high-carbohydrate substrate is readily acidified and led to the accumulation of VFAs, which results in a decreasing pH value. In contrast, high-protein substrate easily caused the increase of pH value due to ammonia nitrogen from protein hydrolysis. Thus, the T3 reactor with the highest content of protein showed an average pH value of 7.6, which was comparatively higher than those of other treatments.
Ammonia nitrogen could increase the system’s alkalinity and retain the pH balance and a stable environment. However, high ammonia also results in the inhibition of the digestive process [30]. As shown in Figure 3b, as a result of high protein content, the T3 reactor showed two times higher NH4+-N content compared to other groups with low protein content. Shi et al. [31] reported that hydrolyzing protein induced a continuous release of ammonia, which placed a premium on decreasing the activity of acidogenic bacteria and methanogens. Thus, the reason that the T3 reactor had relatively high theoretical methane potential but the lowest bio-methane potential and gasification rate could be explained. T1, T2, and T4 reactors had identical NH4+-N contents throughout the digestion process. However, compared to T2, the T5 reactor had the same protein proportion of 20%, but a 1.5-times higher NH4+-N content. The reason for this discrepancy might be because the T2 reactor had a lower pH as the result of high carbohydrate content, which negatively affected the activity of the acidogenic bacteria and, to some extent, inhibited the hypothesis of protein [30,32]. Thus, this interesting result reflected the existence of interactive effects among organic composition in the digesting system.
Organic substrates were dissolved and hydrolyzed, thus transformed into LCFAs, amino acids, and sugars. Then, they were decomposed into small molecule VFAs, such as acetate, propionate, and butyrate. The VFAs content of the fermentation system first increased and then decreased rapidly after seven days (Figure 3c). Although the T1 reactor had VFAs levels comparable to T2, T4, and T5 reactor after 12 days of digestion, the VFAs levels of the T1 reactor were lower on day four but achieved higher VFA accumulation on day seven compared to these groups. Carbohydrate had the highest, and lipid had the lowest, hydrolysis rates as the major components of anaerobic digestion [8,24]. Thus, for the substrate with low carbohydrate and high lipid content, methanogens would have a slow growth rate due to the lack of sufficient carbon supply during the early stage of the digestion process, which could lead to the accumulation of VFAs. Thus, the variable tendency of VFA levels for the T1 reactor compared to other groups could be explained by its lowest carbohydrate and highest lipid contents. The T3 reactor had higher VFA contents during the initial and late stages compared to other groups, which was obviously attributed to the ammonia inhibition on methanogens. T2 and T4 reactors had similar and lower VFA concentrations but higher GR than other groups, indicating that these two treatments possessed a suitable and stable digestion environment for high efficiency degradation and methanation of organic components. From the viewpoint of chemical properties during the co-digestion process, the change and differences of chemical parameters was significantly affected by the proportion of organic components. this further affected the biogas production and methane content. This was an interactive effect found among organic composition and their proportions that were evidently important for a stable environment and high gasification efficiency.

3.4. Microbial Responses to the Chemical Composition of FW

3.4.1. Performance of Bacterial Communities

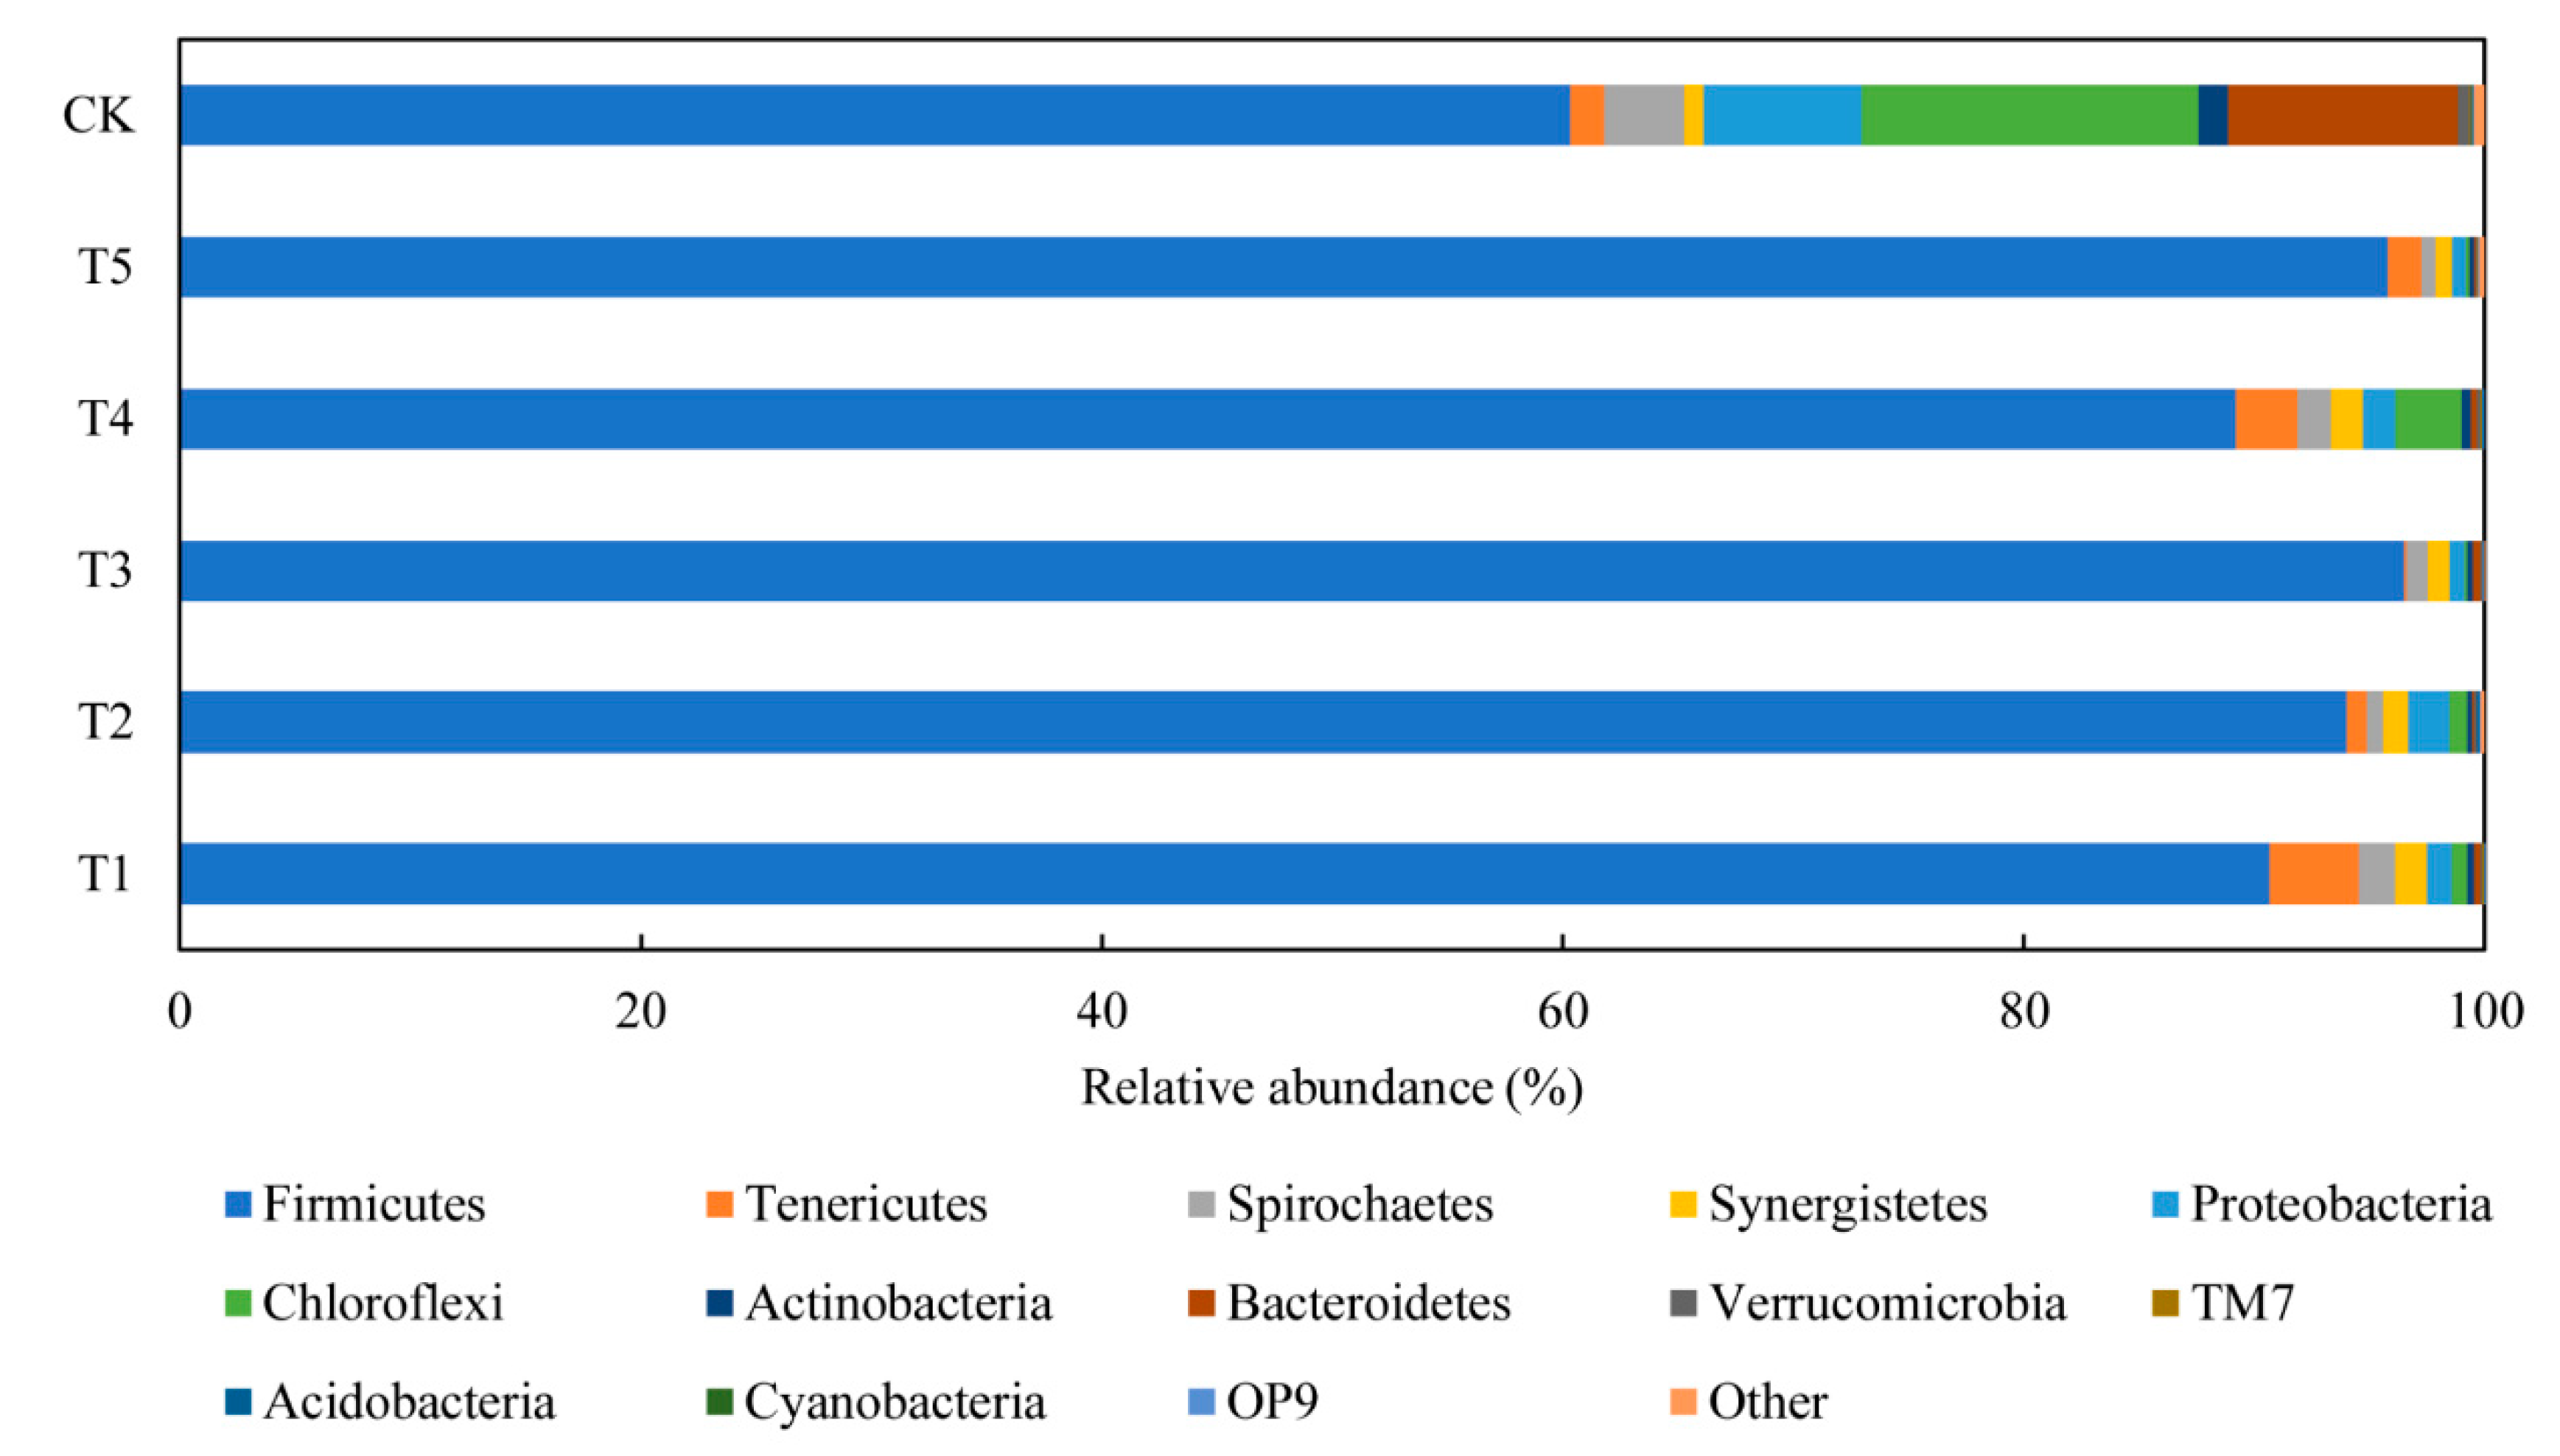
There are 2331 bacterial OTUs classified into 24 phyla and 263 genera. Then, a large majority of them were classified into Firmicutes with about 89.2%. The average relative abundances of Firmicutes for T1, T2, T3, T4, and T5 reactors were 90.7%, 94.2%, 96.5%, 89.2%, and 92.5%, respectively (Figure 4). This indicated that five reactors in this study may have achieved better digestion performance due to the predominance of Firmicutes and greater bacterial diversity [26]. For the others, these were assigned to six phyla and others, which were Chloroflexi (2.6%), Proteobacteria (1.8%), Tenericutes (1.7%), Bacteroidetes (1.5%), Spirochaetes (1.5%), and Synergistetes (1.0%). Identical to previous studies, we found that Firmicutes and Chloroflexi were able to degrade a large number of organic compounds under a variety of conditions and had been found in a wide range of co-digestion [26]. Illumina MiSeq results indicated that the uppermost bacteria were all affiliated to the phylum Firmicutes in the five reactors and in the control fed with different proportions of substrates. Members of Firmicutes have been reported as the dominant community in reactors [26]. Moreover, most of the data in Firmicutes were attributed to the class Clostridia viz. 76.7%, 80.1%, 84.5%, 74.8%, and 77.0%. Only few of them were affiliated with the class Bacilli with 12.0%, 13.1%, 10.6%, 13.2%, and 14.1% in turn. Thus, the species of Bacillus were significantly correlated with the concentration of protein in the reactor (p < 0.01). The variation of ammonia nitrogen in different proportions during the anaerobic digestion process in Figure 3b confirmed this relationship. T3 reactor with 60% protein and T5 reactor with 33.3% held a higher concentration of NH4+-N than other reactors. The dramatic proliferation of Clostridia, known as hydrogen producer, prompted the generation of excessive hydrogen. Hydrogen partial pressure likewise affected fermentation performances and final product composition [33]. It was reported that excessive hydrogen decreases hydrogenase enzyme activity and diverts metabolic pathways towards solvent production [33]. T4 had the lowest relative abundance of Clostridia with 74.8% and the highest BMP and GR, suggesting that more hydrogen was converted to methane. Moreover, Alibardi and Cossu [33] reported that the carbohydrate content of substrates related to hydrogen yield little. However, the carbohydrate content in the reactor did not correlate to Clostridia abundance due to different proportions of carbohydrate, protein, and lipids in this study.
Microorganisms (>1.0%) mainly pertain to Chloroflexi, Proteobacteria, Bacteroidetes, and Spirochaetes, except for Tenericutes and Synergistetes that are those that had a trend decrease in relative abundance after the change of composition of substrate, as indicated by a similar report by another researcher [34]. Chloroflexi found in T4 had the highest relative abundance (2.9%) in contrast to the other four reactors. Since Chloroflexi participates in carbohydrate degradation [35], the higher the proportion of carbohydrate, the greater the abundance. However, the relative abundance of T2 with carbohydrates of 50% VS was 0.8%, less than four-fold compared to T4. It has been reported that some species belonging to Chloroflexi are associated with hydrogenotrophilic methanogens [35]. However, Chloroflexi abundance was sensitive to pH fluctuation. The pH value of the T3 reactor fluctuated dramatically, resulting in a low relative abundance of Chloroflexi with 0.1%. On the other hand, the relative abundance of Tenericutes showed a significant relationship with the concentration of lipid (p < 0.01). Furthermore, it was also correlated with TMP and DMP (p < 0.05). With increasing lipid content, Tenericutes abundance kept growing, which was a failure indicator in AD with FW [36]. Its abundance showed a correlation with C/N (p < 0.05). Consequently, those changes inhibited the methanogens community and proceeded to the next step of methane product. The results indicate that there may be an interaction among substrates that could significantly affect the microorganism community.
Bacteria are responsible for the degradation for different composition proportions to intermediate metabolites. Those intermediate metabolites can be later utilized by methanogens.

3.4.2. Performance of Archaeal Communities

Both the bacterial and archaeal community structure was influenced by the co-digestion of different proportions of substrates [37]. Furthermore, it was also reported that archaeal communities would be altered by bacterial populations [26]. Thus, to help provide the required evidence, clarifying the relationship between archaeal community structure and composition proportions is necessary. The archaeal community at the end of fermentation were analyzed. The rarefaction curves of the six samples indicated that the sequencing depth for archaeal was sufficient to cover almost the whole diversity. A total of 6783 archaeal OTUs were classified into three phyla, belonging to Euryarchaeota, Crenarchaeota, Parvarchaeota, and others. For Euryarchaeota and Crenarchaeota, the relative abundances were 85.0%, 85.0%, 83.4%, 51.1%, and 85.1% and 14.9%, 14.8%, 16.3%, 48.6%, and 14.6%, for T1 to T5, respectively. A significant divergence was found among the six reactors where T4 was obviously different from other reactors, whose relative abundance was half of that of others for Euryarchaeota and three times greater for Crenarchaeota. For T4, the relative abundances of Euryarchaeota (51.1%) and Crenarchaeota (48.6%) was similar. This implied that the archaeal microorganisms had a balanced development, thus, achieving better coordination at the condition of T4 proportion substrates.
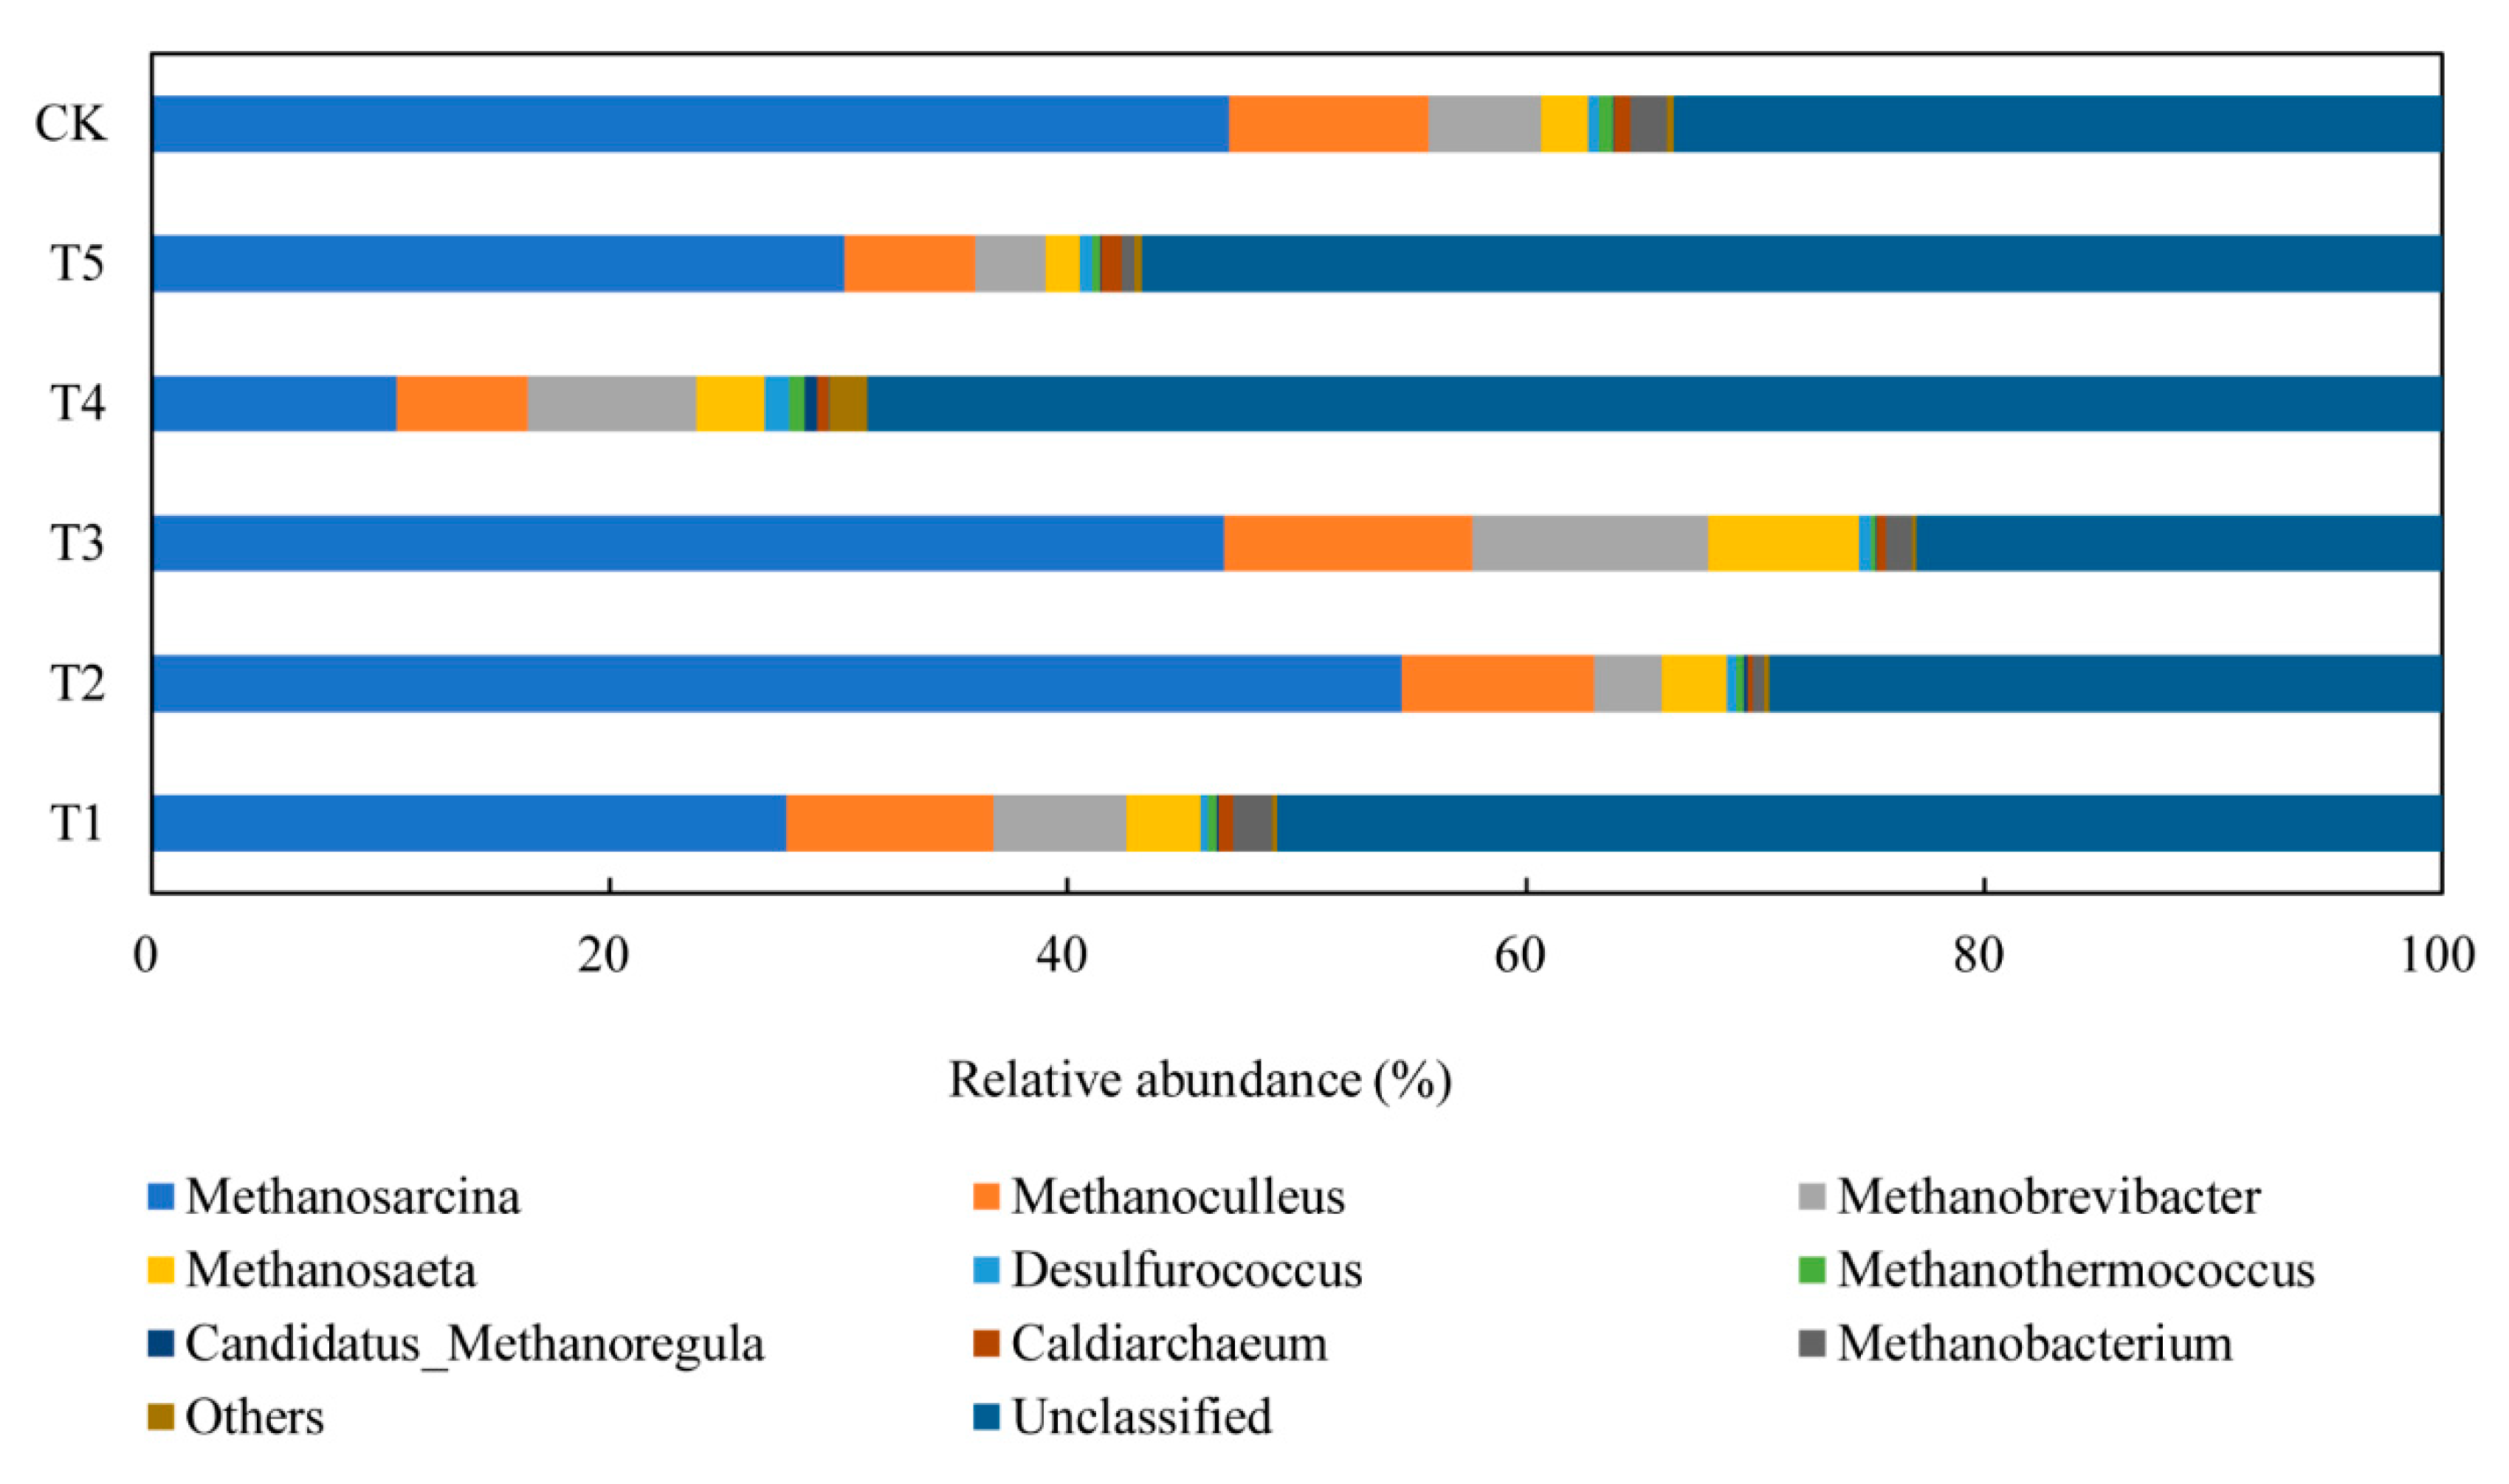
At the genus level, there were more than half of archaea reads, which matched unclassified microorganisms (62.5%). To facilitate the discussion, we classified genus except for unclassified on the basis of their relative abundance as: predominant (>5%), abundant (>1%), medium (>0.5%), rare (>0.01%), and very rare (≤0.01%) according to De Francisci et al. [35]. Rare and very rare were not considered in this study. Relative abundances above 0.5% at genus level were used to build a histogram (Figure 5). The predominant genera identified were Methanosarcina, Methanosaeta, Methanoculleus, and Methanobrevibacter originating from Euryarchaeota in the five reactors. Most of the CH4 is produced by mainly two types, namely acetoclastic and hydrogenotrophic [9]. According to Zabranska and Pokorna [38], acetoclastic methanogens belong to Methanosarcina and Methanosaeta; Methanobrevibacter and Methanoculleus are the most commonly identified hydrogenotrophic methanogens. Taxonomic analysis showed that there were no notable changes of methanogens composition among different composition proportions but a distinct difference in the relative abundance of each genus.
Methanosarcina and Methanosaeta affiliated with acetoclastic methanogens occupied 27.8%, 54.6%, 46.9%, 10.7%, and 30.2% and 3.3%, 2.8%, 6.5%, 3.0%, and 1.5% in the five reactors, respectively. This clearly indicated that methanogen abundance in T4 followed a tremendous difference compared to the others. Methanosarcina in T4 had only 10.7%, which was below 2.6-fold in T1, 5.1-fold in T2, 4.1-fold in T3, and 2.8-fold in T5. Methanosarcina, the main member in all the reactors, are mainly acetoclastic methanogens [35] with the ability to sustain hydrogenotrophic and methylotrophic [39] methanogenesis. Clearly, the substrate proportion affected the hydrolysis rate, which could result the relative abundance of Methanosarcina. Especially, Methanosarcina abundance was negatively correlated with BMP (p < 0.05), which indicates that their lower abundance in the reactor would lead to more methane production in the T4 reactor. Methanosaeta’s relative abundance was generally lower than that of Methanosarcina in each reactor. Many studies demonstrated that Methanosarcina and Methanosaeta were competitive genera in AD [26]. Methanosarcina is more tolerant to inhibitors than Methanosaeta, e.g., it has a higher growth rate and tolerance to pH changes [38]. Thus, the abundance of Methanosaeta would change with varying pH during the digestion process. Its abundance was positively correlated with pH (p < 0.05). Another reason is that Methanosaeta can only use acetate for CH4 production, but low concentrations of acetate favors its growth. Therefore, the result suggested that the T5 reactor had a higher acetate concentration and its two genera differed 20.1 times. Acetate supplied nutrition for Methanosarcina metabolism and also significantly increased when Methanosarcina increased [26]. It is generally recognized that carbohydrates have the fastest hydrolysis. T2 had the maximum proportion of carbohydrate with 50% VS and the maximal Methanosarcina relative abundance with 54.6%. However, its BMP and gasification rate were lower than those of T4. It has been reported that the AD rate is limited by methanogenesis rather than by hydrolysis due to the rapid acidification of substrates to VFAs, resulting in a rapid decrease in pH and process inhibition of methanogens activity [38]. In fact, the pH of T2 was lower than the value during the corresponding period. Furthermore, this was mainly caused by the acid resistance of some Firmicutes species, especially Clostridium which can grow at low pH.
Universally, structure determines function. Archaeal community structure influenced methane yield via different relative abundance of acetoclastic methanogens and hydrogenotrophic methanogens (Table 5). The relative abundance of the dominant population of two types of metabolic pathways is shown in Table 5. Consequently, the two types of relative abundance of T4 reactor were 13.7% and 13.0%. Moreover, a negative correlation was found between actoclastic methanogens and BMP (p < 0.05) in this study. T4 reactor composition proportion could buffer ammonia and VFAs to adjust the pH and reduce the inhibition of acidification to methanogens, while it could also balance the dominant population of the main two metabolic pathways. The similar relative abundance means that two types of methanogens could be supplementary and competitive to each other. These micro-environmental niches are in favor of methane yield and other products. Furthermore, the species richness, measured via OTUs’ rank abundance curve and chao1, suggests that the T4 reactor had the more abundant microorganisms and more diversity (Table 6). The T4 reactor had an optimal internal micro-environment that coordinated the balanced development of various microorganisms. Due to the competitive, exploitative, and cooperative relationships, predominant microorganisms are enabled to balance the population in an attempt to take over the metabolic niche. This improved the diversity of the AD system, thus, ensuring the stability and increase of the methane yield.
Furthermore, this clearly indicates that composition proportions played essential roles in influencing the archaeal community structure. This affected the final methane yield and anaerobic products.

4. Conclusions

The chemical composition significantly affects the anaerobic co-digestion performance of FW. Although lipids have the highest bio-methane potential, the actual methane production was not consistent with its content in the substrate, due to the existence of interactive effects among organic composition in the digesting system. The result indicates that the highest gasification rate, due to the synergistic effect, was obtained at a ratio of 40:40:20 for carbohydrates, lipids, and proteins. In conclusion, co-substrates with optimum proportion of carbohydrates, lipids, and proteins were dominant in terms of balancing of acidification and methanation, thus, providing an optimal micro-environment and forming a favorable niche for microorganisms. For actual production, this study can guide biogas plants to pay attention to adjusting the proportion of organic composition when using FW for AD, thereby improving the performance of AD, increasing biogas yield, and improving the degradation rate of organic solids.

Author Contributions

X.W. designed the research, analyzed the data, and revised the paper; S.X. performed the research, analyzed data, and wrote the paper; N.Z. performed the research; and J.S. performed the research. All authors read and approved the final manuscript.

Funding

This research was funded by National Natural Science Foundation of China (51508467), the Natural Science Foundation of Shaanxi Province (2016JQ4007), and the China Postdoctoral Science Foundation (2016T90950, 2015M582708).

Acknowledgments

This work was financially supported by National Natural Science Foundation of China (51508467), the Natural Science Foundation of Shaanxi Province (2016JQ4007), and the China Postdoctoral Science Foundation (2016T90950, 2015M582708). This work was also supported by Young Scholar Development Supporting Program from NAFU. A special thanks to Lu Xingang for his advice and help for this research.

Conflicts of Interest

No conflict of interest exits in the submission of this manuscript, and manuscript is approved by all authors for publication. I would like to declare on behalf of my co-authors that the work described was original research that has not been published previously, and not under consideration for publication elsewhere, in whole or in part. All the authors listed have approved the manuscript that is enclosed.

References

  1. Zhang, W.; Zhang, L.; Li, A. Anaerobic co-digestion of food waste with MSW incineration plant fresh leachate: Process performance and synergistic effects. Chem. Eng. J. 2015, 259, 795–805. [Google Scholar] [CrossRef]
  2. Browne, J.D.; Murphy, J.D. The impact of increasing organic loading in two phase digestion of food waste. Renew. Energy 2014, 71, 69–76. [Google Scholar] [CrossRef]
  3. Pages-Diaz, J.; Pereda-Reyes, I.; Taherzadeh, M.J.; Sarvari-Horvath, I.; Lundin, M. Anaerobic co-digestion of solid slaughterhouse wastes with agro-residues: Synergistic and antagonistic interactions determined in batch digestion assays. Chem. Eng. J. 2014, 245, 89–98. [Google Scholar] [CrossRef] [Green Version]
  4. Ohemeng-Ntiamoah, J.; Datta, T. Evaluating analytical methods for the characterization of lipids, proteins and carbohydrates in organic substrates for anaerobic co-digestion. Bioresour. Technol. 2018, 247, 697–704. [Google Scholar] [CrossRef] [PubMed]
  5. Mao, C.L.; Wang, X.J.; Xi, J.C.; Feng, Y.Z.; Ren, G.X. Linkage of kinetic parameters with process parameters and operational conditions during anaerobic digestion. Energy 2017, 135, 352–360. [Google Scholar] [CrossRef]
  6. Ahring, B.K. Perspectives for anaerobic digestion. Adv. Biochem. Eng. Biotechnol. 2003, 81, 1–30. [Google Scholar]
  7. Li, N.; He, J.; Yan, H.; Chen, S.; Dai, X. Pathways in bacterial and archaeal communities dictated by ammonium stress in a high solid anaerobic digester with dewatered sludge. Bioresour. Technol. 2017, 241, 95–102. [Google Scholar] [CrossRef]
  8. Sun, Y.; Wang, D.; Yan, J.; Qiao, W.; Wang, W.; Zhu, T. Effects of lipid concentration on anaerobic co-digestion of municipal biomass wastes. Waste Manag. 2014, 34, 1025–1034. [Google Scholar] [CrossRef] [PubMed]
  9. Cirne, D.G.; Paloumet, X.; Björnsson, L.; Alves, M.M.; Mattiasson, B. Anaerobic digestion of lipid-rich waste—Effects of lipid concentration. Renew. Energy 2007, 32, 965–975. [Google Scholar] [CrossRef]
  10. Wagner, A.O.; Lins, P.; Malin, C.; Reitschuler, C.; Illmer, P. Impact of protein-, lipid- and cellulose-containing complex substrates on biogas production and microbial communities in batch experiments. Sci. Total Environ. 2013, 458–460, 256–266. [Google Scholar] [CrossRef] [PubMed]
  11. Cook, S.M.; Skerlos, S.J.; Raskin, L.; Love, N.G. A stability assessment tool for anaerobic codigestion. Water Res. 2017, 112, 19–28. [Google Scholar] [CrossRef] [PubMed]
  12. Paritosh, K.; Mathur, S.; Pareek, N.; Vivekanand, V. Feasibility study of waste (d) potential: Co-digestion of organic wastes, synergistic effect and kinetics of biogas production. Int. J. Environ. Sci. Technol. 2017, 15, 1009–1018. [Google Scholar] [CrossRef]
  13. Mendez-Acosta, H.O.; Campos-Rodriguez, A.; Gonzalez-Alvarez, V.; Garcia-Sandoval, J.P.; Snell-Castro, R.; Latrille, E. A hybrid cascade control scheme for the VFA and COD regulation in two-stage anaerobic digestion processes. Bioresour. Technol. 2016, 218, 1195–1202. [Google Scholar] [CrossRef] [PubMed]
  14. Jiang, Y.; Dennehy, C.; Lawlor, P.G.; Hu, Z.; Zhan, X.; Gardiner, G.E. Inactivation of enteric indicator bacteria and system stability during dry co-digestion of food waste and pig manure. Sci. Total Environ. 2018, 612, 293–302. [Google Scholar] [CrossRef]
  15. Chinellato, G.; Cavinato, C.; Bolzonella, D.; Heaven, S.; Banks, C.J. Biohydrogen production from food waste in batch and semi-continuous conditions: Evaluation of a two-phase approach with digestate recirculation for pH control. Int. J. Hydrogen Energy 2013, 38, 4351–4360. [Google Scholar] [CrossRef] [Green Version]
  16. Ebner, J.H.; Labatut, R.A.; Lodge, J.S.; Williamson, A.A.; Trabold, T.A. Anaerobic co-digestion of commercial food waste and dairy manure: Characterizing biochemical parameters and synergistic effects. Waste Manag. 2016, 52, 286–294. [Google Scholar] [CrossRef] [PubMed]
  17. Xie, S.H.; Wickham, R.; Nghiem, L.D. Synergistic effect from anaerobic co-digestion of sewage sludge and organic wastes. Int. Biodeterior. Biodegrad. 2017, 116, 191–197. [Google Scholar] [CrossRef]
  18. Palatsi, J.; Vinas, M.; Guivernau, M.; Fernandez, B.; Flotats, X. Anaerobic digestion of slaughterhouse waste: Main process limitations and microbial community interactions. Bioresour. Technol. 2011, 102, 2219–2227. [Google Scholar] [CrossRef] [PubMed]
  19. Qin, Y.; Wu, J.; Xiao, B.; Hojo, T.; Li, Y.-Y. Biogas recovery from two-phase anaerobic digestion of food waste and paper waste: Optimization of paper waste addition. Sci. Total Environ. 2018, 634, 1222–1230. [Google Scholar] [CrossRef]
  20. Wang, X.; Yang, G.; Feng, Y.; Ren, G.; Han, X. Optimizing feeding composition and carbon-nitrogen ratios for improved methane yield during anaerobic co-digestion of dairy, chicken manure and wheat straw. Bioresour. Technol. 2012, 120, 78–83. [Google Scholar] [CrossRef]
  21. The Greengenes Database. Available online: http://greengenes.secondgenome.com/ (accessed on 23 May 2019).
  22. Mao, C.; Zhang, T.; Wang, X.; Feng, Y.; Ren, G.; Yang, G. Process performance and methane production optimizing of anaerobic co-digestion of swine manure and corn straw. Sci. Rep. 2017, 7, 9379. [Google Scholar] [CrossRef]
  23. Elsayed, M.; Andres, Y.; Blel, W.; Gad, A.; Ahmed, A. Effect of vs. organic loads and buckwheat husk on methane production by anaerobic co-digestion of primary sludge and wheat straw. Energy Convers. Manag. 2016, 117, 538–547. [Google Scholar] [CrossRef]
  24. Elbeshbishy, E.; Nakhla, G. Batch anaerobic co-digestion of proteins and carbohydrates. Bioresour. Technol. 2012, 116, 170–178. [Google Scholar] [CrossRef]
  25. Li, Y.; Jin, Y.; Borrion, A.; Li, H.; Li, J. Effects of organic composition on mesophilic anaerobic digestion of food waste. Bioresour. Technol. 2017, 244, 213–224. [Google Scholar] [CrossRef]
  26. Xu, R.; Zhang, K.; Liu, P.; Khan, A.; Xiong, J.; Tian, F.; Li, X. A critical review on the interaction of substrate nutrient balance and microbial community structure and function in anaerobic co-digestion. Bioresour. Technol. 2018, 247, 1119–1127. [Google Scholar] [CrossRef]
  27. Wang, Q.; Peng, L.; Su, H. The effect of a buffer function on the semi-continuous anaerobic digestion. Bioresour. Technol. 2013, 139, 43–49. [Google Scholar] [CrossRef]
  28. Astals, S.; Batstone, D.J.; Mata-Alvarez, J.; Jensen, P.D. Identification of synergistic impacts during anaerobic co-digestion of organic wastes. Bioresour. Technol. 2014, 169, 421–427. [Google Scholar] [CrossRef] [Green Version]
  29. Mao, C.L.; Feng, Y.Z.; Wang, X.J.; Ren, G.X. Review on research achievements of biogas from anaerobic digestion. Renew. Sustain. Energy Rev. 2015, 45, 540–555. [Google Scholar] [CrossRef]
  30. Aboudi, K.; Alvarez-Gallego, C.J.; Romero-Garcia, L.I. Influence of total solids concentration on the anaerobic co-digestion of sugar beet by-products and livestock manures. Sci. Total Environ. 2017, 586, 438–445. [Google Scholar] [CrossRef] [PubMed]
  31. Shi, X.; Lin, J.; Zuo, J.; Li, P.; Li, X.; Guo, X. Effects of free ammonia on volatile fatty acid accumulation and process performance in the anaerobic digestion of two typical bio-wastes. J. Environ. Sci. (China) 2017, 55, 49–57. [Google Scholar] [CrossRef] [PubMed]
  32. Tian, H.; Fotidis, I.A.; Kissas, K.; Angelidaki, I. Effect of different ammonia sources on aceticlastic and hydrogenotrophic methanogens. Bioresour. Technol. 2018, 250, 390–397. [Google Scholar] [CrossRef] [Green Version]
  33. Alibardi, L.; Cossu, R. Effects of carbohydrate, protein and lipid content of organic waste on hydrogen production and fermentation products. Waste Manag. 2016, 47, 69–77. [Google Scholar] [CrossRef]
  34. Lee, J.T.E.; He, J.; Tong, Y.W. Acclimatization of a mixed-animal manure inoculum to the anaerobic digestion of Axonopus compressus reveals the putative importance of Mesotoga infera and Methanosaeta concilii as elucidated by DGGE and Illumina MiSeq. Bioresour. Technol. 2017, 245, 1148–1154. [Google Scholar] [CrossRef]
  35. De Francisci, D.; Kougias, P.G.; Treu, L.; Campanaro, S.; Angelidaki, I. Microbial diversity and dynamicity of biogas reactors due to radical changes of feedstock composition. Bioresour. Technol. 2015, 176, 56–64. [Google Scholar] [CrossRef]
  36. Wang, P.; Wang, H.; Qiu, Y.; Ren, L.; Jiang, B. Microbial characteristics in anaerobic digestion process of food waste for methane production-A review. Bioresour. Technol. 2018, 248, 29–36. [Google Scholar] [CrossRef]
  37. Jimenez, J.; Aemig, Q.; Doussiet, N.; Steyer, J.P.; Houot, S.; Patureau, D. A new organic matter fractionation methodology for organic wastes: Bioaccessibility and complexity characterization for treatment optimization. Bioresour. Technol. 2015, 194, 344–353. [Google Scholar] [CrossRef]
  38. Zabranska, J.; Pokorna, D. Bioconversion of carbon dioxide to methane using hydrogen and hydrogenotrophic methanogens. Biotechnol. Adv. 2018, 36, 707–720. [Google Scholar] [CrossRef]
  39. Demirel, B.; Scherer, P. The roles of acetotrophic and hydrogenotrophic methanogens during anaerobic conversion of biomass to methane: A review. Rev. Environ. Sci. Bio/Technol. 2008, 7, 173–190. [Google Scholar] [CrossRef]
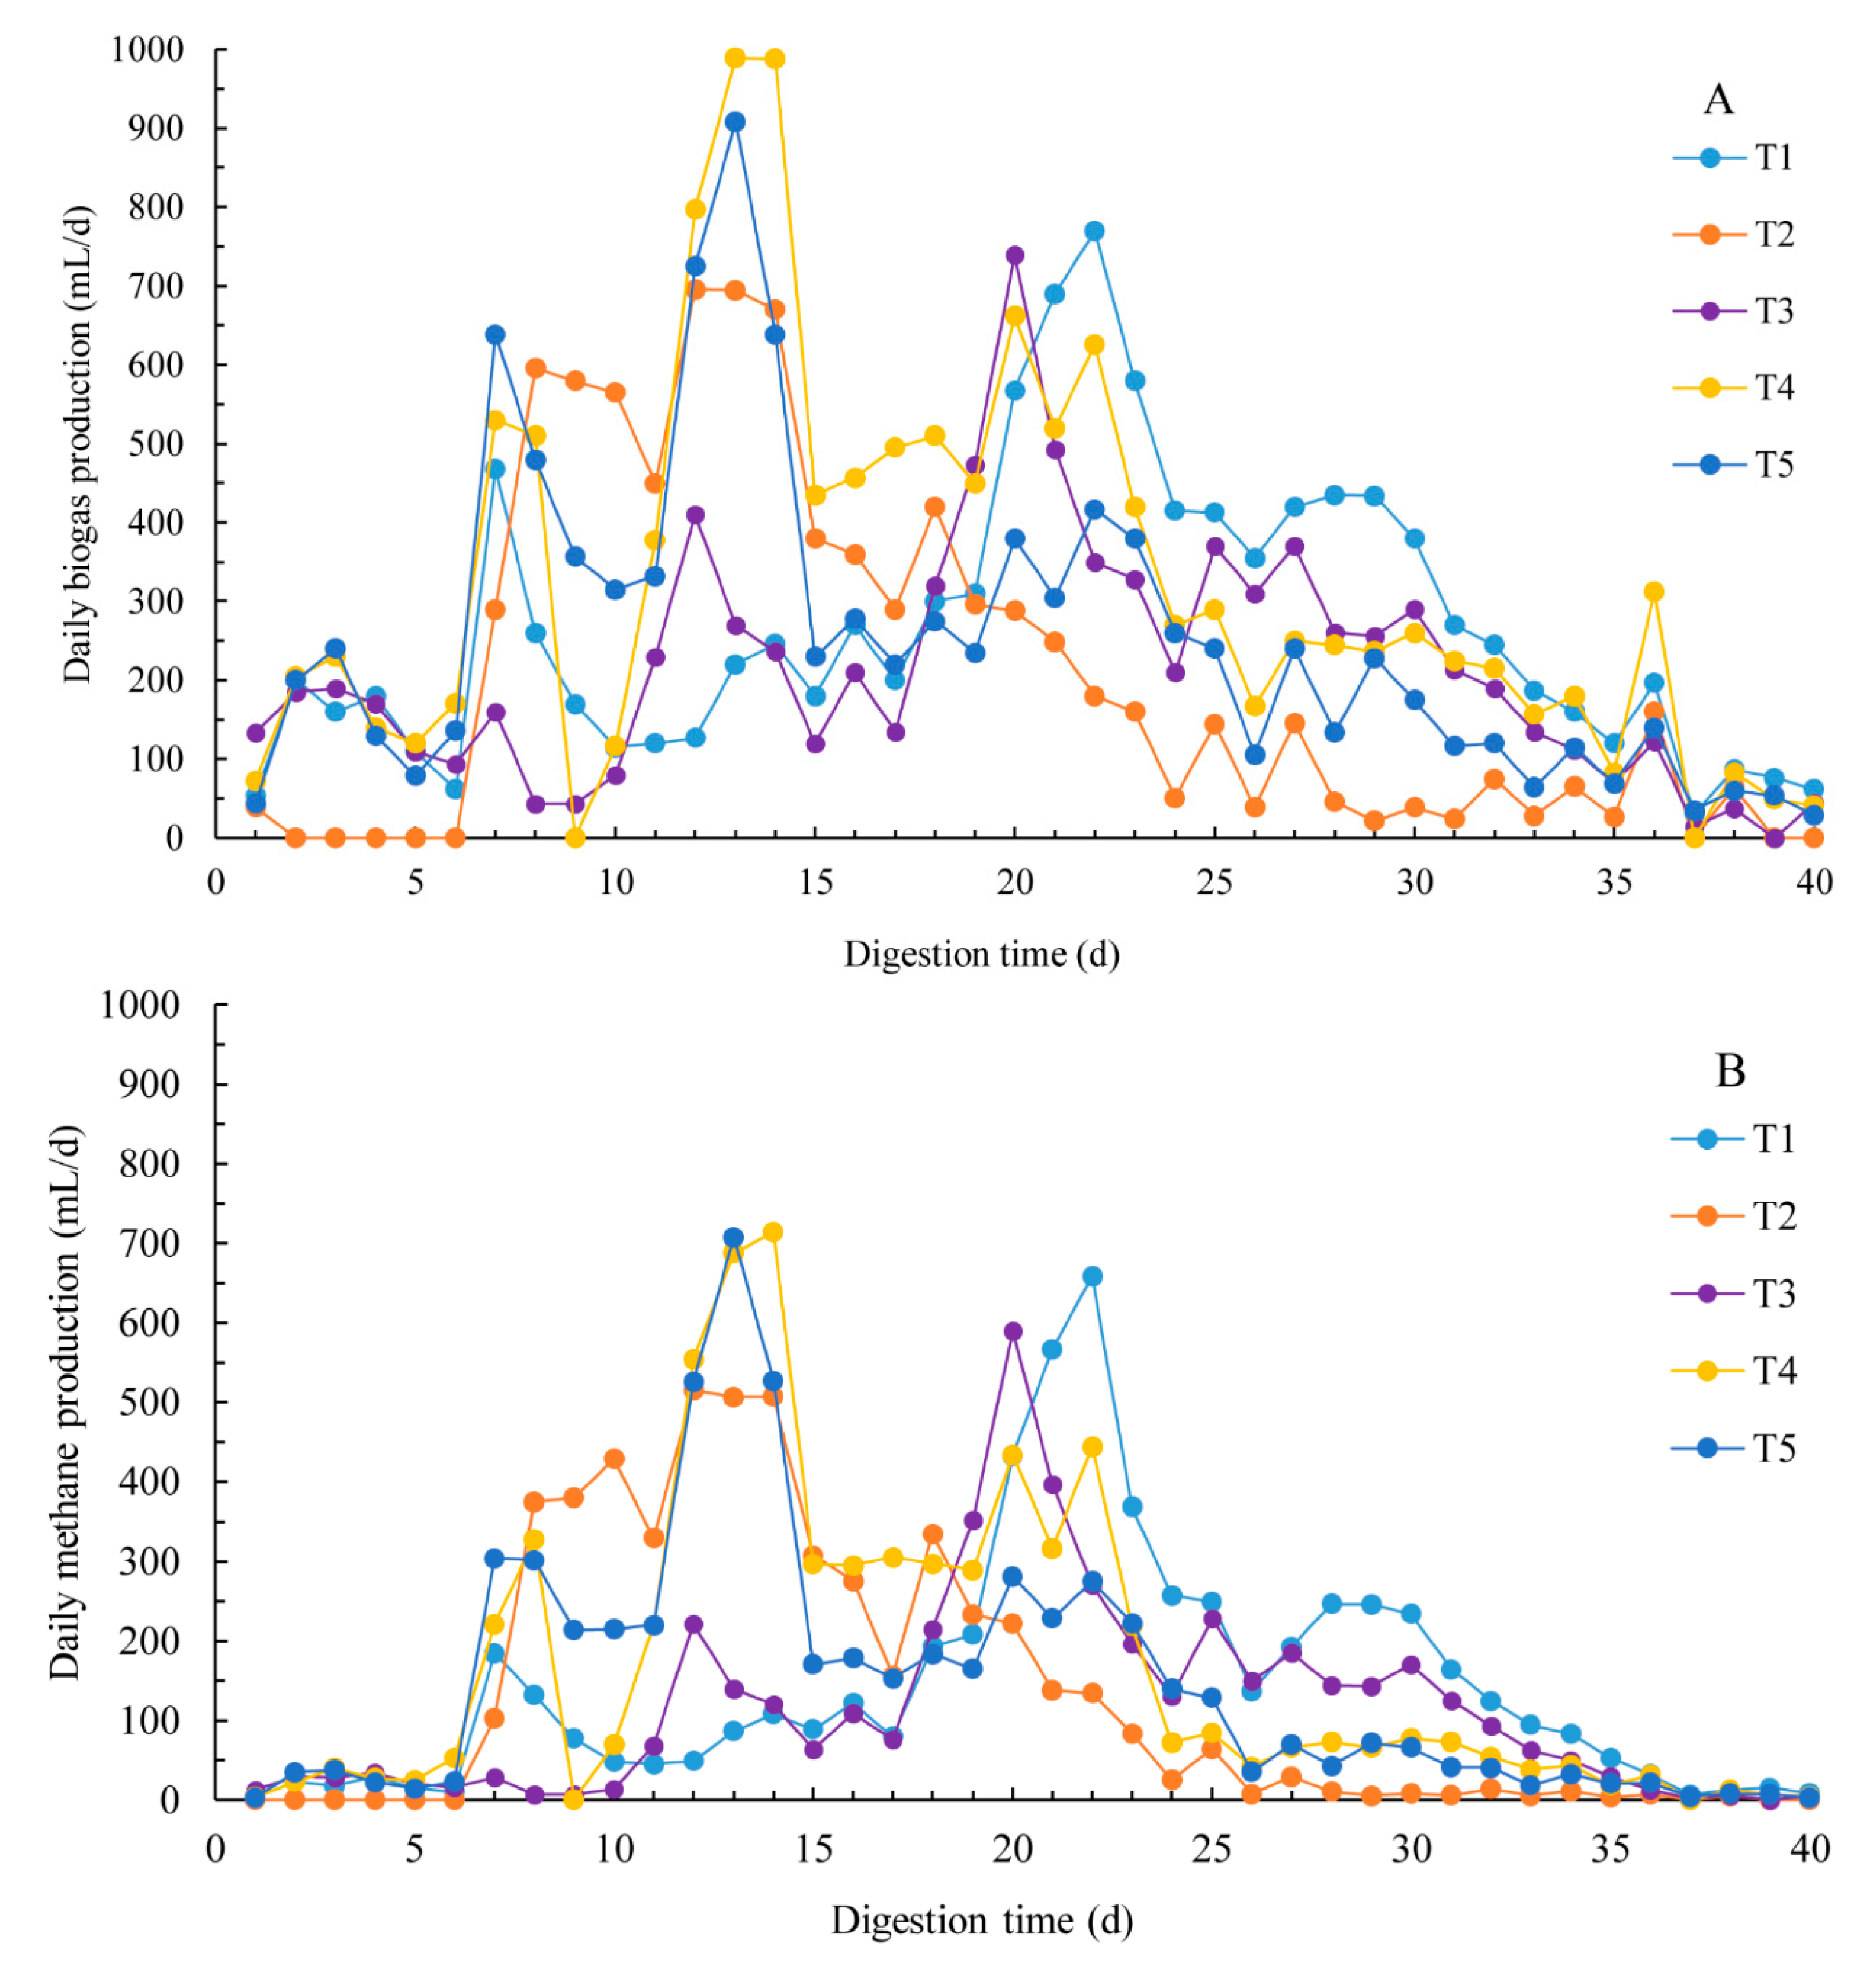
Figure 1. Daily biogas and methane production from different proportions of FW in batch bioreactors.
Sustainability 11 02933 g001
Figure 2. Microbial growth curve of the modified Gompertz model.
Sustainability 11 02933 g002
Figure 3. Variation of dynamic parameters in different proportions during the anaerobic digestion process: (a) the trend graph of pH; (b) the trend graph of VFAs; (c) the trend graph of ammonia nitrogen content.
Sustainability 11 02933 g003
Figure 4. Taxonomic composition of bacterial phylum.
Sustainability 11 02933 g004
Figure 5. Taxonomic composition of archaeal species.
Sustainability 11 02933 g005
Table 1. Characteristics of substrates.
ParametersCRWPPO
TS (%)42.81 ± 0.7227.20 ± 0.49-
VS (%)97.63 ± 1.0995.23 ± 0.53-
N (% VS)1.10 ± 0.637.14 ± 0.66-
C (% VS)46.80 ± 0.1953.22 ± 1.6560.71 ± 1.15
Carbohydrate (% VS)92.24 ± 0.181.43 ± 1.14-
Protein (% VS)7.13 ± 1.0246.00 ± 0.95-
Lipid (% VS)0.72 ± 0.9946.62 ± 1.3099.99 ± 0.01
Ash (% TS)2.40 ± 0.114.71 ± 0.07-
CR: Cooked rice; WP: waste pork; PO: plant oil; TS: total solid.
Table 2. Different ratios of lipids, carbohydrates and protein amounts in different sets and related C/N ratios.
Lipid (% VS)Carbohydrate (% VS)Protein (% VS)C/N
T170201034.4
T230502016.3
T350203011.5
T450401033.2
T550302017.4
Table 3. Gasification rate.
BMP (mL/g VS)TMP (mL/g VS)GR (%)
T1422.25 ± 89.77814.8951.82 ± 11.02
T2381.03 ± 10.67585.4165.09 ± 1.82
T3326.12 ± 52.04647.0250.40 ± 8.04
T4497.44 ± 45.26703.8370.68 ± 6.43
T5424.96 ± 55.47672.6463.18 ± 8.25
BMP: Biochemical methane potential; TMP: Theoretical methane potential; GR: Gasification rate.
Table 4. The parameters of the modified Gompertz model.
RmaxM0λR2
T153.74422.2513.27 ± 0.400.990
T242.04381.037.54 ± 0.080.999
T348.15326.1212.75 ± 0.280.995
T458.23497.448.21 ± 0.170.998
T557.74424.966.62 ± 0.190.997
Rmax represents the maximum methane production rate (mL/g VS−d); M0 represents the methane potential maximum production (mL/g VS); λ represents the lag phase (d).
Table 5. The relative abundance of the dominant population of two types metabolic pathway.
Acetoclastic MethanogensHydrogenotrophic Methanogens
MethanosarcinaMethanosaetaMethanobrevibacterMethanoculleus
T127.8%3.3%5.8%9.0%
T254.6%2.8%3.0%8.4%
T346.9%6.5%10.3%10.8%
T410.7%3.0%7.3%5.7%
T530.2%1.5%3.1%5.8%
Table 6. Microbial diversity index of microbial community.
SimpsonChao1ACEShannon
T10.8202391020.111105.694.15
T20.7169951066.711078.573.78
T30.788785898.16960.464.29
T40.9695951181.931203.256.73
T50.798913601.00601.003.98
Corresponding to each sample in the same sequencing depth Chao1, ACE, Shannon, Simpson, and other diversity index calculation results.