Interactive Effects of Chemical Composition of Food Waste during Anaerobic Co-Digestion under Thermophilic Temperature

Abstract
1. Introduction
2. Materials and Methods
2.1. Inoculum and Substrate
2.2. Experimental Design
2.3. Analytic Methods
2.3.1. Process Parameters Measurement
2.3.2. Microbial Community Measurement
2.4. Modified Gompertz Model
2.5. Gasification Rate
3. Results and Discussion
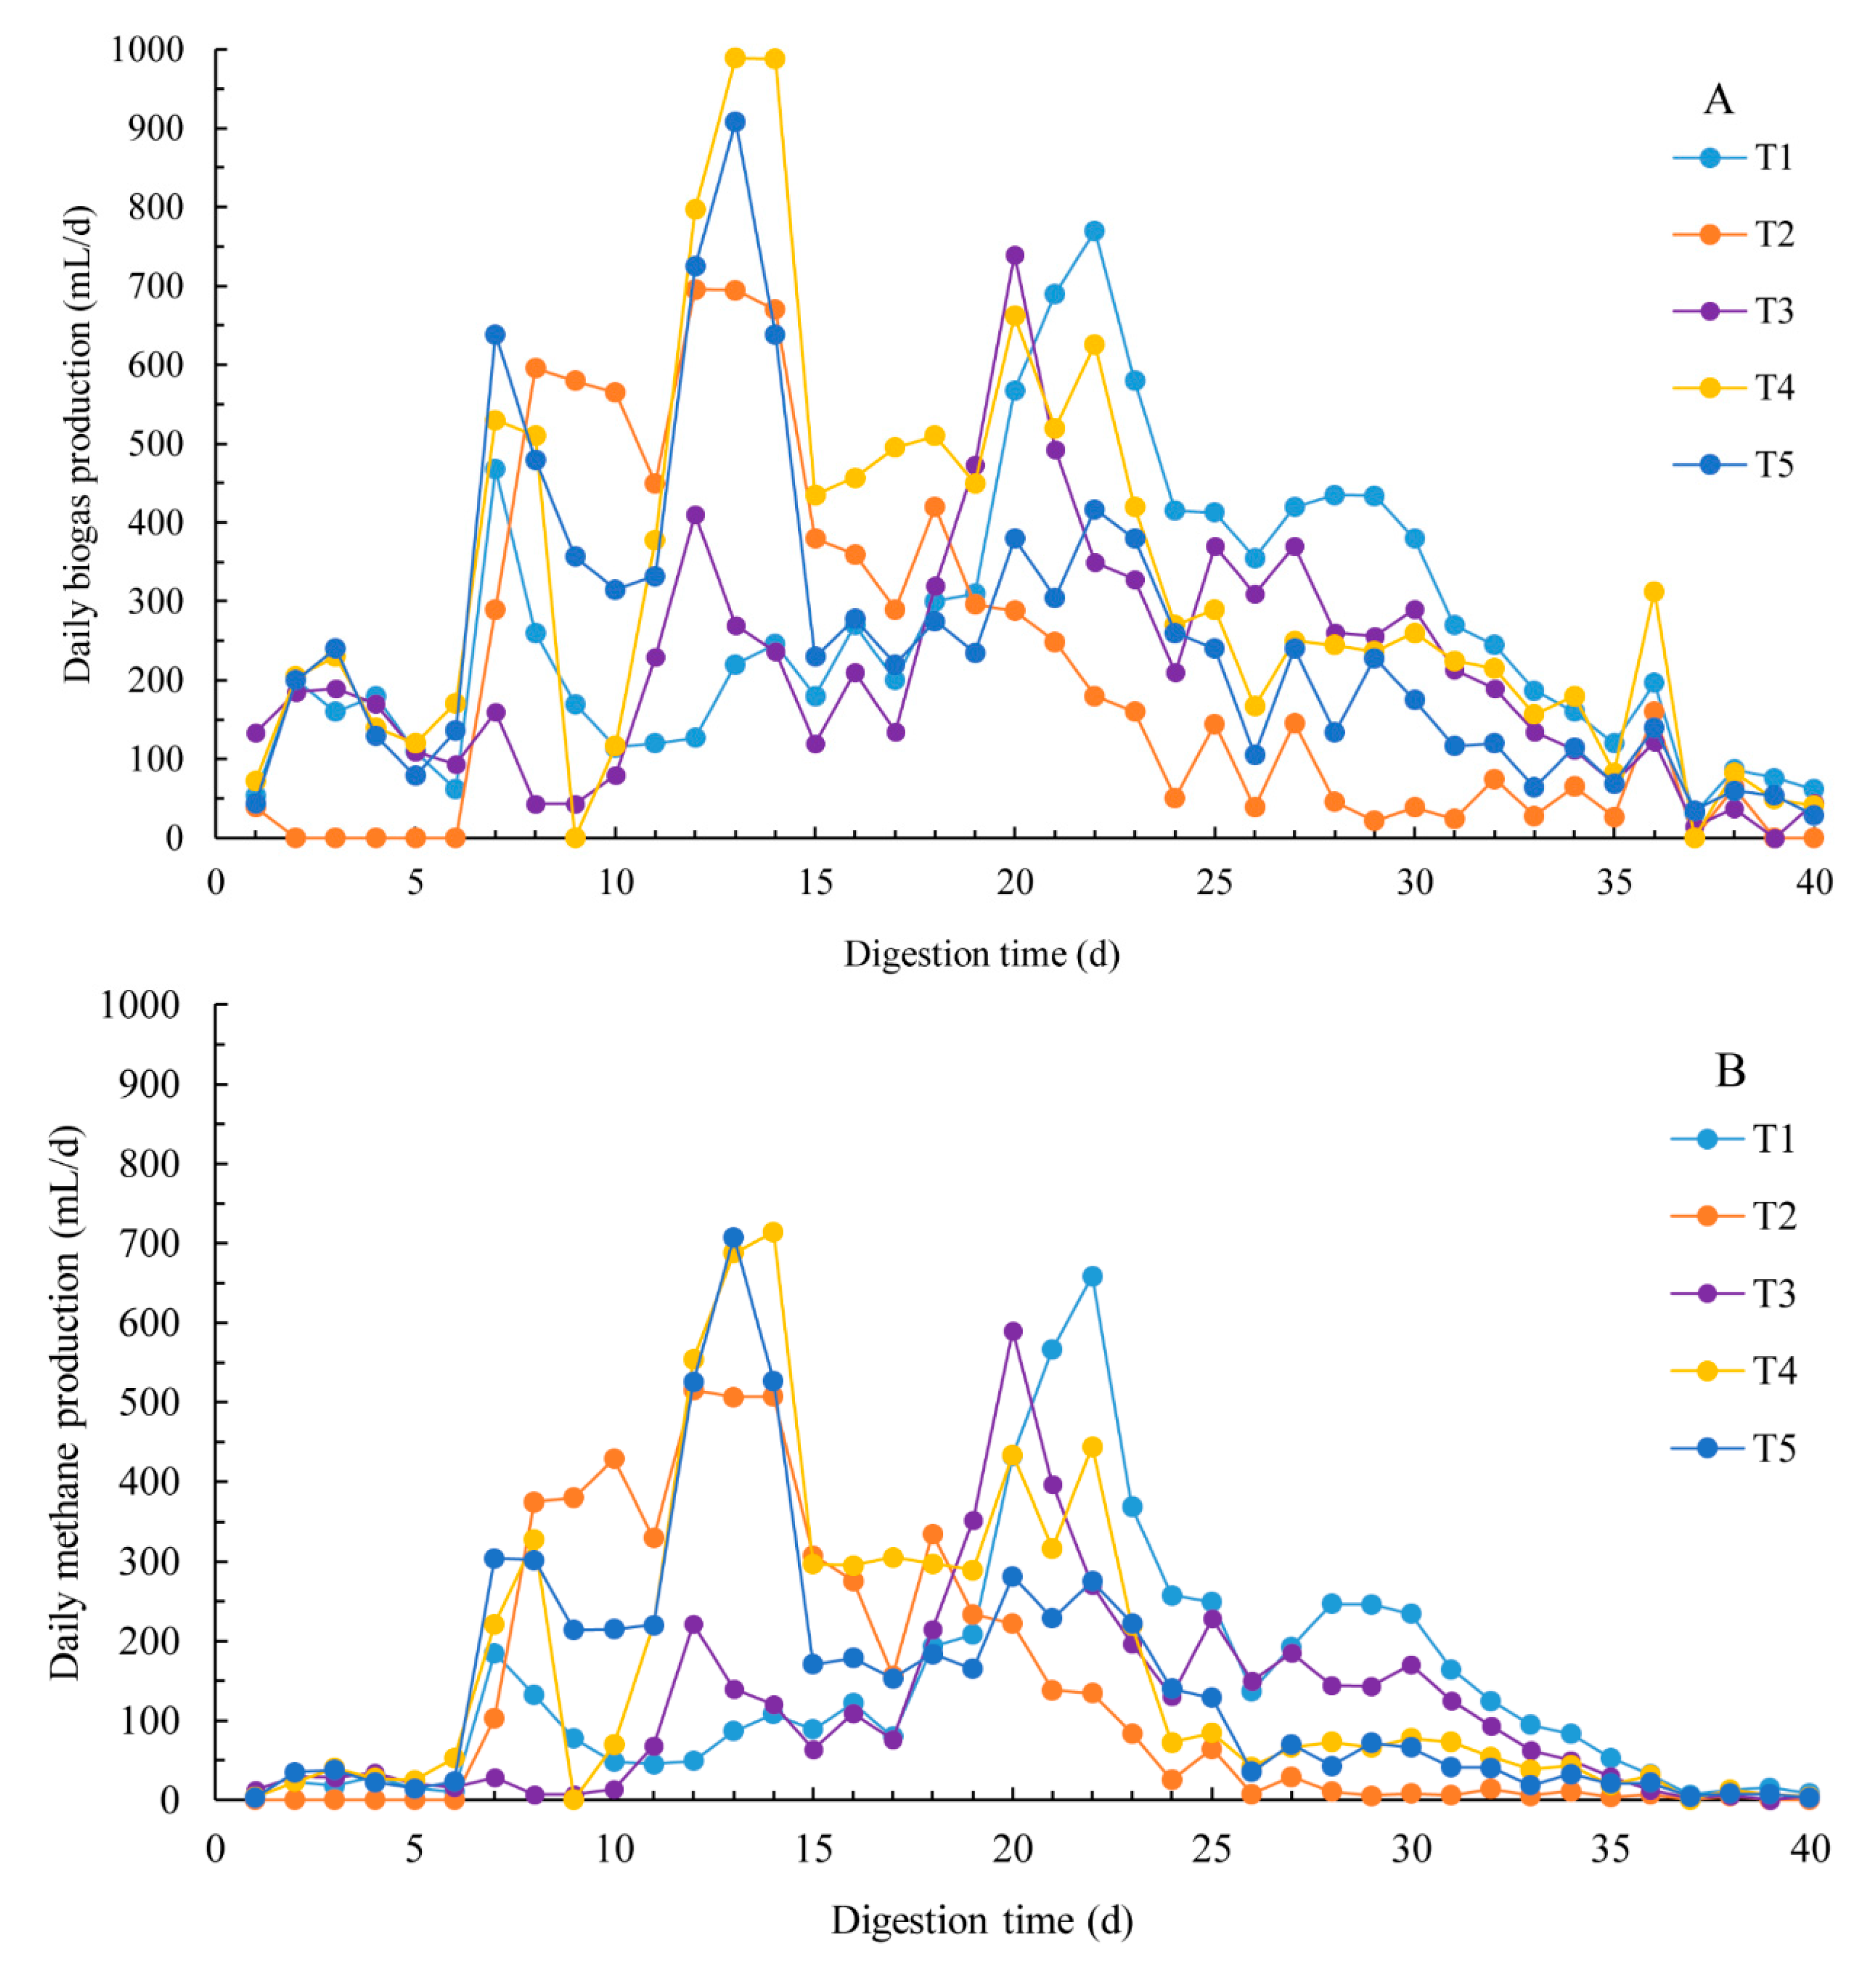
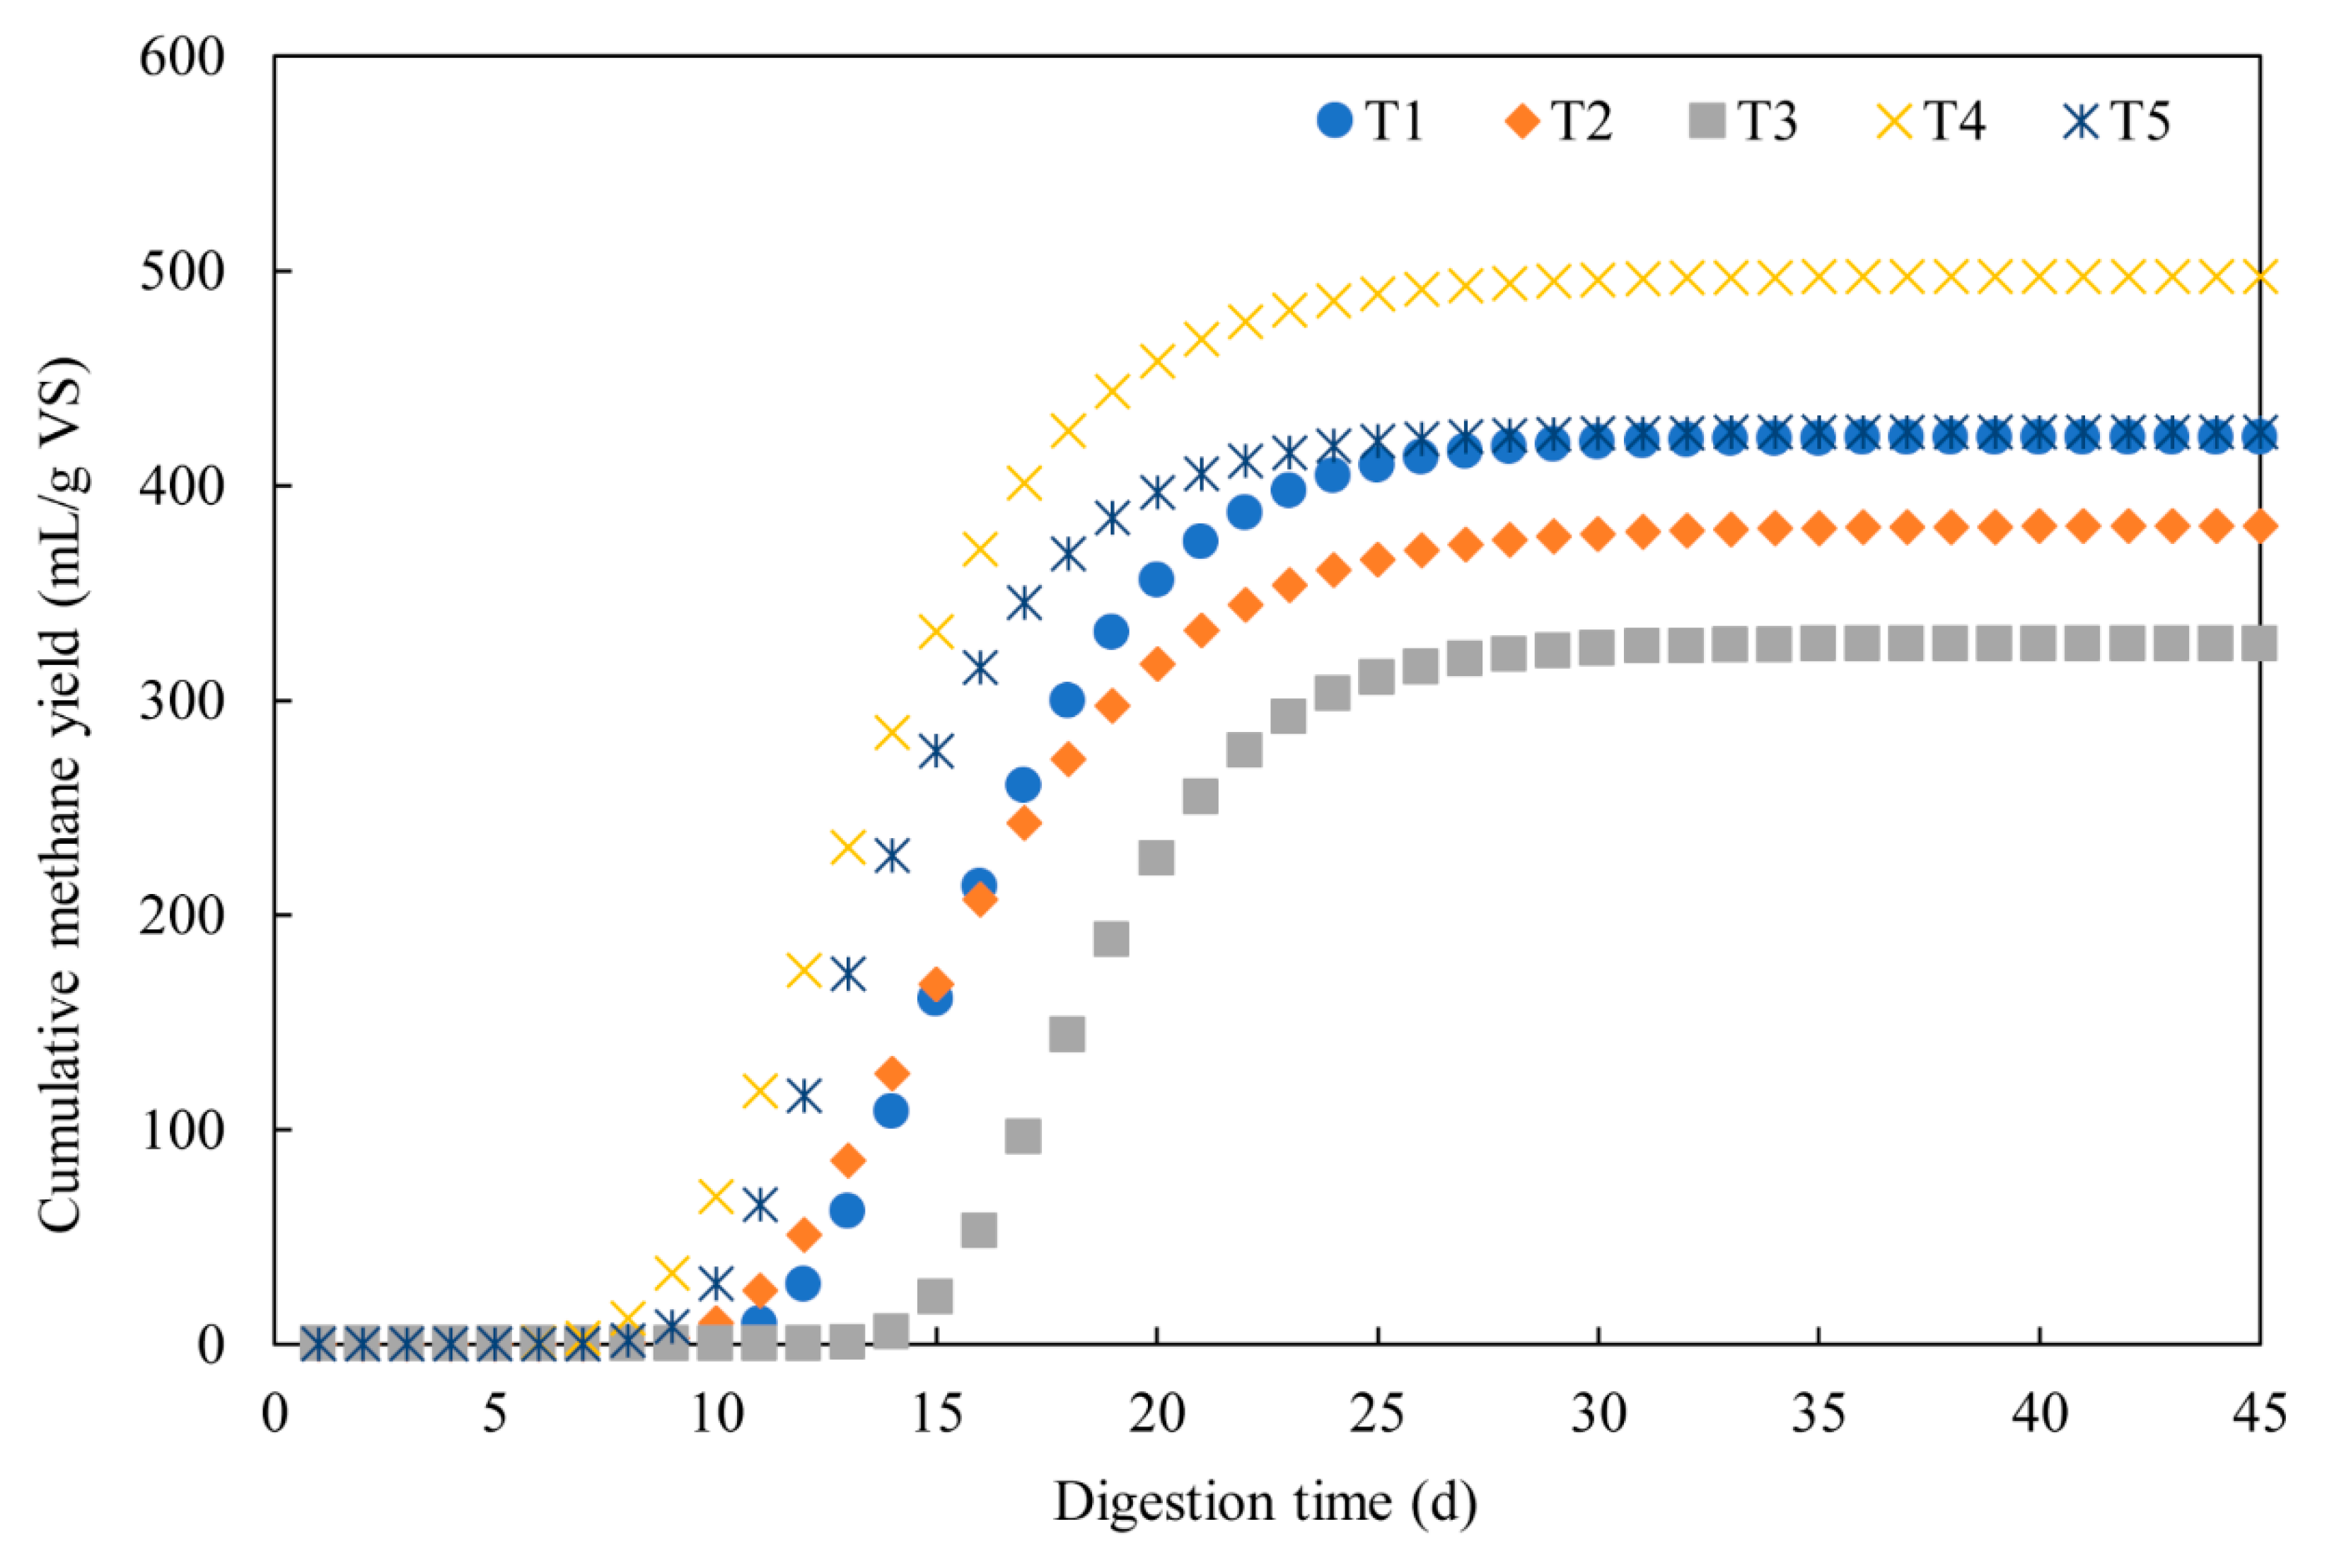
3.1. Methane Production
3.2. Dynamic Model Parameters
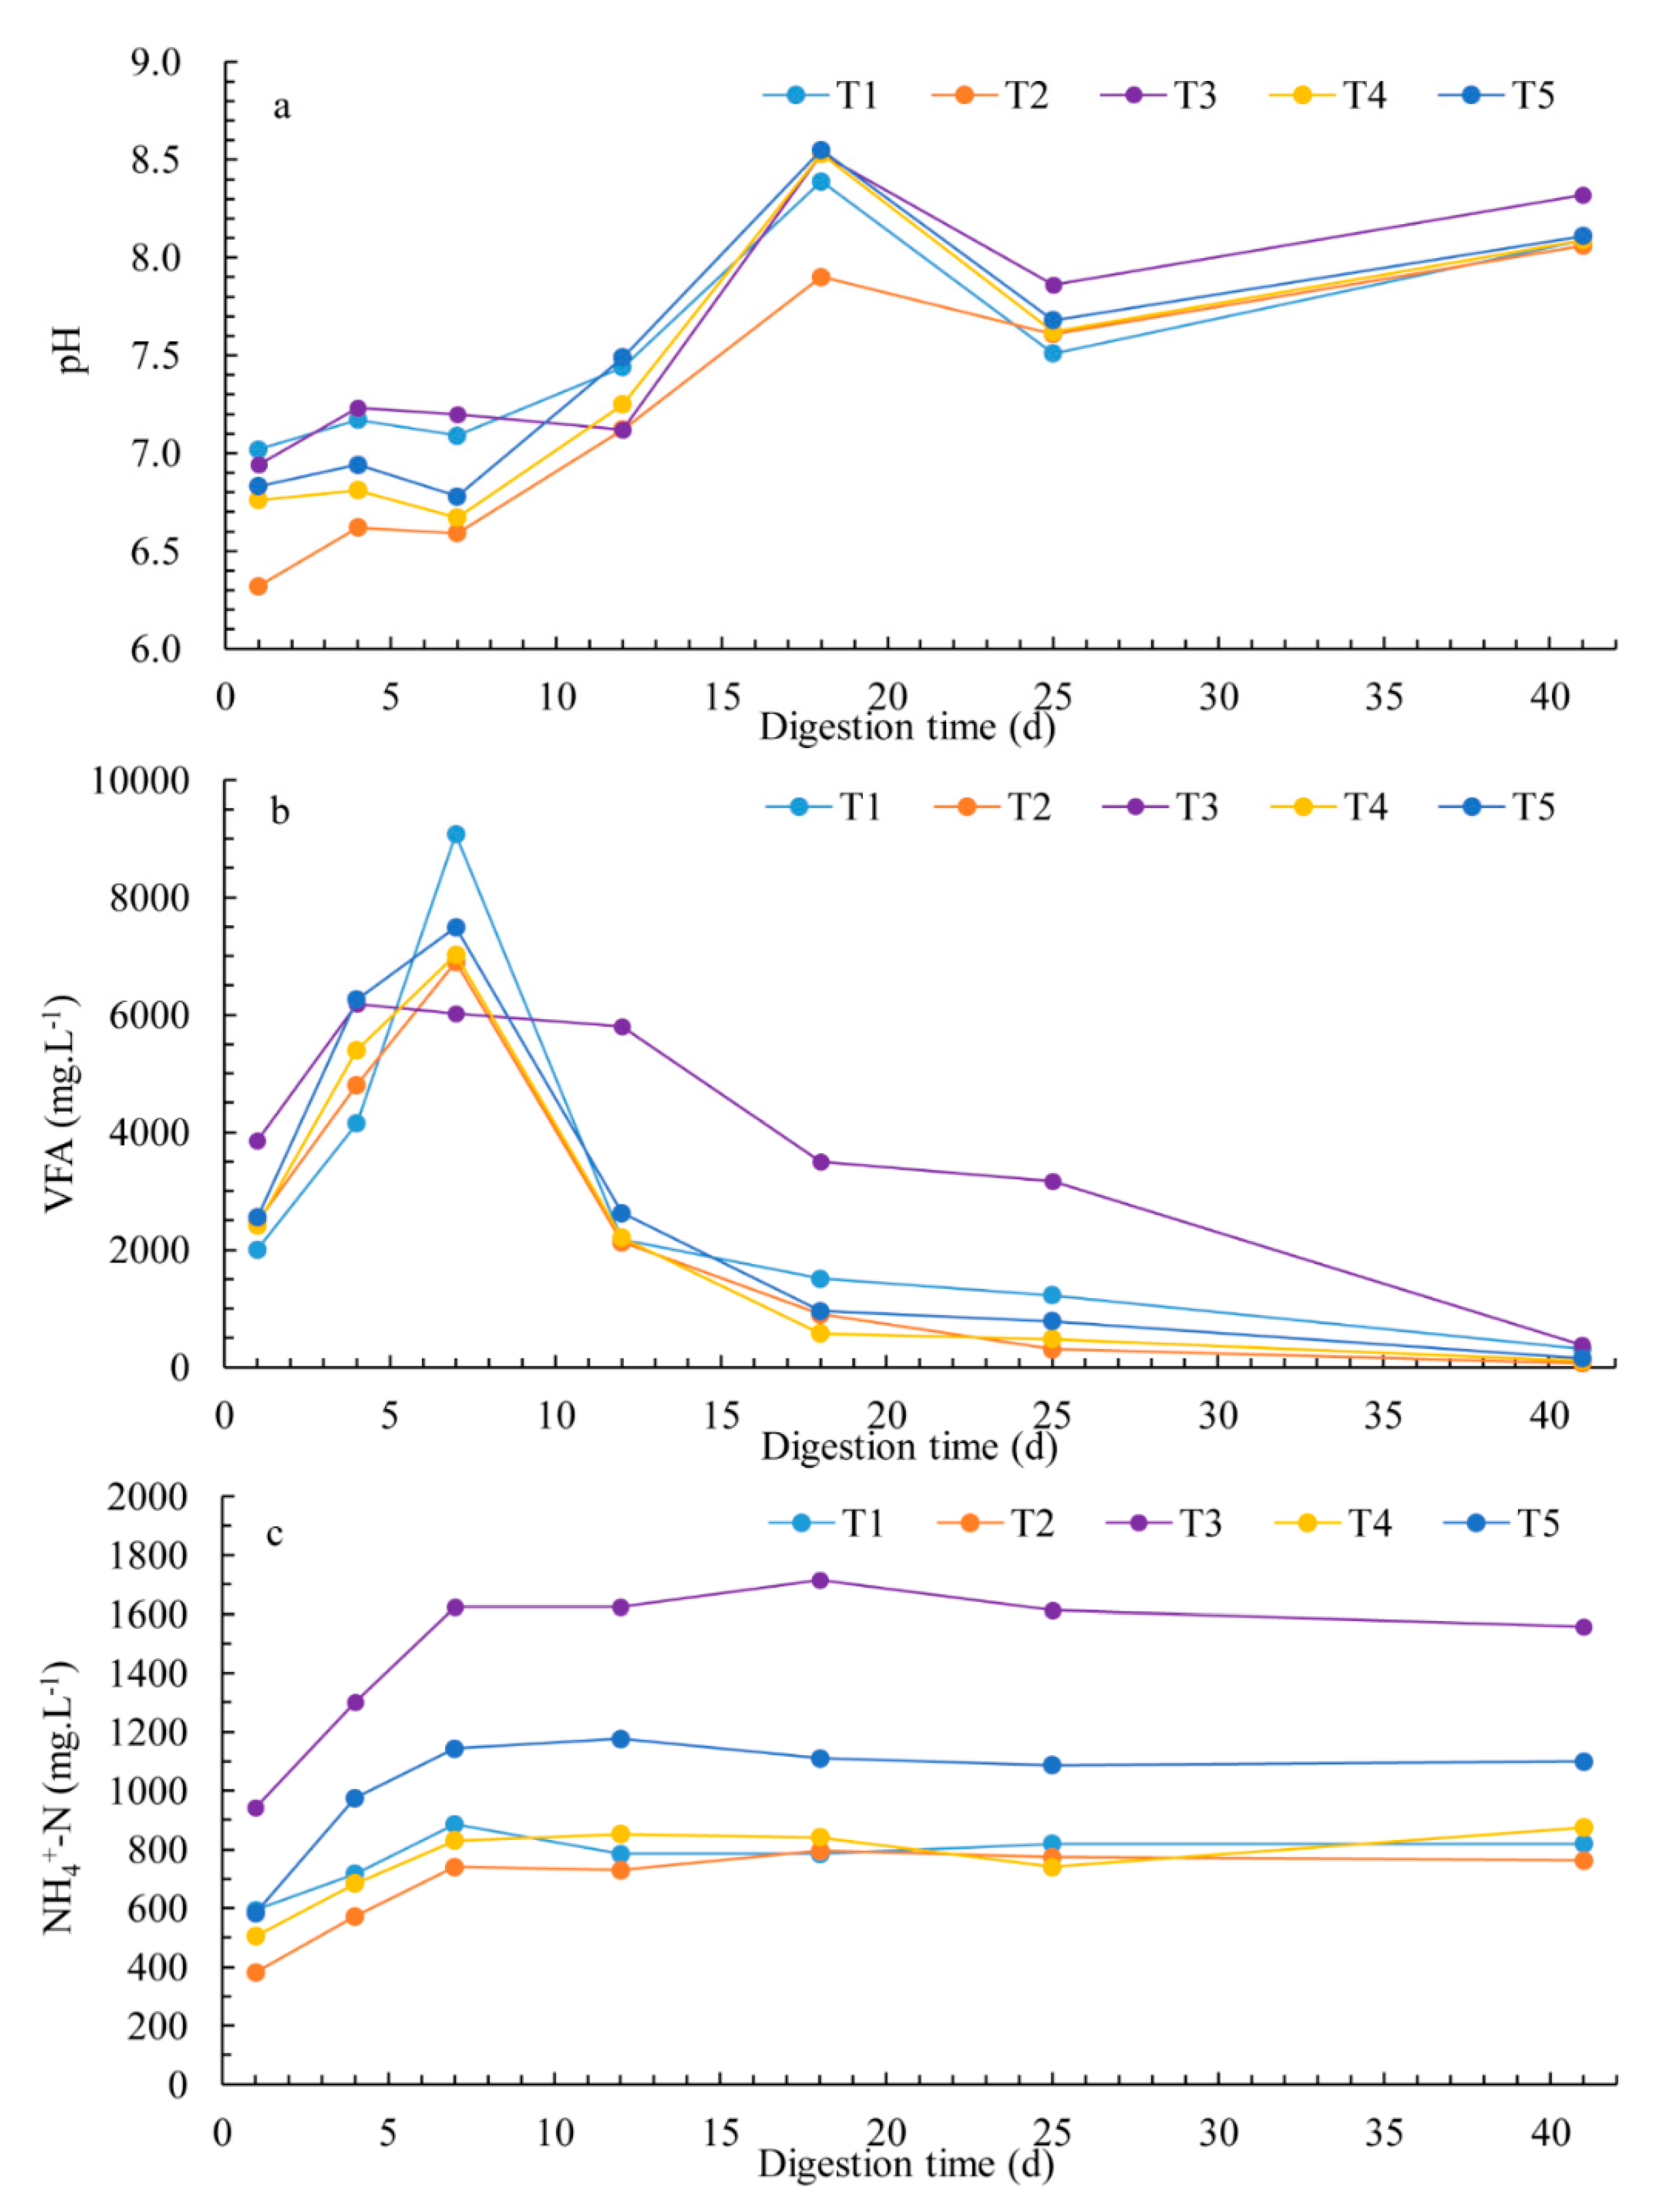
3.3. Chemical Parameters and Process Stability
3.4. Microbial Responses to the Chemical Composition of FW
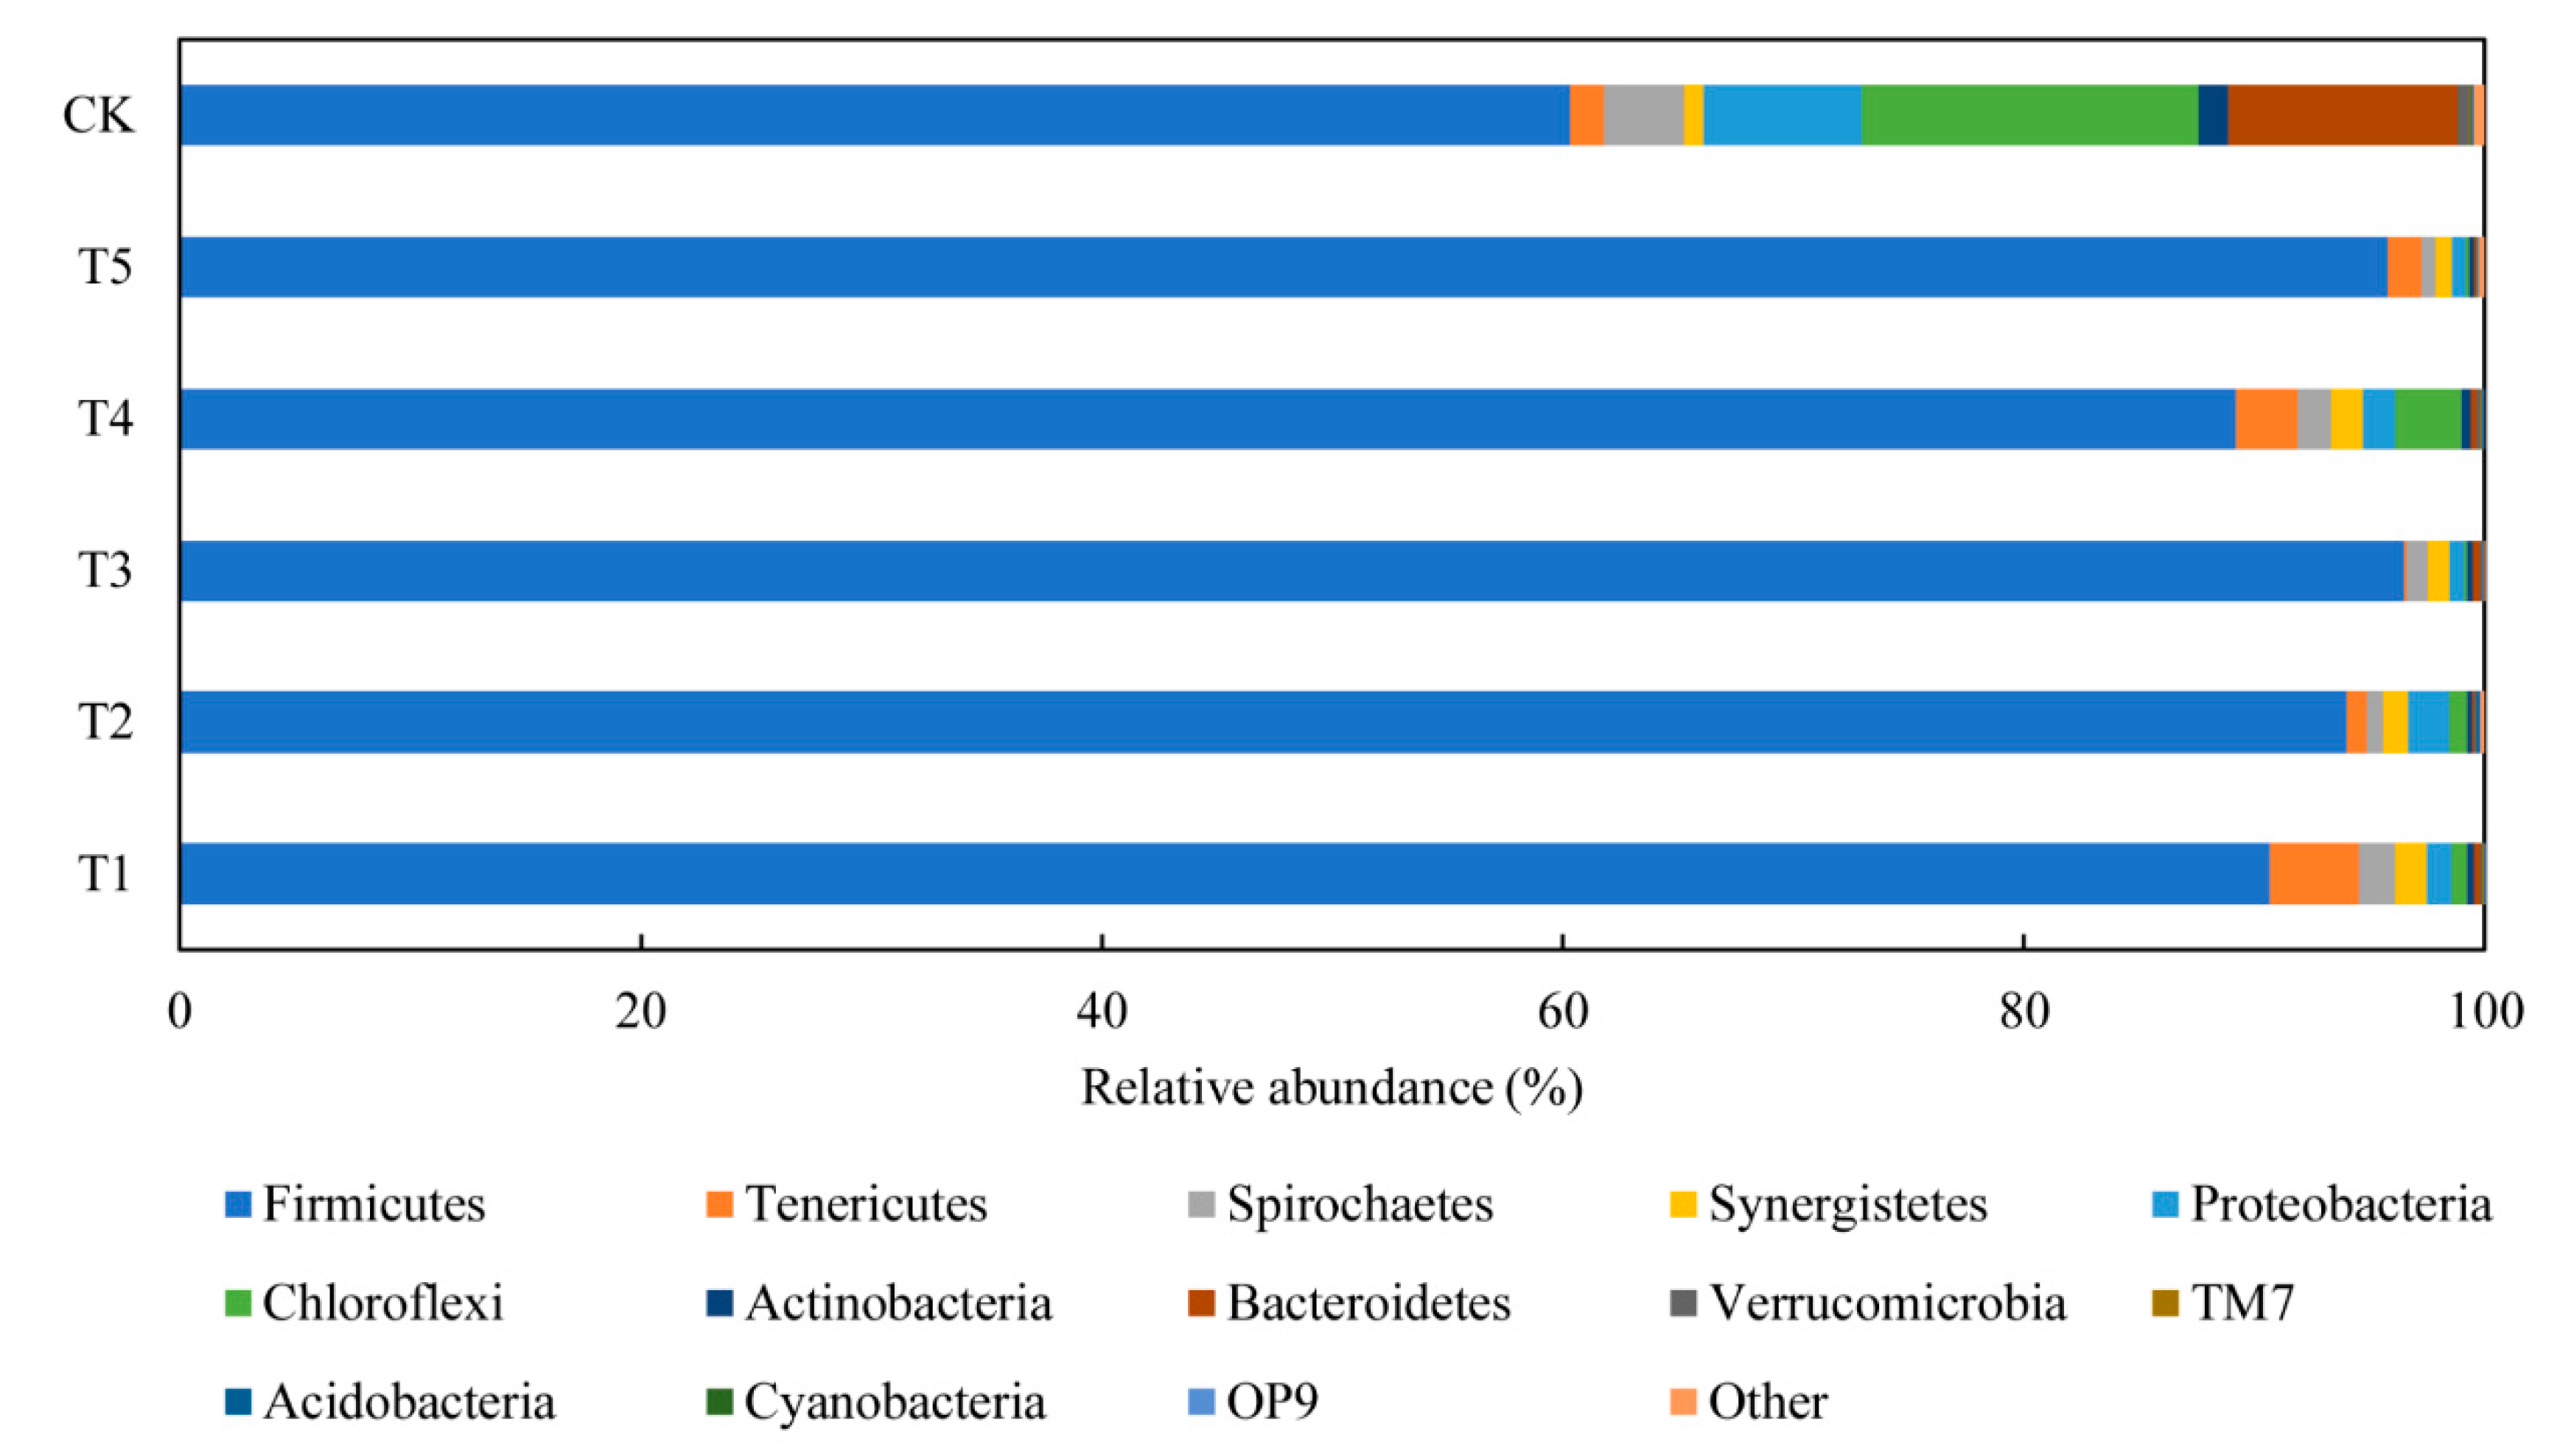
3.4.1. Performance of Bacterial Communities
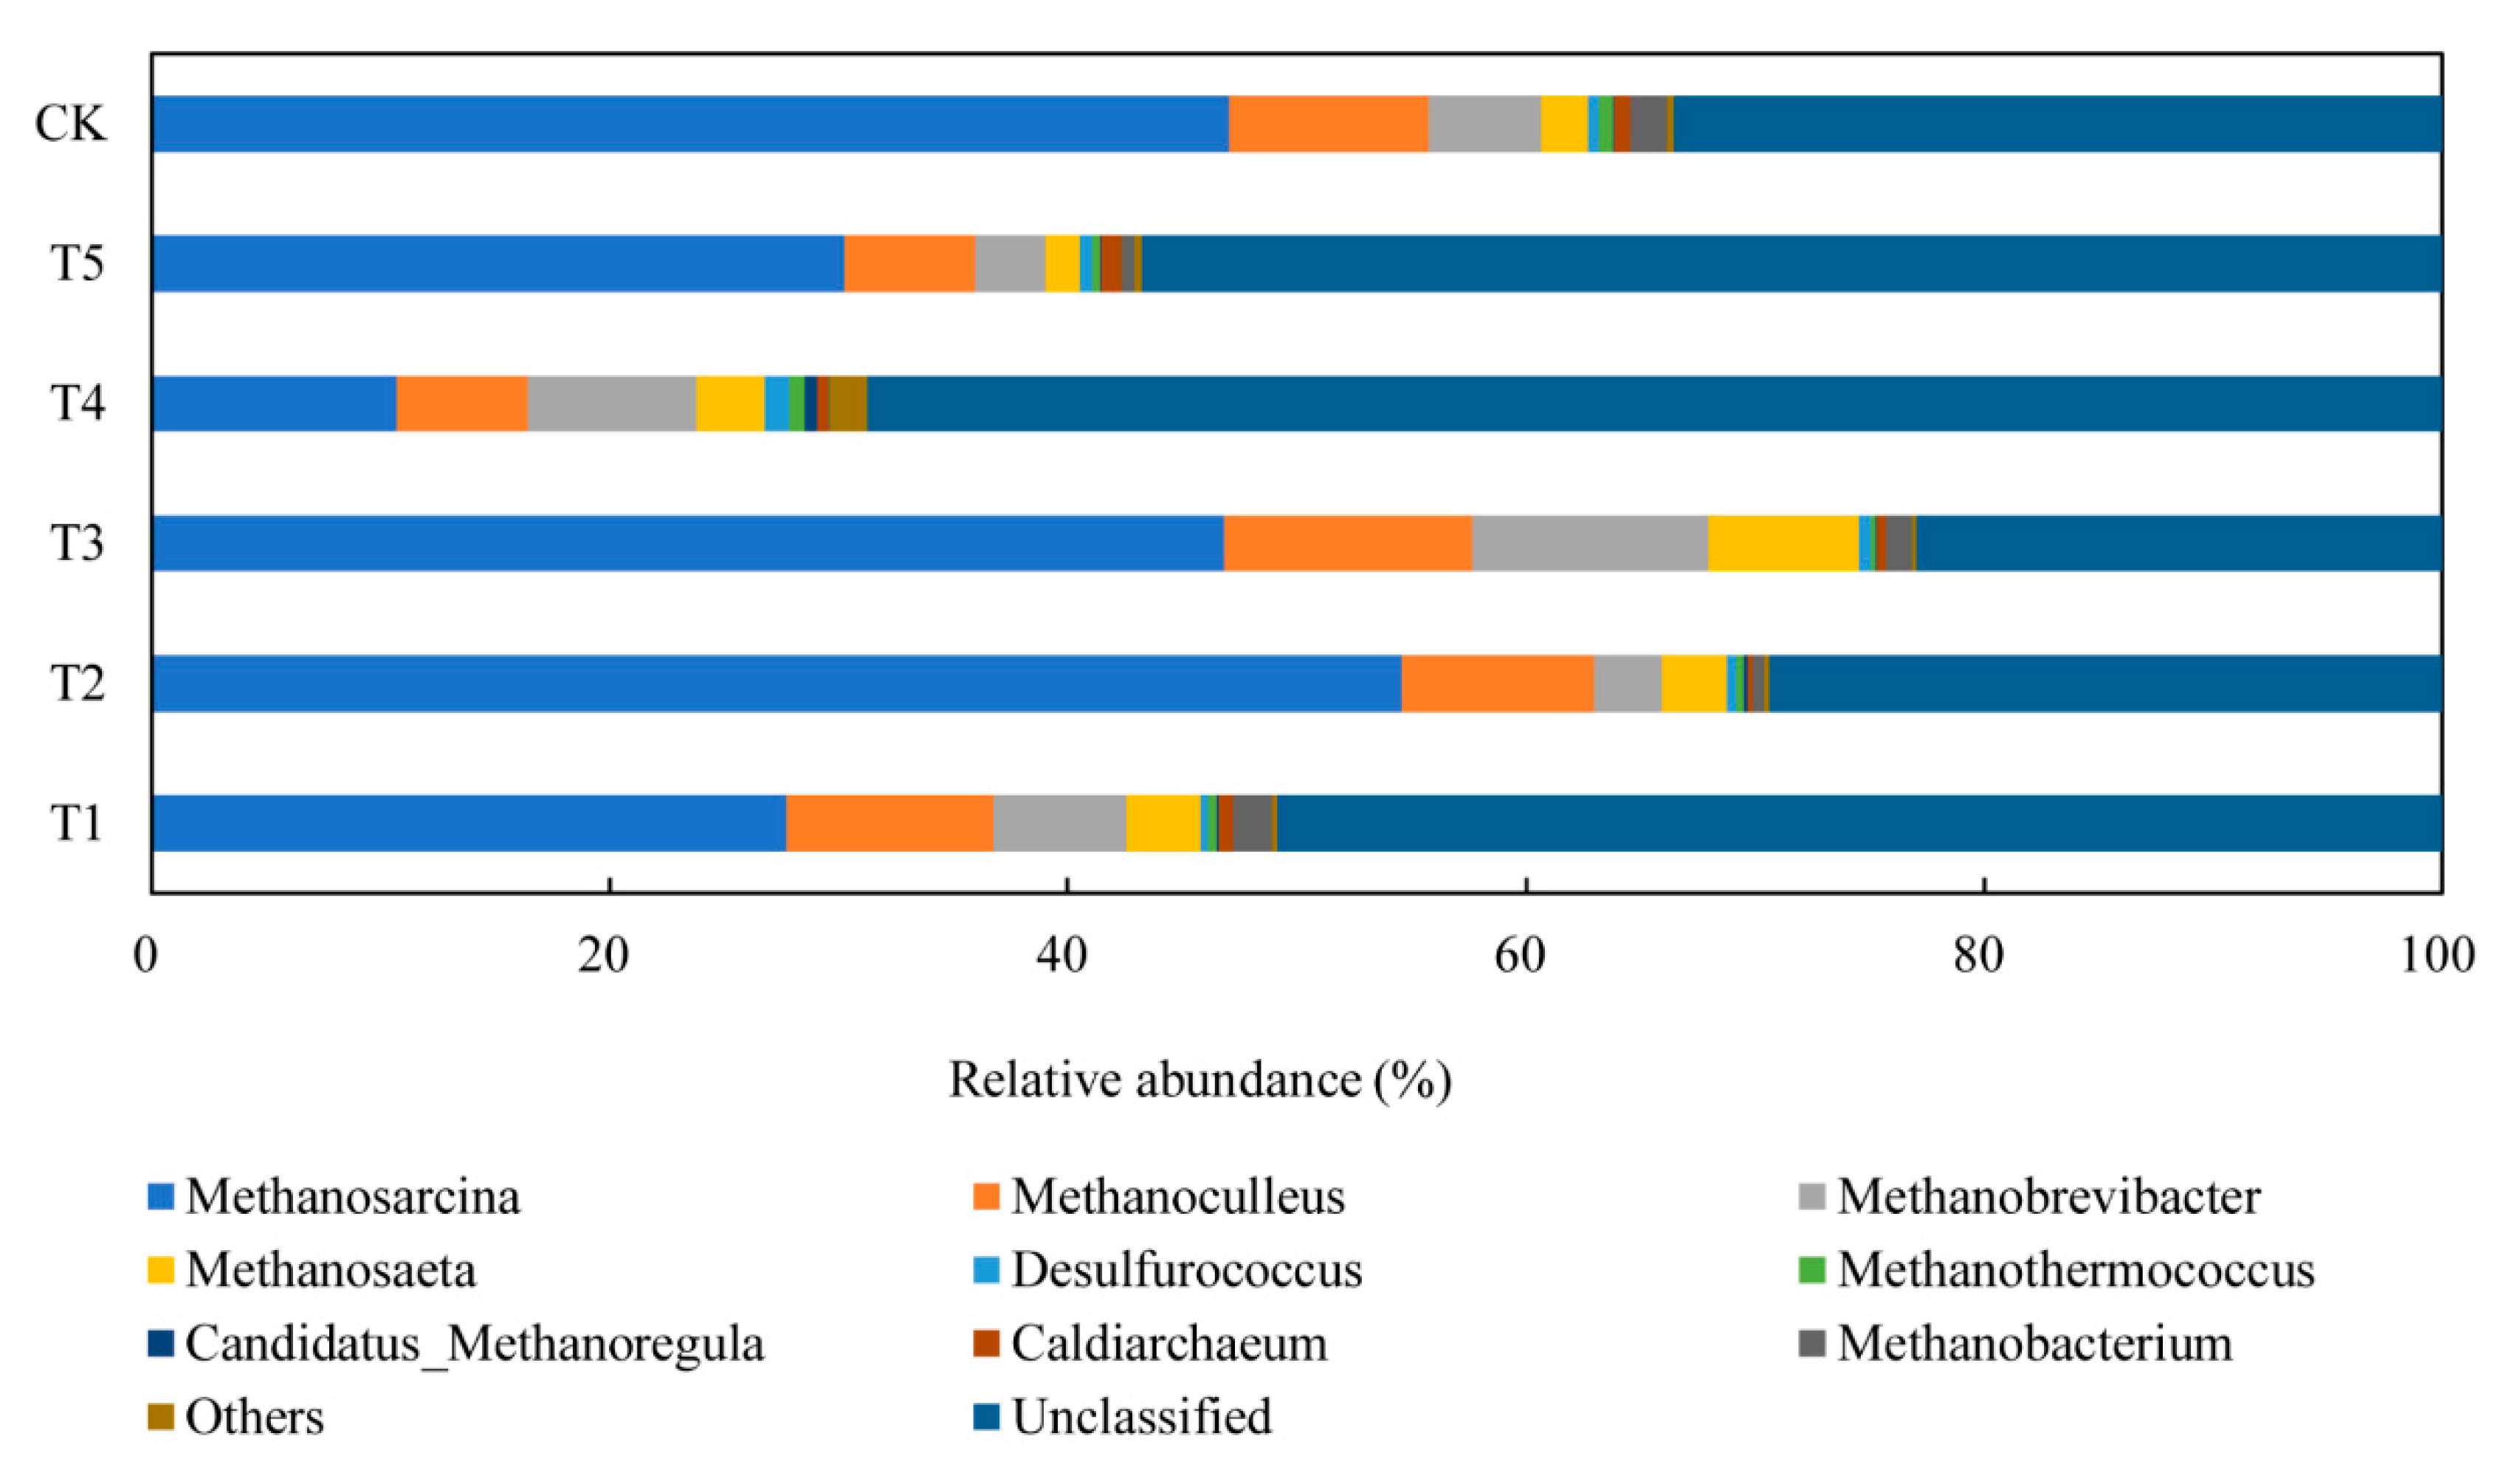
3.4.2. Performance of Archaeal Communities
4. Conclusions
Author Contributions
Funding
Acknowledgments
Conflicts of Interest
References
- Zhang, W.; Zhang, L.; Li, A. Anaerobic co-digestion of food waste with MSW incineration plant fresh leachate: Process performance and synergistic effects. Chem. Eng. J. 2015, 259, 795–805. [Google Scholar] [CrossRef]
- Browne, J.D.; Murphy, J.D. The impact of increasing organic loading in two phase digestion of food waste. Renew. Energy 2014, 71, 69–76. [Google Scholar] [CrossRef]
- Pages-Diaz, J.; Pereda-Reyes, I.; Taherzadeh, M.J.; Sarvari-Horvath, I.; Lundin, M. Anaerobic co-digestion of solid slaughterhouse wastes with agro-residues: Synergistic and antagonistic interactions determined in batch digestion assays. Chem. Eng. J. 2014, 245, 89–98. [Google Scholar] [CrossRef]
- Ohemeng-Ntiamoah, J.; Datta, T. Evaluating analytical methods for the characterization of lipids, proteins and carbohydrates in organic substrates for anaerobic co-digestion. Bioresour. Technol. 2018, 247, 697–704. [Google Scholar] [CrossRef] [PubMed]
- Mao, C.L.; Wang, X.J.; Xi, J.C.; Feng, Y.Z.; Ren, G.X. Linkage of kinetic parameters with process parameters and operational conditions during anaerobic digestion. Energy 2017, 135, 352–360. [Google Scholar] [CrossRef]
- Ahring, B.K. Perspectives for anaerobic digestion. Adv. Biochem. Eng. Biotechnol. 2003, 81, 1–30. [Google Scholar]
- Li, N.; He, J.; Yan, H.; Chen, S.; Dai, X. Pathways in bacterial and archaeal communities dictated by ammonium stress in a high solid anaerobic digester with dewatered sludge. Bioresour. Technol. 2017, 241, 95–102. [Google Scholar] [CrossRef]
- Sun, Y.; Wang, D.; Yan, J.; Qiao, W.; Wang, W.; Zhu, T. Effects of lipid concentration on anaerobic co-digestion of municipal biomass wastes. Waste Manag. 2014, 34, 1025–1034. [Google Scholar] [CrossRef] [PubMed]
- Cirne, D.G.; Paloumet, X.; Björnsson, L.; Alves, M.M.; Mattiasson, B. Anaerobic digestion of lipid-rich waste—Effects of lipid concentration. Renew. Energy 2007, 32, 965–975. [Google Scholar] [CrossRef]
- Wagner, A.O.; Lins, P.; Malin, C.; Reitschuler, C.; Illmer, P. Impact of protein-, lipid- and cellulose-containing complex substrates on biogas production and microbial communities in batch experiments. Sci. Total Environ. 2013, 458–460, 256–266. [Google Scholar] [CrossRef] [PubMed]
- Cook, S.M.; Skerlos, S.J.; Raskin, L.; Love, N.G. A stability assessment tool for anaerobic codigestion. Water Res. 2017, 112, 19–28. [Google Scholar] [CrossRef] [PubMed]
- Paritosh, K.; Mathur, S.; Pareek, N.; Vivekanand, V. Feasibility study of waste (d) potential: Co-digestion of organic wastes, synergistic effect and kinetics of biogas production. Int. J. Environ. Sci. Technol. 2017, 15, 1009–1018. [Google Scholar] [CrossRef]
- Mendez-Acosta, H.O.; Campos-Rodriguez, A.; Gonzalez-Alvarez, V.; Garcia-Sandoval, J.P.; Snell-Castro, R.; Latrille, E. A hybrid cascade control scheme for the VFA and COD regulation in two-stage anaerobic digestion processes. Bioresour. Technol. 2016, 218, 1195–1202. [Google Scholar] [CrossRef] [PubMed]
- Jiang, Y.; Dennehy, C.; Lawlor, P.G.; Hu, Z.; Zhan, X.; Gardiner, G.E. Inactivation of enteric indicator bacteria and system stability during dry co-digestion of food waste and pig manure. Sci. Total Environ. 2018, 612, 293–302. [Google Scholar] [CrossRef]
- Chinellato, G.; Cavinato, C.; Bolzonella, D.; Heaven, S.; Banks, C.J. Biohydrogen production from food waste in batch and semi-continuous conditions: Evaluation of a two-phase approach with digestate recirculation for pH control. Int. J. Hydrogen Energy 2013, 38, 4351–4360. [Google Scholar] [CrossRef]
- Ebner, J.H.; Labatut, R.A.; Lodge, J.S.; Williamson, A.A.; Trabold, T.A. Anaerobic co-digestion of commercial food waste and dairy manure: Characterizing biochemical parameters and synergistic effects. Waste Manag. 2016, 52, 286–294. [Google Scholar] [CrossRef] [PubMed]
- Xie, S.H.; Wickham, R.; Nghiem, L.D. Synergistic effect from anaerobic co-digestion of sewage sludge and organic wastes. Int. Biodeterior. Biodegrad. 2017, 116, 191–197. [Google Scholar] [CrossRef]
- Palatsi, J.; Vinas, M.; Guivernau, M.; Fernandez, B.; Flotats, X. Anaerobic digestion of slaughterhouse waste: Main process limitations and microbial community interactions. Bioresour. Technol. 2011, 102, 2219–2227. [Google Scholar] [CrossRef] [PubMed]
- Qin, Y.; Wu, J.; Xiao, B.; Hojo, T.; Li, Y.-Y. Biogas recovery from two-phase anaerobic digestion of food waste and paper waste: Optimization of paper waste addition. Sci. Total Environ. 2018, 634, 1222–1230. [Google Scholar] [CrossRef]
- Wang, X.; Yang, G.; Feng, Y.; Ren, G.; Han, X. Optimizing feeding composition and carbon-nitrogen ratios for improved methane yield during anaerobic co-digestion of dairy, chicken manure and wheat straw. Bioresour. Technol. 2012, 120, 78–83. [Google Scholar] [CrossRef]
- The Greengenes Database. Available online: http://greengenes.secondgenome.com/ (accessed on 23 May 2019).
- Mao, C.; Zhang, T.; Wang, X.; Feng, Y.; Ren, G.; Yang, G. Process performance and methane production optimizing of anaerobic co-digestion of swine manure and corn straw. Sci. Rep. 2017, 7, 9379. [Google Scholar] [CrossRef]
- Elsayed, M.; Andres, Y.; Blel, W.; Gad, A.; Ahmed, A. Effect of vs. organic loads and buckwheat husk on methane production by anaerobic co-digestion of primary sludge and wheat straw. Energy Convers. Manag. 2016, 117, 538–547. [Google Scholar] [CrossRef]
- Elbeshbishy, E.; Nakhla, G. Batch anaerobic co-digestion of proteins and carbohydrates. Bioresour. Technol. 2012, 116, 170–178. [Google Scholar] [CrossRef]
- Li, Y.; Jin, Y.; Borrion, A.; Li, H.; Li, J. Effects of organic composition on mesophilic anaerobic digestion of food waste. Bioresour. Technol. 2017, 244, 213–224. [Google Scholar] [CrossRef]
- Xu, R.; Zhang, K.; Liu, P.; Khan, A.; Xiong, J.; Tian, F.; Li, X. A critical review on the interaction of substrate nutrient balance and microbial community structure and function in anaerobic co-digestion. Bioresour. Technol. 2018, 247, 1119–1127. [Google Scholar] [CrossRef]
- Wang, Q.; Peng, L.; Su, H. The effect of a buffer function on the semi-continuous anaerobic digestion. Bioresour. Technol. 2013, 139, 43–49. [Google Scholar] [CrossRef]
- Astals, S.; Batstone, D.J.; Mata-Alvarez, J.; Jensen, P.D. Identification of synergistic impacts during anaerobic co-digestion of organic wastes. Bioresour. Technol. 2014, 169, 421–427. [Google Scholar] [CrossRef]
- Mao, C.L.; Feng, Y.Z.; Wang, X.J.; Ren, G.X. Review on research achievements of biogas from anaerobic digestion. Renew. Sustain. Energy Rev. 2015, 45, 540–555. [Google Scholar] [CrossRef]
- Aboudi, K.; Alvarez-Gallego, C.J.; Romero-Garcia, L.I. Influence of total solids concentration on the anaerobic co-digestion of sugar beet by-products and livestock manures. Sci. Total Environ. 2017, 586, 438–445. [Google Scholar] [CrossRef] [PubMed]
- Shi, X.; Lin, J.; Zuo, J.; Li, P.; Li, X.; Guo, X. Effects of free ammonia on volatile fatty acid accumulation and process performance in the anaerobic digestion of two typical bio-wastes. J. Environ. Sci. (China) 2017, 55, 49–57. [Google Scholar] [CrossRef] [PubMed]
- Tian, H.; Fotidis, I.A.; Kissas, K.; Angelidaki, I. Effect of different ammonia sources on aceticlastic and hydrogenotrophic methanogens. Bioresour. Technol. 2018, 250, 390–397. [Google Scholar] [CrossRef]
- Alibardi, L.; Cossu, R. Effects of carbohydrate, protein and lipid content of organic waste on hydrogen production and fermentation products. Waste Manag. 2016, 47, 69–77. [Google Scholar] [CrossRef]
- Lee, J.T.E.; He, J.; Tong, Y.W. Acclimatization of a mixed-animal manure inoculum to the anaerobic digestion of Axonopus compressus reveals the putative importance of Mesotoga infera and Methanosaeta concilii as elucidated by DGGE and Illumina MiSeq. Bioresour. Technol. 2017, 245, 1148–1154. [Google Scholar] [CrossRef]
- De Francisci, D.; Kougias, P.G.; Treu, L.; Campanaro, S.; Angelidaki, I. Microbial diversity and dynamicity of biogas reactors due to radical changes of feedstock composition. Bioresour. Technol. 2015, 176, 56–64. [Google Scholar] [CrossRef]
- Wang, P.; Wang, H.; Qiu, Y.; Ren, L.; Jiang, B. Microbial characteristics in anaerobic digestion process of food waste for methane production-A review. Bioresour. Technol. 2018, 248, 29–36. [Google Scholar] [CrossRef]
- Jimenez, J.; Aemig, Q.; Doussiet, N.; Steyer, J.P.; Houot, S.; Patureau, D. A new organic matter fractionation methodology for organic wastes: Bioaccessibility and complexity characterization for treatment optimization. Bioresour. Technol. 2015, 194, 344–353. [Google Scholar] [CrossRef]
- Zabranska, J.; Pokorna, D. Bioconversion of carbon dioxide to methane using hydrogen and hydrogenotrophic methanogens. Biotechnol. Adv. 2018, 36, 707–720. [Google Scholar] [CrossRef]
- Demirel, B.; Scherer, P. The roles of acetotrophic and hydrogenotrophic methanogens during anaerobic conversion of biomass to methane: A review. Rev. Environ. Sci. Bio/Technol. 2008, 7, 173–190. [Google Scholar] [CrossRef]


| Parameters | CR | WP | PO |
|---|---|---|---|
| TS (%) | 42.81 ± 0.72 | 27.20 ± 0.49 | - |
| VS (%) | 97.63 ± 1.09 | 95.23 ± 0.53 | - |
| N (% VS) | 1.10 ± 0.63 | 7.14 ± 0.66 | - |
| C (% VS) | 46.80 ± 0.19 | 53.22 ± 1.65 | 60.71 ± 1.15 |
| Carbohydrate (% VS) | 92.24 ± 0.18 | 1.43 ± 1.14 | - |
| Protein (% VS) | 7.13 ± 1.02 | 46.00 ± 0.95 | - |
| Lipid (% VS) | 0.72 ± 0.99 | 46.62 ± 1.30 | 99.99 ± 0.01 |
| Ash (% TS) | 2.40 ± 0.11 | 4.71 ± 0.07 | - |
| Lipid (% VS) | Carbohydrate (% VS) | Protein (% VS) | C/N | |
|---|---|---|---|---|
| T1 | 70 | 20 | 10 | 34.4 |
| T2 | 30 | 50 | 20 | 16.3 |
| T3 | 50 | 20 | 30 | 11.5 |
| T4 | 50 | 40 | 10 | 33.2 |
| T5 | 50 | 30 | 20 | 17.4 |
| BMP (mL/g VS) | TMP (mL/g VS) | GR (%) | |
|---|---|---|---|
| T1 | 422.25 ± 89.77 | 814.89 | 51.82 ± 11.02 |
| T2 | 381.03 ± 10.67 | 585.41 | 65.09 ± 1.82 |
| T3 | 326.12 ± 52.04 | 647.02 | 50.40 ± 8.04 |
| T4 | 497.44 ± 45.26 | 703.83 | 70.68 ± 6.43 |
| T5 | 424.96 ± 55.47 | 672.64 | 63.18 ± 8.25 |
| Rmax | M0 | λ | R2 | |
|---|---|---|---|---|
| T1 | 53.74 | 422.25 | 13.27 ± 0.40 | 0.990 |
| T2 | 42.04 | 381.03 | 7.54 ± 0.08 | 0.999 |
| T3 | 48.15 | 326.12 | 12.75 ± 0.28 | 0.995 |
| T4 | 58.23 | 497.44 | 8.21 ± 0.17 | 0.998 |
| T5 | 57.74 | 424.96 | 6.62 ± 0.19 | 0.997 |
| Acetoclastic Methanogens | Hydrogenotrophic Methanogens | |||
|---|---|---|---|---|
| Methanosarcina | Methanosaeta | Methanobrevibacter | Methanoculleus | |
| T1 | 27.8% | 3.3% | 5.8% | 9.0% |
| T2 | 54.6% | 2.8% | 3.0% | 8.4% |
| T3 | 46.9% | 6.5% | 10.3% | 10.8% |
| T4 | 10.7% | 3.0% | 7.3% | 5.7% |
| T5 | 30.2% | 1.5% | 3.1% | 5.8% |
| Simpson | Chao1 | ACE | Shannon | |
|---|---|---|---|---|
| T1 | 0.820239 | 1020.11 | 1105.69 | 4.15 |
| T2 | 0.716995 | 1066.71 | 1078.57 | 3.78 |
| T3 | 0.788785 | 898.16 | 960.46 | 4.29 |
| T4 | 0.969595 | 1181.93 | 1203.25 | 6.73 |
| T5 | 0.798913 | 601.00 | 601.00 | 3.98 |
© 2019 by the authors. Licensee MDPI, Basel, Switzerland. This article is an open access article distributed under the terms and conditions of the Creative Commons Attribution (CC BY) license (http://creativecommons.org/licenses/by/4.0/).
Share and Cite
Xue, S.; Zhao, N.; Song, J.; Wang, X. Interactive Effects of Chemical Composition of Food Waste during Anaerobic Co-Digestion under Thermophilic Temperature. Sustainability 2019, 11, 2933. https://doi.org/10.3390/su11102933
Xue S, Zhao N, Song J, Wang X. Interactive Effects of Chemical Composition of Food Waste during Anaerobic Co-Digestion under Thermophilic Temperature. Sustainability. 2019; 11(10):2933. https://doi.org/10.3390/su11102933
Chicago/Turabian StyleXue, Shengrong, Nan Zhao, Jinghui Song, and Xiaojiao Wang. 2019. "Interactive Effects of Chemical Composition of Food Waste during Anaerobic Co-Digestion under Thermophilic Temperature" Sustainability 11, no. 10: 2933. https://doi.org/10.3390/su11102933
APA StyleXue, S., Zhao, N., Song, J., & Wang, X. (2019). Interactive Effects of Chemical Composition of Food Waste during Anaerobic Co-Digestion under Thermophilic Temperature. Sustainability, 11(10), 2933. https://doi.org/10.3390/su11102933