Article

A Hybrid Model for Addressing the Relationship between Financial Performance and Sustainable Development

1
Straits Institute of Minjiang University, Fuzhou 350108, China
2
Institute of Higher Education Cooperation and Exchange across the Taiwan Strait, Minjiang University, Fuzhou 350108, China
3
Department of Accounting, Chinese Culture University, Taipei 11114, Taiwan
*
Author to whom correspondence should be addressed.
Sustainability 2019, 11(10), 2899; https://doi.org/10.3390/su11102899
Submission received: 28 February 2019 / Revised: 10 May 2019 / Accepted: 15 May 2019 / Published: 22 May 2019

Abstract

:
Measuring financial performance has become an essential topic due to the potential decimating impacts on the corporation itself as well as to whole societies during financial turmoil. In order to provide an overarching description of the multidimensional nature for measuring a corporation’s operations, it is preferable to employ data envelopment analysis (DEA). Different from prior research that merely focuses on a singular DEA performance rank, this study extends it to multiple DEA specifications (i.e., it combines inputs and outputs in several different ways) so as to make judgments more complete and robust. We also execute fuzzy visualization technique (i.e., nonlinear fuzzy robust principal component analysis, NFRPCA) to represent the main characteristics of data so that non-specialists can have better access to the results. The analyzed result is then fed into the restricted Boltzmann machine (RBM) to establish a model to forecast a firm’s operating performance. Even a fraction of accuracy improvement can result in considerable future savings to a firm and investors. When examined using real cases, the model is a promising alternative for operating performance forecasting and can assist both internal and external market participants.

1. Introduction

The financial distress of 2007 started in the U.S., promptly took the form of full-blown systematic risk in the U.S., and rapidly spread to other developed countries to become a serious global economic crisis [1,2,3,4,5]. Because the resultant financial distress had enormous impacts on firms and economies, such as impacting the stability of stock markets, decimating the values of corporations, and impeding the circulation of resources, financial distress prediction is gaining considerably greater interest. If the constructed prediction model is trustworthy and reliable, then managers can initiate some treatments to avoid further deterioration, before financial trouble erupts, and reach the goal of sustainable development, and market participants can adjust their investment strategy to maximize profitability under anticipated risk exposure [6,7,8,9].
From the seminal work done by Altman [10], which is grounded on multivariate discriminant analysis (MDA), a large volume of statistical-based techniques and operation research approaches have been consecutively implemented to deal with both credit risk and financial distress prediction. However, the aforementioned techniques have to satisfy some strict statistical assumptions, such as linear separability, multivariate normality, and independence of predictors, which are often violated in real-life applications [11,12,13]. With the rapid improvement of innovative data-driven technologies, computational intelligence (such as neural network (NN), decision tree (DT), and support vector machine (SVM)) not only has the ability to cope with non-linearity, but can also extract meaningful information from vague, imprecise data as well as identify implicit trends that are too complicated to be discovered by either users or traditional systems [7,8]. This study adopts computational intelligence due to its (1) superior generalization capability and (2) it does not obey statistical assumptions.
Compared with the well-established research studies in the literature on financial distress and credit risk prediction, works on performance forecasting are quite rare, even as it is widely recognized that the critical trigger for financial distress is bad operating performance [14,15,16]. Kamei [17] also indicated that bad operating performance is responsible for many financial distress cases (almost 99%). In other words, events such as firm insolvency and defaults on promissory notes do not just happen by coincidence. Instead, there are notable root causes that precede corporate financial distress, and it is the inability to deal with such events properly at an early stage that triggers the demise of these corporations [18]. In short, bad operating performance is not only an inevitable prior stage before financial distress erupts, but also ruins the goal of corporate sustainable development. This is because the corporation with good financial performance normally poses superior operating efficiency. A corporation’s operating efficiency increase (such as initiatives to improve energy efficiency, reduce CO2 emissions in production and transportation, reduce water use, eliminate the utilization of virgin materials, and reuse waste) means that it can reduce the operational costs so as to increase its profitability [19]. For example, Coca-Cola established a monitoring and targeting system in its plant to control and evaluate energy and water use, leading to a 15% reduction in water use, with a 6% increase in production. The solar park of Volkswagen AG in North America is expected to provide the electricity to all the plants when the manufacturing line is not ruining. Furthermore, Wanger and Bloom [20] identified the relationship between financial performance and sustainability. They divided their samples into two different subgroups based on their financial performance. Their finding showed that financially good-performing corporations have more resources to invest in sustainability, which, in return, lead to better financial results. Eccles et al. [21] also indicated that good financial performance corporations outperform bad financial performance corporations in terms of sustainable initiatives and accounting rate of return. That is, the corporation with good financial performance has a greater possibility to implement social and environmental sustainability so as to reach the goal of sustainable development.
How to evaluate and appropriately determine corporate operating performance is an attractive research topic. Past studies mainly focused on analyzing financial ratios such as return on assets (ROA) and return on investment (ROI), but these measures belong to the category of one-input and one-output techniques. However, merely implementing a one-input and one-output measurement to describe the whole facets of a corporation’s inherent operations is not reliable. In order to provide an overarching assessment to determine the corporation’s inherent operating performance, one can adopt data envelopment analysis (DEA), which handles multiple inputs and multiple outputs simultaneously without a pre-defined production function (e.g., profit maximization or cost minimization) [22,23].
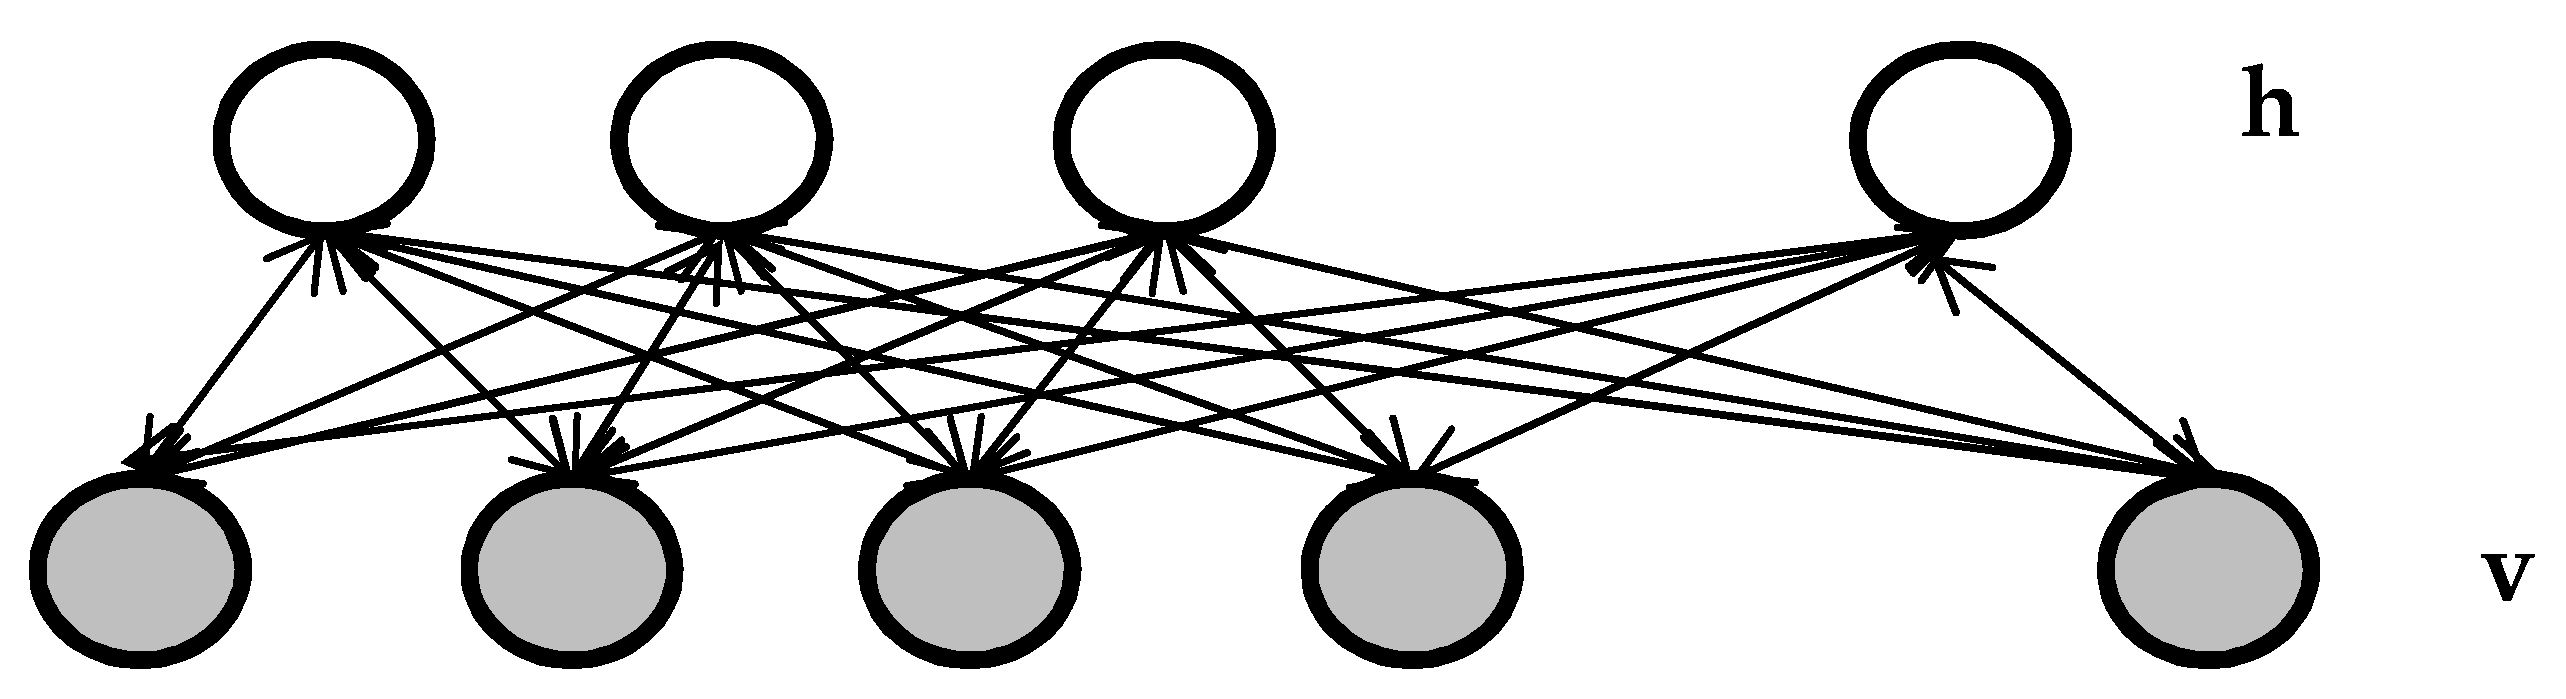
In today’s big data environment, users gather and disseminate data from so many different resources, but too much data without proper handling will confuse the users and push them to maybe even make an inappropriate decision. This is called the curse of dimensionality. DEA has the advantage of handling multiple inputs and multiple outputs simultaneously, but it comes with a weakness in that too much data will deteriorate its discriminant ability—that is, it cannot tell the difference between superior and inferior operating performances. To overcome this challenge, a novel dimensionality reduction technique, named the non-linear fuzzy robust principal component analysis (NFRPCA), was initiated. The analyzed outcome can then be fed into the restricted Boltzmann machine (RBM) to construct a model for corporate operating performance forecasting.
There is a clear requirement for precise decision-making support for both investments and the ongoing monitoring of the health of corporations. Even a fraction of forecasting accuracy improvement can translate into a tremendous amount of future savings [24]. An ensemble learning architecture is a set of individual classifiers whose predictions are integrated, leading to superior forecasting performance versus those from individual classifiers [25]. The fundamental idea of ensemble learning is to complement the error made by the individual model, which is widely recognized as one of the most efficient ways to improve the performance and robustness of the forecasting problem. Thus, the study used an ensemble learning strategy.
Managers can view the model as a decision support system (DSS) to assist them in forming better decisions under an anticipated risk level as well as reaching the goal of sustainable development. Investors can take the model as an investment guideline to modify their financing strategy and investment portfolio with the target of profit maximization. Policy makers can consider the potential implication of this research outcome and formulate future policies so as to solidify the stability of financial markets and upgrade a nation’s industrial level.
The aim of this study was therefore four-fold as follows:
  • To provide a sophisticated corporate operating performance forecasting model for managers to reach the goal of sustainable development, this study combined the utilization of financial ratios with a variety of DEA specifications;
  • To eliminate the curse of dimensionality as well as enhance the discriminant ability of DEA, this study performed a novel dimensionality reduction technique (NFRPCA);
  • To make the analysis outcome more accessible to non-specialists, this study executed a visualization technique to represent the main structure of the data; and
  • To improve the model’s forecasting quality as well as eliminate risk exposure to investors, this study adopted an ensemble learning strategy.
The rest of this study is organized as follows. Section 2 expresses the literature review. Section 3 briefly describes the implemented methodologies. Section 4 conducts some experiments to examine and compare the performance of the proposed model. Finally, Section 5 offers conclusions and some future work ideas.

2. Literature Review

How to diagnose the nature of financial distress is still an open topic in the domain of corporate finance and accounting. As it is widely acknowledged that bad operating performance is the main trigger for financial distress, performance assessment has therefore become an important issue for the business world and academics for several decades. The three most commonly used criteria to describe corporate operating performance are return on assets (ROA), return on investment (ROI), and return on equity (ROE), but they are solely derived from financial statements that could hide some essential information about true financial troubles through different estimation methods and selective accounting principles. Moreover, these criteria belong to the category of one-input and one-output measurement. Merely utilizing these simple criteria to depict the whole structure of a corporation’s operation is not reliable and trustworthy. DEA can deal with this obstacle by simultaneously handling multiple inputs and multiple outputs, and providing a final performance rank for each decision-making unit (DMU). However, the performance rank determined by DEA is affected by the inclusion or exclusion of an input or an output [26,27]—that is, the utilization of different inputs or outputs will lead to different performance ranks. Rather than employ a single DEA specification, this study preferred to go beyond a single performance rank and extended into multiple DEA specifications (i.e., it combined inputs and outputs in several dissimilar ways). By doing so, we achieved two objectives at the same time: (1) the assessment mechanism is useful for examining the robustness of the results, and (2) a bundle of performance ranks yields comprehensive information for classifying the units of observations [28].
Although multiple DEA specifications can provide overarching information for decision makers to form appropriate decisions, they still come with some challenges as too much information will confuse the decision makers and too much data fed into DEA will deteriorate its discriminant ability. To overcome this challenge, one can utilize NFRPCA (i.e., one of the dimensionality reduction techniques). The original data going through the NFRPCA procedure not only can facilitate the decision-making process of the users, but also can enhance DEA’s discriminant ability. By combining the utilization of DEA specifications, financial indicators, and dimensionality reduction technique, we were able to classify corporations into four different categories and designated those that have superior operating performance and those that have inferior operating performance. In other words, we transformed the performance assessment task into a conventional binary classification task. The determined results were then fed into the restricted Boltzmann machine (RBM) to construct the model for corporate operating performance forecasting.

3. Methodology

Restricted Boltzmann Machine Ensemble (RBME)

The restricted Boltzmann machine (RBM), a probabilistic graphical mechanism that can be deemed as a stochastic neural network, has gained considerable attention in the artificial intelligence (AI) community due to its remarkable advantages, such as outstanding representation capability, fast extraction of helpful information from a complex dataset, and quick identification of abstract features [29,30,31,32]. Furthermore, with the great improvement and advancement in computing power and the development of efficient learning algorithms (i.e., contrastive divergence), the RBM has demonstrated its effectiveness in numerous forecasting tasks [29].
The RBM has a two-layer architecture with a set of visible units v of dimension G depicting the observable data, and a set of binary hidden units h of dimension B that learn to express features that capture the higher-order correlation in the observed data. These two layers are linked together by means of the symmetrical weight matrix E R G × B , whereas there are no linkages within the same layer. The conceptual architecture of the two-layer RBM is represented in Figure 1. The RBM initially introduced the utilization of visible and hidden binary units, but it can also be extended to adopt numerous dissimilar sorts of units, such as Gaussian units, binominal units, softmax units, and so forth [30].
The RBM, in reality, can be deemed as a Markov random field that attempts to express input data with hidden units. The weights between two layers are encoded by a statistical relationship. Given the energy function K ( v , h ) of the state ( v , h ) , the joint distribution over the visible units and hidden units is described in Equation (1):
P ( v , h ) = 1 Z exp ( K ( v , h ) ) ,
where Z denotes the normalization constant. The binary visible and hidden units are depicted in Equation (2):
Z = v h exp ( K ( v , h ) ) .
For the real-valued visible units and binary units, the normalization constant Z can be determined by Equation (3):
Z = v h exp ( K ( v , h ) ) d v .
The visible units are binary-valued, and the energy function can be shown in Equation (4):
K ( v , h ) = i = 1 G j = 1 B v i E i j h j j = 1 B m j h j i = 1 G n i v i ,
where the biases of the hidden and visible units are depicted as m j and n i , respectively. If the visible units are real-valued, then the energy function K ( v , h ) , incorporated with a quadratic term, can be expressed in Equation (5):
K ( v , h ) = 1 2 i = 1 G v i 2 i = 1 G j = 1 B v i E i j h j j = 1 B m j h j i = 1 G n i v i .
According to the abovementioned energy function, we can see that the hidden units h j are independent of each other when conditioned on v , since there are no direct linkages among all hidden units. In the same vein, the visible units v i are also independent of each other when conditioned on h . Conditioning on the visible layer, the units of a binary hidden layer are independent Bernoulli random variables. The probability of binary state h j of each hidden unit j is set to 1, and seen in Equation (6):
p ( h j = 1 | v ) = ρ ( i E i j v i + m j ) ,
where ρ ( q ) = 1 / ( 1 + exp ( q ) ) denotes the sigmoid activation function.
The visible units conditioned on the hidden layer are independent Bernoulli random variables under the situation of visible units having binary values. The probability of the binary state v i of each visible unit i is set to 1, and depicted in Equation (7):
p ( v i = 1 | h ) = ρ ( j E i j h j + n i ) .
The visible units conditioned on the hidden layer are independent Gaussian random variables for the case of visible units having real values, and the mathematical formulation can be represented in Equation (8):
p ( v i | h ) = D ( j E i j h j + n i , 1 ) ,
where D ( ) expresses the Gaussian distribution function.
The RBM is a generative model, and the inherent parameters can be determined by implementing a stochastic gradient descent algorithm. By aggregating all possible hidden vectors, the probability that the network assigns to a visible vector can be decided:
p ( v ) = 1 Z h exp ( K ( v , h ) )
The weight of the derivative of the log probability of a training vector can be decided by Equation (10):
log p ( v ) E i j = [ v i h j ] d a t a [ v i h j ] mod e l ,
where the bracket expresses expectations under the distribution determined by the subscript follows. The subscripts data and model in Equation (10) depict the distribution of the data and the equilibrium distribution decided by the RBM, respectively. Based on this concept, we updated the learning rule of the weight very easily, represented in Equation (11):
Δ E i j = λ [ ( v i h j ) d a t a ( v i h j ) mod e l ] ,
where λ depicts the learning rate.
How to get a precise sample of ( v i h j ) mod e l under the situation of calculating the exact gradient of the log probability of training data is very complicated. In order to solve this obstacle, an efficient and faster learning rule, called contrastive divergence (CD), was introduced:
Δ E i j = λ [ ( v i h j ) d a t a ( v i h j ) r e c o n ] ,
where recon describes a distribution decided by implementing alternative Gibbs sampling for 1 step, and Gibbs sampling is initialized with the data.
According to a similar concept for the learning rule of E i j , the biases of hidden and visible units (i.e., m j and n i ) can be updated by the following equations:
Δ m j = λ [ ( h j ) d a t a ( h j ) r e c o n ]   and
Δ n i = λ [ ( v i ) d a t a ( v i ) r e c o n ] .
Ensemble learning is an active research field in AI owing to its great potential to enhance the forecasting quality of a singular classifier. Even a fraction of improvement in forecasting accuracy can translate into a considerable amount of future monetary savings. Due to the urgent requirement for forecasting quality improvement, this study extended the singular classifier to an ensemble one (i.e., RBM ensemble: RBME) by implementing the bagging and random subspace method (RSM). By doing so, decision makers can receive much more accurate and unbiased forecasting outcomes as well as protect their personnel or investment wealth.

4. Research Design and Analysis

4.1. The Data

The capital-intensive electronics industry in Taiwan has gained considerable attention due to its great impact and influence on the global supply chain. The Taiwan government has also allocated considerable resources and provided numerous financing incentives to upgrade this sector’s industrial level. Electronics firms in Taiwan make up an important capital market for global investors/market participants, as related listed firms typically make up over 60% of the domestic stock market turnover. Therefore, we chose the electronics industry in Taiwan from 2016 to 2018 as our research sample. After deleting the missing and extreme data, 1200 samples were preserved. All the data were collected from public websites, such as Taiwan Economic Journal Data Bank (TEJ), Taipei Exchange (TE), and Taiwan Stock Exchange Corporation (TSEC) from the period of 2015–2017.

4.2. The DEA Specifications and Predictors

By executing DEA to determine corporate operating performance, the informative input and output variables can be decided. In accordance with prior work done by Xu and Wang [31], total assets (TA), total liability (TL), and the cost of goods sold (COGS) were identified as input variables, and earnings before interest and tax (EBIT) and total sales (TS) were decided as output variables. In order to examine the representativeness of the chosen variables, we conducted the Pearson correlation (Table 1). A higher correlation coefficient implies a closer relation between two variables, while a lower correlation coefficient implies less correlation. The results in Table 1 state that all the selected variables show significant positive correlation. Obviously, it is not necessary to remove any of the selected variables.
It is necessary, however, to look beyond a singular DEA score so as to provide an overarching consideration of corporate operating assessment. To deal with this challenge, we implemented a variant of DEA specifications (i.e., three input variables and two output variables can generate 14 different combinations) that combined input and output variables in several dissimilar ways. Table 2 shows all DEA specifications.
The corporate operating performance forecasting is highly related to the issue of corporate financial distress prediction, whereby the selected predictors are designated as the condition variables in this study. Table 3 shows the descriptive statistics of selected predictors.

4.3. The Assessment Criteria

Assessment criteria have dissimilar influences on financial risk prediction. For example, false negative (FN) is the amount of positive or abnormal cases that is misclassified as normal cases. Since positive cases are distressed, inefficient, or fraudulent accounts in financial risk prediction, a forecasting mechanism with a higher FN rate can lead to tremendous losses for stock market participants as well as negatively influence the stability of the economy and stock market. Therefore, compared with a false positive (FP) rate, the FN rate should have higher importance in a forecasting task. One of the most commonly executed assessment criteria is overall accuracy/error rate. However, merely relying on one assessment criterion to determine the appropriate forecasting mechanism is not reliable and trustworthy. To yield a more comprehensive measurement, we utilized three other assessment criteria: recall, precision, and F-measure. The mathematical formulations are depicted as follows, and the confusion matrix is shown in Table 4 [32,33,34,35].
Overall accuracy (OA): this criterion is the percentage of a precisely classified module:
O A = ( T N + T P ) ( T P + F P + F N + T N ) .
Precision (Pre): this criterion is the amount of predicted fault-prone modules that precisely are fault-prone modules:
P r e = T P ( T P + F P ) .
Recall (Rec): this criterion is the number of fault-prone modules that are precisely predicted:
R e c = T P ( T P + F N ) .
F-measure: this criterion is the harmonic mean of precision and recall that has been widely implemented in AI fields:
F = 2 × P r e × R e c ( P r e + R e c ) .

4.4. The Forecasting Outcome

To provide a more sounded measurement, two types of information are considered: 5 indicators derived from financial statements (i.e., gross profit ratio, sales growth rate, inventory turnover rate, earnings per share, and net profit margin) and a performance score obtained from 14 possible DEA specifications (see Table 2). To be much more understandable to non-specialists, visualization technique, one of the dimensionality reduction architecture, namely NFRPCA was conducted. The first component was by far the most essential, accounting for 65.84% of the variability in the data. The addition of the second component increased this percentage to 85.16% (see Table 5). The first two components provided an adequate representation of the data. According to the data structure, we can classify the data into four categories. The data located in quadrant I are designated as having superior operating performance, and the data located in quadrant III are deemed as having inferior operating performance. The analyzed results are fed into the RBME to construct the forecasting model. We conducted five-fold cross-validation (CV) to eliminate the influence of over-fitting. To test the usefulness of NFRPCA, the experiments were separated into two dissimilar scenarios: (1) with principal component analysis (PCA) and (2) with nonlinear fuzzy robust principal component analysis (NFRPCA). To ensure the result did not happen by coincidence, a statistical examination was implemented. Table 6 shows the result. This finding is in accordance with Luukka [36] who indicated that the NFRPCA can project the data sets into a more feasible form. Furthermore, the introduced model not only can be represented in a singular structure, it also can be extended to an ensemble structure.
To examine the effectiveness of ensemble strategies, the experiments were divided into two different scenarios: (1) with ensemble strategies and (2) without ensemble strategies. Table 7 presents the result. We can see that the model with ensemble strategies can not only attain superior forecasting quality under all assessment criteria, but can also facilitate decision-makers to form an appropriate judgment [37]. This finding is in line with prior work done by Wozniak et al. [38] who indicated that an ensemble structure can achieve enhanced forecasting performance by integrating many singular classifiers and using their strengths. The result also can be explained by the famous “no free lunch” theorem introduced by Wolpert [39], which indicated that there is no specific classifier modelling method that is optimal for all forecasting tasks, as each method has its specific competitive edge.
To reach a more reliable research finding, this study took the introduced model as a benchmark and compared it with another four different AI-based techniques: decision tree (DT), rough set theory (RST), random forest (RF), and extreme learning machine (ELM). However, it is widely recognized that there is no individual forecasting mechanism that performs the best under all assessment criteria (see Table 8). Rokach [40] stated that the classifier selection can be transformed into a multiple criteria decision analysis (MCDA) task. Before executing the MCDA algorithm, the competitive score of each classifier under different assessment criteria should be decided. The competitive score is computed by utilizing a paired t-test for each classifier at the 5% significance level. The purpose of the paired t-test is to assess whether the superior or inferior competitive score of one classifier over another is statistically significant. We conducted one of the MCDA algorithms, called TOPSIS, to solve this task, because it poses a straightforward computational process, has easy-to-understand decision logics, and the mathematical formulation is rational and understandable. Table 9 shows the competitive score of each classifier and Figure 2 represents the ranking priority of each classifier. We can see that the proposed model reached the 1st rank, meaning that the proposed model outperformed the other four models.

4.5. Robustness Test

Most parts of previous works only utilized one pre-decided database to reach a final conclusion that cannot necessarily be fully trusted in today’s highly fluctuating business environment. To prevent users from reaching a biased outcome, we tested our introduced model with another two databases: (1) Condition 1: the performance rank is decided by a traditional financial ratio (i.e., ROA); and (2) Condition 2: the performance rank is determined by a singular DEA score. The results are shown in Figure 3 and Figure 4. We can see that the proposed model performed better in the two different databases.
To ensure that the selected performance measure was fairly representative, we considered each corporation’s credit rating status. The corporate credit rating status is evaluated by an independent institution that aims to find out how a corporation is able to meet its financial obligation and specifically relies on a detailed and comprehensive analysis of all the risk factors of the measure object [41]. The usage of credit rating status is widely taken as a measure of corporation’s risk and creditworthiness [42,43]. The rating status can be divided into 10 ranks, ranging from best to worst (ranks from 1 to 4 express low risk; from 5 to 6 express middle risk; and from 7 to 10 express high risk). The results under three different performance measures are shown in Figure 5. We can see that the corporation with superior performance derived from multiple DEA specifications has better credit rating status. In contrast, most corporations with good ROA performance still have bad credit rating status. That is, the discriminant ability of multiple DEA specifications outperforms that of the other two measures.
Corporations should realize how corporate sustainability is established in s specific context and how the concept of sustainable development can be implemented to the business level and what corporations should do when they intend to reach the goal of sustainability [44]. For example, efficient utilization of the corporation’s valuable resources, handling the requirements of all the stakeholders appropriately, maximizing the corporation’s long term profitability, and so on, should be covered in the domain of corporate governance [45]. When integrating sustainability with corporate governance, the corporation should propose an avenue that will result in the creation of social, environmental, and economic value [46]. It is an urgent and required task to establish corporate governance that incorporates a positive response to the corporation’s social, economic, and environmental risk, and chances that have the potential to affect the financial outcome of the corporations [47,48]. So, the corporate governance can be viewed as the integral part of sustainability. We divided our research samples into two different subgroups based on their corporate governance performance. The corporations with strong corporate governance normally perform better than the corporations with weak corporate governance in terms of financial performance (see Table 10). The finding is in accordance with the work done by Eccles et al. [21]. That is, the corporations with superior financial performance has higher potential to invest in sustainability.

5. Conclusions

Compared with thoroughly studied projects on financial distress prediction, works on performance forecasting are quite rare, even as it is widely acknowledged that a corporation’s bad operating performance is the critical trigger for financial distress. Thus, this study introduced a novel hybrid mechanism that combined different technologies—as financial indicators and efficiency scores—in order to present a comprehensive description of corporate operating performance evaluation for users to make reliable judgments. The financial indicators were collected from financial statements, and the efficiency scores were obtained from 14 different DEA specifications (i.e., inputs and outputs are combined in several dissimilar ways). It has been demonstrated that there are numerous advantages from computing efficiency scores under all possible specifications of the DEA model [49]. While it is obvious that such a mechanism generates much redundancy, it does provide valuable and useful information. In order to make the outcome accessible to non-specialists, we employed a data reduction technique, called NFRPCA, to visualize the data’s main characteristics. By doing so, we can determine which corporation belongs to the efficient group and which corporation belongs to the inefficient group.
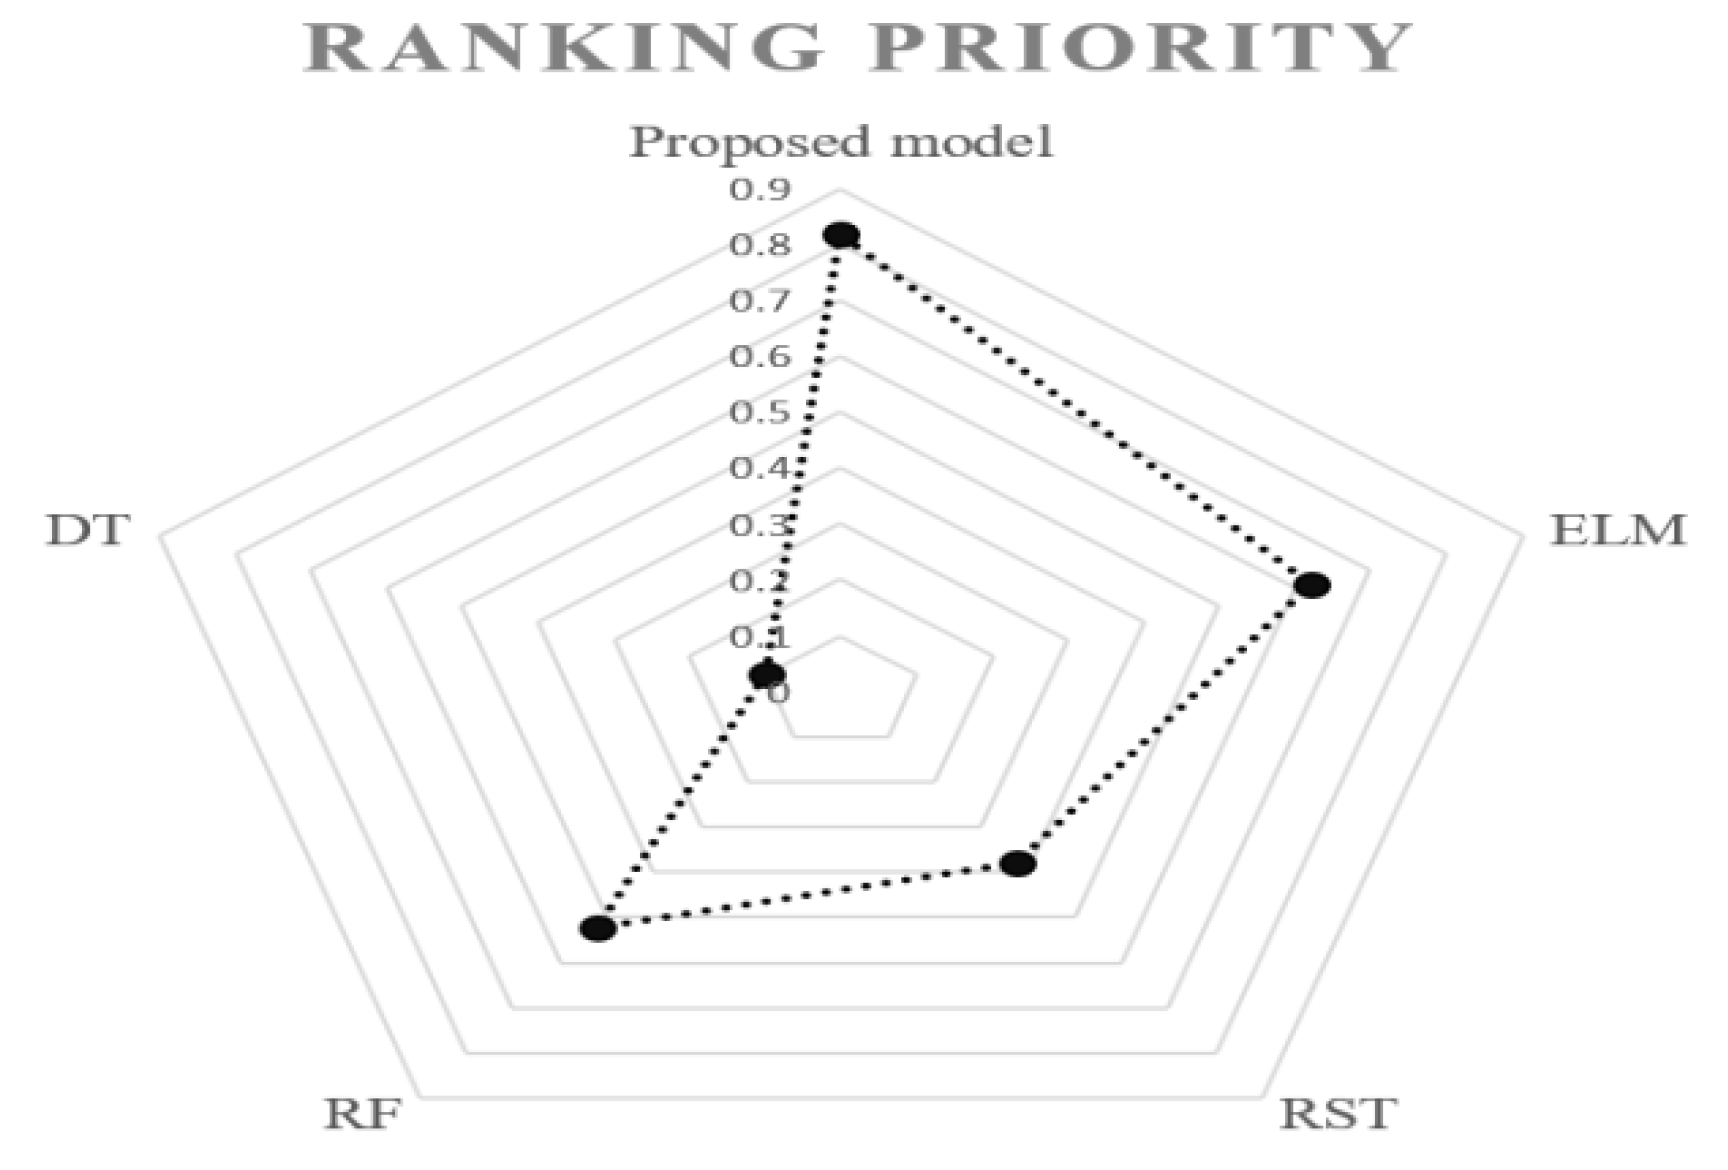
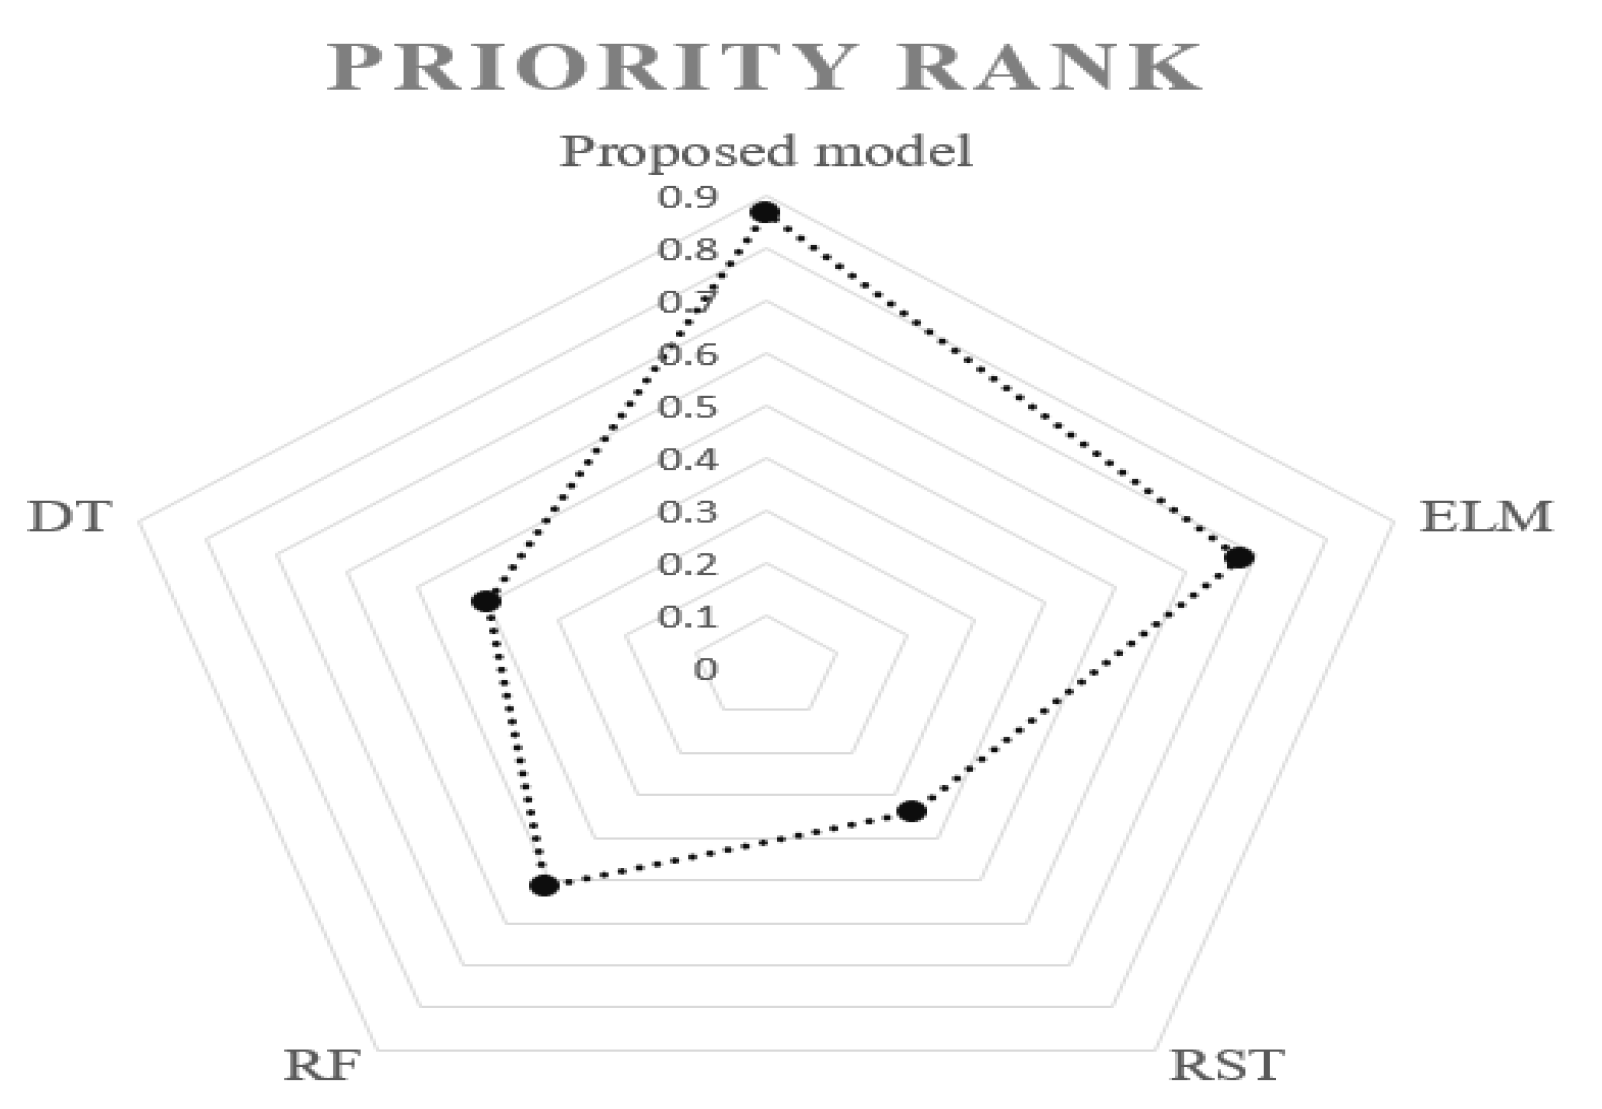
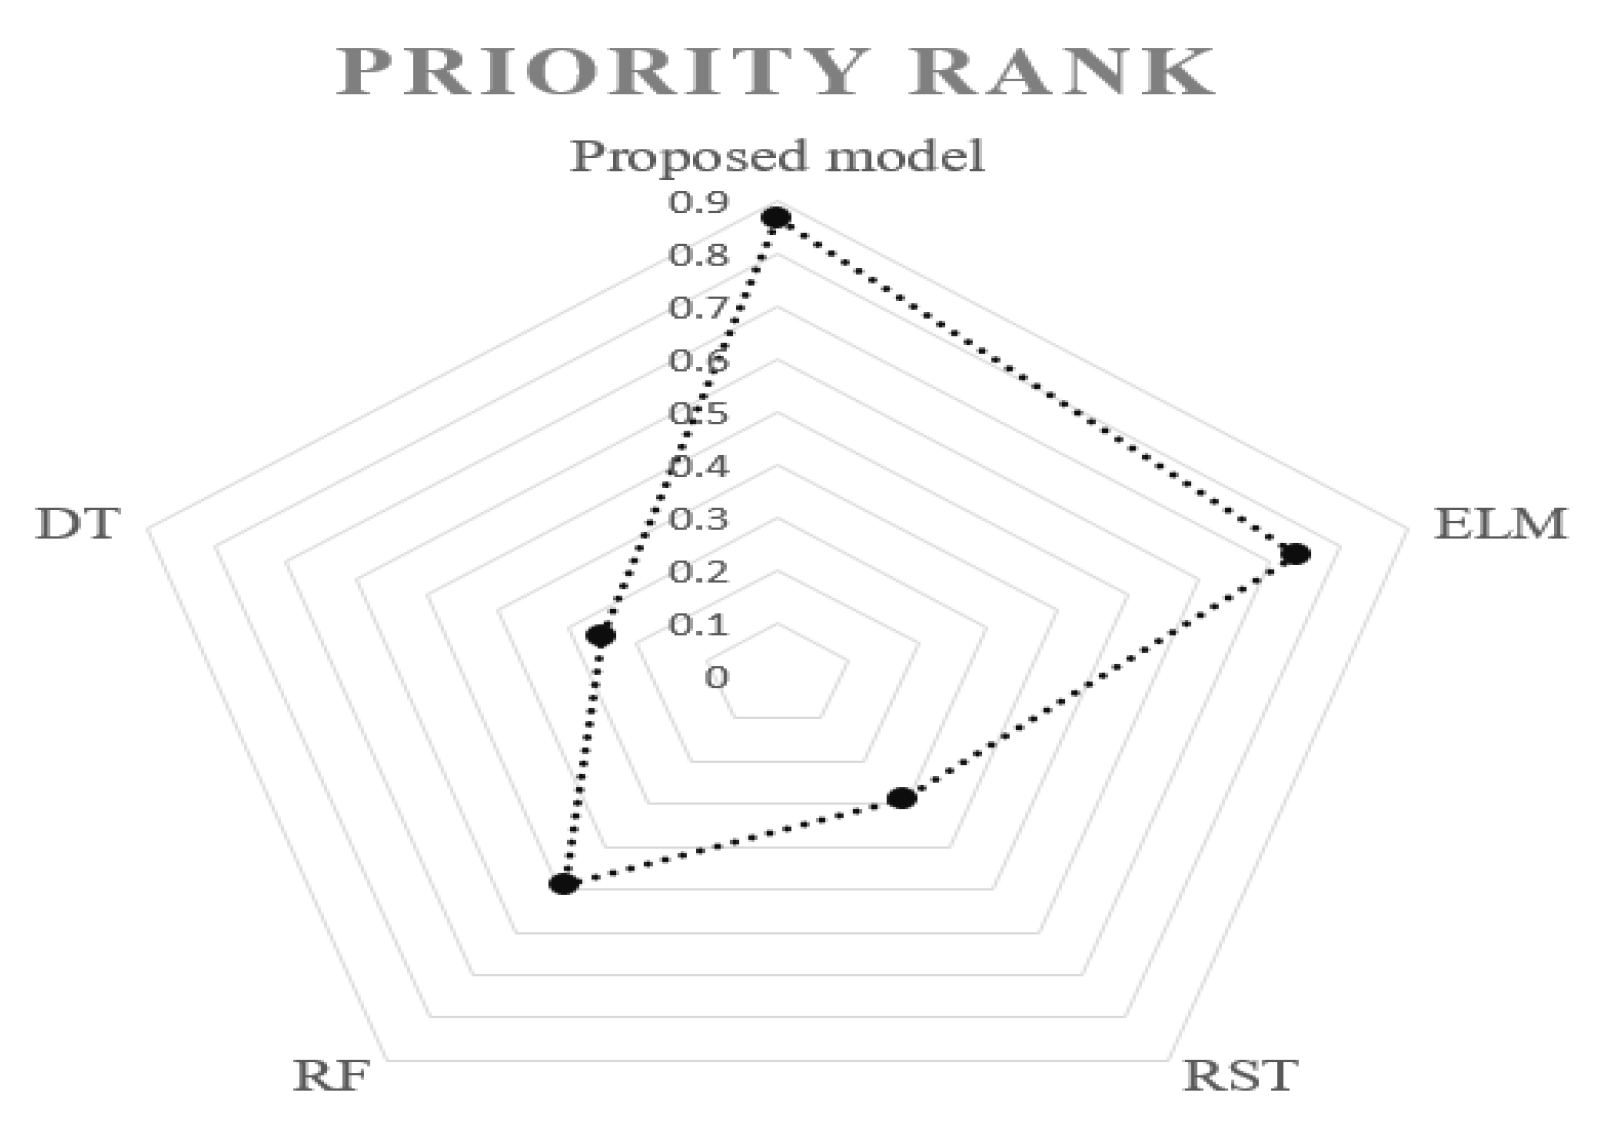
We then sequentially fed the analyzed outcome into the RBME to construct the model for corporate operating performance forecasting. To enhance the model’s forecasting quality, the introduced model was extended to an ensemble structure. Even a fraction of improvement in forecasting accuracy can be converted into tremendous future savings. However, no specific model can attain the best forecasting outcome under all assessment criteria. Model selection is a classical MCDA task, which can be handled through an MCDA algorithm. The model herein, examined by real cases, is a promising alternative for corporate operating performance forecasting. Corporate managers can take this model as a guideline to adjust their firm’s financial structure so as to reduce the cost of capital as well as enhance its profit margin. A corporation with greater profits implies that it has higher risk-absorbing ability to survive in this highly turbulent business environment and greater possibility to reach the goal of sustainable development. Investors can view the model as a roadmap to modify their investment portfolio to maximize personal wealth under anticipated risk level. Policy makers can consider the potential implication of the research outcome and formulate future policies to strengthen financial markets as well as reach the goal of efficient markets.
Future works can consider two potential research directions. First, we worked on the target sample of Taiwan’s electronics industry, which suggests that the ability to generalize the results is limited. Future studies can look into other industries or conduct cross-country analyses. Second, future direction can enhance the model’s forecasting quality by considering much more sophisticated information, such as R&D expenditure and innovation capability. This is because innovation capability has been widely viewed as an essential element for sustainable economic growth as well as for representing the corporation’s competitive advantage [50,51,52,53,54].

Author Contributions

The following statements should be used “conceptualization, Y.Z. and M.L.; methodology, M.L.; software, M.L.; validation, Y.Z. and M.L.; formal analysis, Y.Z. and M.L.; investigation, Y.Z. and M.L.; resources, M.L.; data curation, M.L.; writing—original draft preparation, Y.Z. and M.L.; writing—review and editing, Y.Z. and M.L.; visualization, M.L.; supervision, Y.Z. and M.L., please turn to the CRediT taxonomy for the term explanation. Authorship must be limited to those who have contributed substantially to the work reported.

Funding

This research was funded by Straits Institute of Minjiang University and Institute of Higher Education Cooperation and Exchange across the Taiwan Strait, Minjiang University.

Conflicts of Interest

No conflict of interest exists in the submission of this manuscript.

References

  1. Ciani, M.; Gagliardi, F.; Riccarelli, S.; Betti, G. Fuzzy Measures of Multidimensional Poverty in the Mediterranean Area: A Focus on Financial Dimension. Sustainability 2019, 11, 143. [Google Scholar] [CrossRef]
  2. Dinçer, H.; Yüksel, S.; Şenel, S. Analyzing the Global Risks for the Financial Crisis after the Great Depression Using Comparative Hybrid Hesitant Fuzzy Decision-Making Models: Policy Recommendations for Sustainable Economic Growth. Sustainability 2018, 10, 3126. [Google Scholar] [CrossRef]
  3. Lane, P.R. The European sovereign debt crisis. J. Econ. Perspect. 2012, 26, 49–67. [Google Scholar] [CrossRef]
  4. Covitz, D.; Liang, N.; Suarez, G.A. The evolution of a financial crisis: Collapse of the asset-backed commercial paper market. J. Financ. 2013, 68, 815–848. [Google Scholar] [CrossRef]
  5. Grout, P.A.; Zalewska, A. Stock market risk in the financial crisis. Int. Rev. Financ. Anal. 2016, 46, 326–345. [Google Scholar] [CrossRef] [Green Version]
  6. Geng, R.; Bose, I.; Chen, X. Prediction of financial distress: An empirical study of listed Chinese companies using data mining. Eur. J. Oper. Res. 2015, 241, 236–247. [Google Scholar] [CrossRef]
  7. Liang, D.; Lu, C.C.; Tsai, C.F.; Shih, G.A. Financial ratios and corporate governance indicators in bankruptcy prediction: A comprehensive study. Eur. J. Oper. Res. 2016, 252, 561–572. [Google Scholar] [CrossRef]
  8. Hsu, M.F.; Yeh, C.C.; Lin, S.J. Integrating dynamic Malmquist DEA and social network computing for advanced management decisions. J. Intell. Fuzzy Syst. 2018, 35, 231–241. [Google Scholar] [CrossRef]
  9. Lin, S.J.; Hsu, M.F. Decision making by extracting soft information from CSR news report. Technol. Econ. Dev. Econ. 2018, 24, 1344–1361. [Google Scholar] [CrossRef]
  10. Altman, E.I. Financial ratios, discriminant analysis and the prediction of corporate bankruptcy. J. Financ. 1968, 23, 589–609. [Google Scholar] [CrossRef]
  11. Zhang, L.; Zhou, W.D. Fisher-regularized support vector machine. Inf. Sci. 2016, 343, 79–93. [Google Scholar] [CrossRef]
  12. Ju, H.; Hou, Q.; Jing, L. Select this result for bulk action Fuzzy and interval-valued fuzzy nonparallel support vector machine. J. Intell. Fuzzy Syst. 2019, 36, 2677–2690. [Google Scholar] [CrossRef]
  13. Wang, G. Safety evaluation model for smart driverless car using support vector machine. J. Intell. Fuzzy Syst. 2019. [Google Scholar] [CrossRef]
  14. Hajek, P.; Olej, V.; Myskova, R. Forecasting corporate financial performance using sentiment in annual reports for stakeholders’ decision-making. Technol. Econ. Dev. Econ. 2014, 20, 721–738. [Google Scholar] [CrossRef]
  15. Lin, R.; Chen, Z. Modified super-efficiency DEA models for solving infeasibility under non-negative data set. INFOR Inf. Syst. Oper. Res. 2018, 56, 265–285. [Google Scholar] [CrossRef]
  16. Zhu, W.; Sun, P.; Zhang, Q. Context-dependent data envelopment analysis with common set of weights. INFOR Inf. Syst. Oper. Res. 2018, 56, 286–297. [Google Scholar] [CrossRef]
  17. Kamei, T. Risk Management; Dobunkan: Tokyo, Japan, 1997. (In Japanese) [Google Scholar]
  18. Shirata, C.Y.; Sakagami, M. An analysis of the “going concern assumption”: Text mining from Japanese financial reports. J. Emerg. Tech. Account. 2008, 5, 1–16. [Google Scholar] [CrossRef]
  19. Soytas, M.A.; Denizel, M.; Usar, D.D. Addressing endogeneity in the causal relationship between sustainability and financial performance. Int. J. Prod. Econ. 2019, 210, 56–71. [Google Scholar] [CrossRef]
  20. Wagner, M.; Blom, J. The reciprocal and non-linear relationship of sustainability and financial performance. Bus. Eth. 2011, 20, 418–432. [Google Scholar] [CrossRef]
  21. Eccles, R.G.; Ioannou, I.; Serafeim, G. The impact of corporate sustainability on organizational processes and performance. Manag. Sci. 2014, 60, 2835–2857. [Google Scholar] [CrossRef]
  22. Basso, A.; Casarin, F.; Funari, S. How well is the museum performing? A joint use of DEA and BSC to measure the performance of museums. Omega 2018, 81, 67–84. [Google Scholar] [CrossRef]
  23. Li, Z.; Crook, J.; Andreeva, G. Dynamic prediction of financial distress using Malmquist DEA. Expert. Syst. Appl. 2017, 80, 94–106. [Google Scholar] [CrossRef] [Green Version]
  24. West, D.; Dellana, S.; Qian, J. Neural network ensemble strategies for financial decision applications. Comput. Oper. Res. 2005, 32, 2543–2559. [Google Scholar] [CrossRef]
  25. Jurek, A.; Hong, J.; Chi, Y.; Liu, W. A novel ensemble learning approach to unsupervised record linkage. Inf. Syst. 2017, 71, 40–54. [Google Scholar] [CrossRef] [Green Version]
  26. Parkin, D.; Hollingsworth, B. Measuring production efficiency of acute hospitals in Scotland, 1991–1994: Validity issues in data envelopment analysis. Appl. Econ. 1997, 29, 1425–1433. [Google Scholar] [CrossRef]
  27. Sagarra, M.; Mar-Molinero, C.; Agasisti, T. Exploring the efficiency of Mexican universities: Integrating data envelopment analysis and multidimensional scaling. Omega 2017, 67, 123–133. [Google Scholar] [CrossRef]
  28. Raveh, A. Co-plot: A graphic display method for geometrical representations of MCDM. Eur. J. Oper. Res. 2000, 125, 670–678. [Google Scholar] [CrossRef]
  29. Xie, C.; Lv, J.; Li, X. Finding a good initial configuration of parameters for restricted Boltzmann machine pre-training. Soft Comput. 2017, 21, 6471–6479. [Google Scholar] [CrossRef]
  30. Welling, M.; Rosen-Zvi, M.; Hinton, G. Exponential family harmoniums with an application to information retrieval. NIPS 2005, 17, 1481–1488. [Google Scholar]
  31. Xu, X.; Wang, Y. Financial failure prediction using efficiency as a predictor. Expert Syst. Appl. 2009, 36, 366–373. [Google Scholar] [CrossRef]
  32. Peng, Y.; Wang, G.; Wang, H. User preferences based software defect detection algorithms selection using MCDM. Inf. Sci. 2012, 191, 3–13. [Google Scholar] [CrossRef]
  33. Kou, G.; Peng, Y.; Wang, G. Evaluation of clustering algorithms for financial risk analysis using MCDM methods. Inf. Sci. 2014, 275, 1–12. [Google Scholar] [CrossRef]
  34. Chang, T.M.; Hsu, M.F.; Lin, S.J. Integrated news mining technique and AI-based mechanism for corporate performance forecasting. Inf. Sci. 2018, 424, 273–286. [Google Scholar] [CrossRef]
  35. Hsu, M.F. Integrated multiple-attribute decision making and kernel-based mechanism for risk analysis and evaluation. J. Intell. Fuzzy Syst. 2019, 36, 2895–2905. [Google Scholar] [CrossRef]
  36. Luukka, P. A new nonlinear fuzzy robust pca algorithm and similarity classifier in classification on medical data sets. Int. J. Fuzzy Syst. 2011, 13, 153–162. [Google Scholar]
  37. Zhang, C.X.; Zhang, J.S.; Ji, N.N.; Guo, G. Learning ensemble classifiers via restricted Boltzmann machines. Pattern Recognit. Lett. 2014, 36, 161–170. [Google Scholar] [CrossRef]
  38. Wozniak, M.; Graña, M.; Corchado, E. A survey of multiple classifier systems as hybrid systems. Inf. Fusion 2014, 16, 3–17. [Google Scholar] [CrossRef]
  39. Wolpert, D. William Dembski’s treatment of the No Free Lunch theorems is written in jello. Math. Rev. 2003. Available online: http://www.talkreason.org/articles/orr.cfm (accessed on 20 May 2019).
  40. Rokach, L. Ensemble-based classifiers. Artif. Intell. Rev. 2012, 33, 1–39. [Google Scholar] [CrossRef]
  41. Hájek, P. Municipal credit rating modelling by neural networks. Decis. Support Syst. 2011, 51, 108–118. [Google Scholar] [CrossRef]
  42. Lin, S.J.; Chang, C.; Hsu, M.F. Multiple extreme learning machines for a two-class imbalance corporate life cycle prediction. Knowl. Based Syst. 2013, 39, 214–223. [Google Scholar] [CrossRef]
  43. Lin, S.J. Integrated artificial intelligence-based resizing strategy and multiple criteria decision making technique to form a management decision in an imbalanced environment. Int. J. Mach. Learn. Cybern. 2017, 8, 1981–1992. [Google Scholar] [CrossRef]
  44. Dyllick, T.; Hockerts, K. Beyond the business case for corporate sustainability. Bus. Strateg. Environ. 2002, 11, 130–141. [Google Scholar] [CrossRef]
  45. Sustentare. Sustainability Governance. 2010. Available online: http://www.sustentare.pt/pdf/doc.suste+sam(ENG1).pdf (accessed on 20 May 2019).
  46. Krechovska, M.; Prochazkova, P.T. Sustainability and its integration into corporate governance focusing on corporate performance management and reporting. Procedia Eng. 2014, 69, 1144–1151. [Google Scholar] [CrossRef]
  47. Zheng, J.; Wang, Y.M.; Chen, L.; Zhang, K. A new case retrieval method based on double frontiers data envelopment analysis. J. Intell. Fuzzy Syst. 2019, 36, 199–211. [Google Scholar] [CrossRef]
  48. Hsu, M.F. A fusion mechanism for management decision and risk analysis. Cybern. Syst. 2019. [Google Scholar] [CrossRef]
  49. Cinca, C.S.; Molinero, C.M. Selecting DEA specifications and ranking units via PCA. J. Oper. Res. Soc. 2004, 55, 521–528. [Google Scholar] [CrossRef] [Green Version]
  50. Lytras, M.D.; Raghavan, V.; Damiani, E. Big data and data analytics research: From metaphors to value space for collective wisdom in human decision making and smart machines. Int. J. Semant. Web Inf. Syst. 2017, 13, 1–10. [Google Scholar] [CrossRef]
  51. Lytras, M.D.; Visvizi, A. Who uses smart city services and what to make of it: Toward interdisciplinary smart cities research. Sustainability 2018, 10, 1998. [Google Scholar] [CrossRef]
  52. Visvizi, A.; Lytras, M.D. Rescaling and refocusing smart cities research: From mega cities to smart villages. J. Sci. Technol. Policy Manag. 2018, 9, 134–145. [Google Scholar] [CrossRef]
  53. Visvizi, A.; Lytras, M.D.; Damiani, E.; Mathkour, H. Policy making for smart cities: Innovation and social inclusive economic growth for sustainability. J. Sci. Technol. Policy Manag. 2018, 9, 126–133. [Google Scholar] [CrossRef]
  54. Hou, J.; Meng, J.; Zhu, L. Empirical analysis of corporate innovation, investor focus and stock slumps risk based on fuzzy mathematics and function optimization. Int. J. Fuzzy Syst. 2019. [Google Scholar] [CrossRef]
Figure 1. The conceptual structure of restricted Boltzmann machine (RBM).
Sustainability 11 02899 g001
Figure 2. The ranking priority of each classifier. (Note: ELM: extreme learning machine; RST: rough set theory; RF: random forest; DT: decision tree.)
Sustainability 11 02899 g002
Figure 3. The ranking priority of each classifier in Condition 1: the performance rank is decided by a traditional financial ratio.
Sustainability 11 02899 g003
Figure 4. The ranking priority of each classifier in Condition 2: the performance rank is determined by a singular DEA score.
Sustainability 11 02899 g004
Figure 5. The discriminant ability of each performance measure.
Sustainability 11 02899 g005
Table 1. The Pearson correlation results.
I1: TAI2: TLI3: COGSO1: EBITO2: TS
I1: TA1
I2: TL0.953 **1
I3: COGS0.866 **0.866 **1
O1: EBIT0.877 **0.877 **0.877 **1
O2: TS0.903 **0.903 **0.903 **0.903 **1
Note: TA: total assets, TL: total liabilities; COGS: cost of goods sold; EBIT: earnings before interest and tax; TS: total sales. * denotes p < 0.1; ** denotes p < 0.05; *** denotes p < 0.01.
Table 2. The modules of each data envelopment analysis (DEA) specification.
ModuleInput Output
DEA specification 1I1:TAO1:EBIT
DEA specification 2I1:TAO1:EBIT, O2:TS
DEA specification 3I2:TLO1:EBIT
DEA specification 4I2:TLO1:EBIT, O2:TS
DEA specification 5I3:COGSO1:EBIT
DEA specification 6I3:COGSO1:EBIT, O2:TS
DEA specification 7I1:TA, I2:TLO1:EBIT
DEA specification 8I1:TA, I2:TLO1:EBIT, O2:TS
DEA specification 9I1: TA, I3: COGSO1:EBIT
DEA specification 10I1:TA, I3:COGSO1:EBIT, O2:TS
DEA specification 11I2:TL, I3:COGSO1:EBIT
DEA specification 12I2:TL, I3:COGSO1:EBIT, O2:TS
DEA specification 13I1:TA, I2:TL, I3:COGSO1:EBIT
DEA specification 14I1:TA, I2:TL, I3:COGSO1:EBIT, O2:TS
Note: TA: Total assets, TL: total liabilities, COGS: cost of goods sold, EBIT: earnings before interest and tax, TS: total sales.
Table 3. The predictors.
PredictorsDescriptionMeanVariance
X1: NI/TANet income to total assets0.050.01
X2: TL/TATotal liability to total assets0.410.03
X3: S/TASales to total assets0.890.31
X4: TL/TETotal liability to total equity0.993.44
X5: WC/TAWorking capital to total assets0.310.04
X6: NI/(TA-TL)Net income to (total assets—total liability)0.050.20
X7: LTL/TALong-term liability to total assets0.060.01
X8: OI/TAOperating income to total assets0.040.01
Table 4. The confusion matrix.
Actual ( )/Predicted ( )Predicted PositivePredicted Negative
Positive caseTrue positive (TP)False negative (FN)
Negative caseFalse positive (FP)True negative (TN)
Table 5. Non-linear fuzzy robust principal component analysis (NFRPCA) results.
Component% of VarianceCumulative %
PC165.8465.84
PC219.3285.16
PC38.9294.08
Table 6. The forecasting result (PCA vs. NFRPCA).
Assessment CriteriaRBMStatistical Result
With NFRPCAWith PCA
OA72.5668.260.000 ***
Pre64.6060.400.000 ***
Rec66.15 62.03 0.000 ***
F65.3261.12 0.000 ***
Note: OA: overall accuracy; Pre: precision; Rec: recall; F: F-measure. * denotes p < 0.1; ** denotes p < 0.05; *** denotes p < 0.01.
Table 7. The forecasting result (With ensemble strategy vs. Without ensemble strategy).
Assessment CriteriaRBMSTATISTICAL RESULT
With ENSEMBLEWithout Ensemble
OA86.4872.560.000 ***
Pre82.4064.600.000 ***
Rec83.6066.150.000 ***
F82.9965.320.000 ***
Note: OA: overall accuracy; Pre: precision; Rec: recall; F: F-measure. * denotes p < 0.1; ** denotes p < 0.05; *** denotes p < 0.01.
Table 8. The forecasting result under four different assessment criteria.
ModelAssessment Criteria (Avg.)
OAPreRecF
Proposed model86.4882.4083.6082.99
ELM85.2872.2088.9379.67
RST81.2076.6076.4776.52
RF84.0870.8087.1578.03
DT78.5666.6077.1071.26
Note: ELM: extreme learning machine; RST: rough set theory; RF: random forest; DT: decision tree; OA: overall accuracy; Pre: precision; Rec: recall; F: F-measure.
Table 9. The competitive score.
ModelAssessment Criteria (Avg.)
OAPreRecF
Proposed model2312
ELM2−231
RST−22−30
RF0−12−1
DT−3−2−3−2
Table 10. The comparison results (Average).
ConditionCorporation with Strong Corporate GovernanceCorporation with Weak Corporate Governance
ROA0.07−0.09
Singular DEA0.620.41
Multiple DEA specifications0.530.34

