Article

Spatiotemporal Analysis to Observe Gender Based Check-In Behavior by Using Social Media Big Data: A Case Study of Guangzhou, China

School of Geography, South China Normal University, Guangzhou 510631, China
*
Authors to whom correspondence should be addressed.
Sustainability 2019, 11(10), 2822; https://doi.org/10.3390/su11102822
Submission received: 13 February 2019 / Revised: 8 May 2019 / Accepted: 13 May 2019 / Published: 17 May 2019
(This article belongs to the Special Issue Big Data Research for Social Sciences and Social Impact)

Abstract

:
In a location-based social network, users socialize with each other by sharing their current location in the form of “check-in,” which allows users to reveal the current places they visit as part of their social interaction. Understanding this human check-in phenomenon in space and time on location based social network (LBSN) datasets, which is also called “check-in behavior,” can archive the day-to-day activity patterns, usage behaviors toward social media, and presents spatiotemporal evidence of users’ daily routines. It also provides a wide range of opportunities to observe (i.e., mobility, urban activities, defining city boundary, and community problems in a city). In representing human check-in behavior, these LBSN datasets do not reflect the real-world events due to certain statistical biases (i.e., gender prejudice, a low frequency in sampling, and location type prejudice). However, LBSN data is primarily considered a supplement to traditional data sources (i.e., survey, census) and can be used to observe human check-in behavior within a city. Different interpretations are used elusively for the term “check-in behavior,” which makes it difficult to identify studies on human check-in behavior based on LBSN using the Weibo dataset. The primary objective of this research is to explore human check-in behavior by male and female users in Guangzhou, China toward using Chinese microblog Sina Weibo (referred to as “Weibo”), which is missing in the existing literature. Kernel density estimation (KDE) is utilized to explore the spatiotemporal distribution geographically and weighted regression (GWR) method was applied to observe the relationship between check-in and districts with a focus on gender during weekdays and weekend. Lastly, the standard deviational ellipse (SDE) analysis is used to systematically analyze the orientation, direction, spatiotemporal expansion trends and the differences in check-in distribution in Guangzhou, China. The results of this study show that LBSN is a reliable source of data to observe human check-in behavior in space and time within a specified geographic area. Furthermore, it shows that female users are more likely to use social media as compared to male users. The human check-in behavior patterns for social media network usage by gender seems to be slightly different during weekdays and weekend.

1. Introduction

In recent years, social media has dramatically expanded in popularity around the world and became an integral part of the information ecosystem in both application and research perspectives due to its unprecedented reach to masses (i.e., users, consumers, businesses, governments, and nonprofit organizations) [1]. Historically, traditional data sources (i.e., survey, census) [2,3] are analyzed to observe human activity behavior [4,5], lifestyle patterns [6], and gender differences [7], but these data sources are considered to be more expensive both in the collection and the analysis. This, in turn, requires more processing time and results in data sparsity. Policymaking and delivery of services are closely intertwined with city planning and human mobility. However, due to the limitations highlighted above, these traditional methods are considered to be less effective in policy-making and delivery of services [8].
A considerable amount of previous research [9,10,11,12,13,14] studied the demography of social media users and discussed reasons that influence people to use LBSN. These recent research studies highlighted the motivations for social media network use among both male and female users. Smith [9] argued that female users tend to use online social media to interact with families and friends rather than male users. Muscanell and Guadagno [15] put forward that male users mostly use online social media for making new relationships while female users utilize social media more for the maintenance of the relationship. Moreover, the pattern and motivation to use the social media network by both male and female users seems to be slightly different. Hwang and Choi [16] explored the online usage behavior of Weibo by college students and the motivations of usage by gender. Lastly, it was suggested that online usage behavior of Weibo acts as a platform to search for information on social issues and interests. Rossi and Musolesi [17] proposed methodologies to identify the unique users from check-in data and characterized the users by the spatiotemporal trails from the check-ins made over time and the frequency of visit to specific locations [16,18].
As part of online social interaction in LBSN’s [19,20], users [21] can announce their geo-location [22], announce the activity performed [23], and discuss places they visit (referred as “check-in” [24]). By the third quarter of 2017, Weibo [25] amounted up to 376 million monthly active users (MAU), 172 million daily active users (DAU). Among the active users, 93% were accessing Weibo through mobile devices [26,27]. This enormous number of users were attracted worldwide due to fast information sharing and check-in phenomenon [28], which generates high volumes of data (referred to as “Big Data” [29,30]). Irrespective of fundamental limits to demonstrate human check-in behavior [31], i.e., prejudice of gender, frequency sampling prejudice, and location type prejudice. Check-in reveals human check-in behavior in space and time. The motivations for using Weibo may differ between male and female users. Statistics show that 50.10% of Weibo users are male, 49.90% are female [32], and it is considered one of the most popular social media platforms in China [33] due to the unavailability of Facebook and Twitter. According to the China Internet Network Information Center (CNNIC) [34], 72% of the total Sina Weibo users were 20 to 35 years of age. Among them, the majority of users are in their 20s and constitute the heaviest users [16,35].
Currently, LBSN data are obtainable at a relatively cheap cost with information such as timestamps, location, and gender [36], and can be analyzed to perceive human check-in behavior as equated to the previously stated traditional datasets. Intrinsically, LBSN data offers new dimensions to help and create new techniques and methods to observe human check-in behaviors [37] and differences in gender. In the current study, we explore the LBSN data to observe human check-in behavior and intensity of check-ins during the period within a city at an individual level. Moving toward this direction, the research presented in the current study aims to investigate the spatiotemporal information related to the check-in to identify and determine human check-in behavior. The simple hypothesis is that people follow a typical daily routine: e.g., go to work, eat at some preferred restaurant, go shopping, and go back home.
Consequently, if we have enough data to observe distinctive human behaviors, such knowledge can be analyzed to understand human behavior by using LBSN check-in information as a proxy measure. Recent research [38,39,40,41,42] explored the LBSN datasets to examine people’s daily check-in behavior and mobility patterns in different cities rather than Guangzhou, China. However, most of the existing literature focused on Facebook and/or Twitter rather than Weibo. Therefore, this study will also serve to fill a research gap by focusing on the most popular Chinese local social network site, Sina Weibo, and study area as Guangzhou, China. Moreover, previous studies [16,18] explored gender-based check-in behavior analysis in Sina Weibo and suggested that women are more likely to use Sina Weibo to provide help and information to others. However, studies to date have not fully investigated gender-based check-in behavior analysis in Sina Weibo usage especially in Guangzhou, which also motivated the current study. The primary objective and contribution of the paper are twofold and can be summarized as follows.
  • The primary objective of the research is to characterize behavioral differences between male and female using the “check-in” function of the Sina Weibo (launched by Sina Corporation [43] in 2009).
  • The main contribution of our work consists of examining the check-in density by using KDE. The GWR method was applied to observe the relationship between check-in and districts with a focus on gender during weekdays and weekend. Lastly, the standard deviational ellipse (SDE) analysis is used to analyze the orientation, direction, spatiotemporal expansion trends and the differences of check-in behavior by male and female in Guangzhou, China, which was missing in the existing literature regarding gender-based check-in behavior analysis.
Moreover, this line of research can help improve our understanding of human check-in behavior and consider LBSN data (a source of big data) as a supplement to than a substitute of traditional data sources while taking a decision on policy making [44,45,46] associated with urban planning [47,48] and city functionalities [49].
The organization of the rest of the paper is as follows. Section 2 presents the literature review. Section 3 defines the study area and dataset. Section 4 presents the methodology. Section 5 presents the results and discussion for the experimental results performed on the dataset. Lastly, Section 6 concludes the paper and proposes some further research issues.

2. Literature Review

The research on spatial analysis has significantly progressed toward observing human behavior, which has long been constrained by traditional data sources with improved abilities to capture, analyze, and process LBSN data [50,51]. The terminology “social network site” (SNS) [52] denotes to web-based services [53] and is a social structure made up of individuals connected by one or more specific types of interdependency, such as friendship, common interests, and shared knowledge [54]. It allows users to (1) construct a profile, (2) articulate users’ social links, and (3) track and view shared social ties within the system [55,56,57]. Moreover, it reflects the real-life social networks among people through online platforms such as a website, providing ways for users to share ideas, activities, events, and interests over the Internet.
SNSs first emerged in the mid-1990s [56,58,59,60] as a simple mode of communication to interact with people over the Internet by using personal computers only [61]. Recent technological advancements of “smart” mobile devices empowered users in a variety of ways in existing social networks by adding location dimension and providing a potential benefit to access social network accounts on personal computers along with mobile devices [21]. Primarily, desktop computers were the modes to use, connect, and share information on SNSs [62], but, with the introduction of smartphones, the access to SNSs became convenient to use, connect, and share information with their “friends” [63] on the move [64,65]. With this rapid development of mobile phone technology, users can easily communicate and share information (i.e., text, audio, and video) progressively by using the geo-location [66]. The development of LBSNs progressed with the integration of communication technologies [67], which, in turn, provide fast sharing of information about what, where, why, and with whom users share information. LBSNs include geographic services (i.e., geo-location) and capabilities (geo-tagging) to assist in exploring social dynamics and make it an essential type of social networking [20,68], which allows the sharing of users’ current geolocation and discovering their friends’ location, which, in turn, raises users’ privacy concerns [69,70]. Privacy in LBSN primarily depends on legislative and business-oriented actors involved in data sharing even though privacy is not an individual issue. Yet, some of the personal data is shared unintentionally or willingly by the user [71,72,73,74]. Sometimes, the location is deliberately shared by users for the sake of benefits (i.e., customers can enter competitions, donate to charities, or earn additional loyalty credit) in exchange of information, branded hashtags, check-ins, or experiences on LBSN [75].
Various studies based on LBSN datasets to observe human check-in behavior under domains like privacy [73,76,77], gender differences [78], geographic spaces [56], urban emotions [79], activity location choice, lifestyle patterns [6,80,81,82], and operations and production management [83] have been conducted. Li and Chen [63] studied location sharing by the users in the real world, and presented data analysis results over user profiles, update activities, mobility characteristics, social graphs, and attribute correlations. Benevenuto et al. [84] analyzed the frequency and duration of social network connectivity, as well as the users, conduct of different activities on these sites differentiated by types and sequences. Chang and Sun [85] analyzed the LBSN dataset to point out the influence of factors where users check-in, including historical check-ins, similarity to historical places, where their friends check-in, time of day, and demographics. Lei et al. [86] spatiotemporally analyzed the LBSN dataset to observe the human dynamics regarding differences in gender, behavior in check-in, and online time duration in Beijing’s Olympic Village. Moreover, it argued that female users are more likely to interact in social media in comparison to male users. Hu and Zhang [87] utilized clustered spatiotemporal data and suggested a selection method. Moreover, exploratory spatial data analysis (ESDA) is performed to acquire the datasets with the prospects of quick grouping by mining the Weibo check-in data. Saleem et al. [88] explored the prominent locations and introduced a method of location influence with the ability to reach out geographically by using LBSN data. Furthermore, a memory-efficient algorithm was proposed, which resulted in efficient and scalable diverse sets of locations with a broad geographical spread. In addition, previous research [89,90,91,92] focused on observing human mobility patterns and analyzing check-in data for location prediction and venue tagging in the city by using LBSN datasets. While References [37,93] mainly focused on examining the factors that can predict the uses and patterns of using LBSN.
Many applications utilized the concept of automatic venue tagging to observe spatial differences [94,95]. While Gao and Liu [96] argued that temporal features and ranking of a user’s geo-location history are considered to be irrelevant with the integration of human mobility in LBSN. Yang et al. [97] explored check-in behavior and mobility patterns by analyzing the spatiotemporal distribution of geotagged social media data messages and activity patterns. Moreover, References [92,98,99] analyzed the large LBSN datasets to study the variation of urban spaces and observed the spatial characteristics of the social networks, which may arise in LBSN users. Muscanell and Guadagno [15] examined the impact of gender and personality on the use of Facebook and MySpace and reported that male users use social media for relationship formation while female users use social media for relationship maintenance. Moreover, female users are reported low in agreeableness while using instant messaging more often than male users is high in agreeableness, whereas male users are reported low in openness while playing more online games compared to female users are high in openness. Rzeszewski and Beluch [100] addressed the gap (representation and representativeness) in data by investigating the LBSN users, based on the spatiotemporal distribution of the content produced (demographics of the user population). While Guan et al. [101] studied the concentration and significance of users’ thoughts on Sina Weibo and Feng et al. [102] analyzed China’s city network based on users’ friend relationships and check-in behavior on Sina Weibo.
LBSN datasets have been exploited in various research studies for the urban development and its environmental hazards [103], expansion and exploration [104,105,106], travel and activity patterns [107,108], and disaster management [109,110,111], emergency mapping [112], Special Event Population [113], and urban sustainability [114]. Hong [115] highlighted various factors to observe the payment patterns and willingness of buyers by utilizing the LBSN dataset. Mazumdar et al. [116] proposed a prediction model, which gathers surreptitiously visited locations from an available user trajectory. Moreover, the relationship between a user’s checked-in data for predicting the unchecked or hidden locations was investigated. Dokuz and Celik [117] proposed a method to discover the user’s historical data and measures based on communally important locations for each user’s (individual’s) preferences. Furthermore, an algorithm was proposed that was compared with a naïve alternative using real-life Twitter dataset. Fiorio et al. [118] developed a methodology for parsing the population-level migration signal from individual-level point-in-time data using flexible time-scales. Moreover, a stochastic model was proposed for simulating patterns in digital trace data and test it against three datasets: geo-tagged Tweets and Gowalla check-ins. Wu et al. [119] analyzed the impact on housing prices when neighborhood land uses are mixed. By using geographic information system data, three quantitative measures of the land-use mix were created, and these measures were computed for various neighborhoods in Beijing’s central city. The research base on check-in behavior analytics is useful to know about gender-based human check-in behavior, but, under the scope of the current study, the connection with other indicators of gender equality [120,121] are not considered.

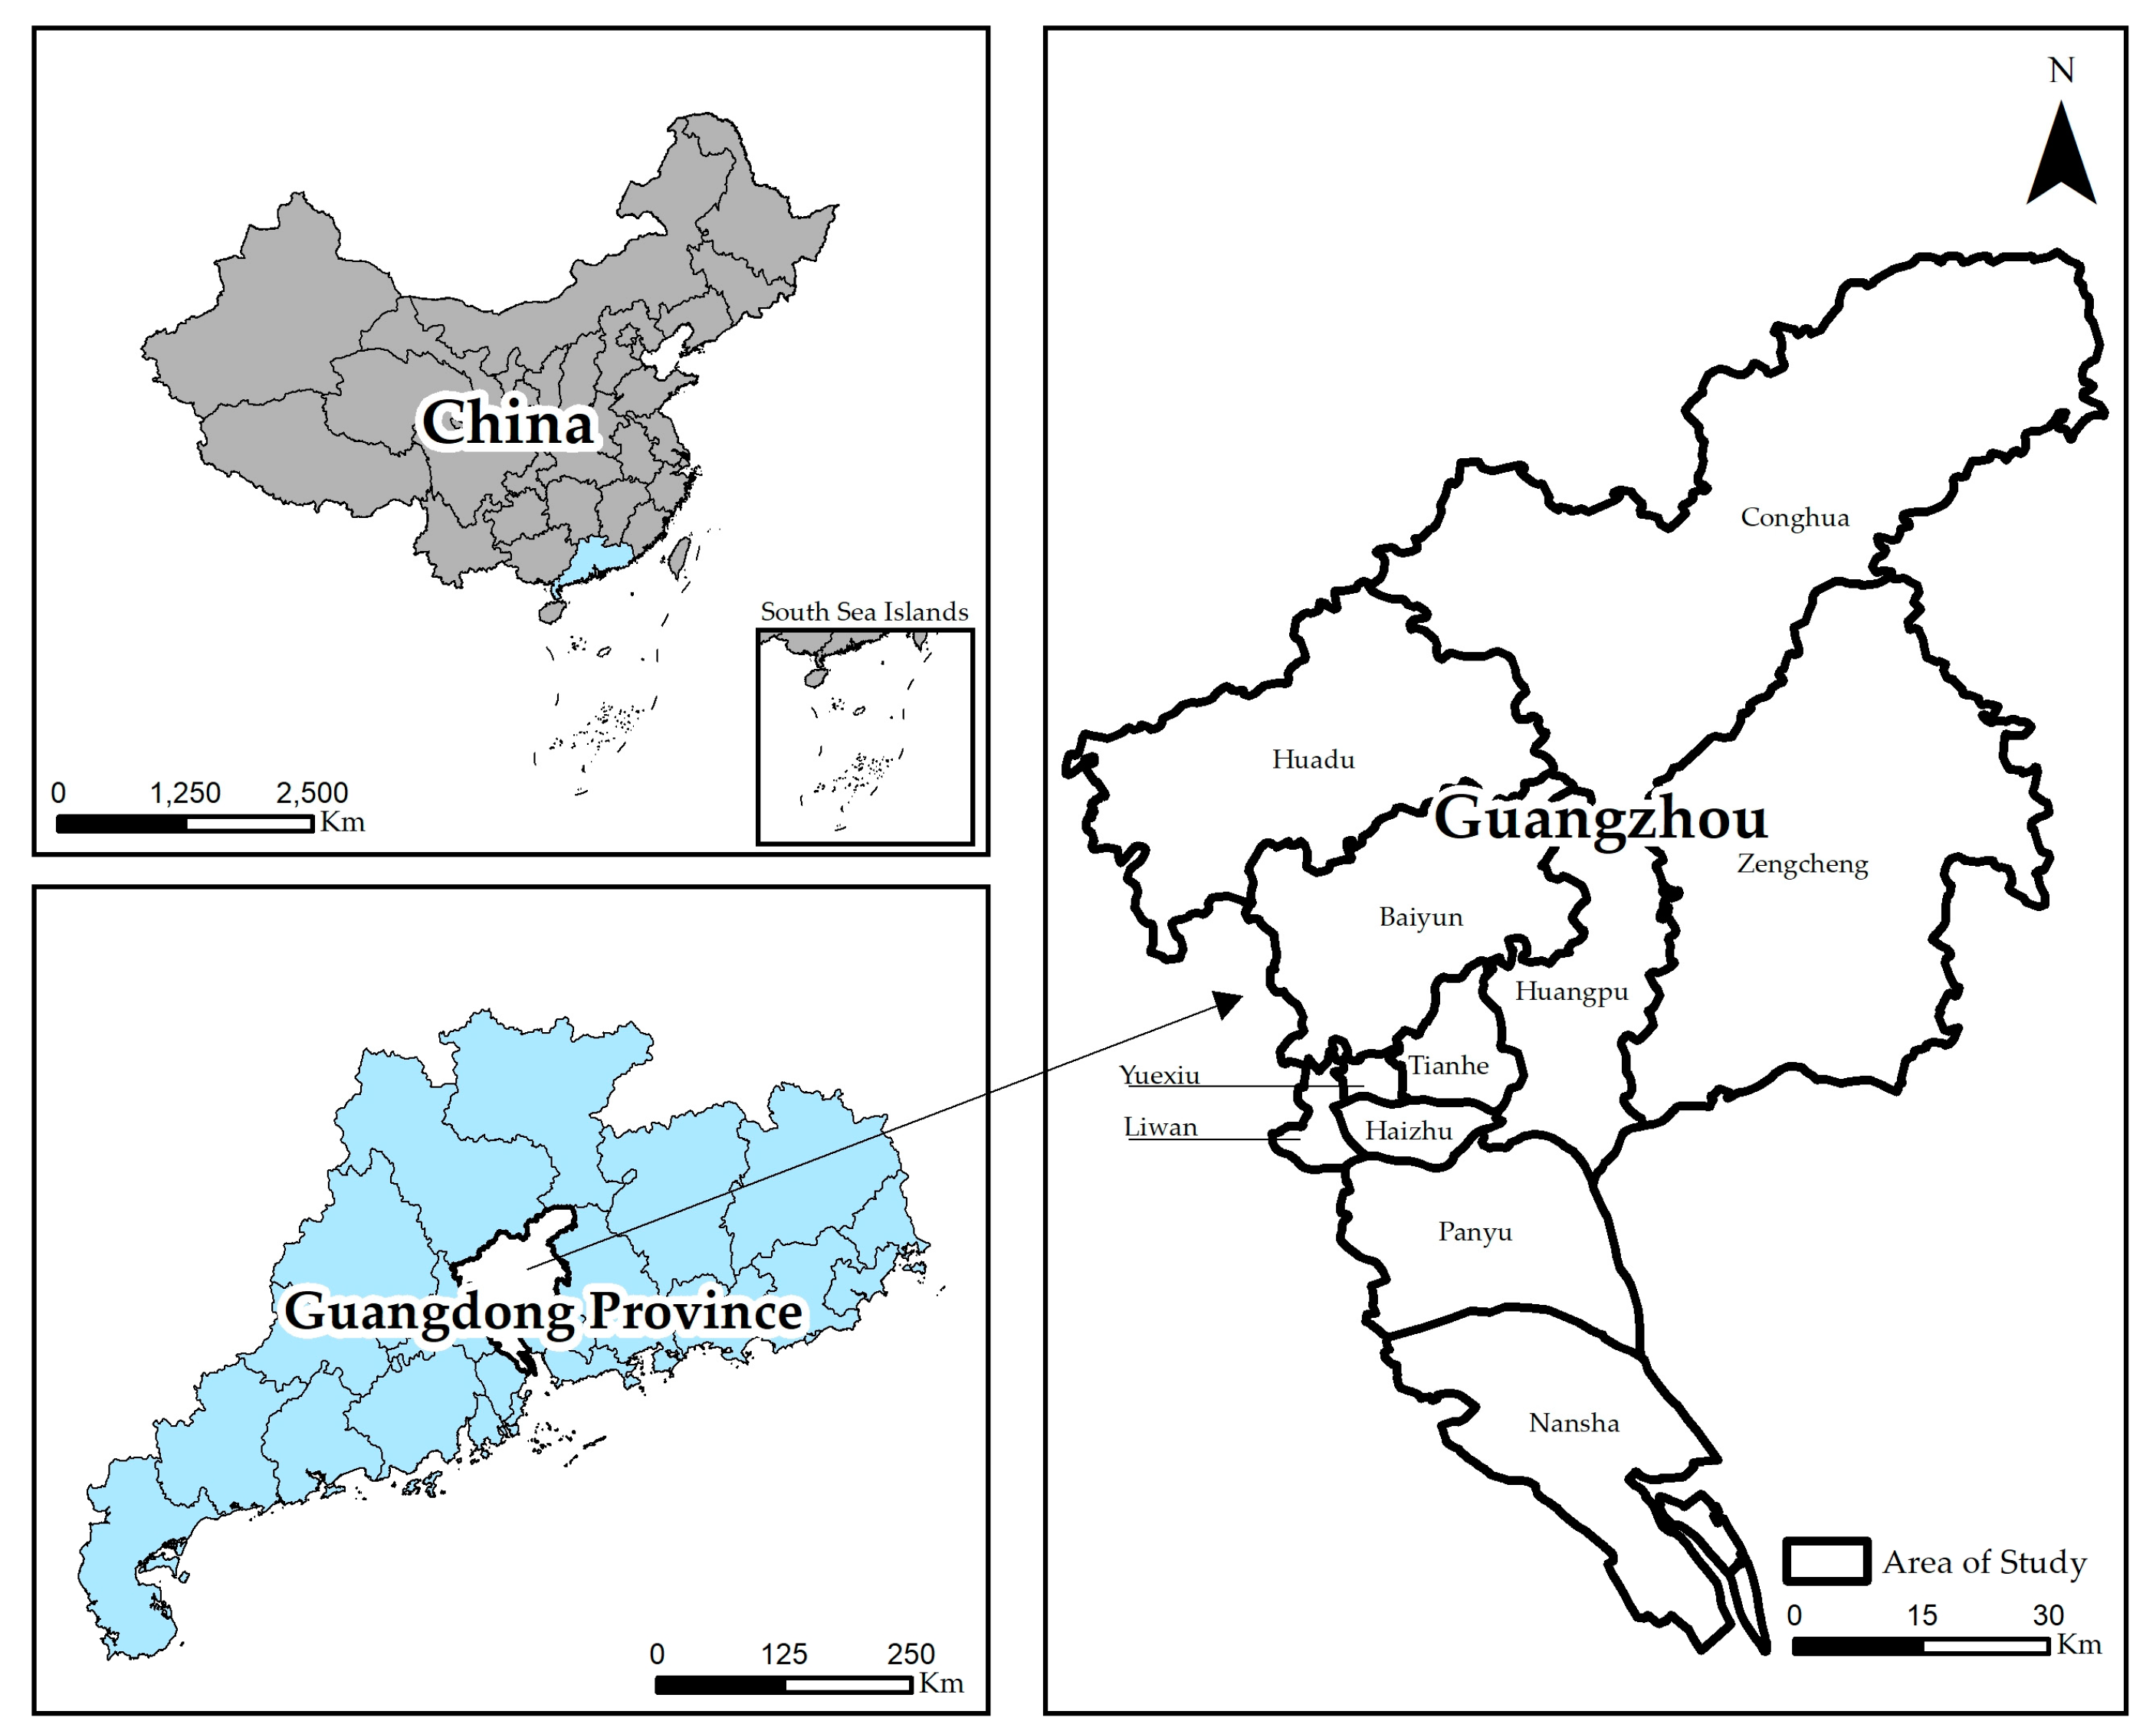
3. Dataset and Study Area

The dataset mined in this study was obtained from Sina Weibo. It covered the Guangzhou area for the period between January and May 2016, which contains 852,560 check-ins from 20,634 users. Guangzhou is considered to be one of the most attractive destinations in China due to its heterogeneous population and job opportunities regarding demographic characteristics [122], socioeconomic status [123,124], and place of origin [28]. Guangzhou, China (longitude from 112°57′ to 114°3′E and latitude from 22°26′ to 23°56′N [125]) is located on the south coast of Pearl River Delta (PRD) with a 14.5 million population [126] and had a total area of 7434.4 km2 [127]. In 2015, Guangzhou was divided into 11 districts (Baiyun, Conghua, Haizhu, Huadu, Huangpu, Liwan, Nansha, Panyu, and Zengcheng) [128]. Six of the districts (Baiyun, Huangpu, Haizhu, Liwan, Tianhe, and Yuexiu) are denoted as the center of the city [129,130], as shown in Figure 1.
The Weibo dataset used in the current study contains information like the unique id of user id, time, and date of the check-in. Additionally, geo-location (longitude and latitude), venue type, venue category, and gender collected via the web or mobile applications [131]. Therefore, it is assumed that the LBSN dataset archives the day-to-day activity patterns, usage behaviors toward social media, and presents spatiotemporal evidence, which is related to the daily routines of users [114]. A typical Weibo “check-in” is represented as: check-in (1305141104 006810) = {5503767214, ####, 1305141104 006810, Fri Apr 22 09:37:03 +0800 2016, m, 113.854085, 23.527322}. Where 1305141104 006810 denotes “status_id,” 5503767214 denotes “user_id,” #### denotes the “user_name,” Fri Apr 22 09:37:03 +0800 2016 denotes “day, month, date, time and year,” m denotes “gender” and 113.854085, 23.527322 denotes geo-location.
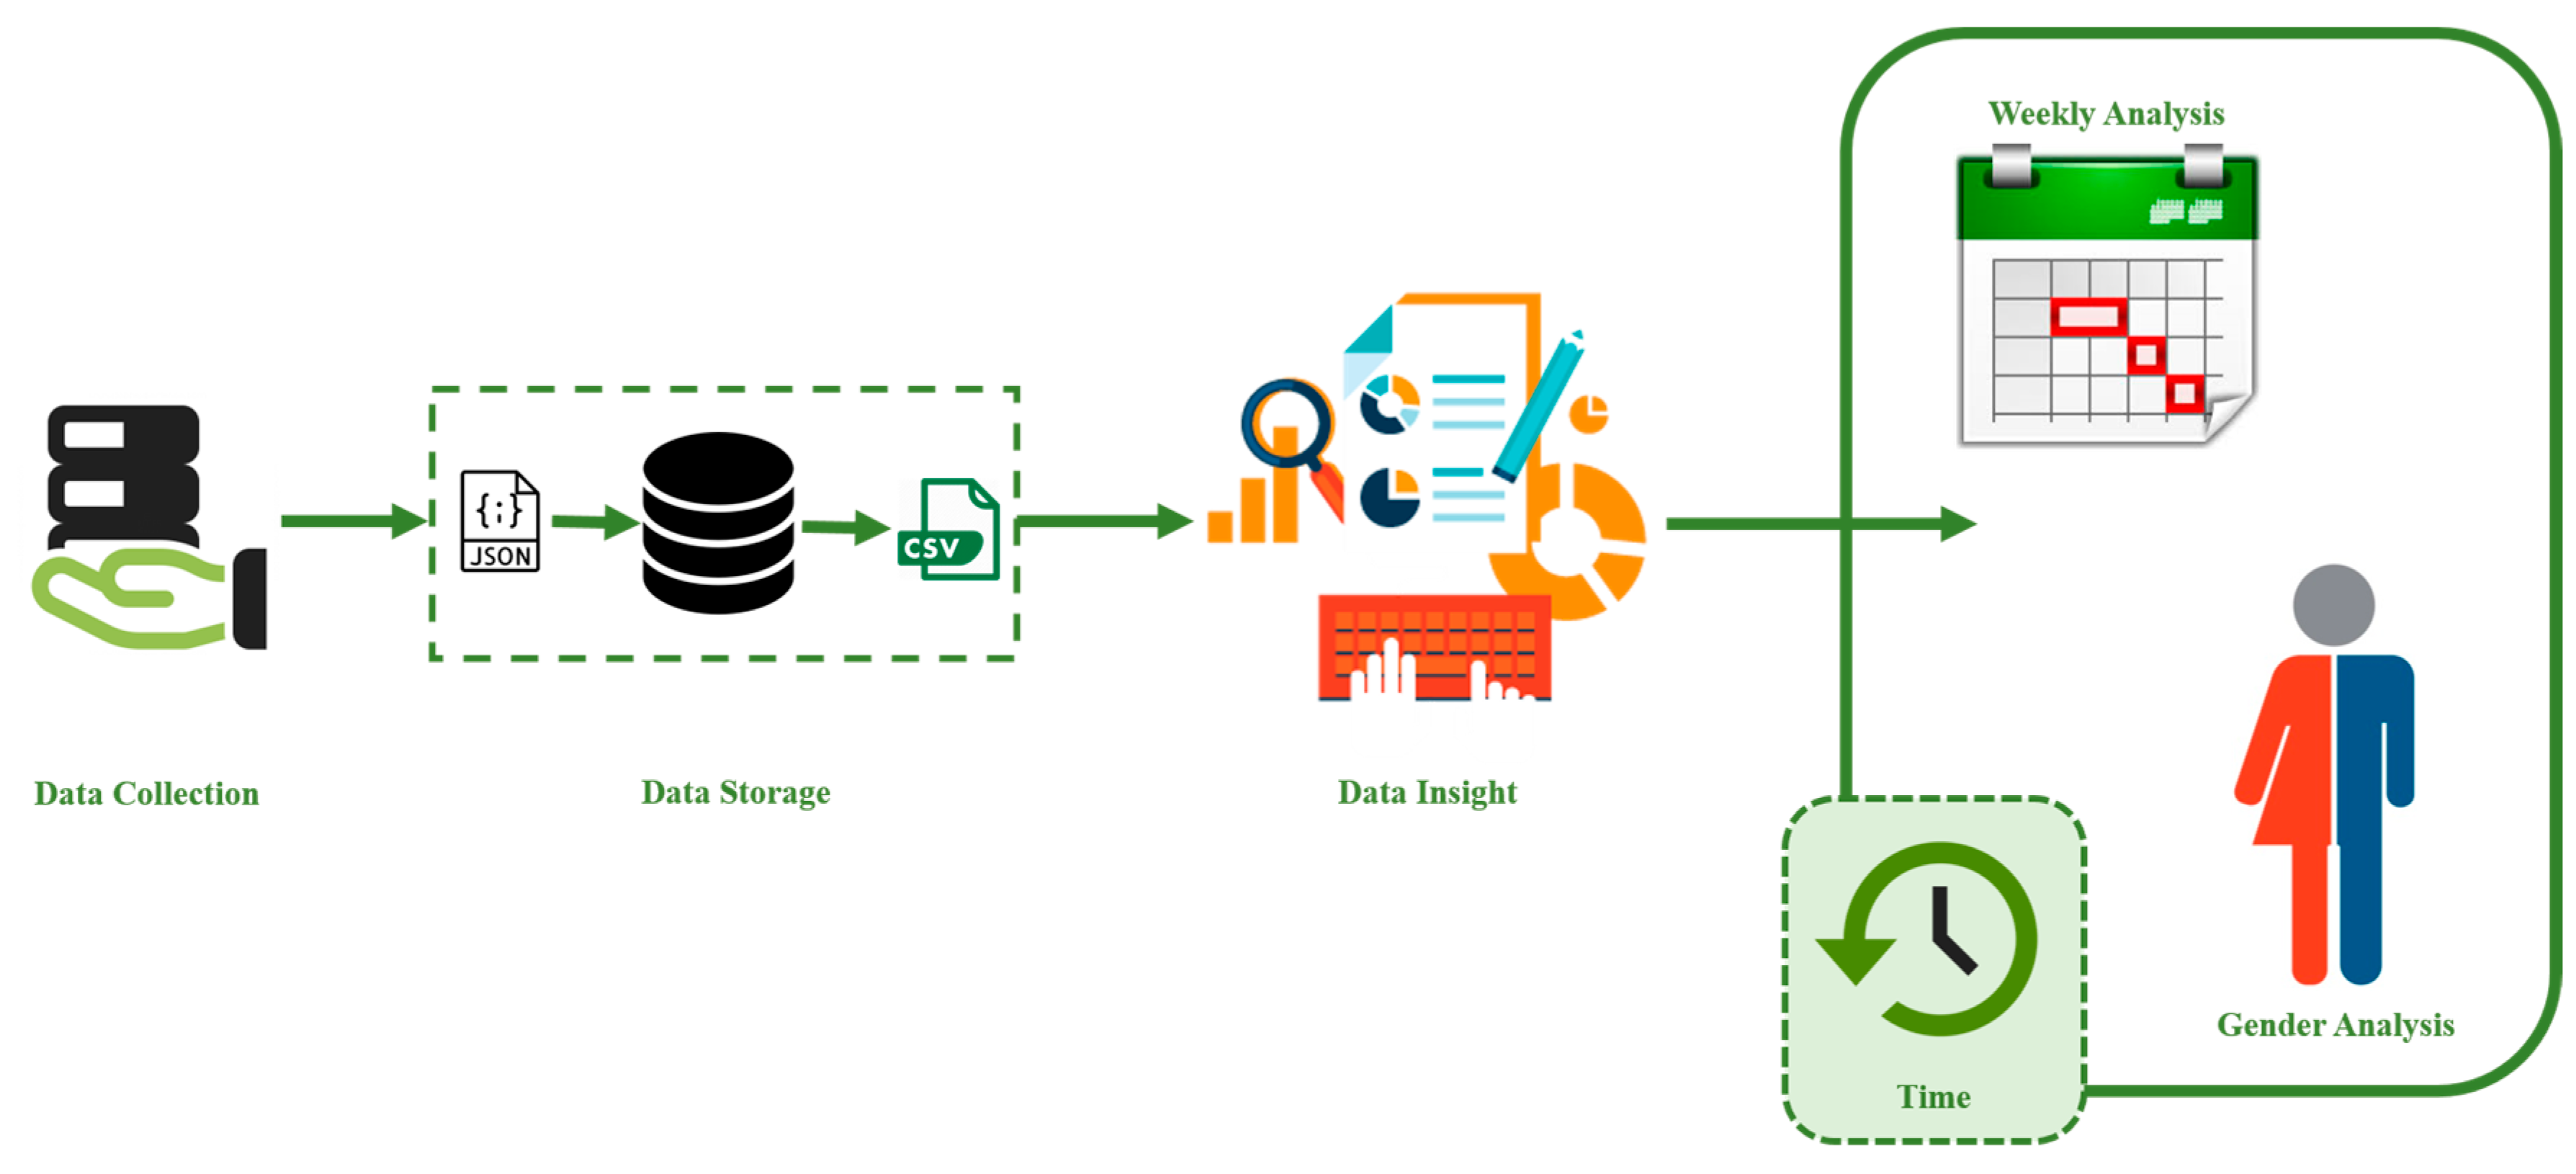
4. Methodology

In the current study, we analyzed the Weibo based geo-location dataset (Jan-May 2016) from Guangzhou, China. Figure 2 presents the check-in behavior analytics framework, where the LBSN data analysis methodology involves the two stages: collection, storage, and analysis of LBSN data. The download of Weibo data is the significant step of Weibo data collection and storage stage. To collect check-in data, we implemented a multi-threaded crawler to access the Weibo API. In turn, the crawler collects the check-in data filtered by gender, and the results are processed with entries that have geolocation. The outcome is in single JSON (JavaScript Object Notation) file by utilizing a python-based Weibo API (an open interface of Sina Weibo) [132,133], which is considered an extensively used data format [134,135]. To be adequately analyzed, the dataset is converted into a distinct file in the CSV (Comma-Separated Values) format so that the check-ins could be listed regarding their publishing time. However, the critical task in the data analysis stage is to mine and investigate the features of LBSN data. Moreover, during data pre-processing, invalid records are excluded by considering four criteria points: (a) availability of information i.e. user id, date, time, gender, geo-location, (b) location of the records must be in Guangzhou, China, (c) the range of record is within the date and time, and, (d) as a minimum, each user checked-in twice a month. After pre-processing (noises, void records, and bogus users) of 903,008 anonymized check-in records, 852,560 check-in records associated with the geographical area are picked up between January to May, 2016. Lastly, the task in the data insight stage is to analyze and investigate the features of LBSN check-in data by considering location, time, and gender and visualize data by using ArcGIS [136] to produce density maps [137] and trends [138,139].

4.1. Kernel Density Estimation

In order to detect hot-spots and observe gender differences in check-in behavior, we estimated the density function of check-in using a kernel density estimation (KDE) [140,141,142]. KDE is considered a popular spatiotemporal investigation practice that is used to observe the features of location (i.e., destination, time) comparative to each other. KDE is an evolving spatiotemporal means that has earlier been used [143,144,145,146] to examine several characteristics of the social media (but not limited to LBSN) data analytics such as users’ online activity and movement patterns [38], check-in behavior [147], city boundary definitions [148,149], and point-of-interest recommendations [150]. Moreover, it examines the diffusion of destinations in neighborhoods, allows investigators to see where destinations are densely distributed, and where they are more intensely dispersed. Lastly, it attempts to produce a smooth density surface of spatial point events in the geographic space [151].
The goal is to produce a smooth density surface that signifies the density of the point group. The algorithm is functioned by setting the search scope (window). The central grid of the window gives the weight of each grid unit to an outward grid, according to the principle of anti-distance weight. Moreover, in the window, the weights and density values are the sum of kernel density value that belongs to the central grid.
To measure the density of historical check-ins at point “x,” let f i (x) be a density function at geo-location “x.
f i ( x ) = k ( x , h ) = 1 x h j = 1 X K ( x x j h )
where “x” represents the geo-location (longitude and latitude) of check-in dataset “1 < i < n” at which density estimation with bandwidth “h” is calculated. In KDE, bandwidth is considered an important parameter. If the bandwidth is too large, then the point density surface will become too smooth, while too small will change point density distribution abruptly. Therefore, the optimal bandwidth is determined by repeatedly setting the bandwidth and comparing the smoothness of the point density surface. Bandwidth “h” is dependent on the resulting density estimate “ f i (x)”. ”X” is the total number of check-ins in the dataset, “j” points to a signal geo-location, “K” is a standard normal density function, “ . ” denotes the Euclidean norm [152,153,154], and “ x j ” is the geo-location of check-in “j.
The log-probability data-driven option is used to assess the value of bandwidth “h” in constructing the density estimate below.
L ( h ) = 1 x t j = 1 x t l o g   f i ( x j | X , h )
where the “xt“ events “xj” are data points in the dataset X. Higher value of L(h) is ideal since it shows that the higher probability is being allocated to new but invisible data. Hence, a simple method for bandwidth selection is to perform a grid-search on “h” using a validation set.

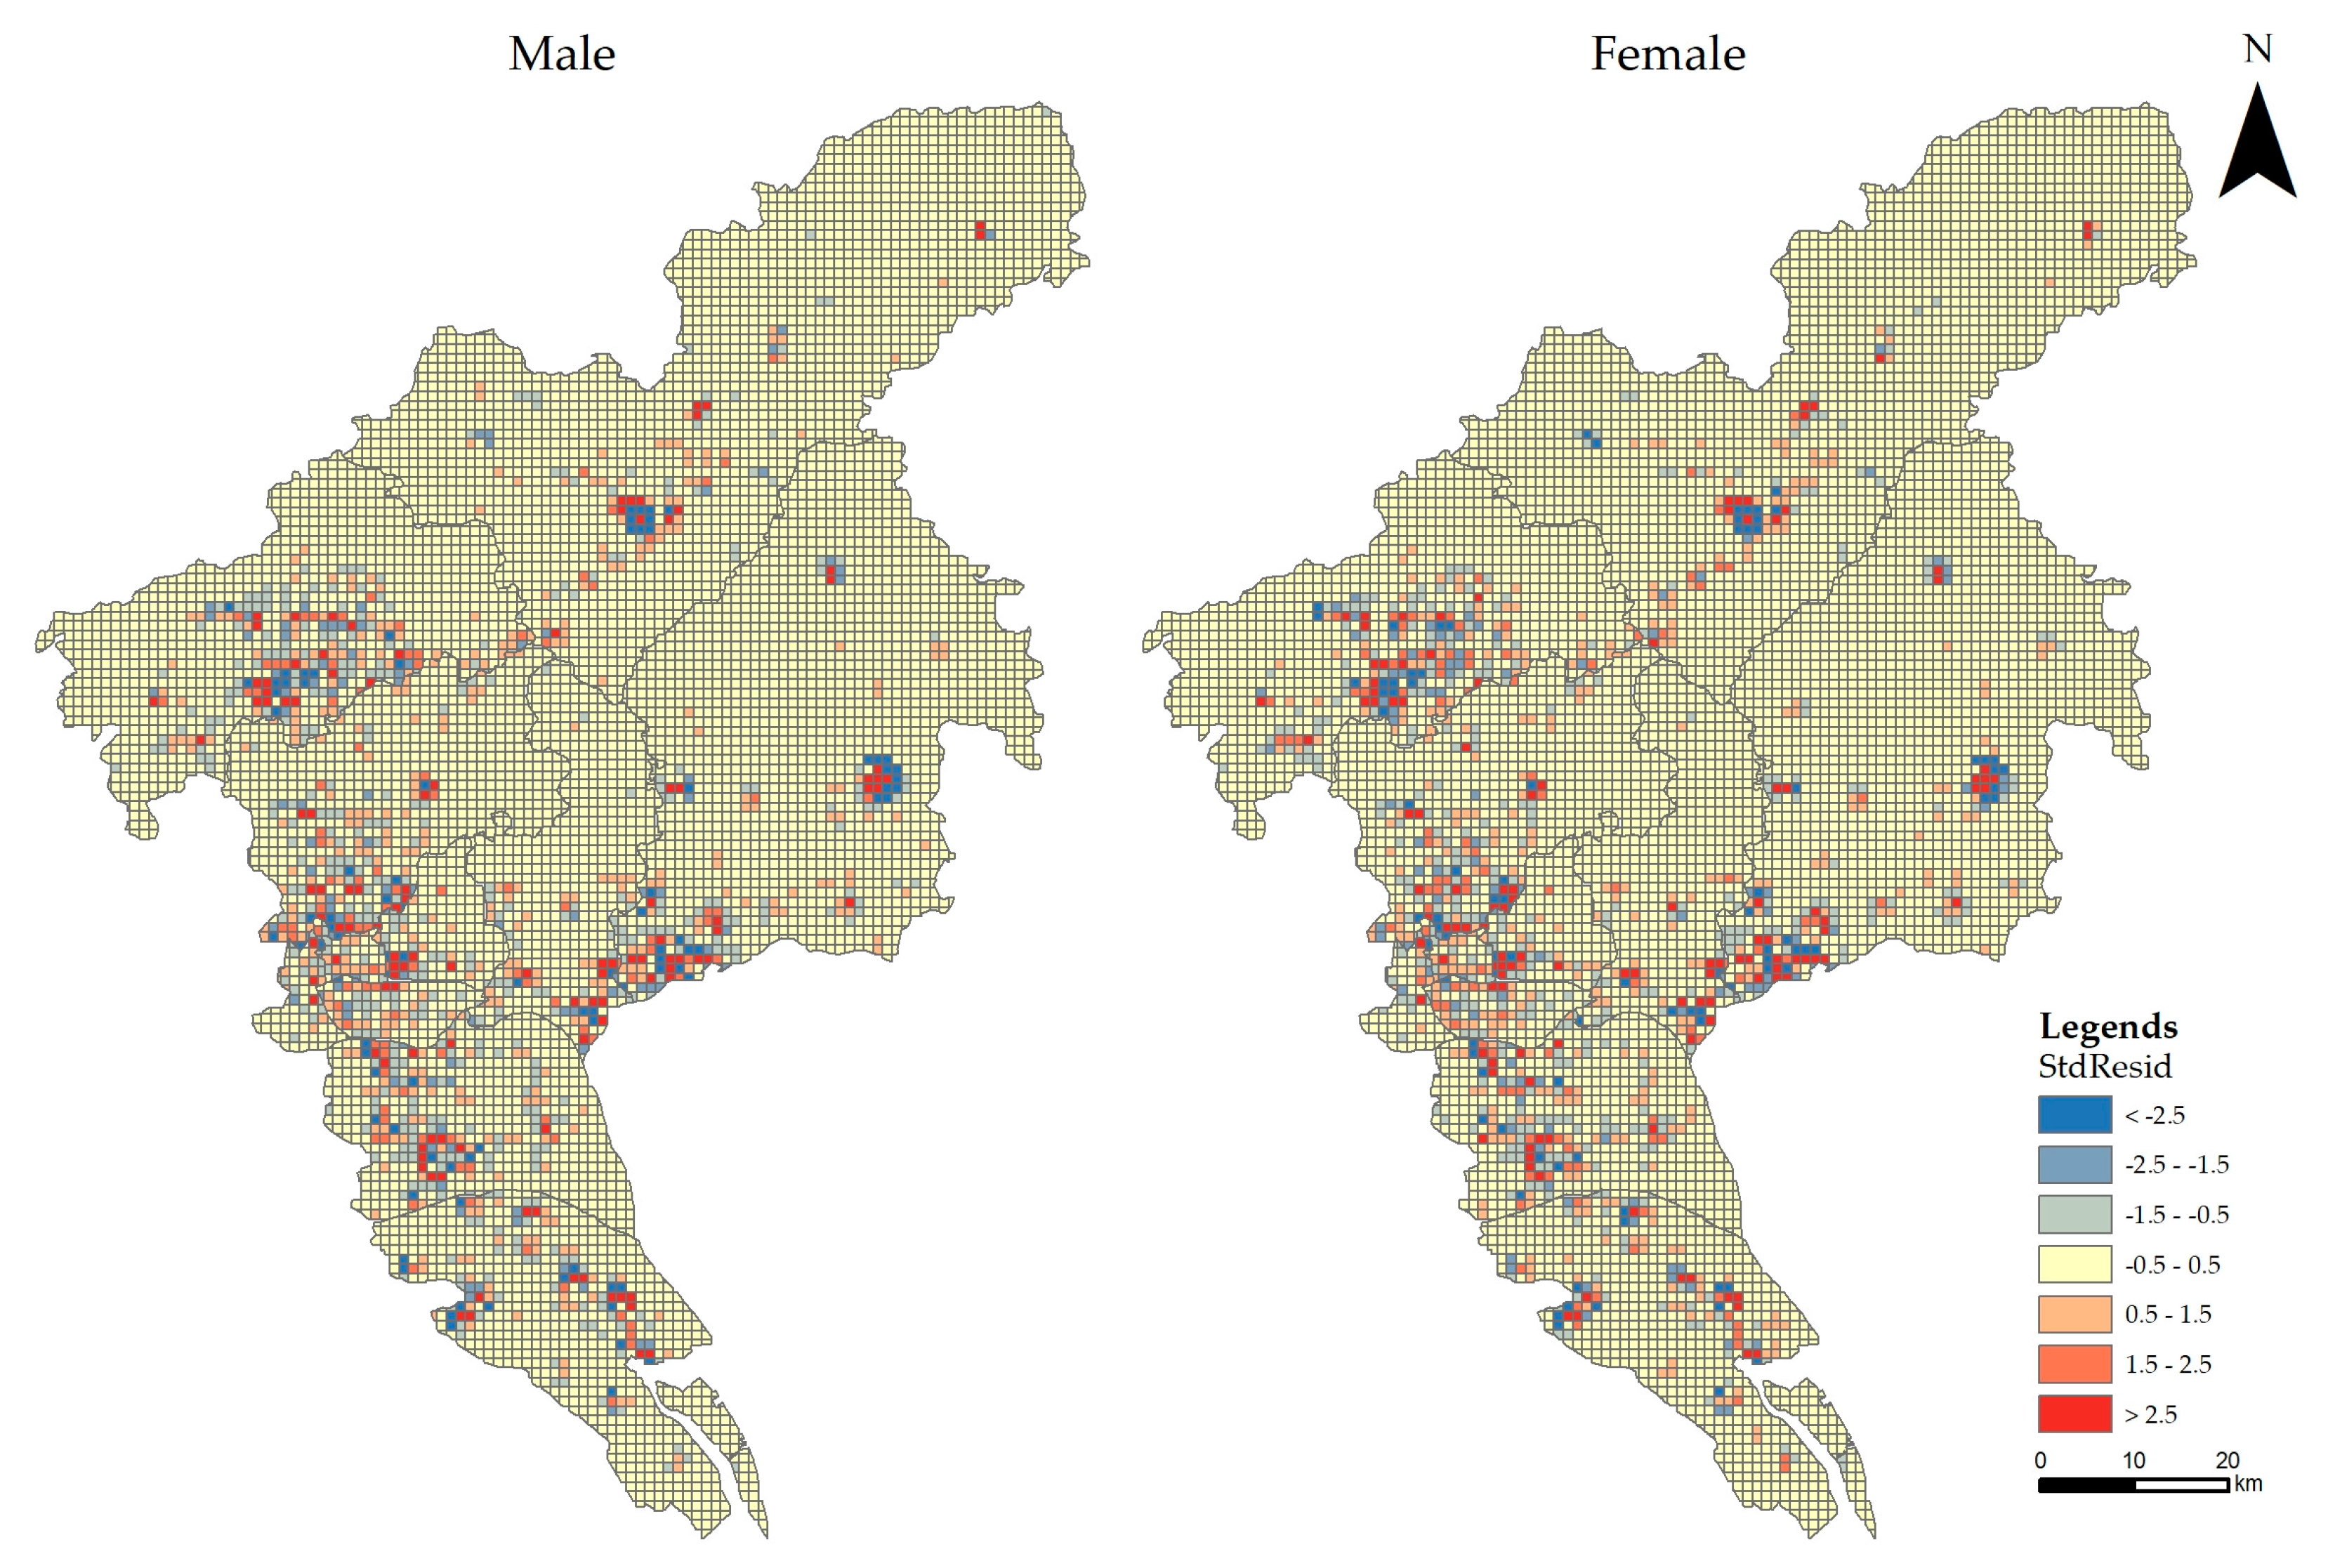
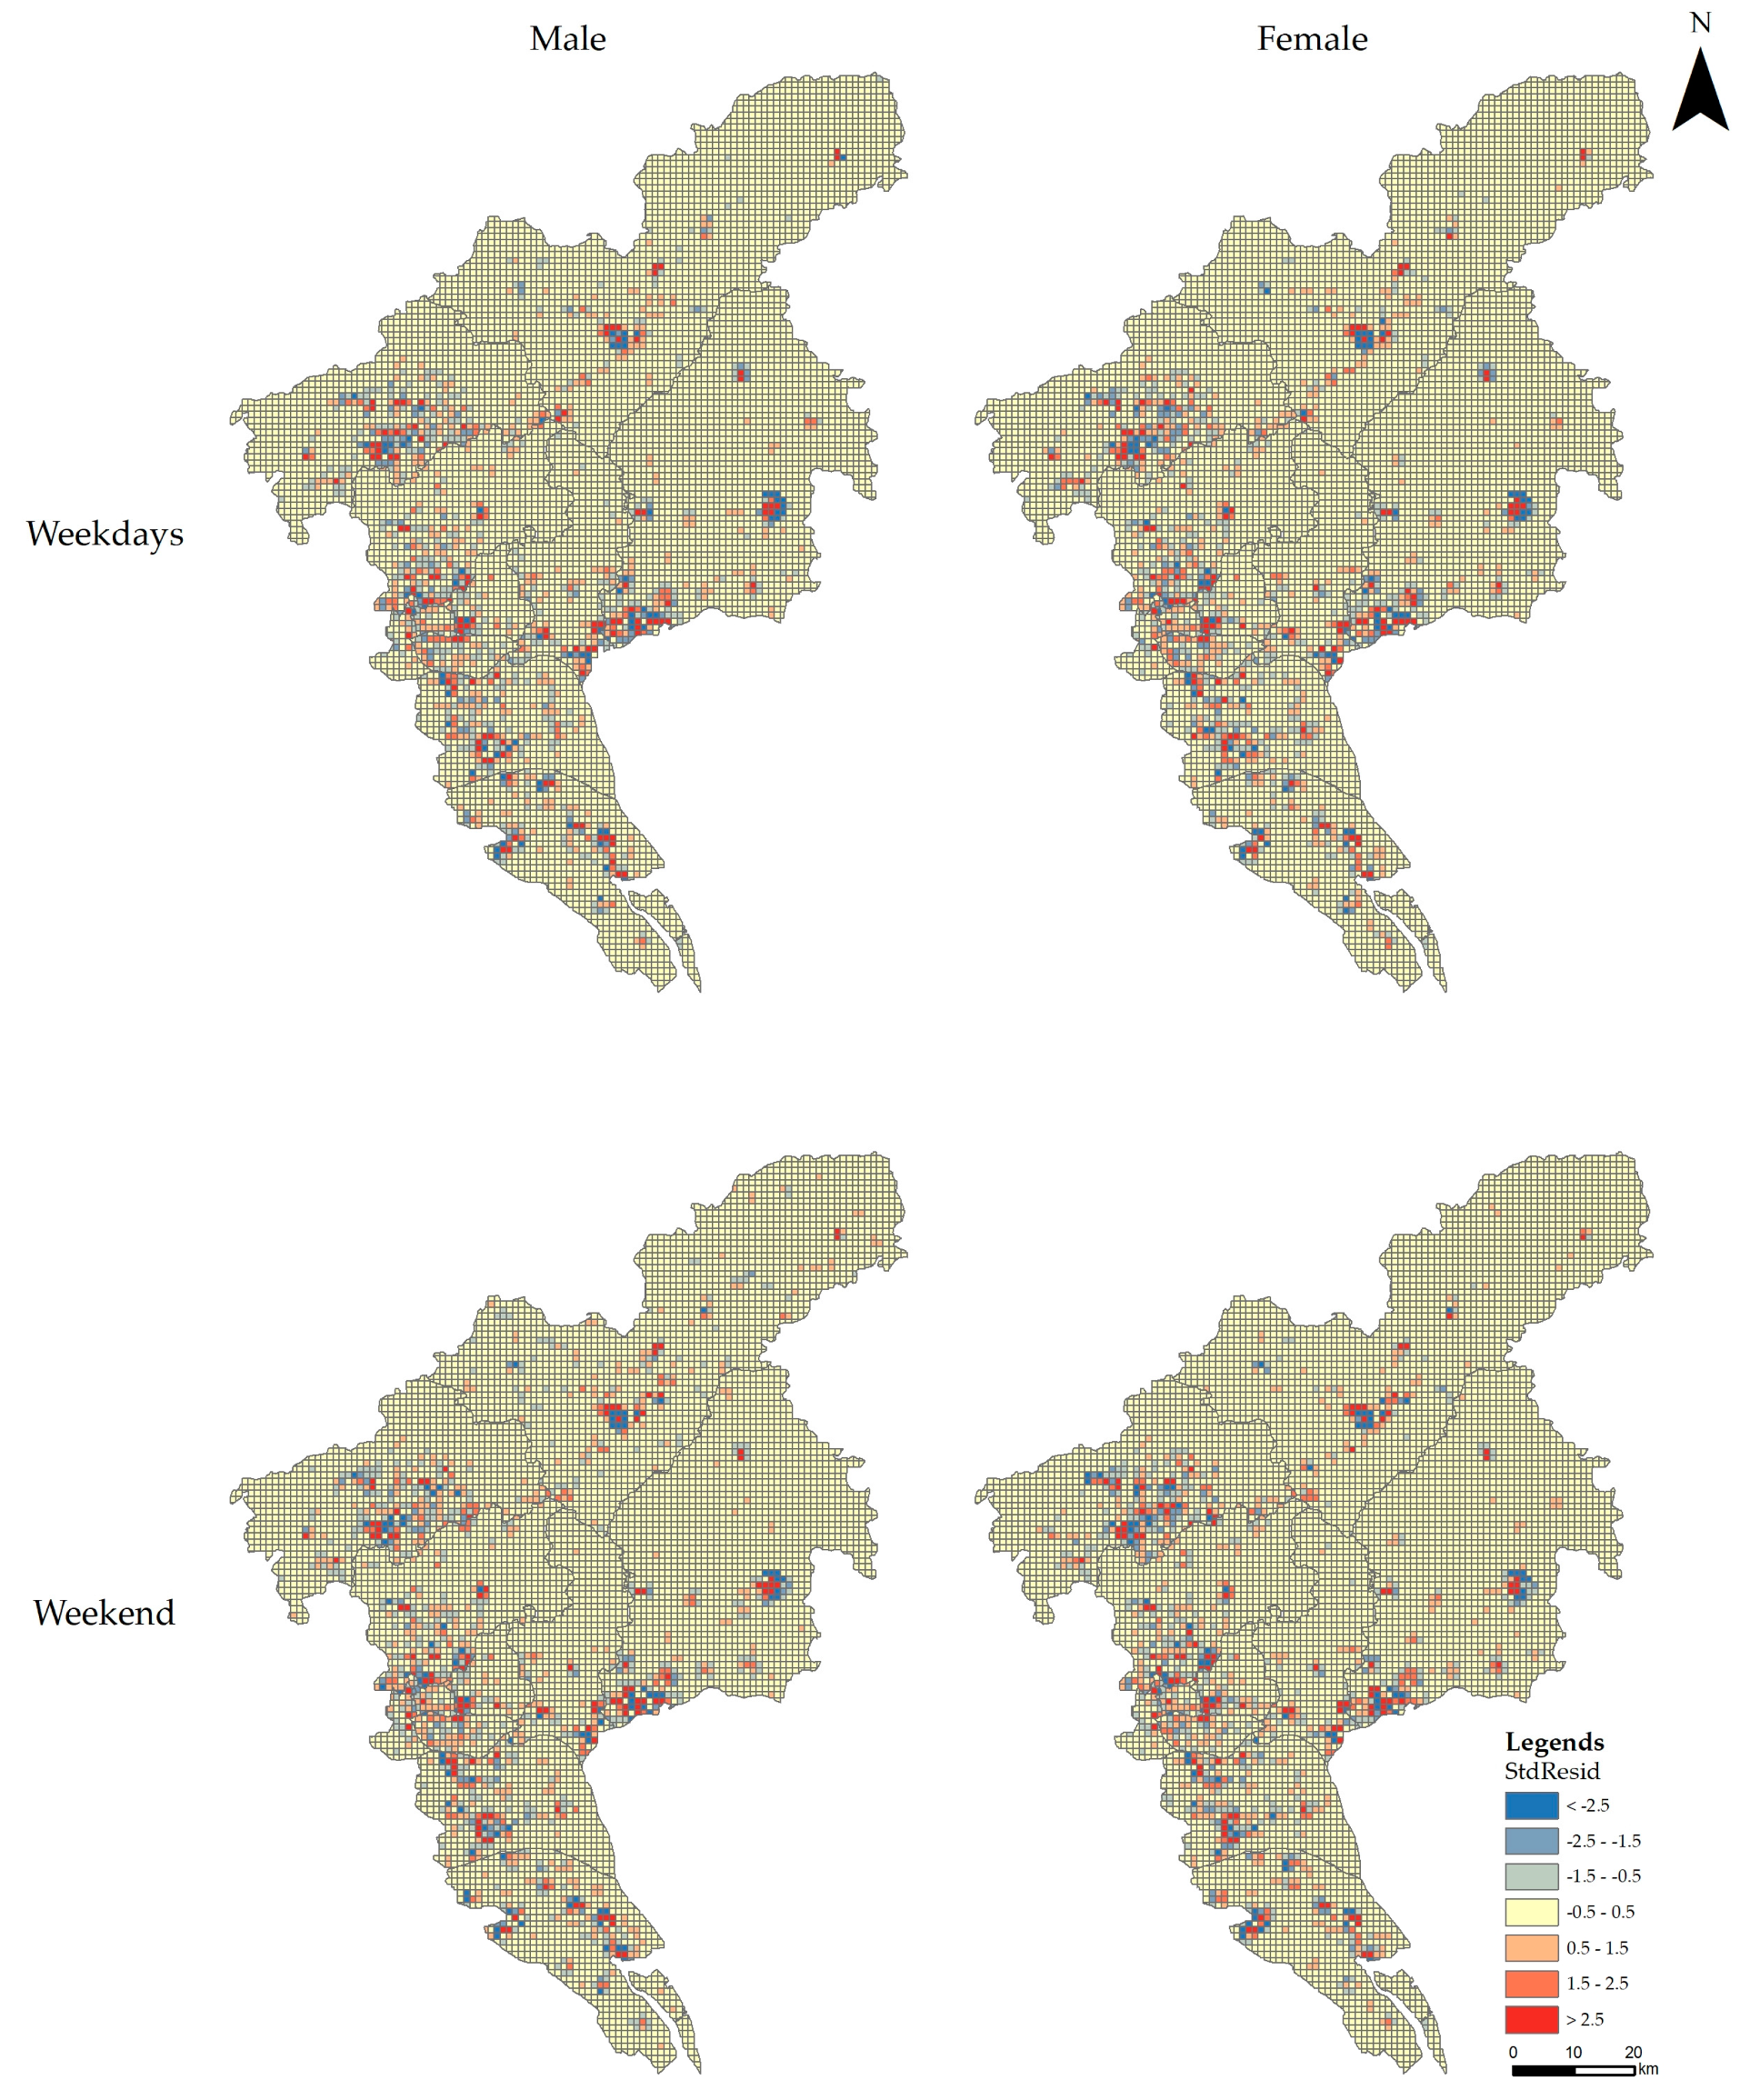
4.2. Geographically Weighted Regression (GWR)

GWR is a spatial regression technique that considers spatial nonstationarity and allows local parameters to be estimated. It is considered an extension of a traditional linear regression framework, and is, accordingly, easy for the specification. Unlike the complex mechanism of the Bayesian spatial model, the GWR method is easier for researchers to understand and is widely used in a practical application. In particular, in the GWR models, the coefficients of variables can be visualized in an easily identifiable manner, which could provide insightful suggestions for city planners and check-in behavior analysis [155]. A typical GWR model takes the following form.
y i = β 0 ( u i , v i ) + k β k ( u i , v i ) x ik + ε i
where (ui, vi) represents the geo-coordinates (longitude, latitude) of observation I, β0 (ui, vi) represents the intercept value, βk (ui, vi) represents the estimated parameter for the kth variable of observation I, and εi represents the error term.
This means that the estimated coefficients are allowed to vary in space. One assumption of GWR is that the observed data near the observation i have more influence in estimating βk (ui, vi) than the data farther from i. The parameter βk (ui, vi) is estimated below.
β k ( u i , v i ) = ( X T W ( u i , v i ) X ) 1 X T W ( u i , v i ) Y .
where the weighting matrix W(ui, vi) is a diagonal matrix, and the off-diagonal elements are all zero. The estimation of GWR is part depend on the bandwidth selection for observation i neighbors. For areas with more data points, the bandwidth of the kernel will be lower, while, for areas with few data points, the bandwidth of the kernel will be larger. In the current study, an appropriate bandwidth is selected based on the minimum Akaike information criterion for the GWR model (AIC) [156].

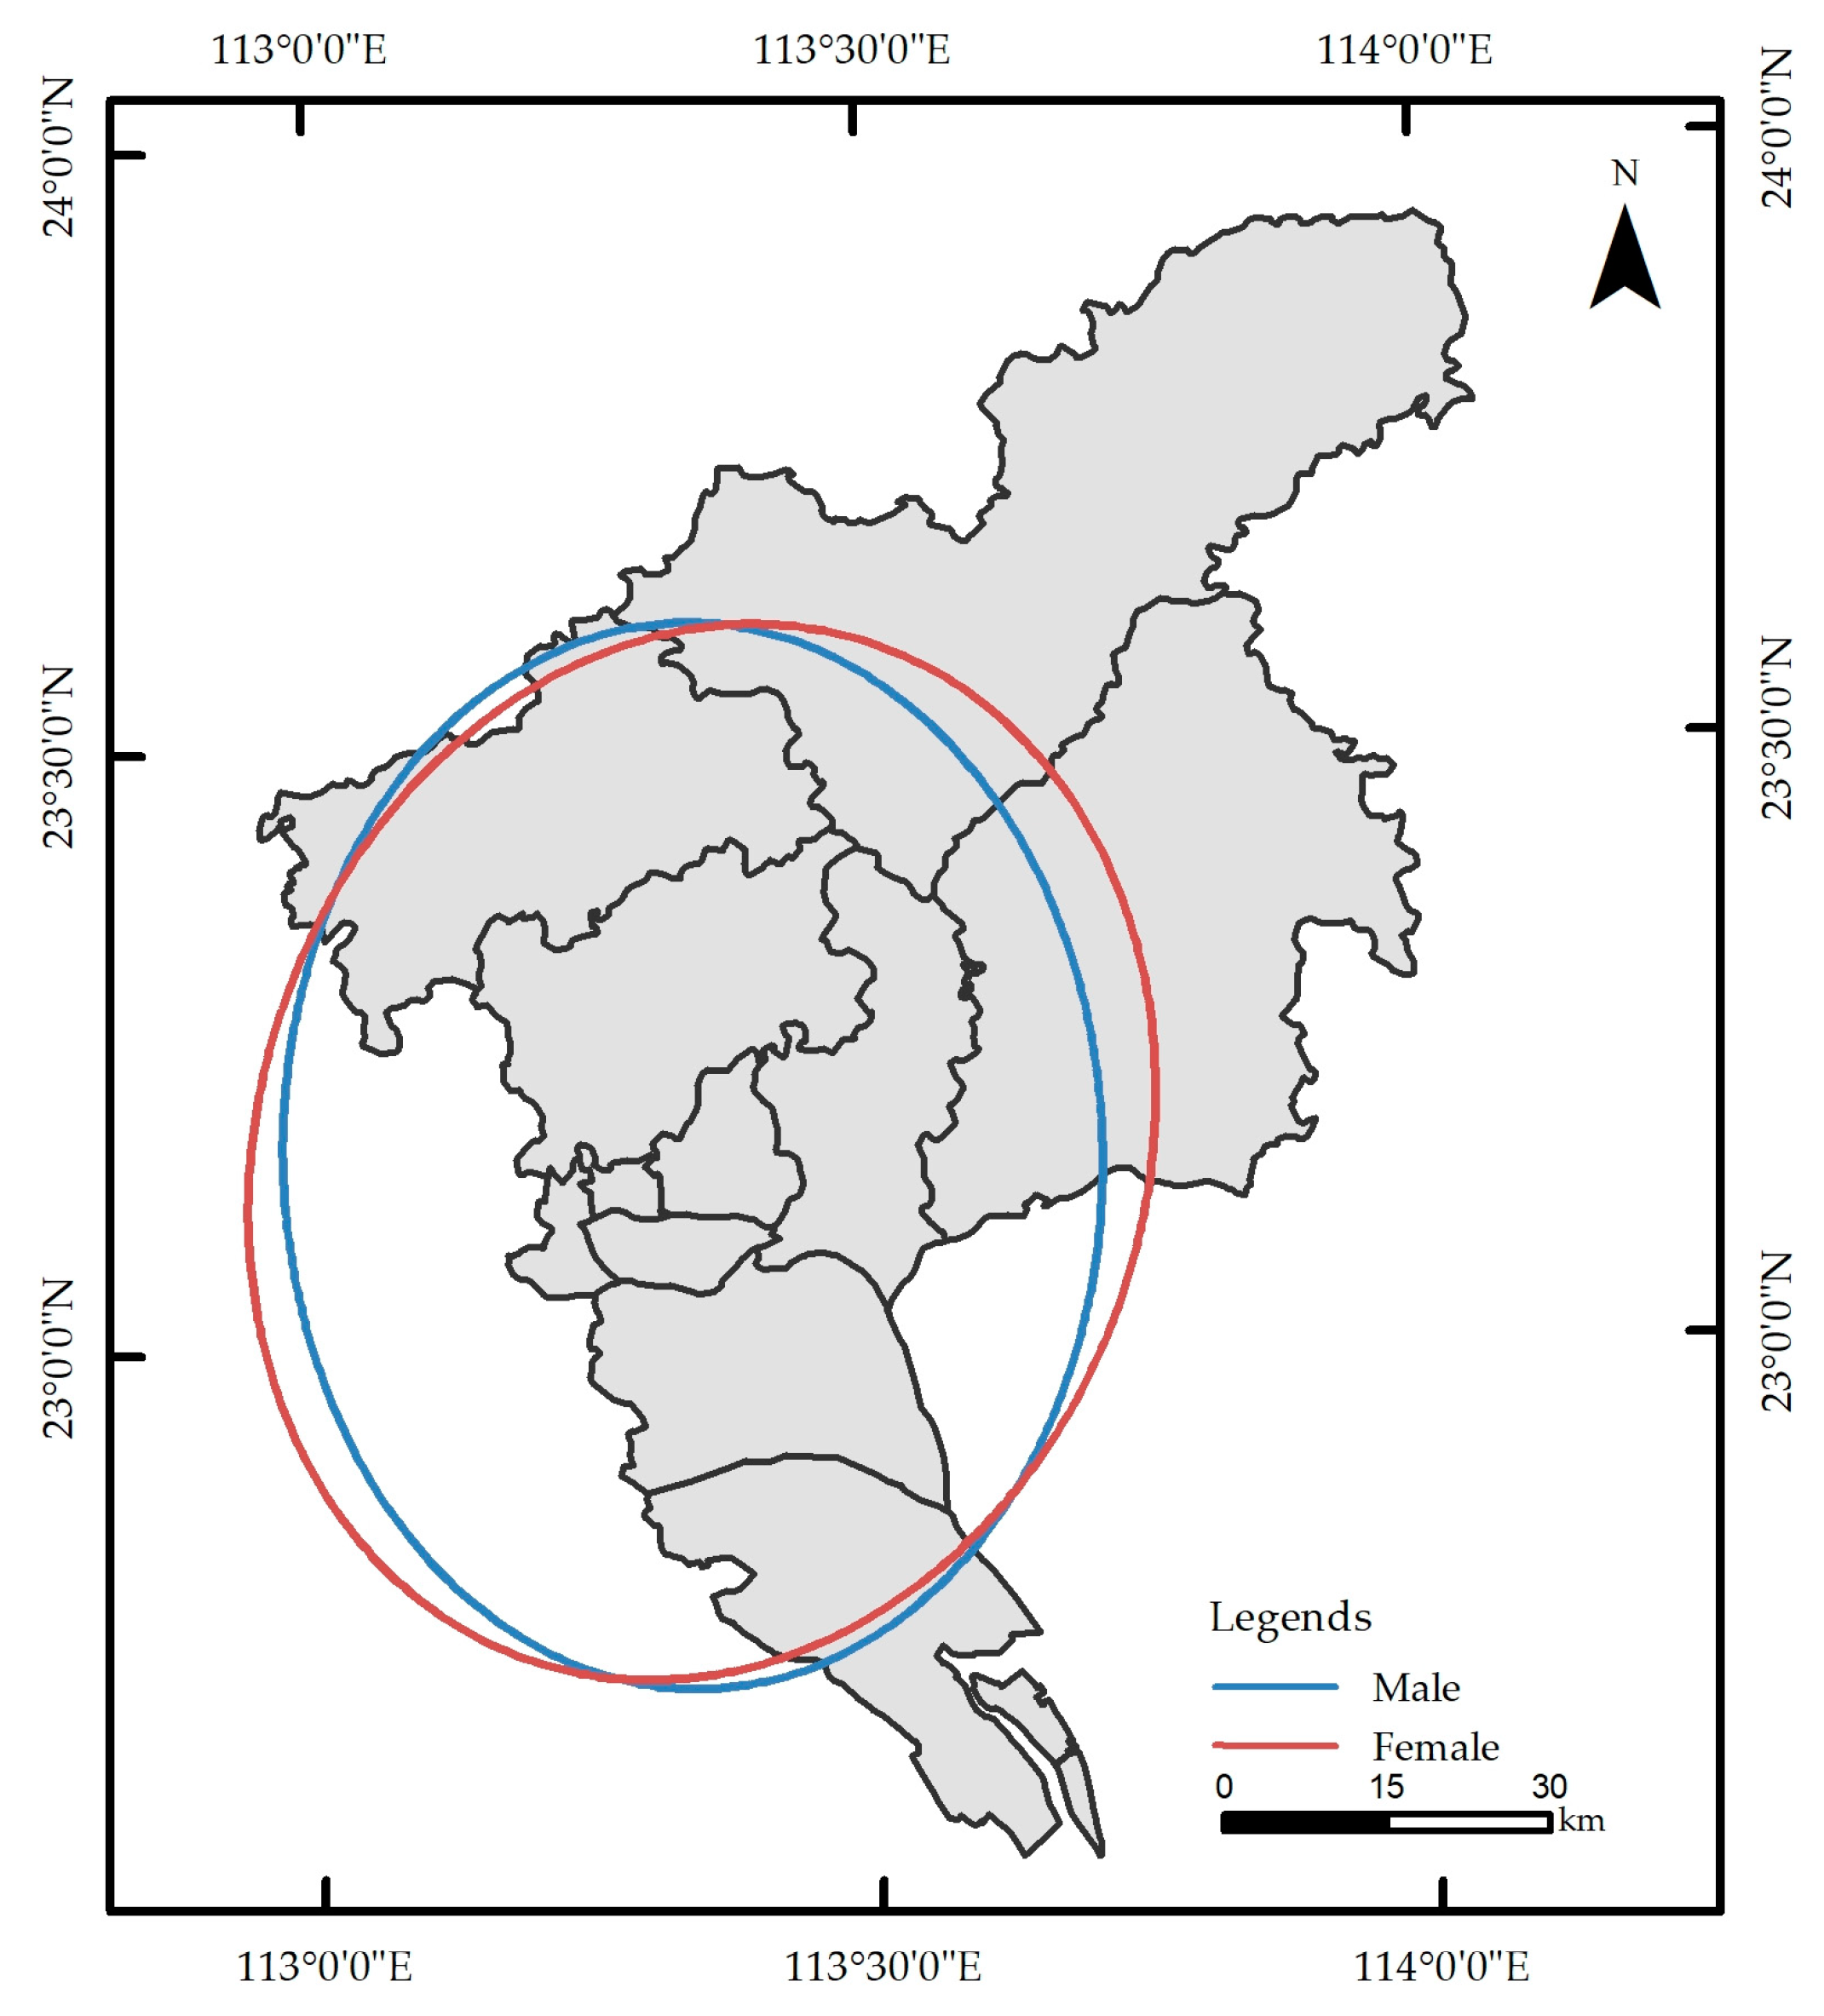
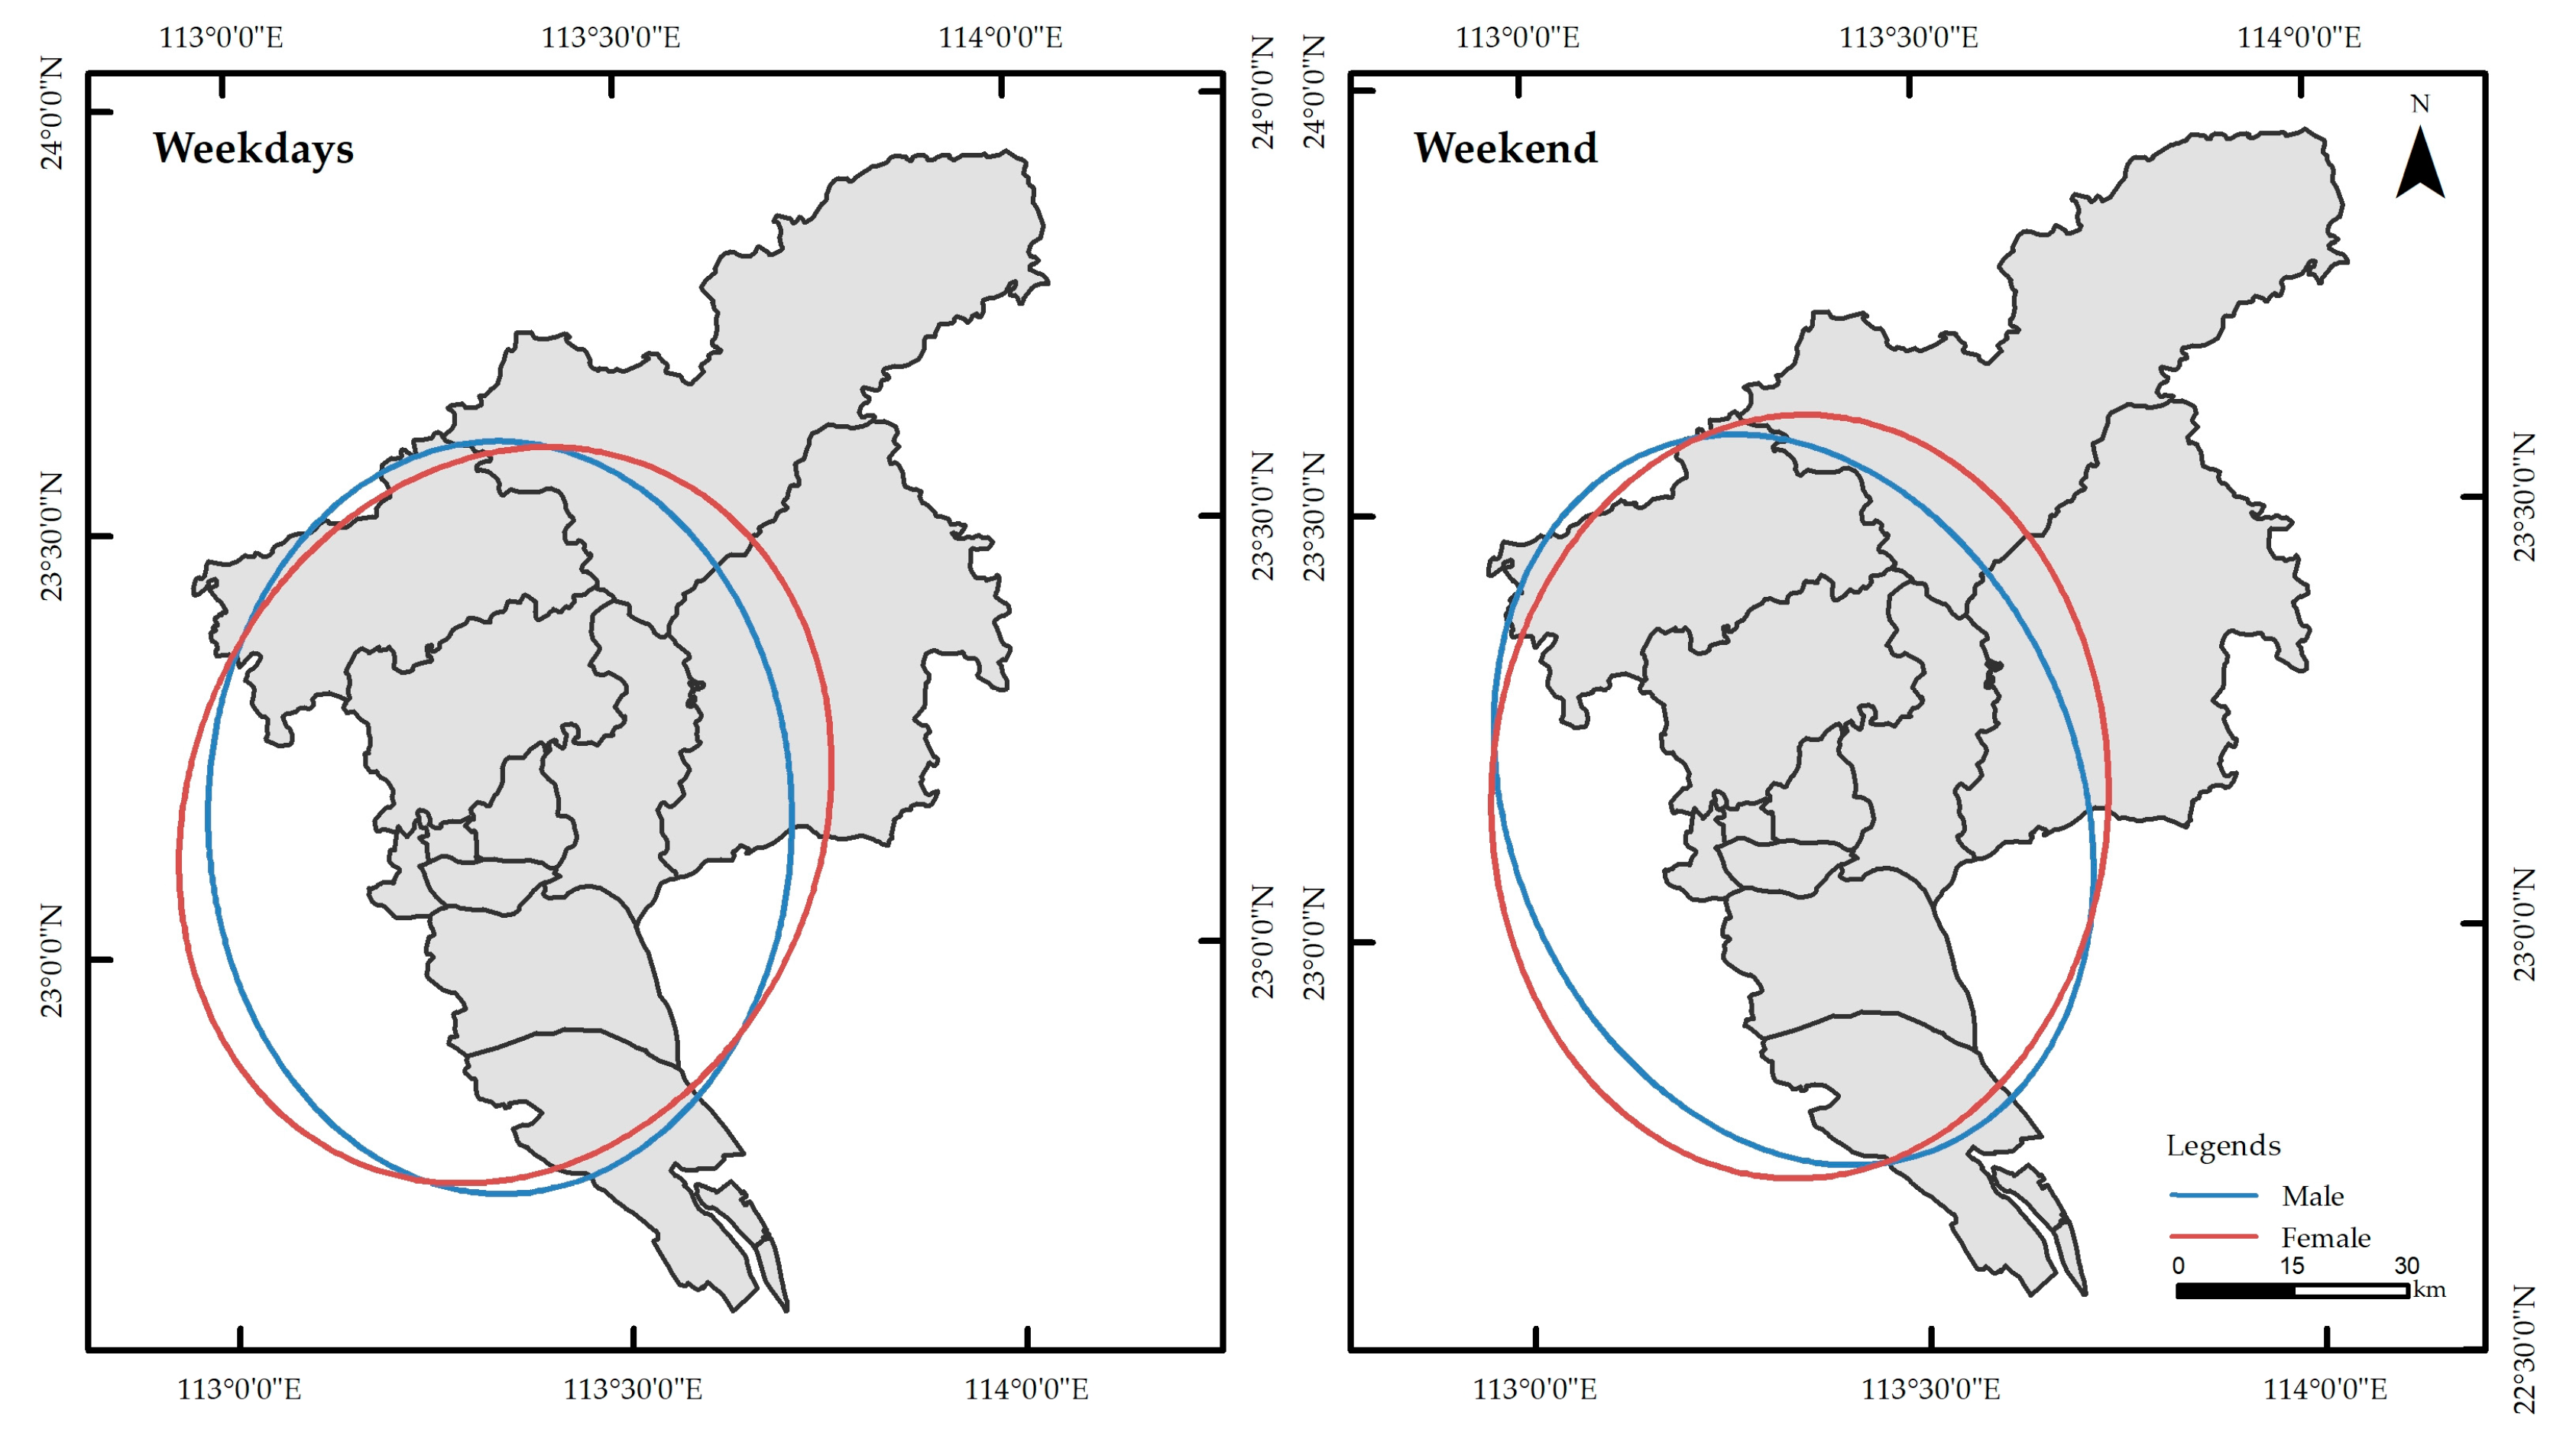
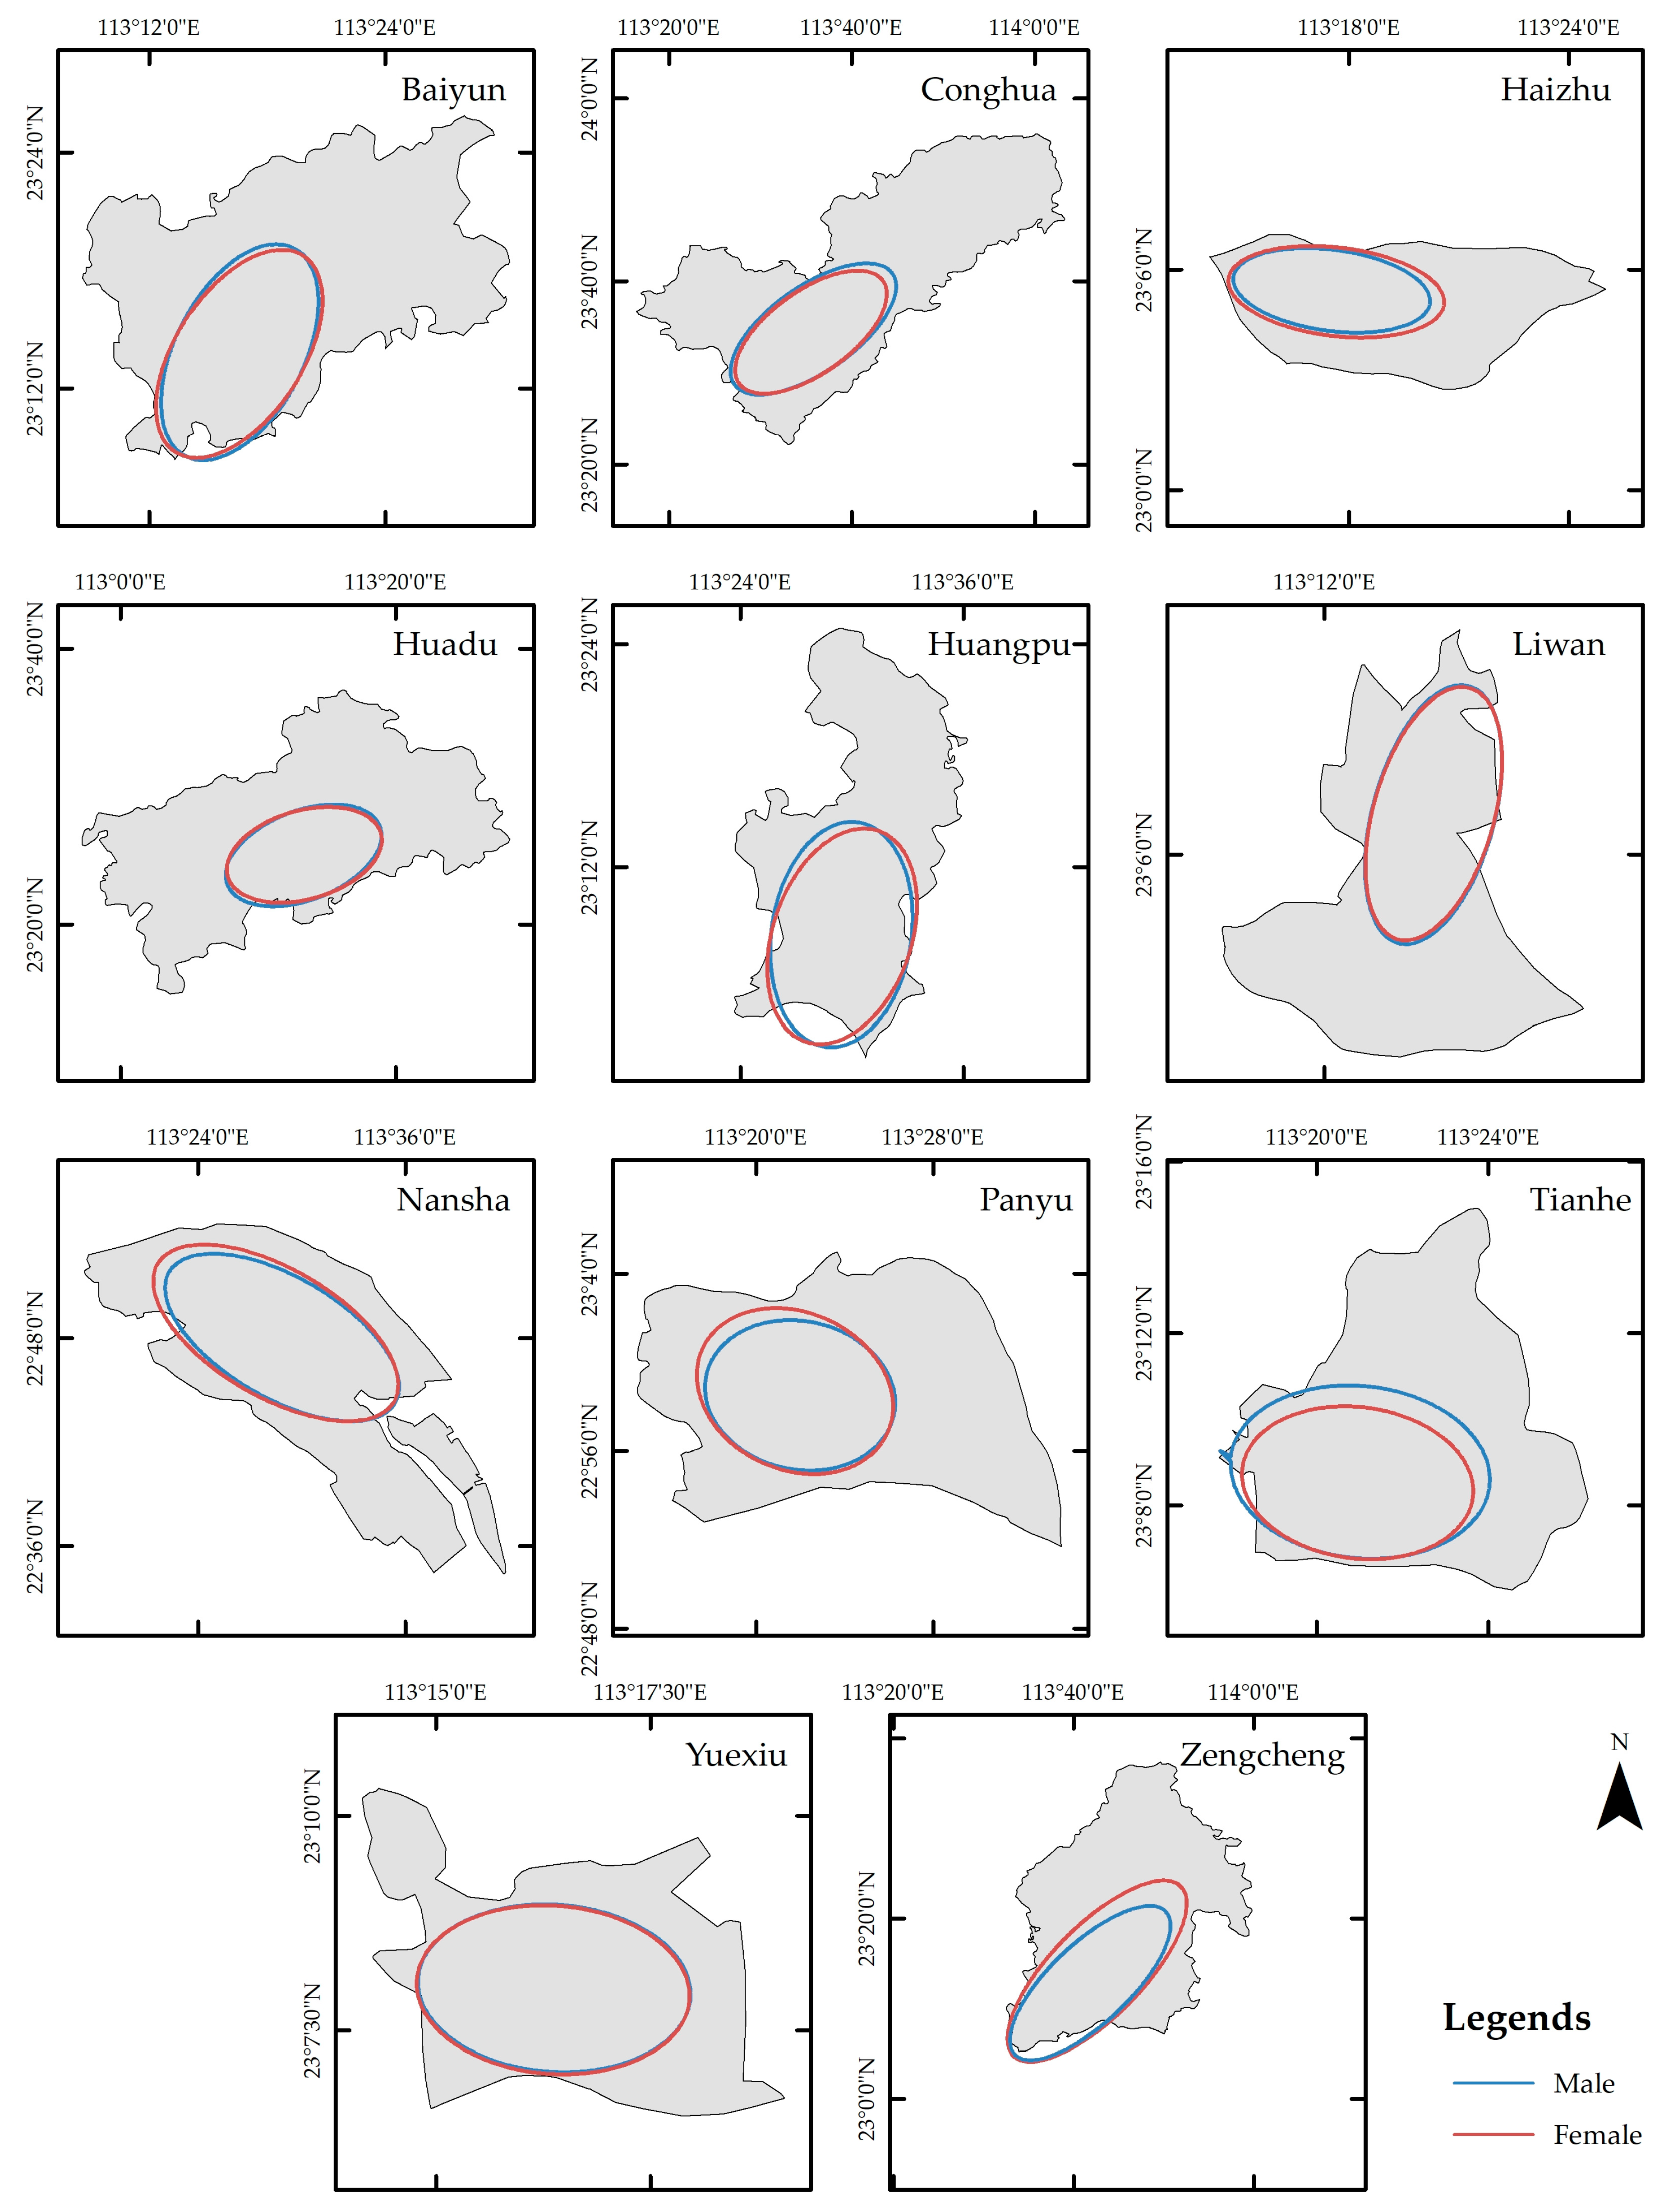
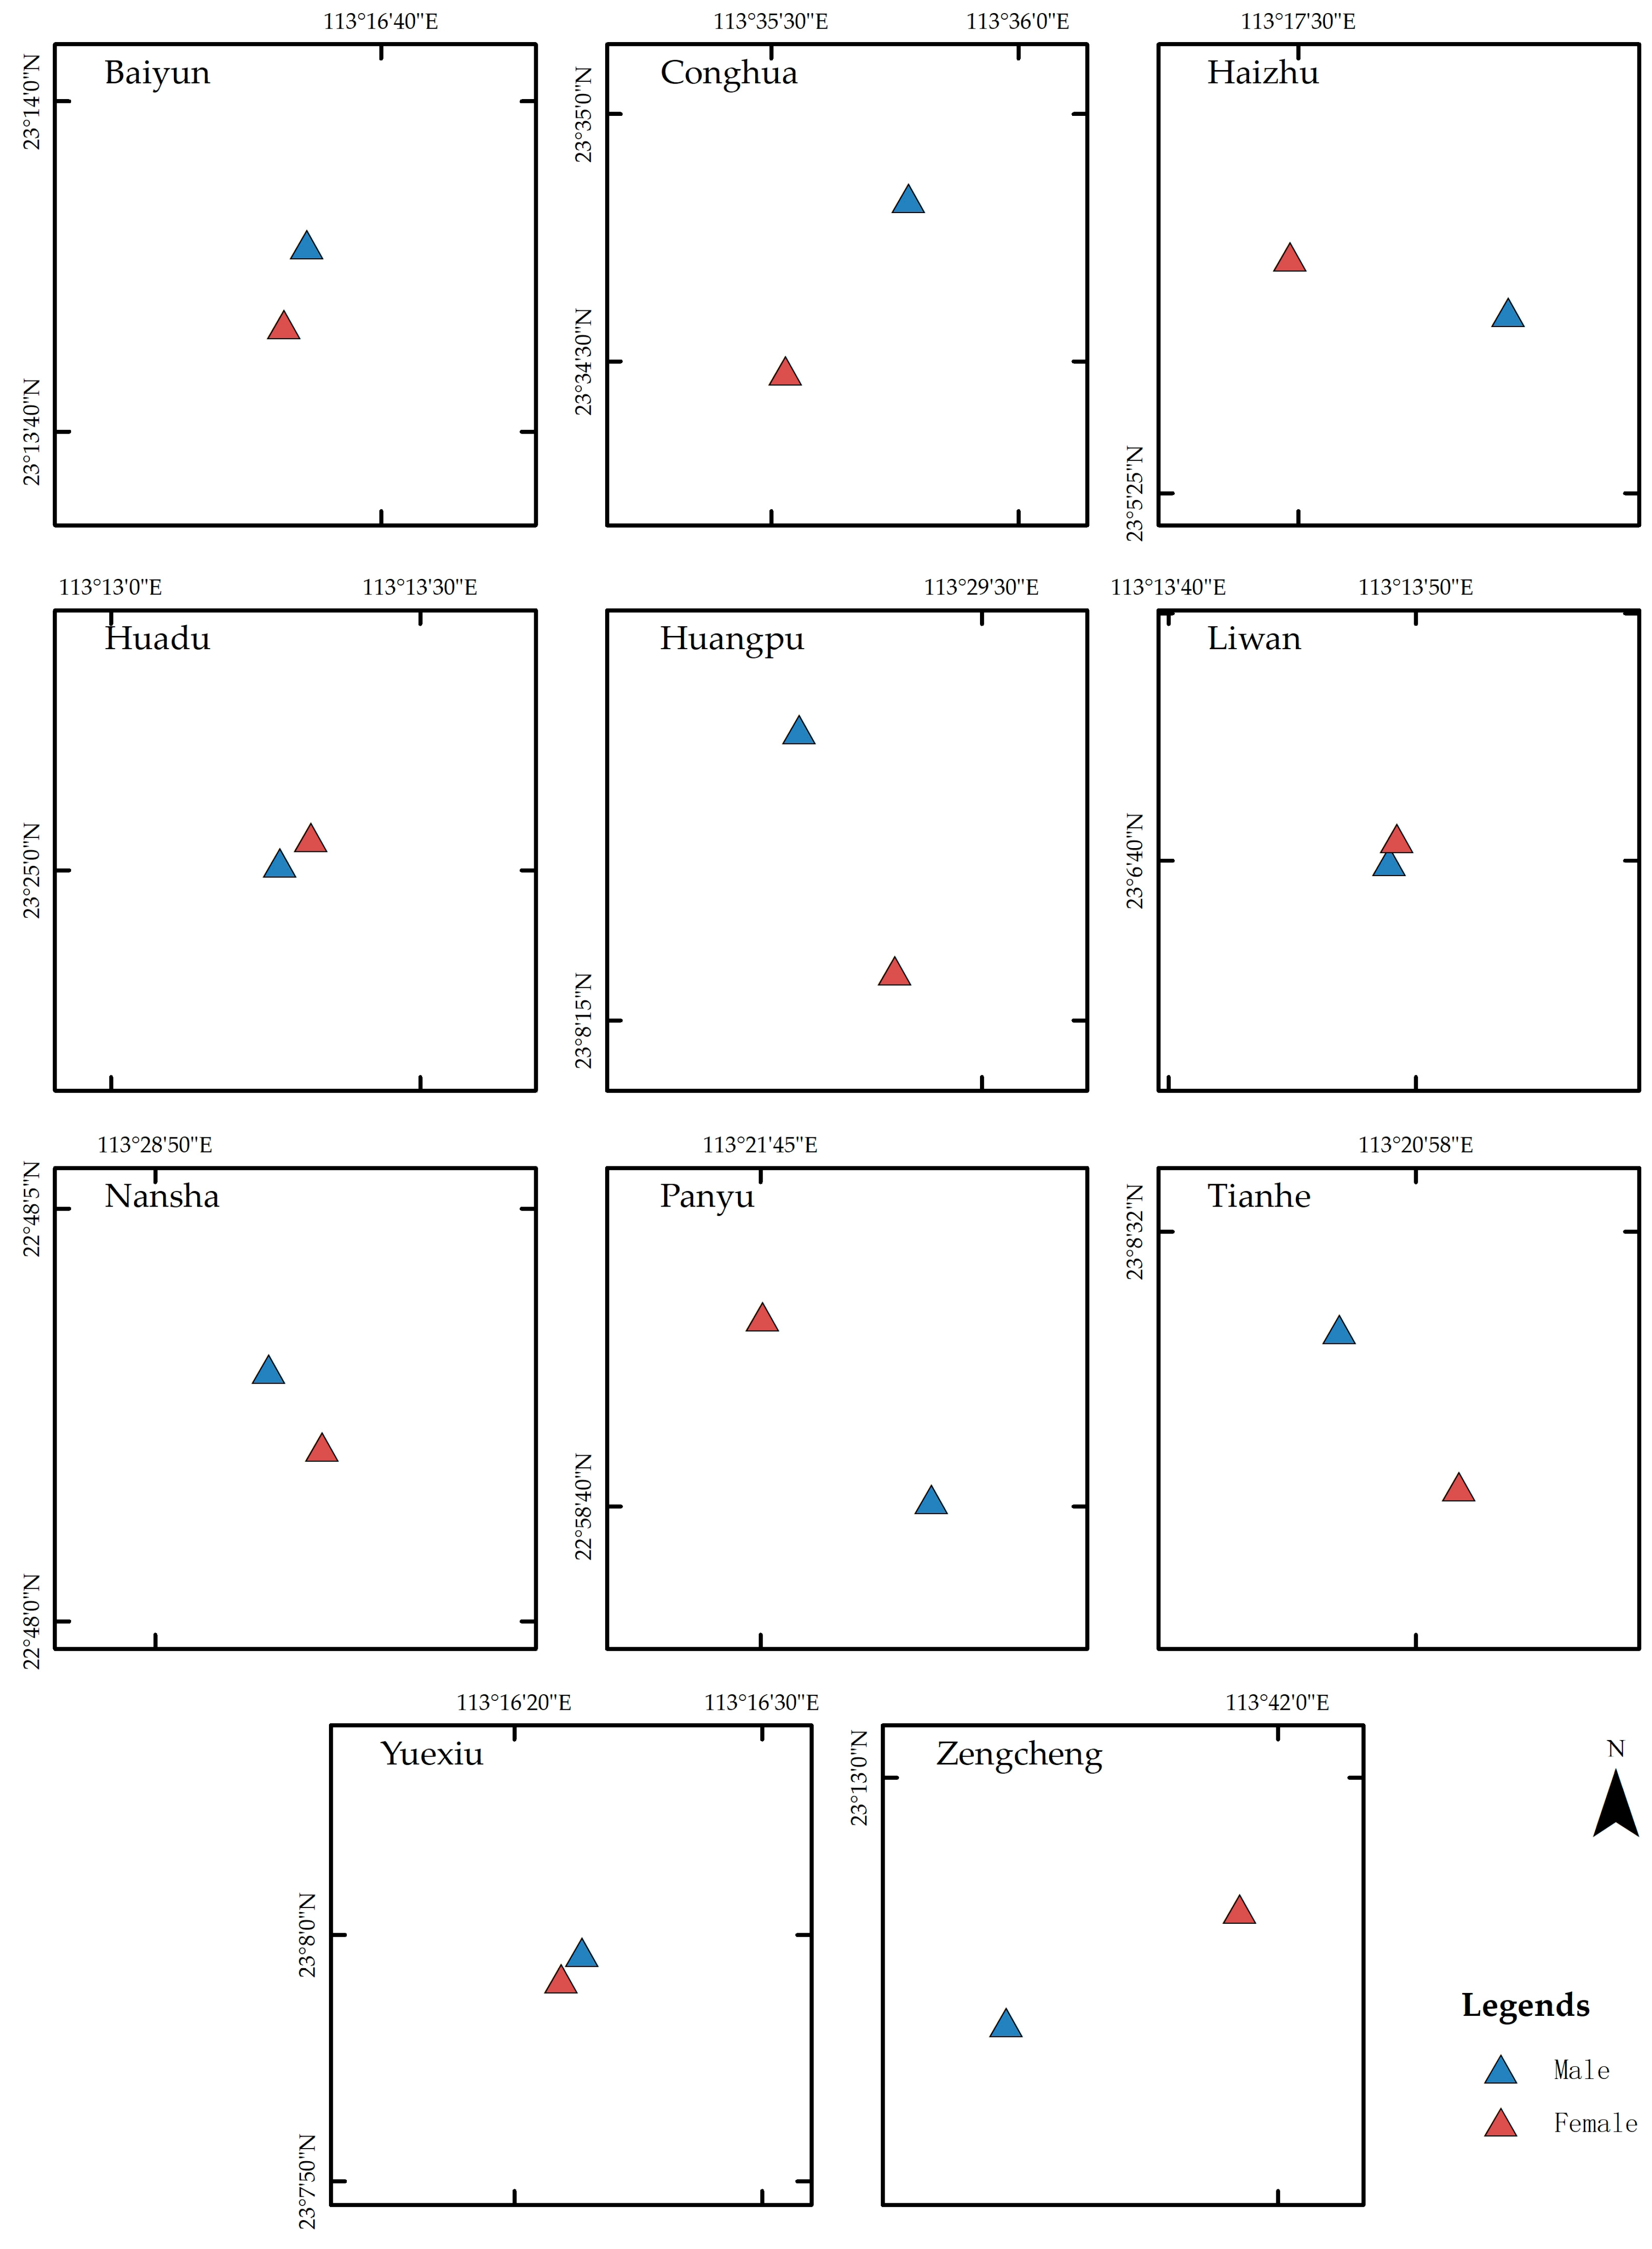
4.3. Standard Deviational Ellipse (SDE) Analysis

The standard deviation ellipse (SDE) [157] analysis is often used to depict the spatial characteristics of a geographical entity, such as central tendency, dispersion, and directional trends. SDE not only is an abstract expression for individual spatial distribution, but it also builds more comprehensive and realistic models of human mobility and online behavior [158]. It is quite effective for a discrete description of anisotropic events in the spatial point pattern analysis, which has been widely used in extensive research such as urban structure analysis [159]. This useful tool is chosen in this study to analyze the check-in behavior at a more detailed level.
There are four parameters of SDE that include the ellipse center, major axis, minor axis, and azimuth. The major and minor axes of the SDE are calculated according to Equation (5), and their proportional relations denote the degree of flattening the SDE. The rotating azimuth is calculated according to Equation (6), which reflects the main trend directions [160,161]. The standard deviations of the major and minor axes of the SDE are calculated according to Equation (7). The major and minor axes of the SDE form the spatial region of the check-in distribution, and the direction of the major axis is defined as the dominant direction of the variation trend [162]. The ellipse center of SDE ( X ¯ w , Y ¯ w ) is calculated below.
{ X ¯ w = i = 1 n w i x i i = 1 n w i Y ¯ w = i = 1 n w i y i i = 1 n w i
The azimuth α of SDE is calculated using the equation below.
tan α = ( i = 1 n w i 2 x ˜ i 2 i = 1 n w i 2 y ¯ i 2 ) + ( i = 1 n w i 2 x ˜ i 2 i = 1 n w i 2 y ¯ i 2 ) 2 + 4 i = 1 n w i 2 x ˜ i 2 y ¯ i 2 2 i = 1 n w i 2 x ˜ i y ¯ i
The standard deviations of the ellipse σ x and σ y in the x and y directions are calculated using the formulas below.
{ σ x = i = 1 n ( w i x ˜ i cos α w i y ¯ i sin α ) i = 1 n w i 2 σ y = i = 1 n ( w i x ˜ i sin α w i y ¯ i cos α ) i = 1 n w i 2
where ( x i , y i ) in Equations (5)–(7) denote the deviation between coordinates of an element and the geometric center coordinates of an element set, which represents the spatial location of the object. In addition, w i is the corresponding weight and ( x ˜ i , y ¯ i ) denote the coordinates deviation from the spatial location of each object to the ellipse center of SDE ( X ¯ w , Y ¯ w ).

5. Results and Discussion

5.1. Density Variations and Distribution of Check-Ins

In the current study, the geo-location-based check-in dataset, which comes from Weibo, is utilized and analyzed the check-in density by using KDE. Figure 3a shows the main highways, water channels, and vegetation of Guangzhou, where Figure 3b presents the overall check-in density in Guangzhou. However, by comparing Figure 3a,b, it can be observed that the city center has a relatively dense check-in distribution. Generally, it is considered that more and more people prefer to live near the communities where they have easy access to services, i.e., transport, healthcare, and entertainment [163,164]. Even from the current study, high check-in density is found nearby subways and highways. Historically, the density of the Guangzhou city population rose abruptly, and the attraction of the port mainly influenced population distribution. After the reforms in China, suburban areas were covered by mega-factories, which attracted more people from the areas outside of Guangzhou for the development of mega-factories. However, a small proportion of these people preferred to live in suburban areas while the majority preferred to reside within the city center [165,166,167]. Hence, the result of the current study also shows the same pattern of population density in Guangzhou.
Gender-based (male and female) analysis on the LBSN data set is performed to investigate the check-in behavior in Guangzhou. Figure 4a,b represents the check-in trend during a weekend and illustrates that, from the dataset, the female users are observed to be more inclined towards the use of Weibo in comparison to the male users during a week in Guangzhou. Moreover, it is also observed that the check-in frequency of the male starts to increase during Friday and almost matches females during Saturday and Sunday. Furthermore, Figure 4 shows that female users are more likely to use Weibo than males. Figure 5 demonstrates that the pattern is similar in all districts.
To study the check-in trend in Guangzhou, it is vital to observe the gender-based check-in trend through weekdays and weekend. In Figure 6a,b, the growing activity trend can be witnessed through the weekdays from 05:30–09:30 and 17:00–22:30. However, an increasing check-in trend was also observed throughout the weekend from 08:00–22:30. Furthermore, it can also be observed that the frequency of use from female users is a bit steady with a minor rise during the weekend in comparison to male users. Comparatively, the check-in frequency of male users differs a lot during weekdays and weekends. Furthermore, it is observed that, during the whole week, check-in frequency increases from 20:00–23:59. Additionally, during the weekend, the check-in frequency of male users peaks between 19:00–23:00 as compared to female users.
Figure 7 illustrates the check-in distribution in all districts of Guangzhou. In comparison, Baiyun, Panyu, Tianhe, and Yuexiu districts (which are considered the business center of Guangzhou) have denser check-in frequency. However, from Figure 8, we can observe more check-ins during Saturday as compared to Sunday in Huadu, Huangpu, and Zengcheng districts when compared to other districts.
Figure 9a,b show the gender wise check-in distribution in Guangzhou during weekdays and weekend. Meanwhile, more check-ins are made by female users during the weekdays, as shown in Figure 9a. Surprisingly, more check-ins are made by male users in most of the districts (Baiyun, Haizhu, Huangpu, Liwan, Nansha, Tianhe, and Yuexiu) in Guangzhou as compared to female users during the weekend.
Figure 10a,b represent the gender-based weekly check-in trend in all districts of Guangzhou. The difference of check-in behavior by male and female users during Saturday and Sunday can be observed clearly and is mainly due to the change in check-in behavior by male users. Hence, the results of Figure 10a,b also justify the results of Figure 9a,b.
Furthermore, we analyzed the Weibo dataset to observe a gender-based check-in trend during 24 hours in all districts of Guangzhou and is presented in Figure 11a,b,c. Figure 11a presents the day-to-day check-in trend in Guangzhou. An increase in check-in trend is observed from 07:00 AM to 09:00 AM. However, a decrease in the check-in trend is observed from 09:00 to 11:30. Furthermore, It can also be observed that the check-in trend starts to rise again at 11:30 AM and continues to rise until 22:30, as shown in Figure 11b,c.
Average density distribution of check-ins made in Guangzhou was calculated using the KDE method, and the density maps are visualized using ArcGIS in both space and time. Figure 12 reveals the spatiotemporal dynamics of Guangzhou, and it reveals that the center of the Guangzhou city has a higher density of check-ins. Besides higher density of check-ins, it can also be observed that most of the check-ins are made near the borders of the district that are mostly near highways and the subway.
In summary, the KDE results reveal that the check-in behavior patterns in Guangzhou are as follows: (1) in terms of the spatial distribution, main agglomeration areas with high frequencies and densities are evident in the center of the city (Baiyun, Haizhu, Liwan, Tianhe, and Yuexiu). (2) From a temporal perspective, people’s activity frequencies are almost zero between midnight and early morning (00:00-05:00) and relatively low during working times (09:30-11:30) and relatively high during leisure times and at dinner time. The information from KDE can facilitate studying the dynamic evolution of check-in across both space and time. Additionally, the KDE results verify that the check-in behavior varies at fine temporal (i.e., a day) and spatial (i.e., a city) scales. The results also show that the check-in data can reflect more refined phenomena and results than traditional data with fine time and spatial granularity.

5.2. Geographically Weighted Regression (GWR)

The GWR results for male and female during weekdays and weekends are presented in Table 1. All selected variables are significant at the 1% level. The R2 values are 0.9288 and 0.9157, which denote that the selected variables can explain 92.8% and 91.5% of the variation in the check-in on weekdays and weekend, with optimal spatiotemporal bandwidths of 0.300 and 0.301 for weekdays and weekend, respectively. The variation trends for male and female during weekdays vary due to the higher number of check-ins by a female as compared to males and can be observed in Figure 14. The variation trends for males and females during the weekend are roughly the same due to the increased number of check-ins by the male as compared to weekdays and can be observed in Figure 14.
Table 2 presents the GWR results for weekdays and weekends in all districts of Guangzhou. All selected variables are significant at the 1% level. The R2 values are 0.9203 and 0.9212, denoting that the selected variables can explain 92% and 92.1% of the variation in the check-in on weekdays and weekends in all districts of Guangzhou, with optimal spatiotemporal bandwidths of 0.331 and 0.320 for weekdays and weekends, respectively. The variation trends during weekdays and weekends are very different in most of the districts due to the higher number of check-ins in the city center during weekdays. There is a slight increase in activity in the suburban districts (i.e., Conghua, Nansha, and Zengcheng) during the weekend as compared to weekdays.
Table 3 presents the GWR results for males and females in all districts of Guangzhou during weekdays. All selected variables are significant at the 1% level. The R2 values are 0.9024 and 0.9186, which denote that the selected variables can explain 90% and 92% of the variation in the check-in for male and female in all districts of Guangzhou during weekdays, with optimal spatiotemporal bandwidths of 0.3554 and 0.3138, respectively. The variation trends during weekdays by males and females are quite different in most of the districts due to the higher number of check-ins by females in all districts of Guangzhou.
Table 4 presents the GWR results for males and females in all districts of Guangzhou during the weekend. All selected variables are significant at the 1% level. The R2 values are 0.9264 and 0.9020, which denote that the selected variables can explain 93% and 90% of the variation in the check-in for males and females in all districts of Guangzhou during weekdays, with optimal spatiotemporal bandwidths of 0.3315 and 0.3449, respectively. The variation trends during the weekend by males and females are roughly the same due to the higher number of check-ins by the males as compared to females.
Moreover, Figure 13 shows the average spatial change tendencies of the parameter estimates for check-ins, which are pivotal and focus factors in this article. This article also manually sets zero as a threshold to distinguish between the positive and negative effects. This shows the general tendencies and nuances of check-ins by male and female users. The effects of check-ins by the female users in the city center are greater than 0.5 StdResid as compared to male. The greater StdResid means that check-in frequency is high among the female users.
Figure 14 shows the average spatial change tendencies of the parameter estimates for check-ins by males and females during weekdays and weekends. The effects of check-ins during weekdays in Guangzhou are mostly greater than 0.5 StdResid by females. However, the effects of check-ins during the weekend in Guangzhou are almost the same by male and female users. Lastly, urban areas that are also considered the city center, including Baiyun, Haizhu, Liwan, Tianhe, and Yuexiu, all have positive effects on check-in frequency. The other districts have mostly negative effects, which have few settlements.

5.3. Standard Deviational Ellipse (SDE) Analysis

The overall spatial pattern changes of check-ins by males and females across Guangzhou were determined through a standard deviational ellipse analysis and is plotted in Figure 15, which shows the overall spatial pattern of check-in within the city by males and females. In this case, the major axis indicates the direction and the minor axis indicates the range of the data distribution.
The trajectory of the center in Figure 15 shows a linear movement by the female users in a clockwise direction toward the north-east by rotating azimuth 3°, and the movement of the male users is counterclockwise when rotating azimuth 179°. However, it can be observed from Table 5 that the value of the minor axis for the female users is 40.86 km with an area of 6343.12 km2, which results in the larger eccentricity of the SDE. The larger eccentricity of the SDE represents that the check-ins for females are more scattered in the city as compared to males. It also represents that the check-in distribution is mostly close toward the city center by the male users.
Figure 16 shows the SDEs for the overall spatial pattern of check-in within the city by males and females during weekdays and weekends in Guangzhou. During weekdays, a linear movement by the female users in a clockwise direction toward the north-east by rotating azimuth 5° and the movement of the male users is counterclockwise by rotating azimuth 179°. However, during the weekend, a linear movement is taken by the female users in a clockwise direction toward the north-east by 1° and the movement of the male users is counterclockwise when rotating azimuth 174°. Moreover, it can be observed from Table 6 that the value of the minor axis for females during weekdays is 38.14 km with an area of 6381.89 km2, which results in the larger eccentricity of the SDE as compared to males. The larger eccentricity of the SDE represents that, during weekdays, the check-ins for females are more scattered in the city as compared to males. It also represents that, during the check-in, distribution is mostly close toward the city center by the male users as compared to the female users. However, during the weekend, a linear movement by the female users in a counterclockwise direction toward the north-west by rotating azimuth 1° as compared to rotating azimuth 5° during weekdays and the movement of the male users is also counterclockwise toward the north-west when rotating azimuth by 174° as compared to rotating azimuth 179° during weekdays. This change in a pattern during the weekend indicates that the check-in distribution by both males and females shifts to the city center.
Moreover, it can be observed from Table 6 that the value of the minor axis for females during weekdays is 37.04 km with an area of 6258.46 km2, which results in the larger eccentricity of the SDE as compared to males. The larger eccentricity of the SDE represents that, during the weekend, the check-in distribution for females are also more scattered in the city as compared to males, but, during the weekend, the spatial pattern of check-ins is mostly scattered toward the city center.
Figure 17 shows the district-wise SDEs for the overall spatial pattern of check-ins within the city by males and females in all (eleven) districts of Guangzhou. It can be observed that the overall spatial pattern of check-ins is almost the same by males and females in Baiyun, Huadu, Liwan, and Yuexiu districts. However, in the Conghua district, a linear movement is taken by the female users in a clockwise direction toward the north-east by rotating azimuth 50° and the movement of the male users is taken as the clockwise direction toward the north-east by rotating azimuth 51°. It can be observed in Table 7 that the value of the minor axis for the female users is 16.94 km with an area of 430.80 km2 and a minor axis for the male users is 18.50 km with an area of 487.26 km2, which results in the larger eccentricity of the SDE as compared to females. The spatial pattern of check-ins by the male users is more scattered within the district as compared to females. In the Haizhu district, a linear movement by the female users is taken in a clockwise direction toward the south-east by rotating azimuth 98° and the movement of the male users is taken in the clockwise direction toward the south-east when rotating azimuth by 99°. The value of the minor axis for the female users is 5.58 km with an area of 35.30 km2 and the minor axis for the male users is 4.62 km with an area of 29.54 km2, which results in the larger eccentricity of the SDE by the female users as compared to males. The spatial pattern of check-in by the female users is more scattered within the district as compared to males.
In the Huangpu district, a linear movement by the female users is taken in a clockwise direction toward the north-east by rotating azimuth 9° and the movement of the male users is taken in the clockwise direction toward the north-east when rotating azimuth by 6°. The value of the minor axis for the female users is 6.38 km with an area of 221.64 km2 and the minor axis for the male users is 6.45 km with an area of 227.97 km2, which results in almost the same eccentricity of the SDE by both males and females. Moreover, the overall spatial pattern of check-in is almost the same by males and females in Nansha and Panyu districts, where the only difference of more scattered distribution of check-ins is conducted by females as compared to males. In the Tianhe district, a linear movement by the female users in a clockwise direction toward the north-east direction by rotating azimuth 98° and the movement of the male users is in the clockwise direction toward the north-east when rotating azimuth by 97°. The value of the minor axis for the female users is 4.62 km with an area of 47.06 km2 and the minor axis for the male users is 5.58 km with an area of 59.99 km2, which results in the larger eccentricity of the SDE by the male users. The spatial pattern of check-ins by the male users is more scattered within the district as compared to females. In the Zengcheng district, a linear movement by the female users in a clockwise direction is conducted toward the north-east by rotating azimuth 37° and the movement of the male users is conducted in the clockwise direction toward the north-east when rotating azimuth by 42°. The value of the minor axis for the female users is 11.81 km with an area of 661.52 km2 and the minor axis for the male users is 7.85 km with an area of 505.09 km2, which results in the larger eccentricity of the SDE by the female users. The spatial pattern of check-in by the female users is more scattered within the district as compared to the male users.
Furthermore, considering the eleven districts in the study area, we plotted the trajectory of SDEs center for each district, as shown in Figure 18. The geometry of trajectories indicate different spatial patterns of check-in behavior by males and females in each district. In general, the spatial aggregating degree of trajectories in the district indicates the check-in distribution in that district and a certain degree of temporal autocorrelation. The apparent features of change in trajectories for all check-ins are presented in Figure 18. It indicates that a larger difference in trajectories is observed in the Conghua, Haizhu, Huangpu, Panyu, Tianhe, and Zengcheng districts. That may be attributed to Conghua and Zengcheng having a larger area, which accounts for the larger extent of the trajectory and indicates more dispersing in check-ins as compared to the Baiyun, Huadu, Liwan, Nansha, and Yuexiu districts having a comparatively smaller area.
Although check-in data are very raw and imprecise for movement of both males and females from one destination to another and, thus, check-in data cannot precisely indicate the nature of the movement of users among the districts, it can still be helpful to understand the check-in behavior.

6. Conclusions

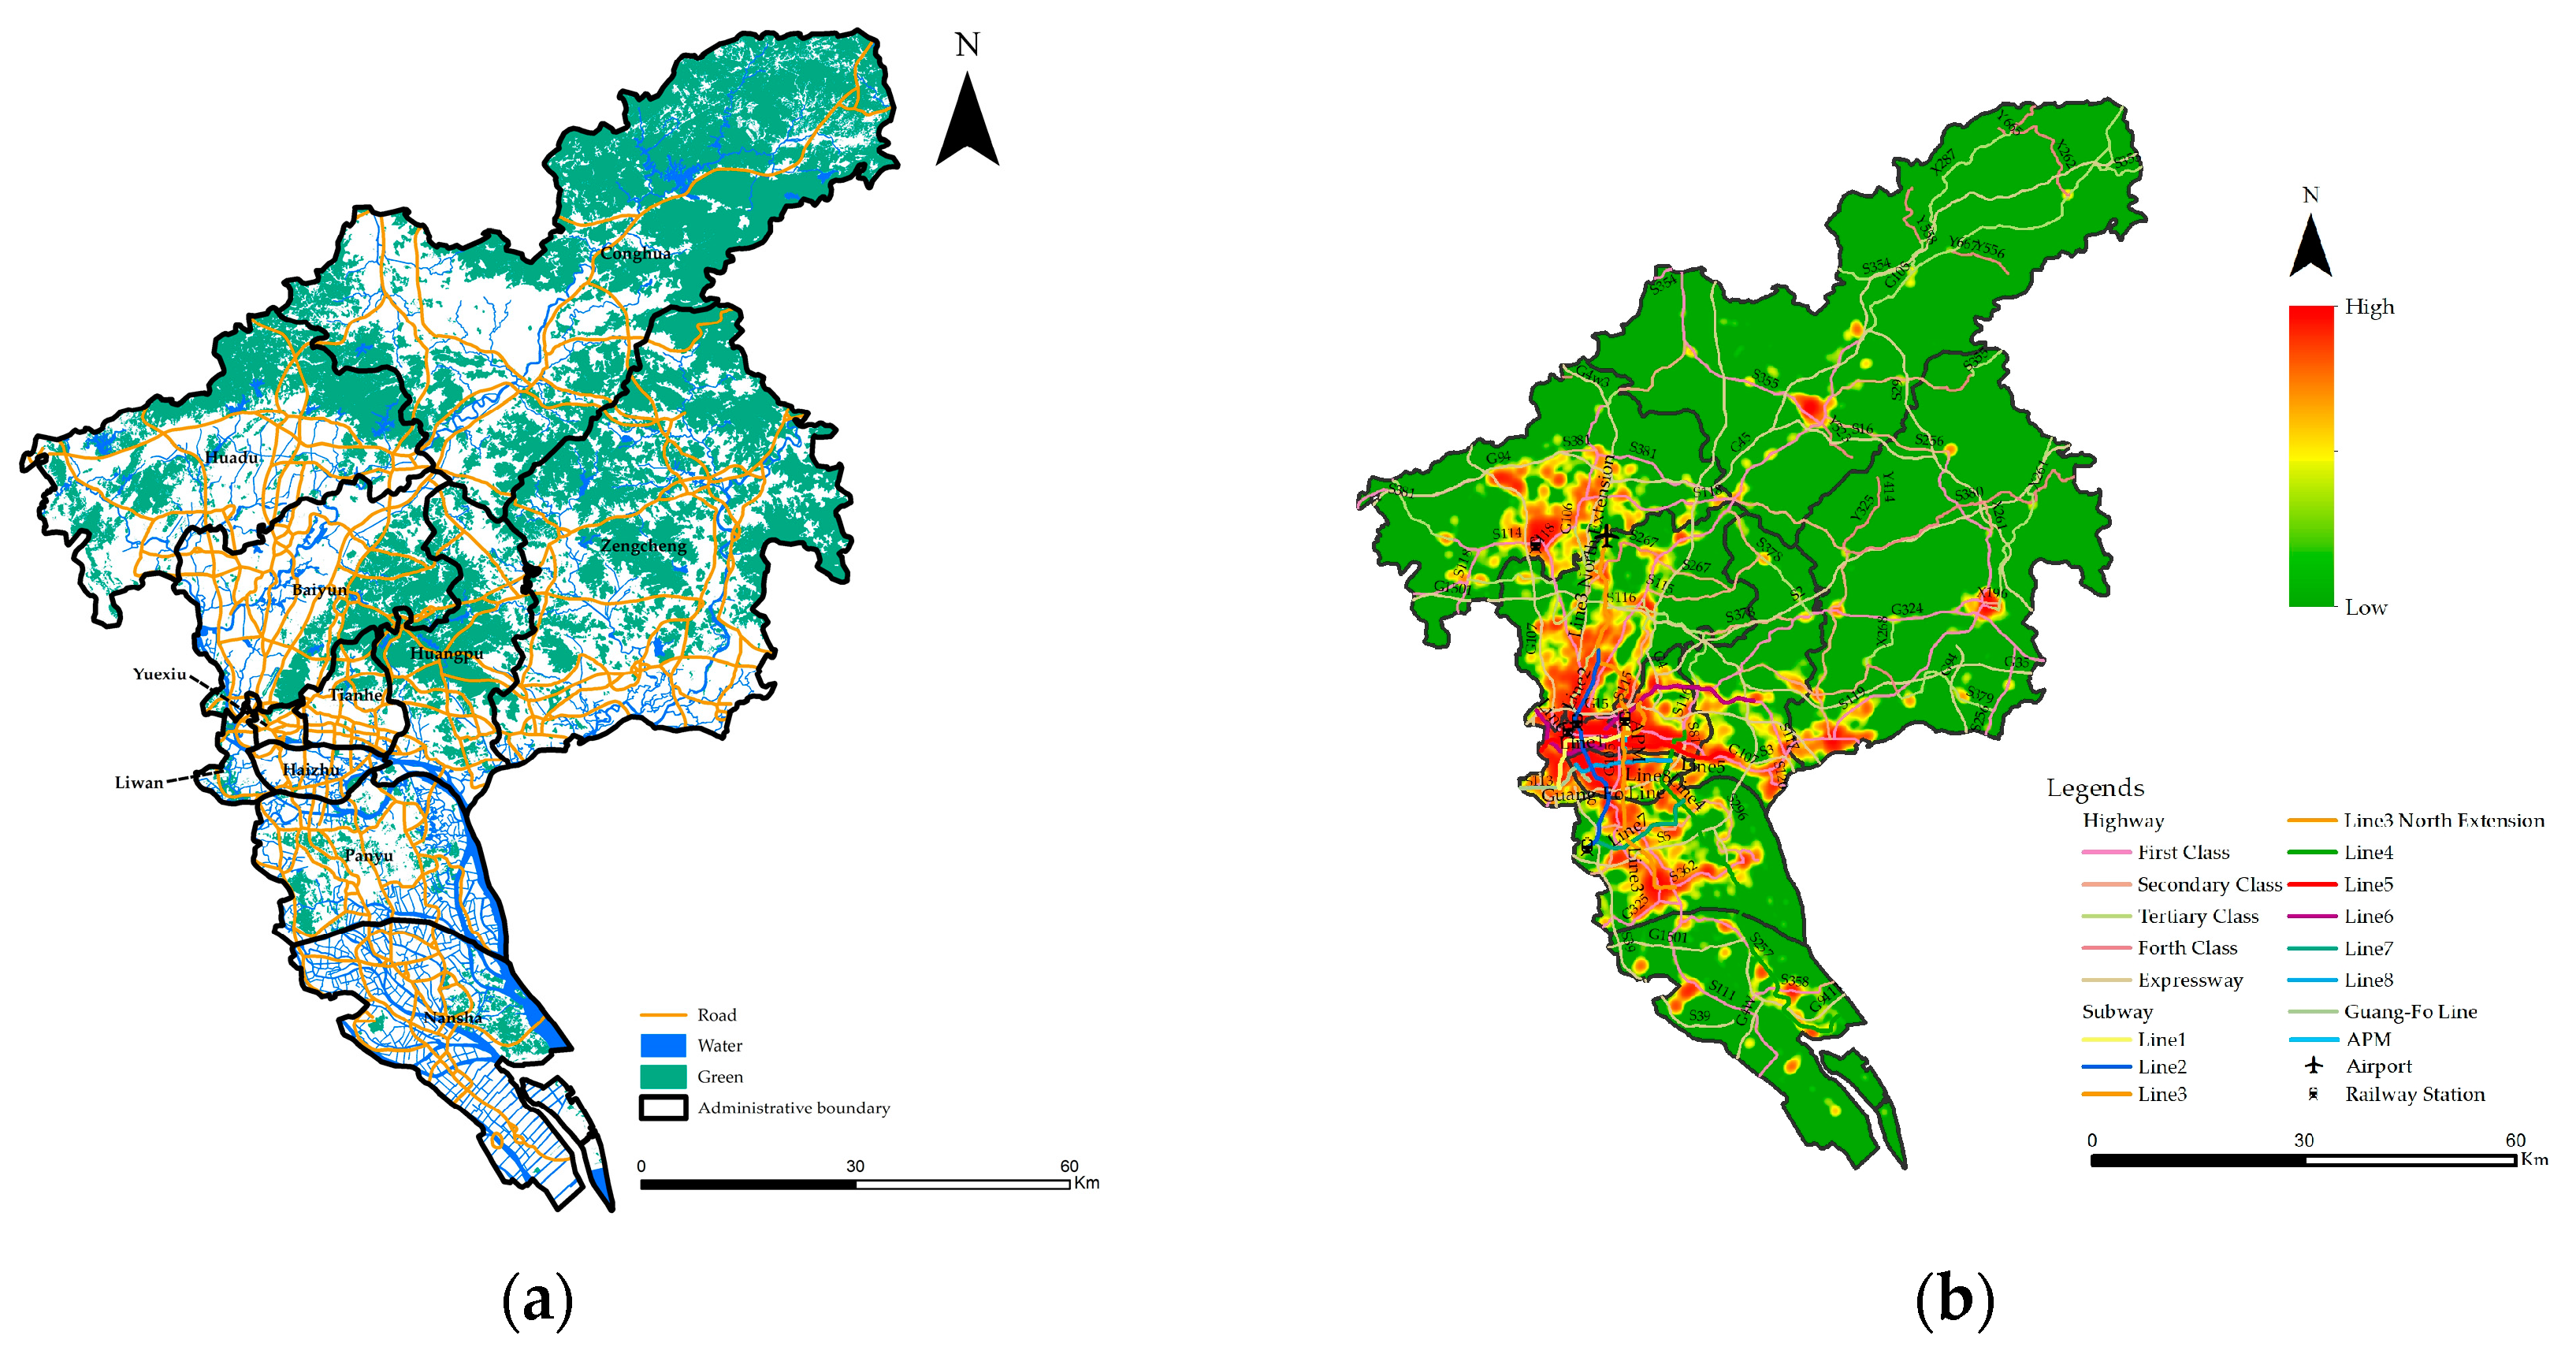
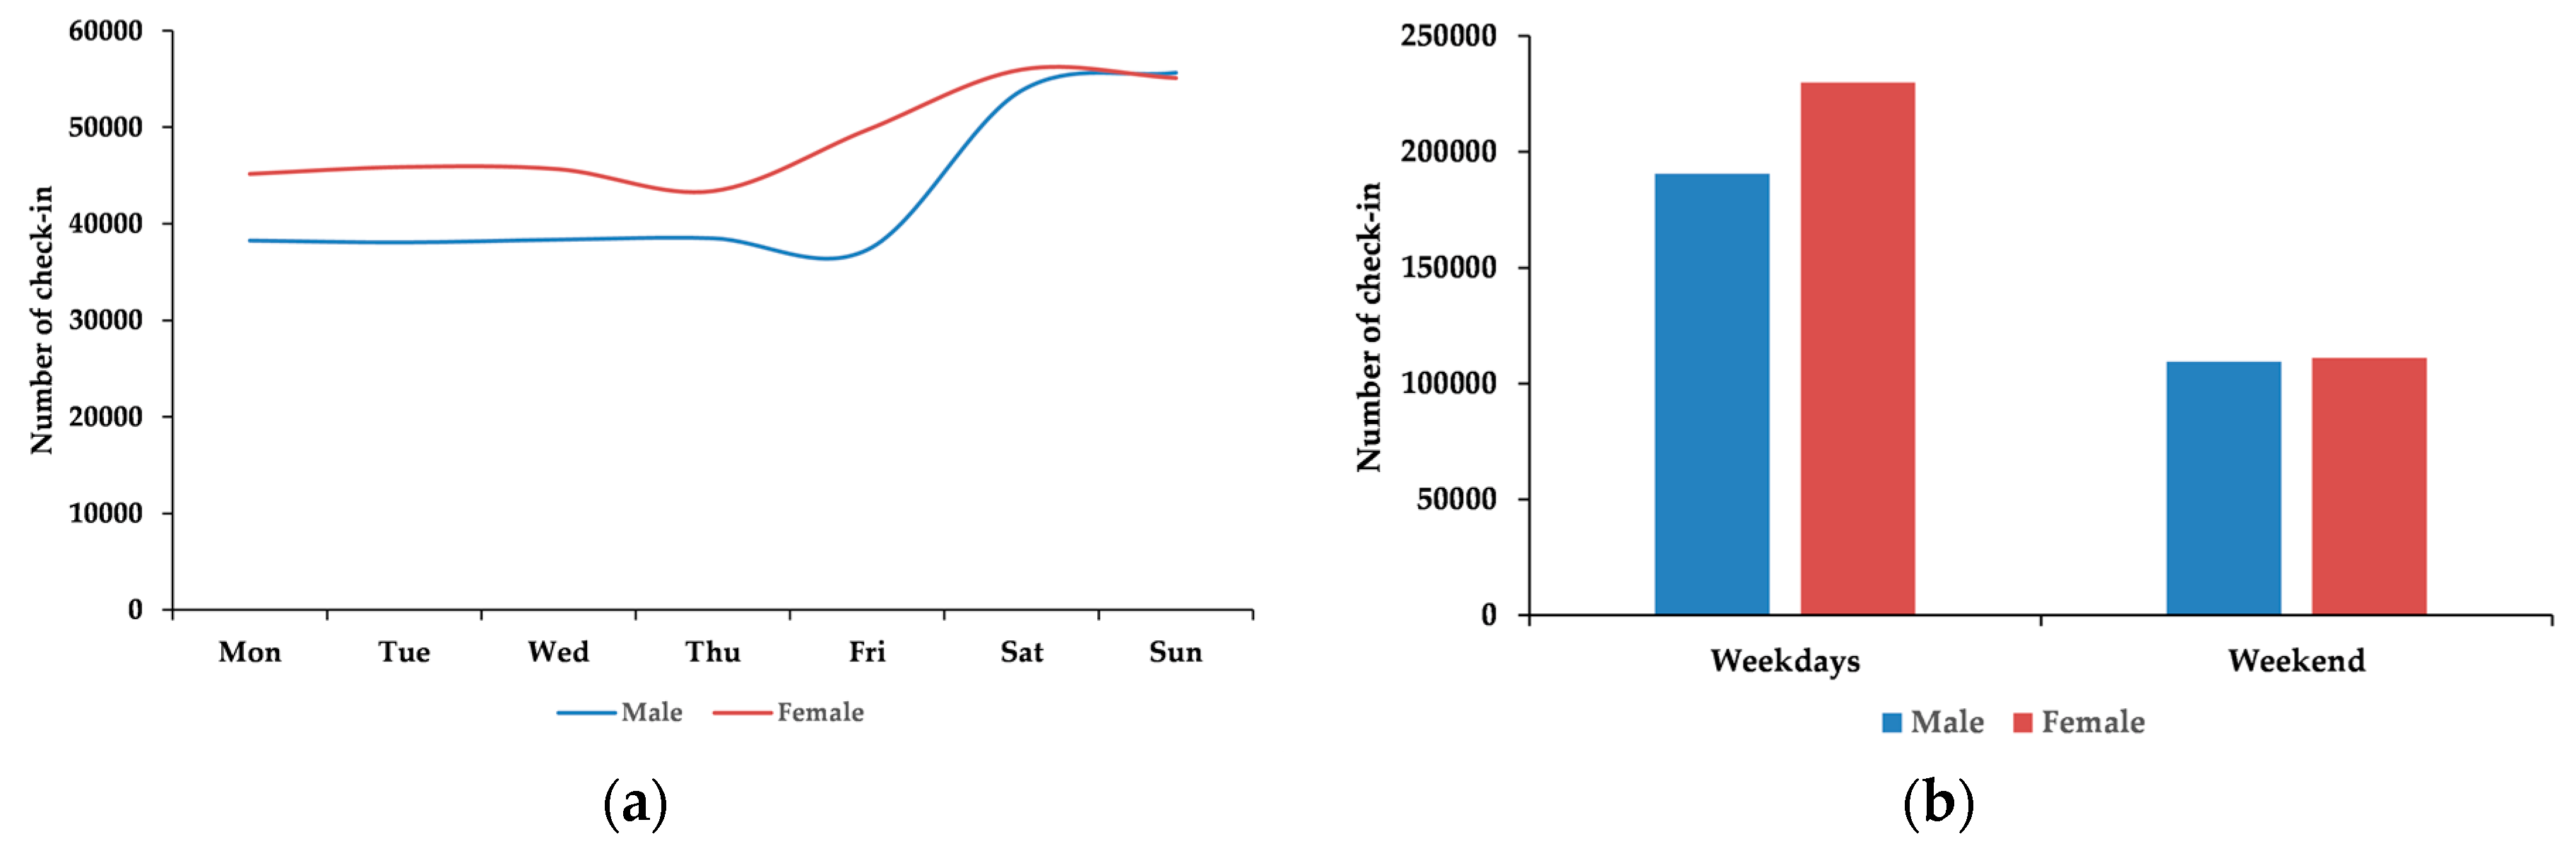
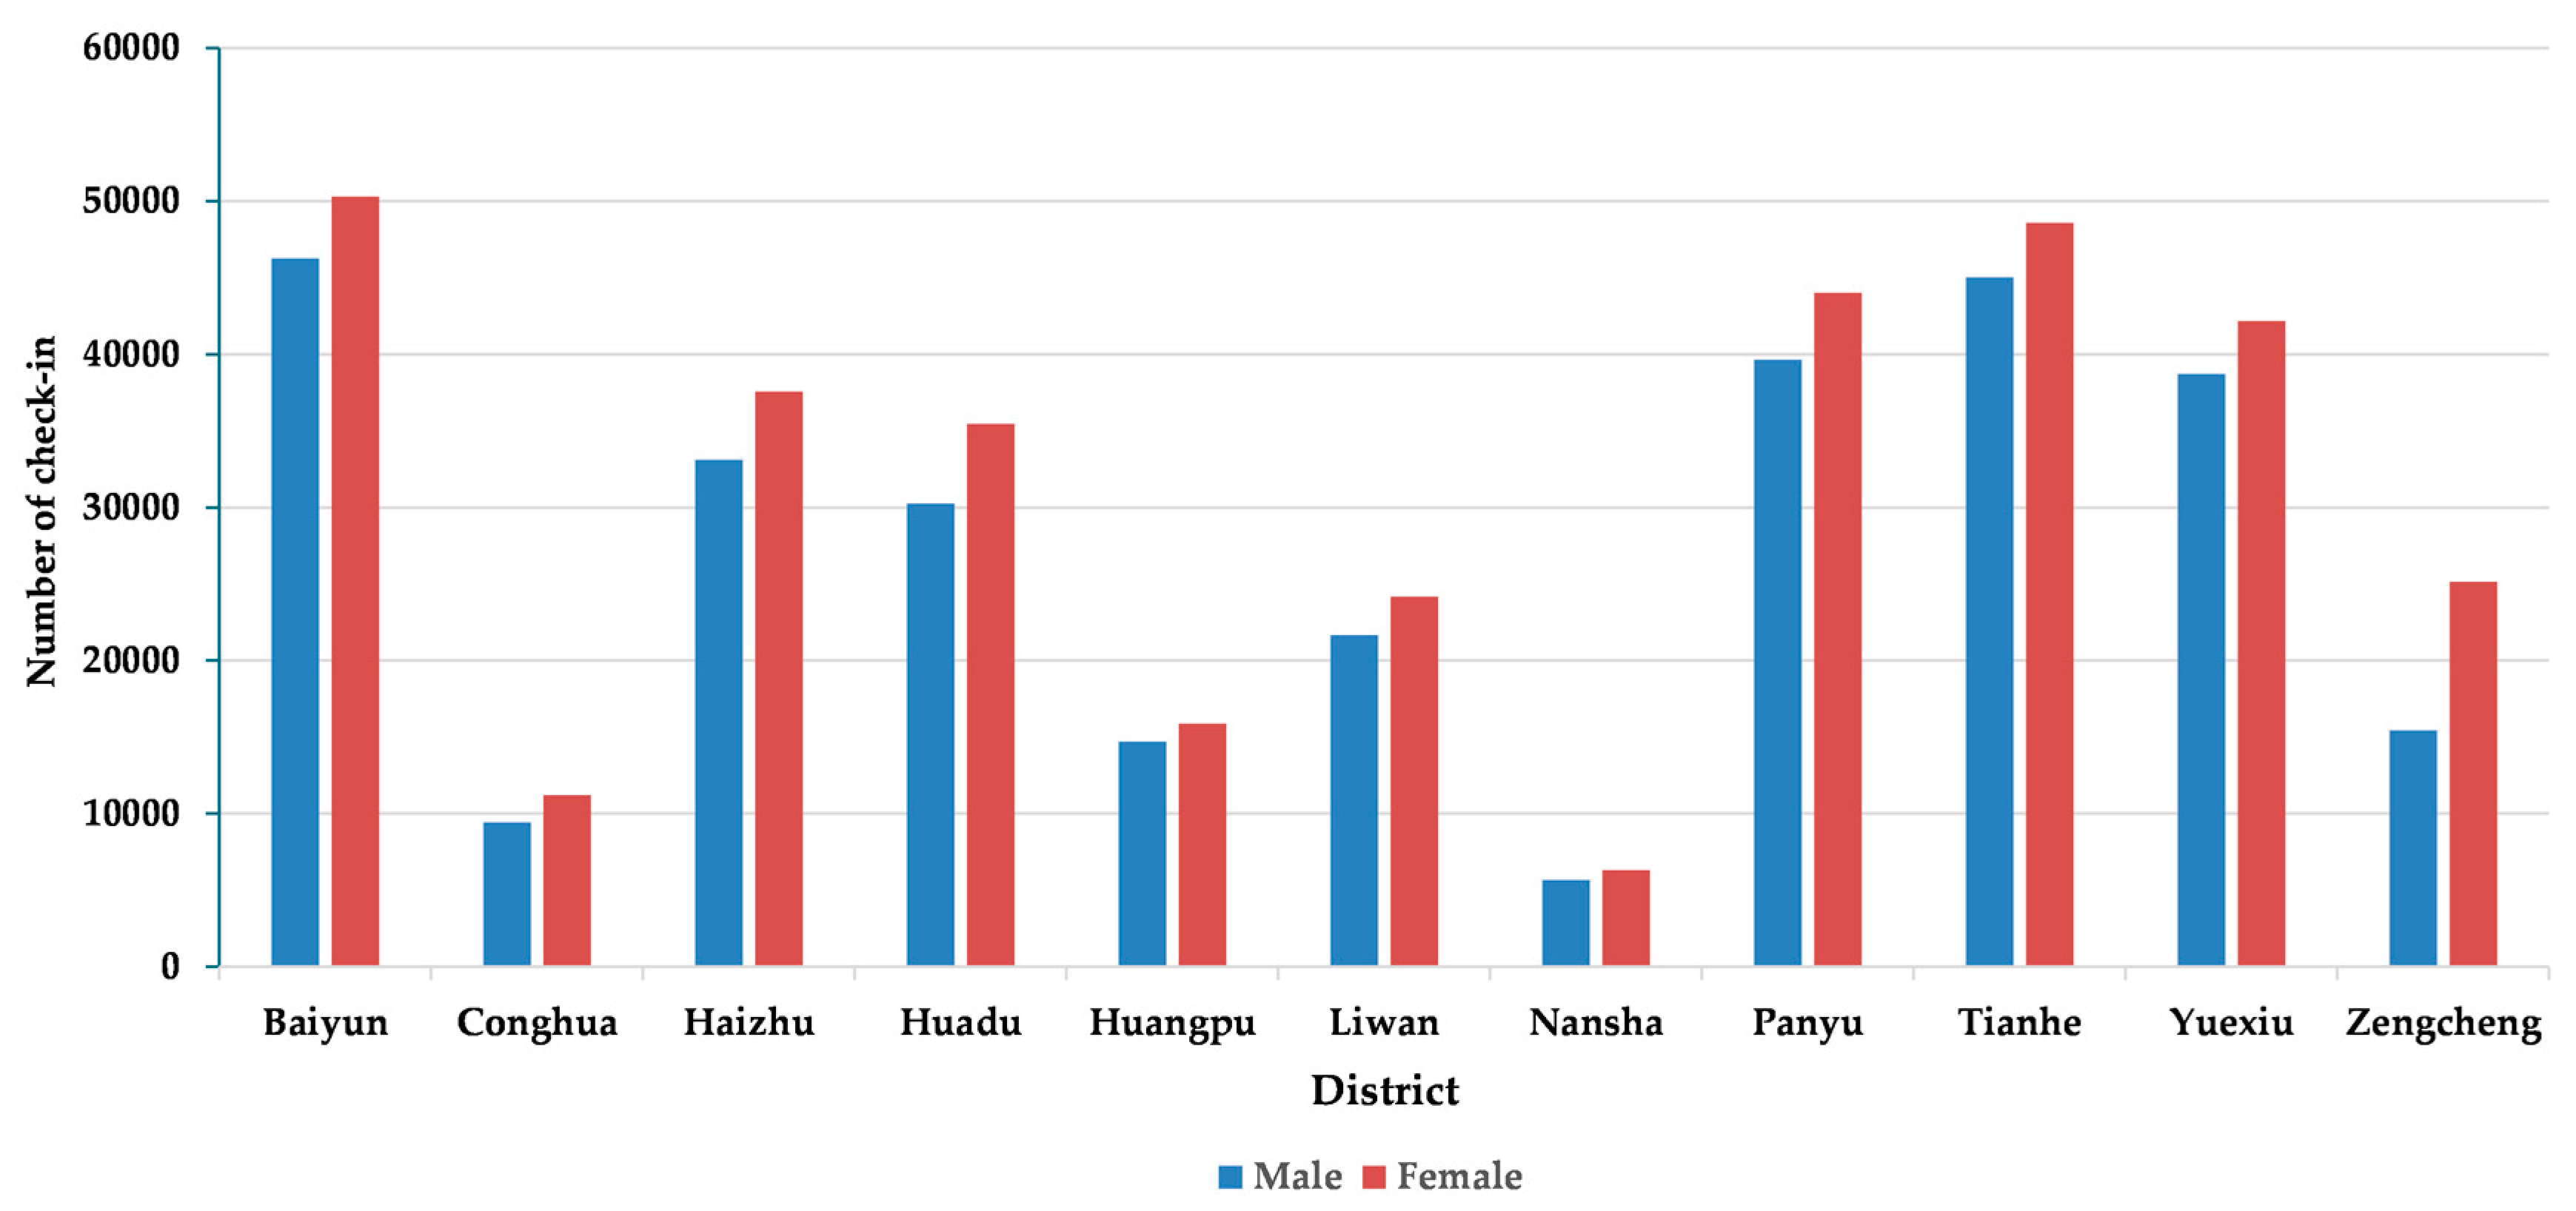
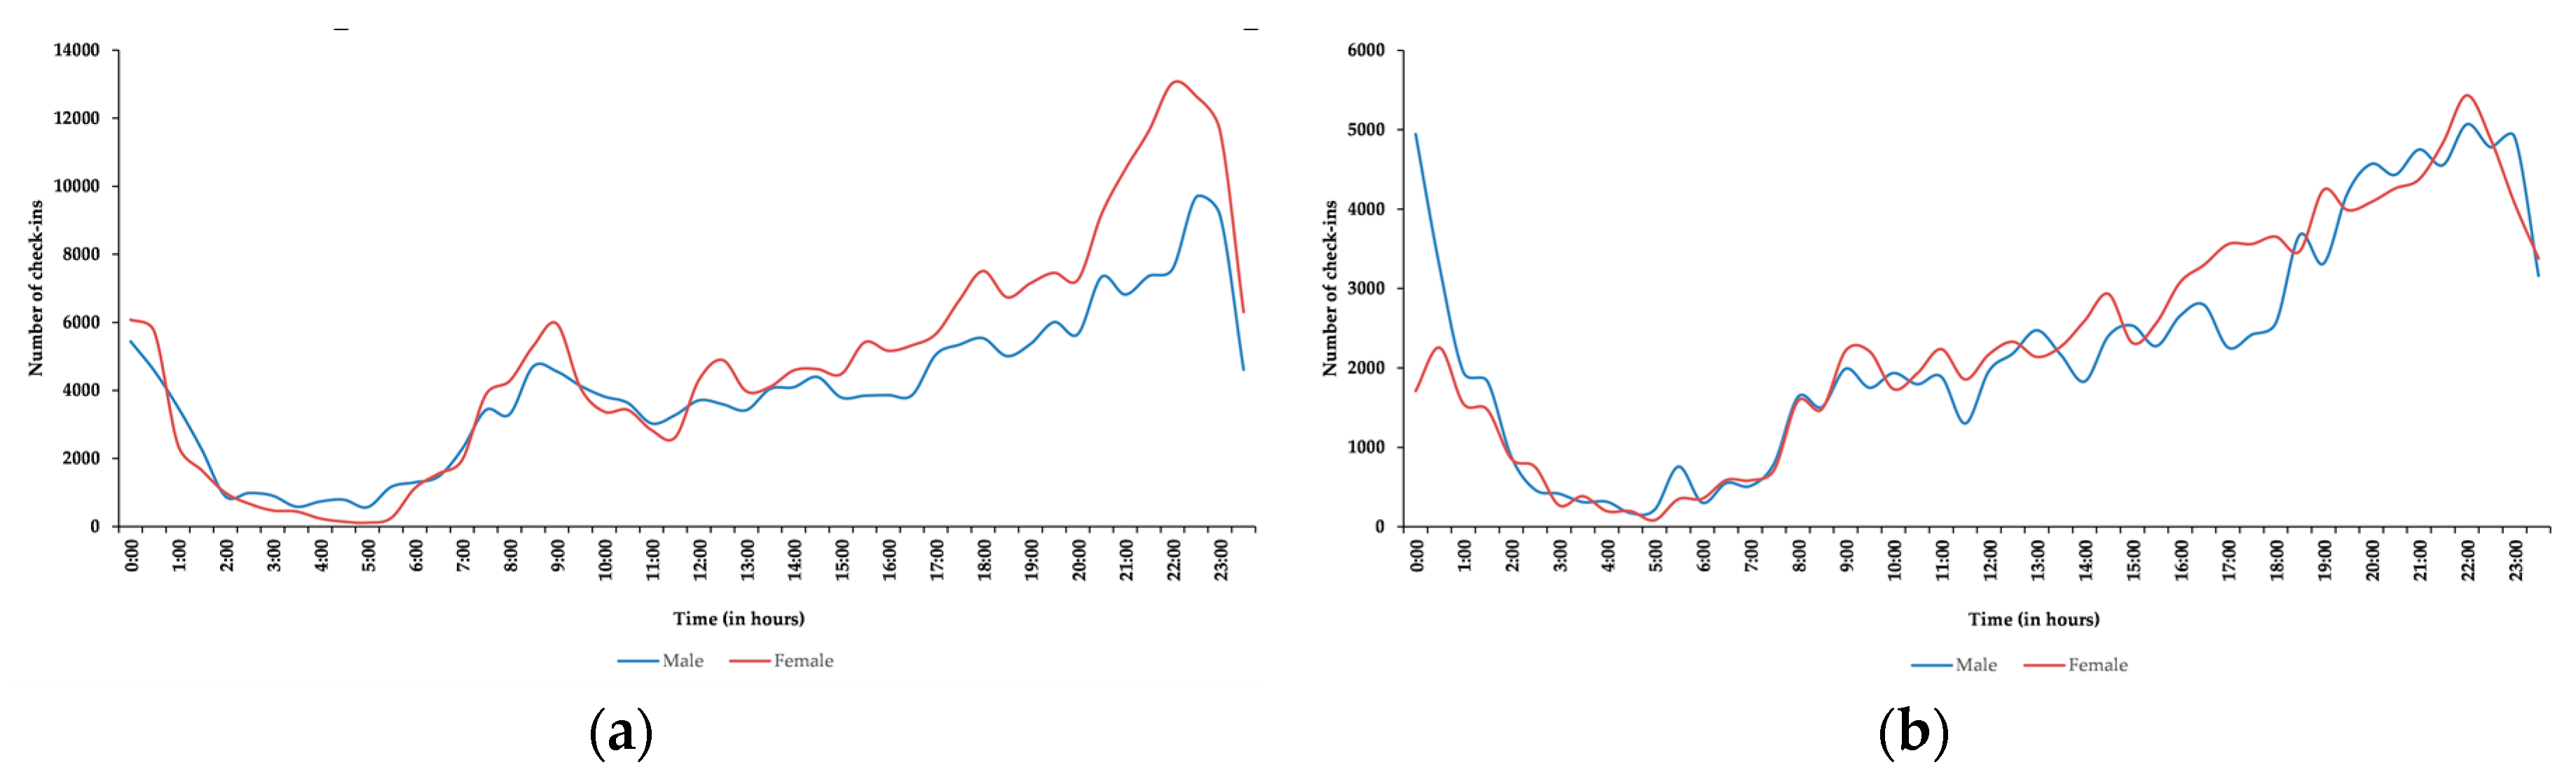
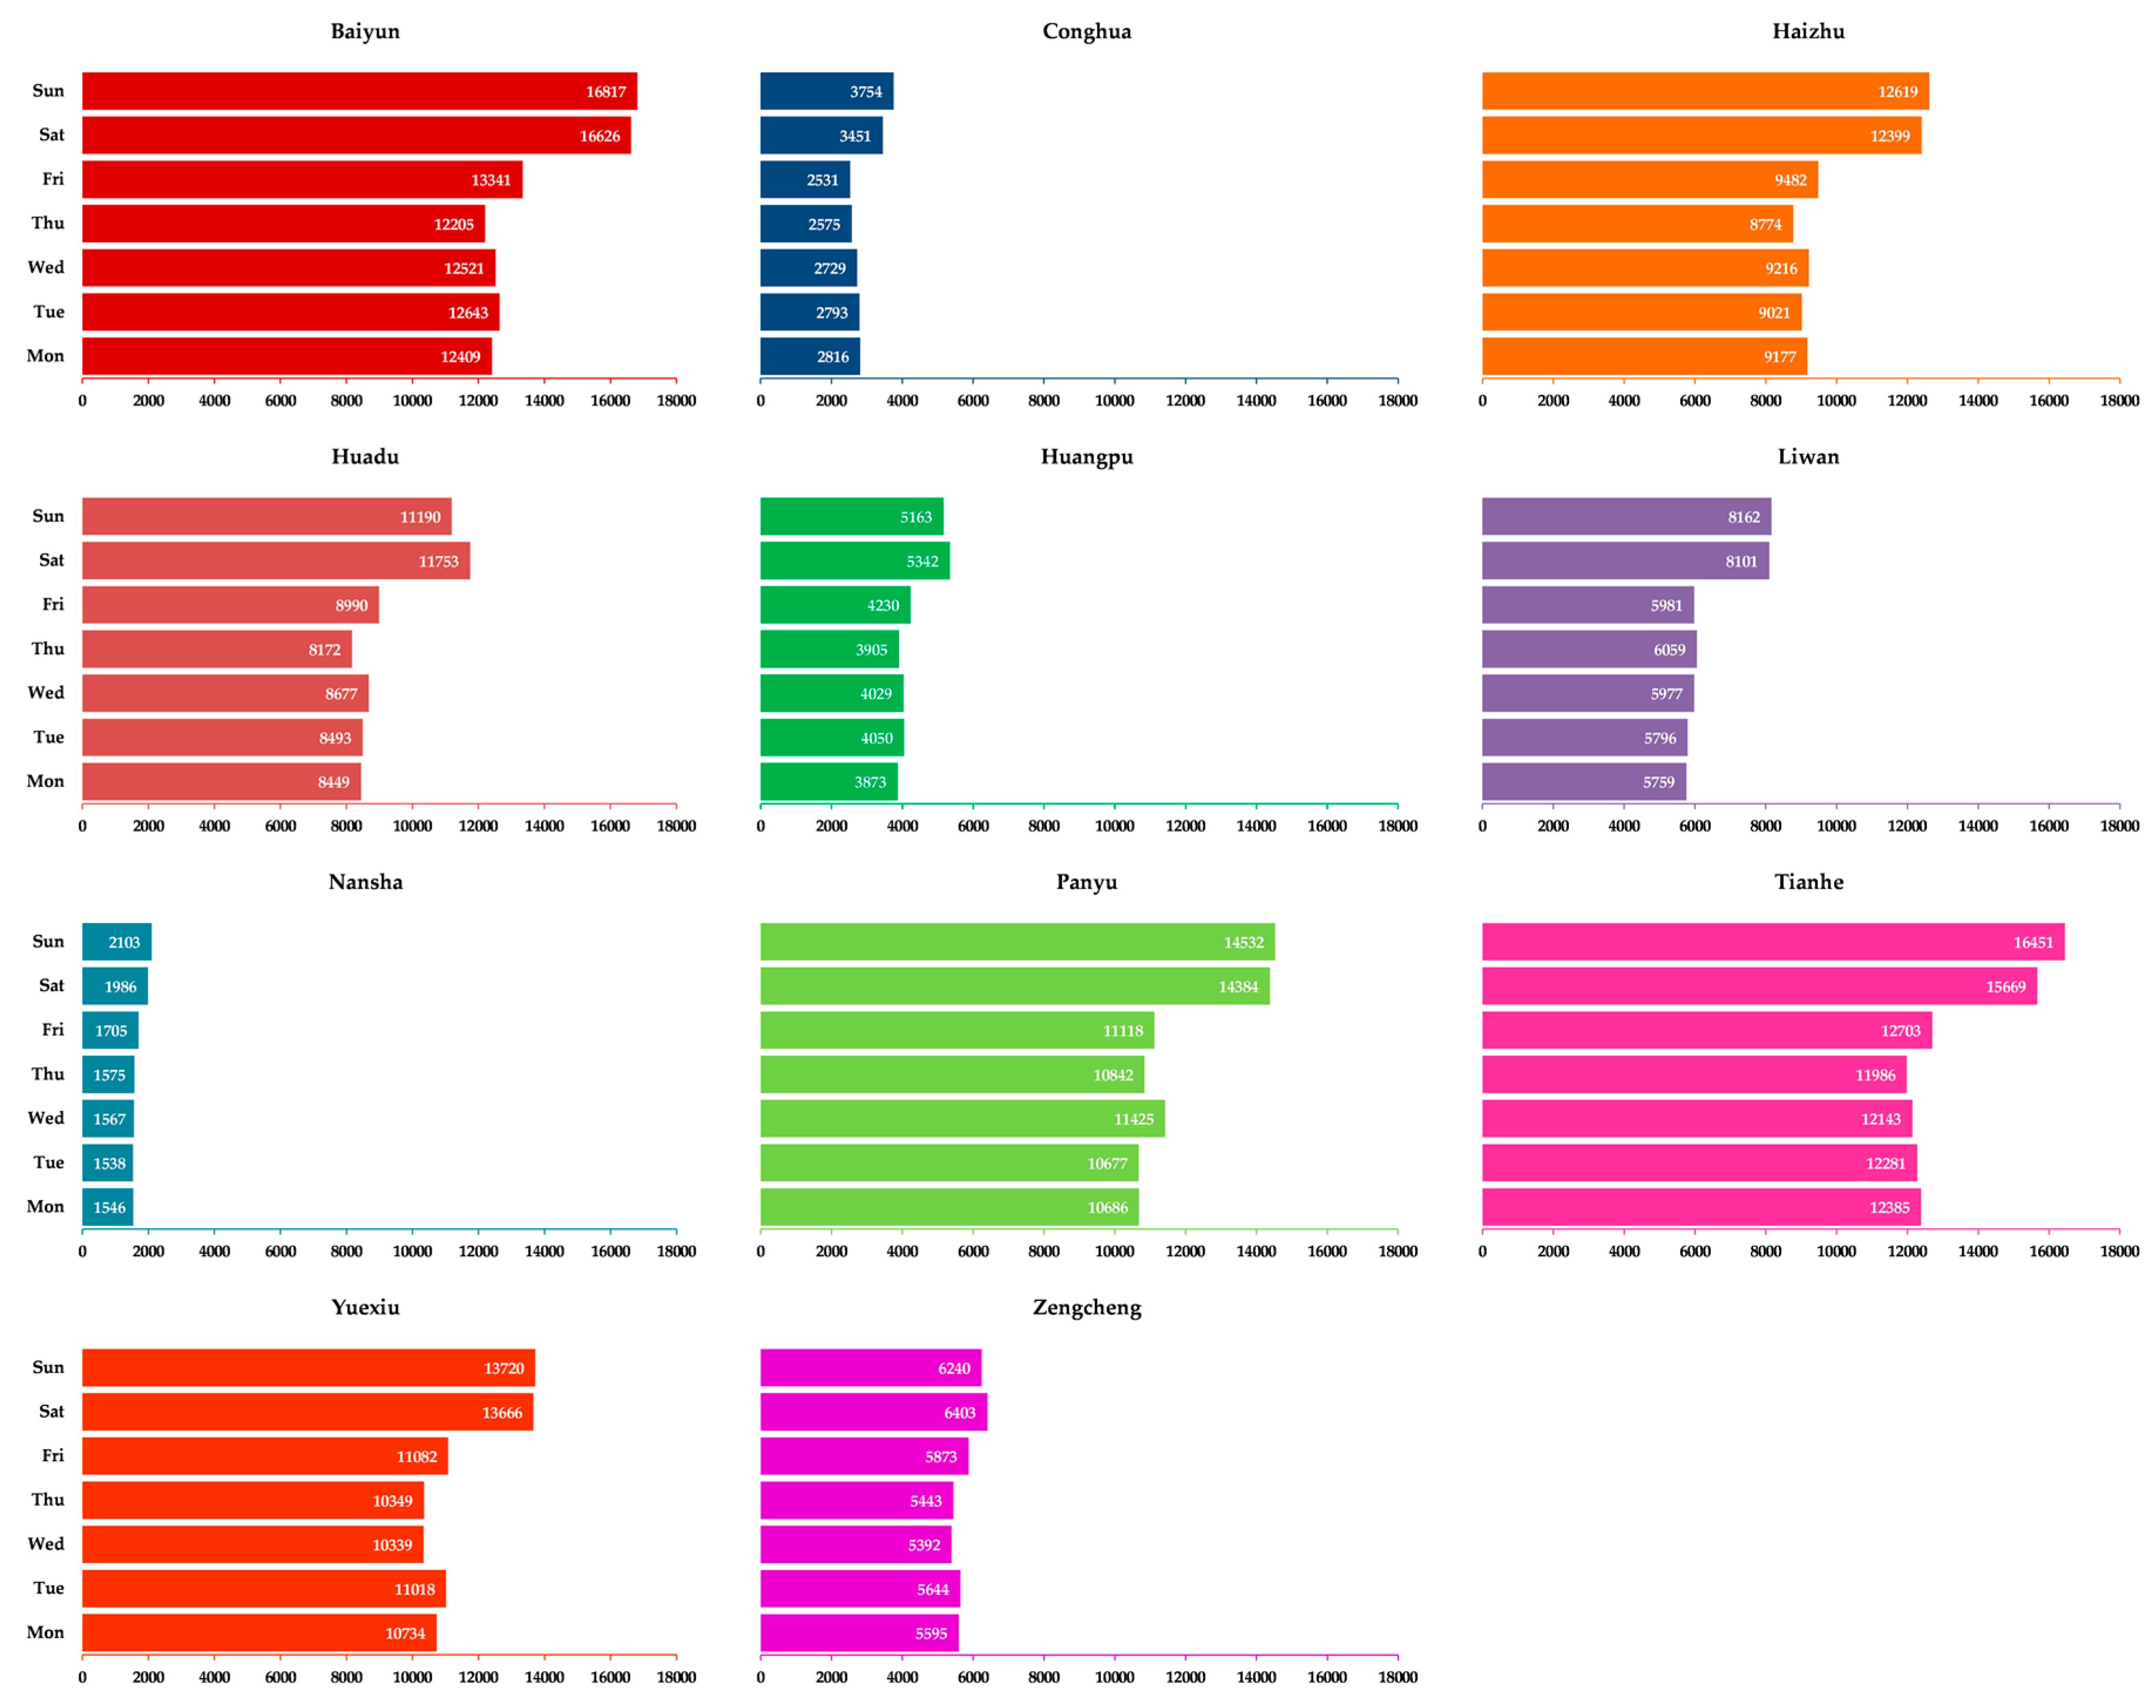
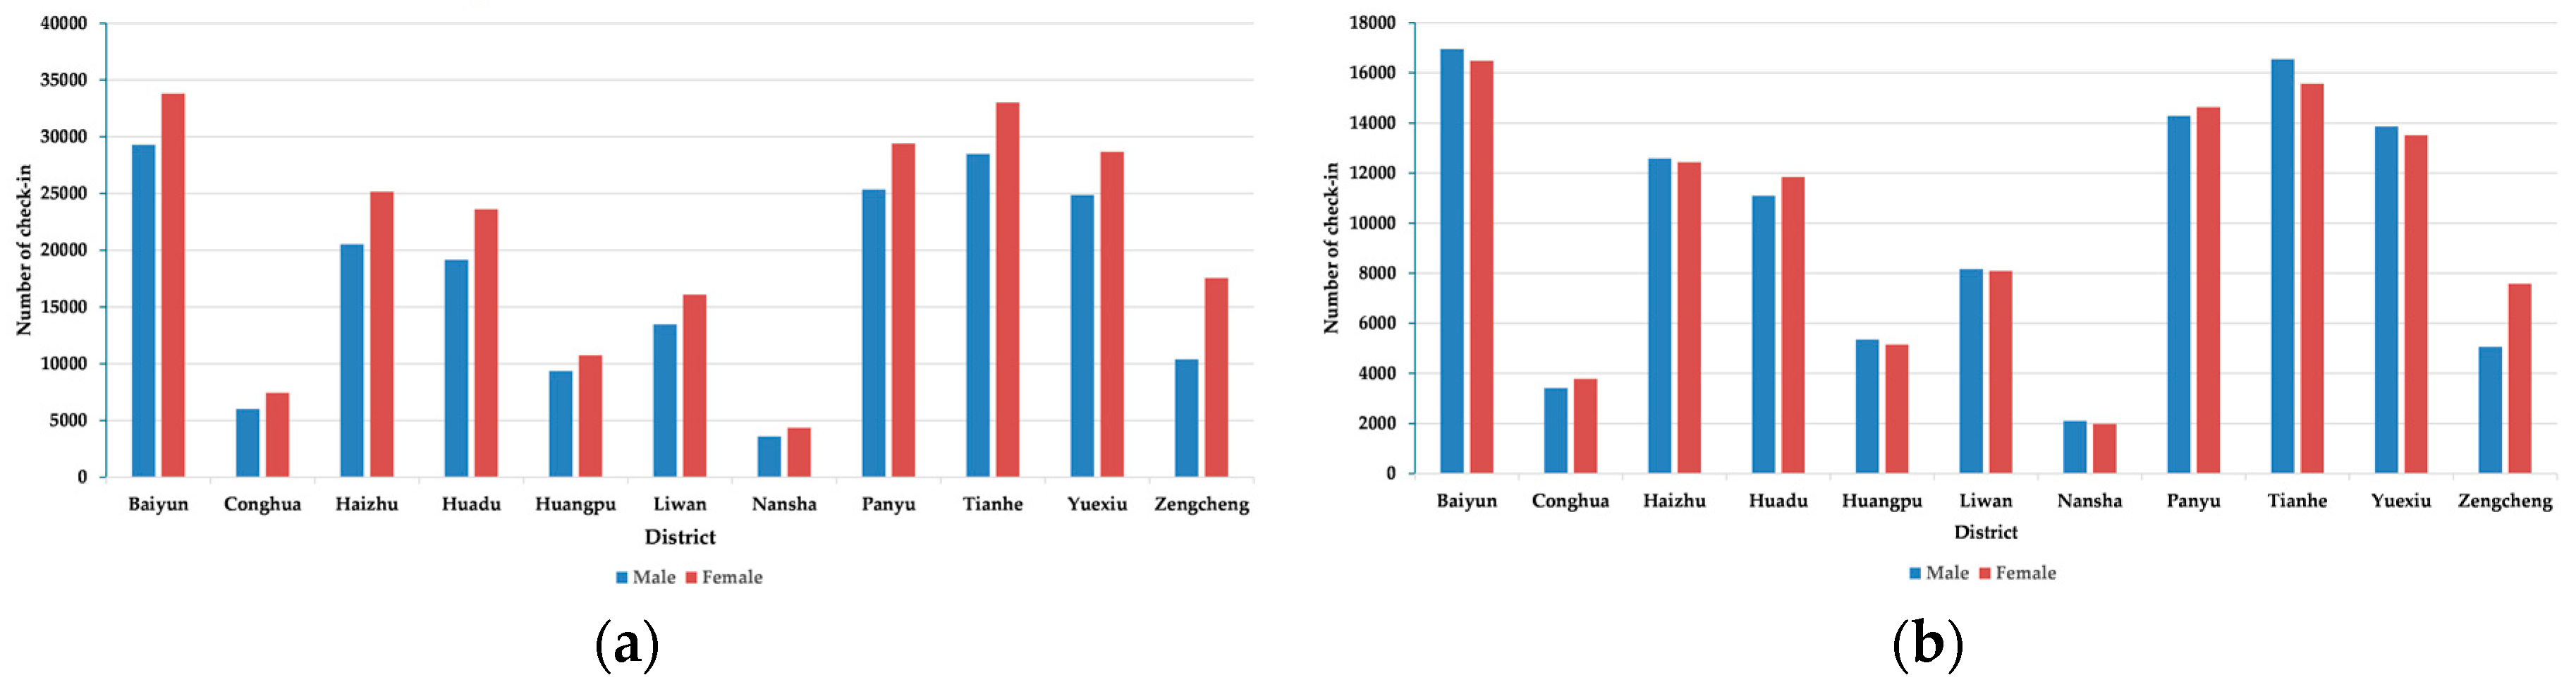
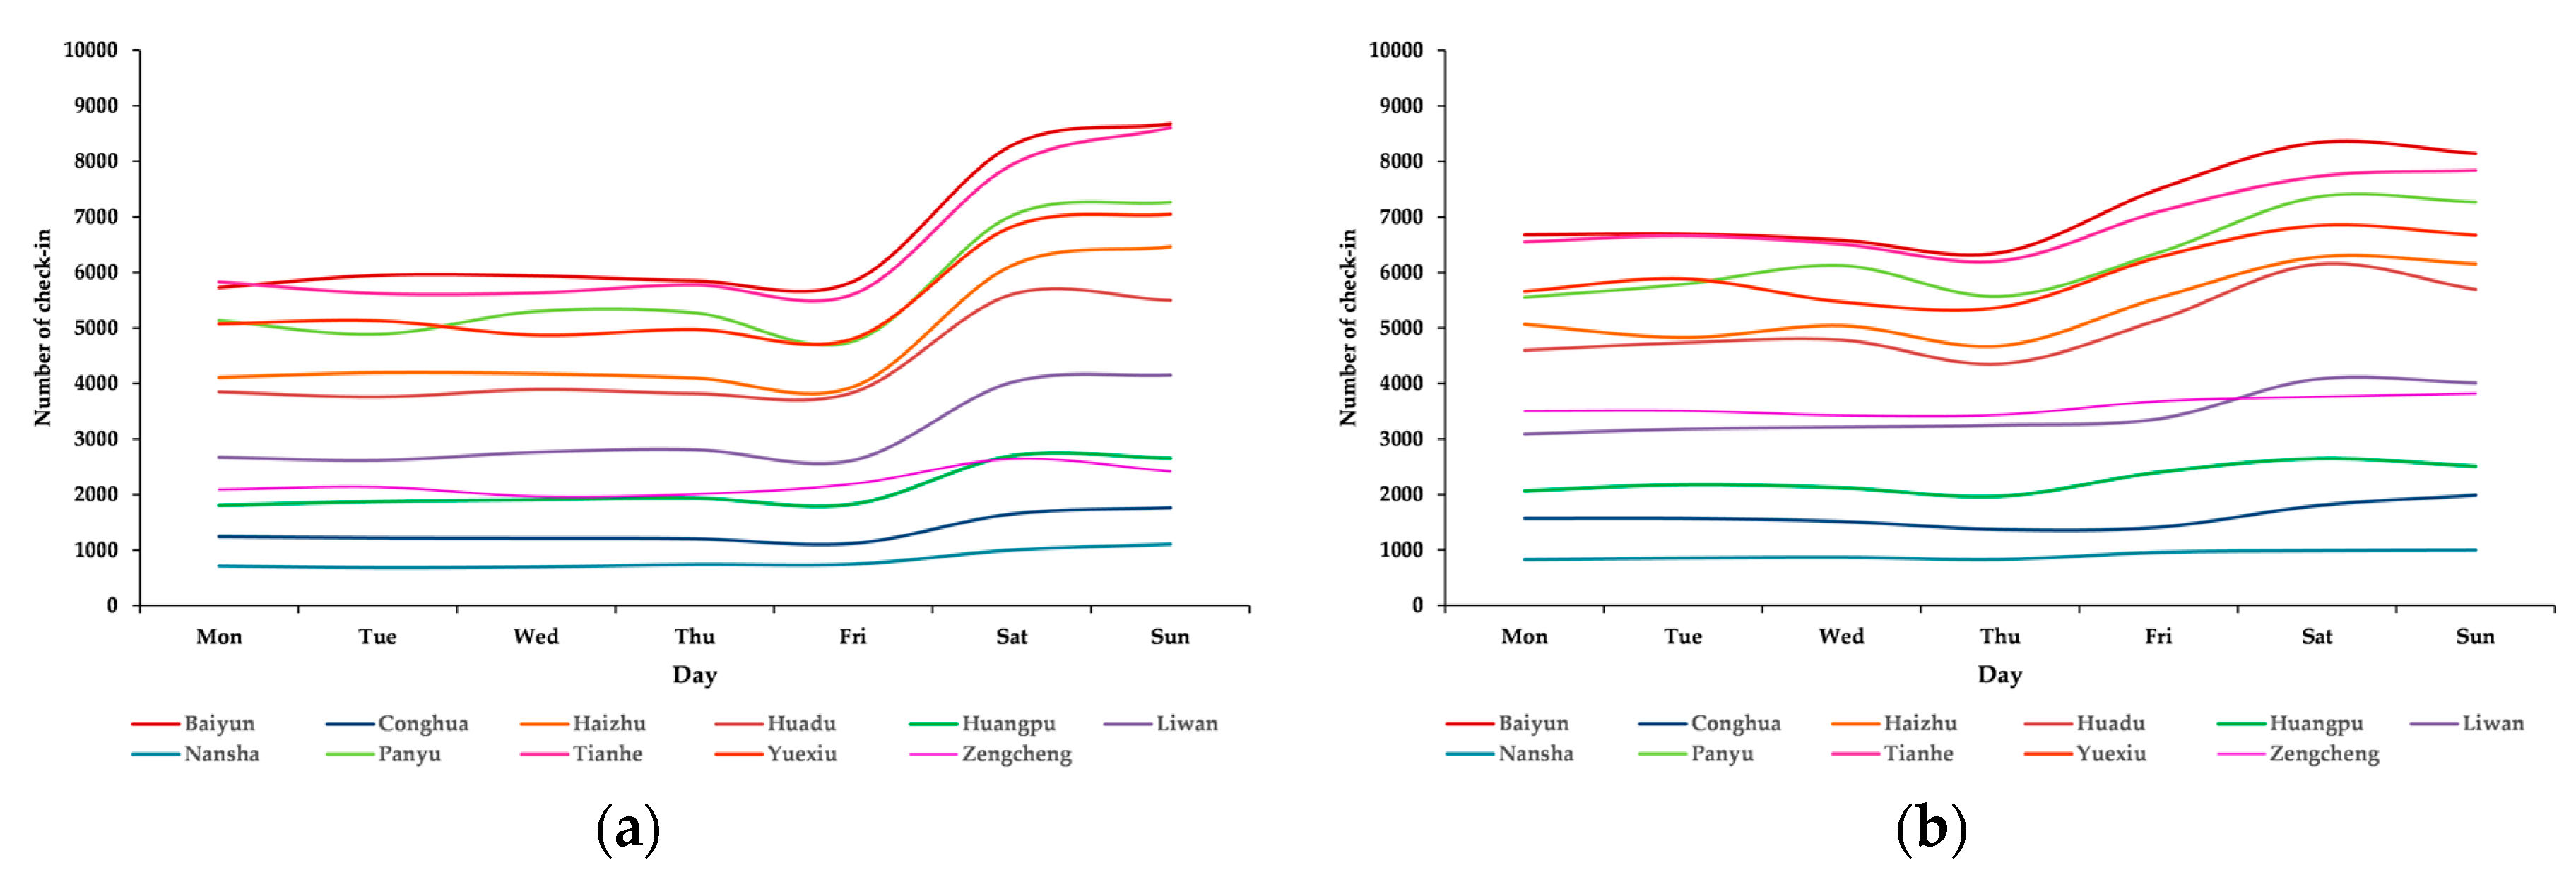
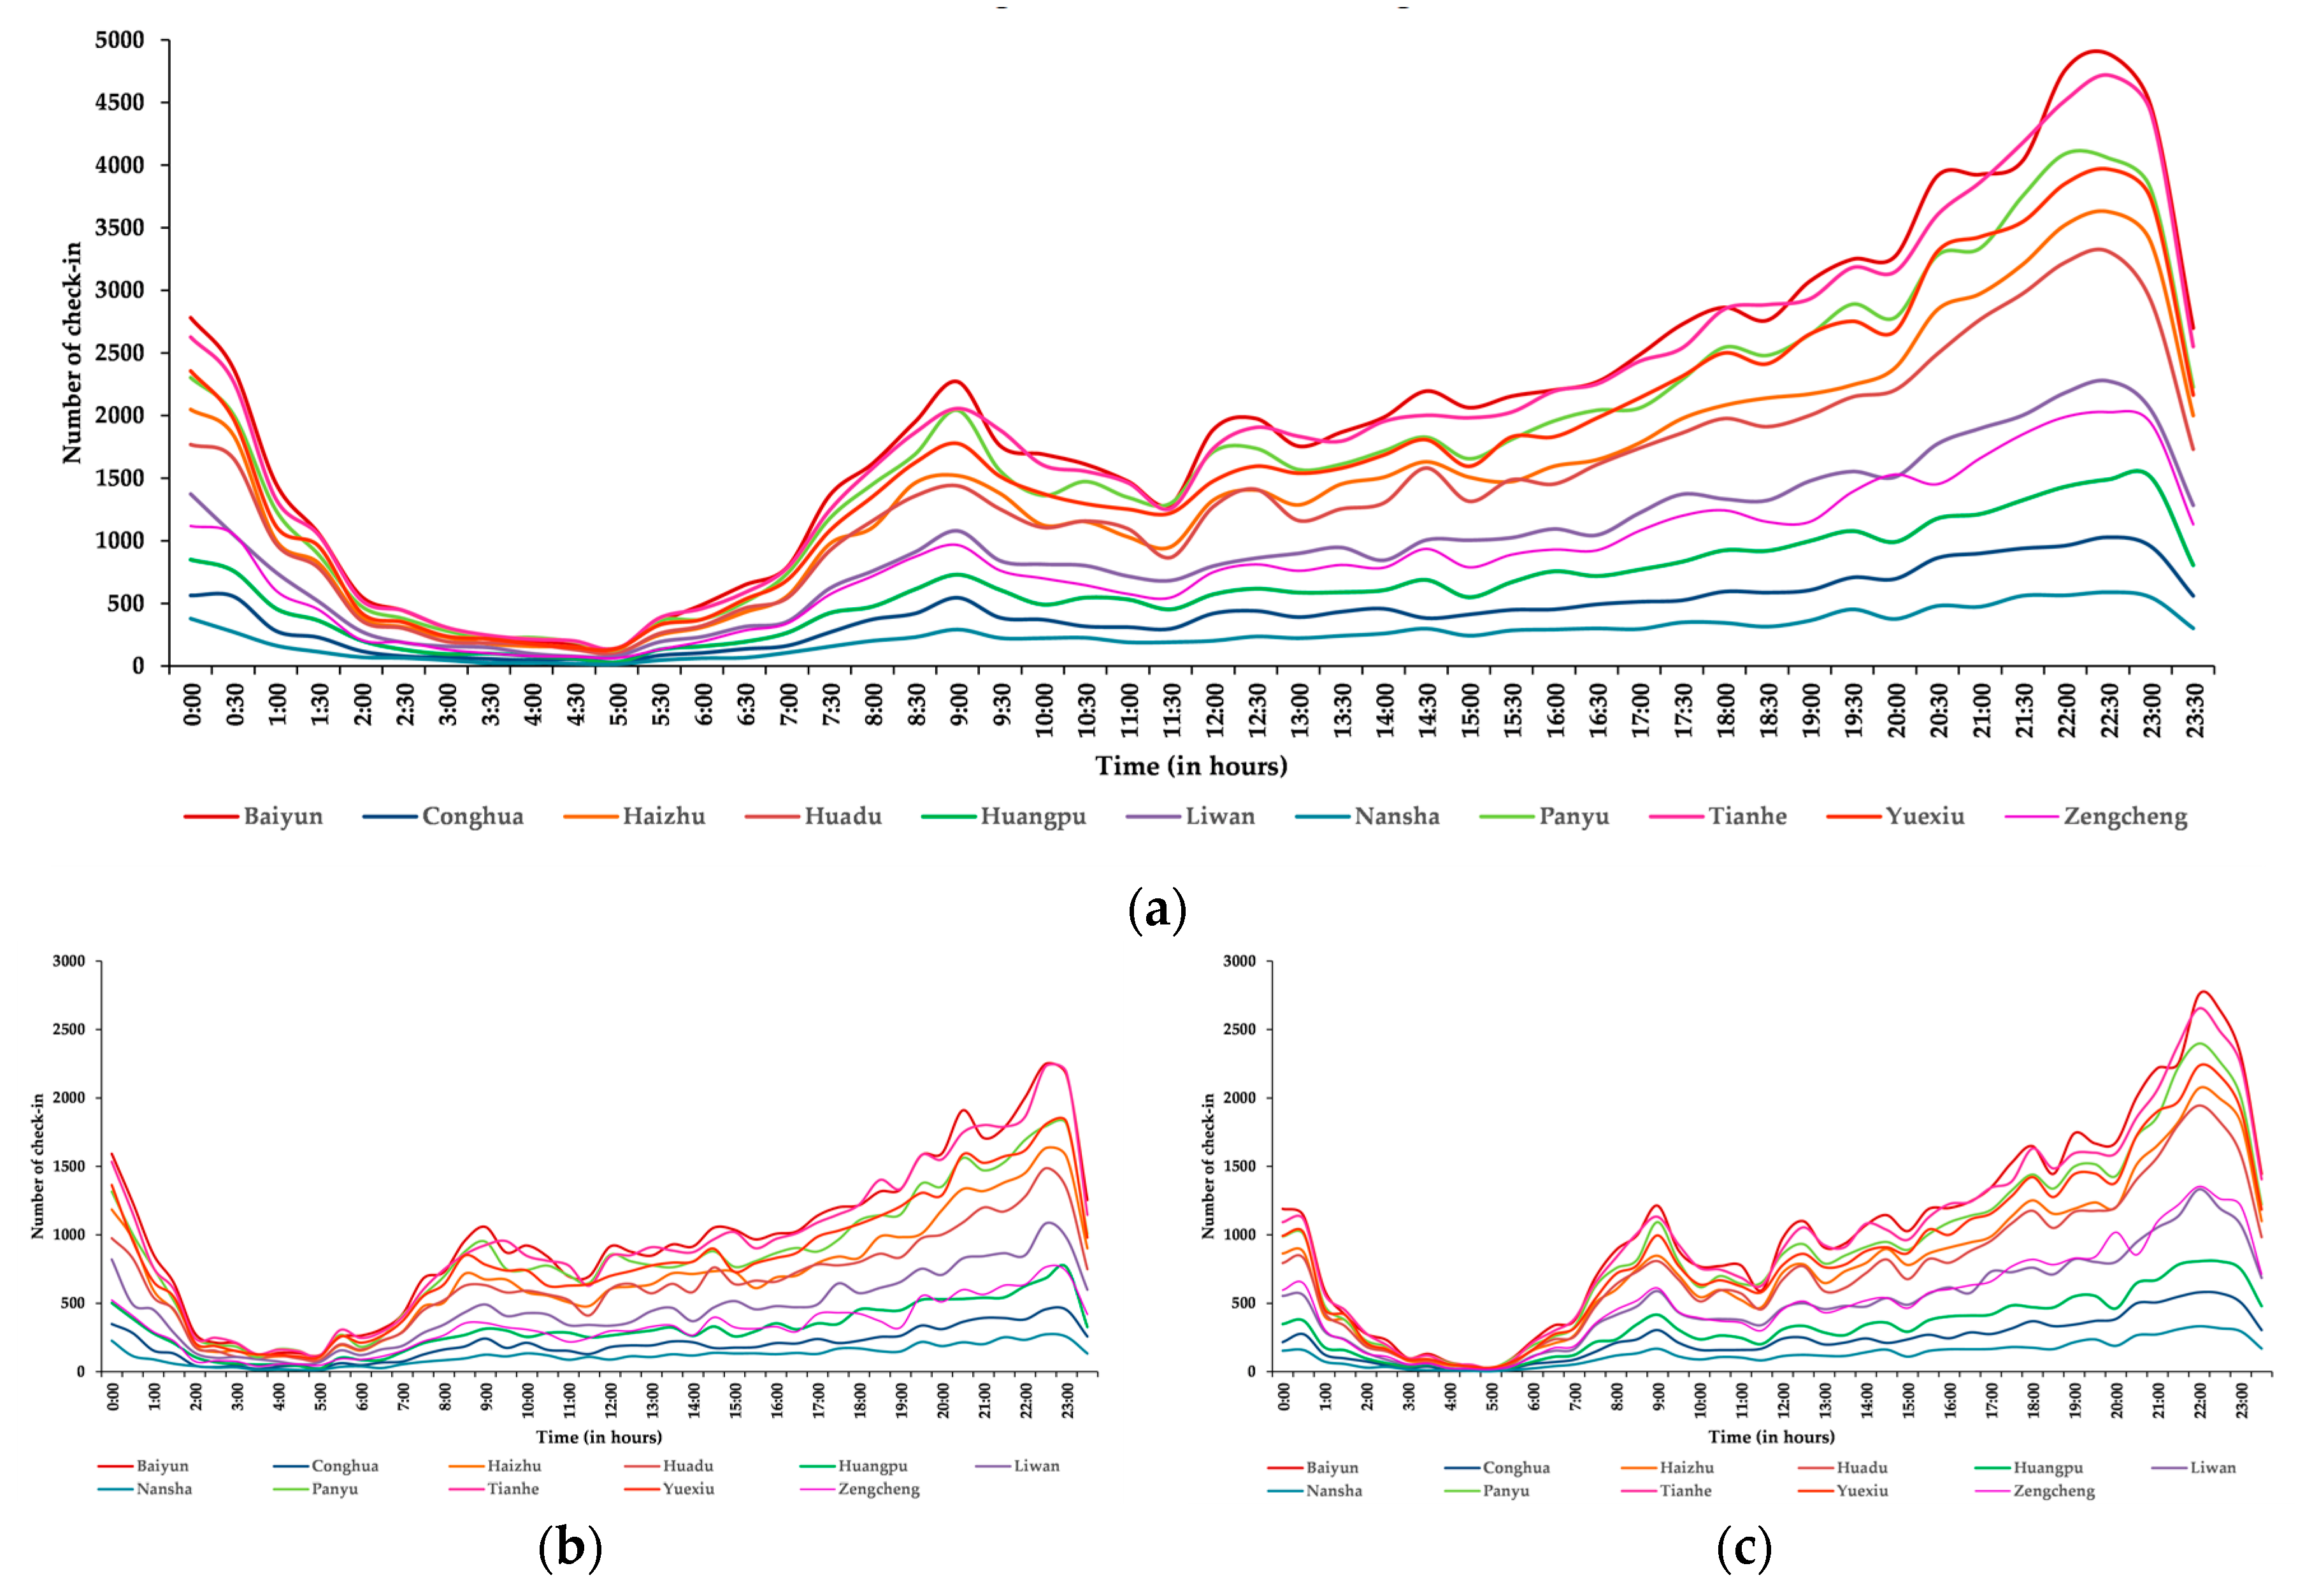
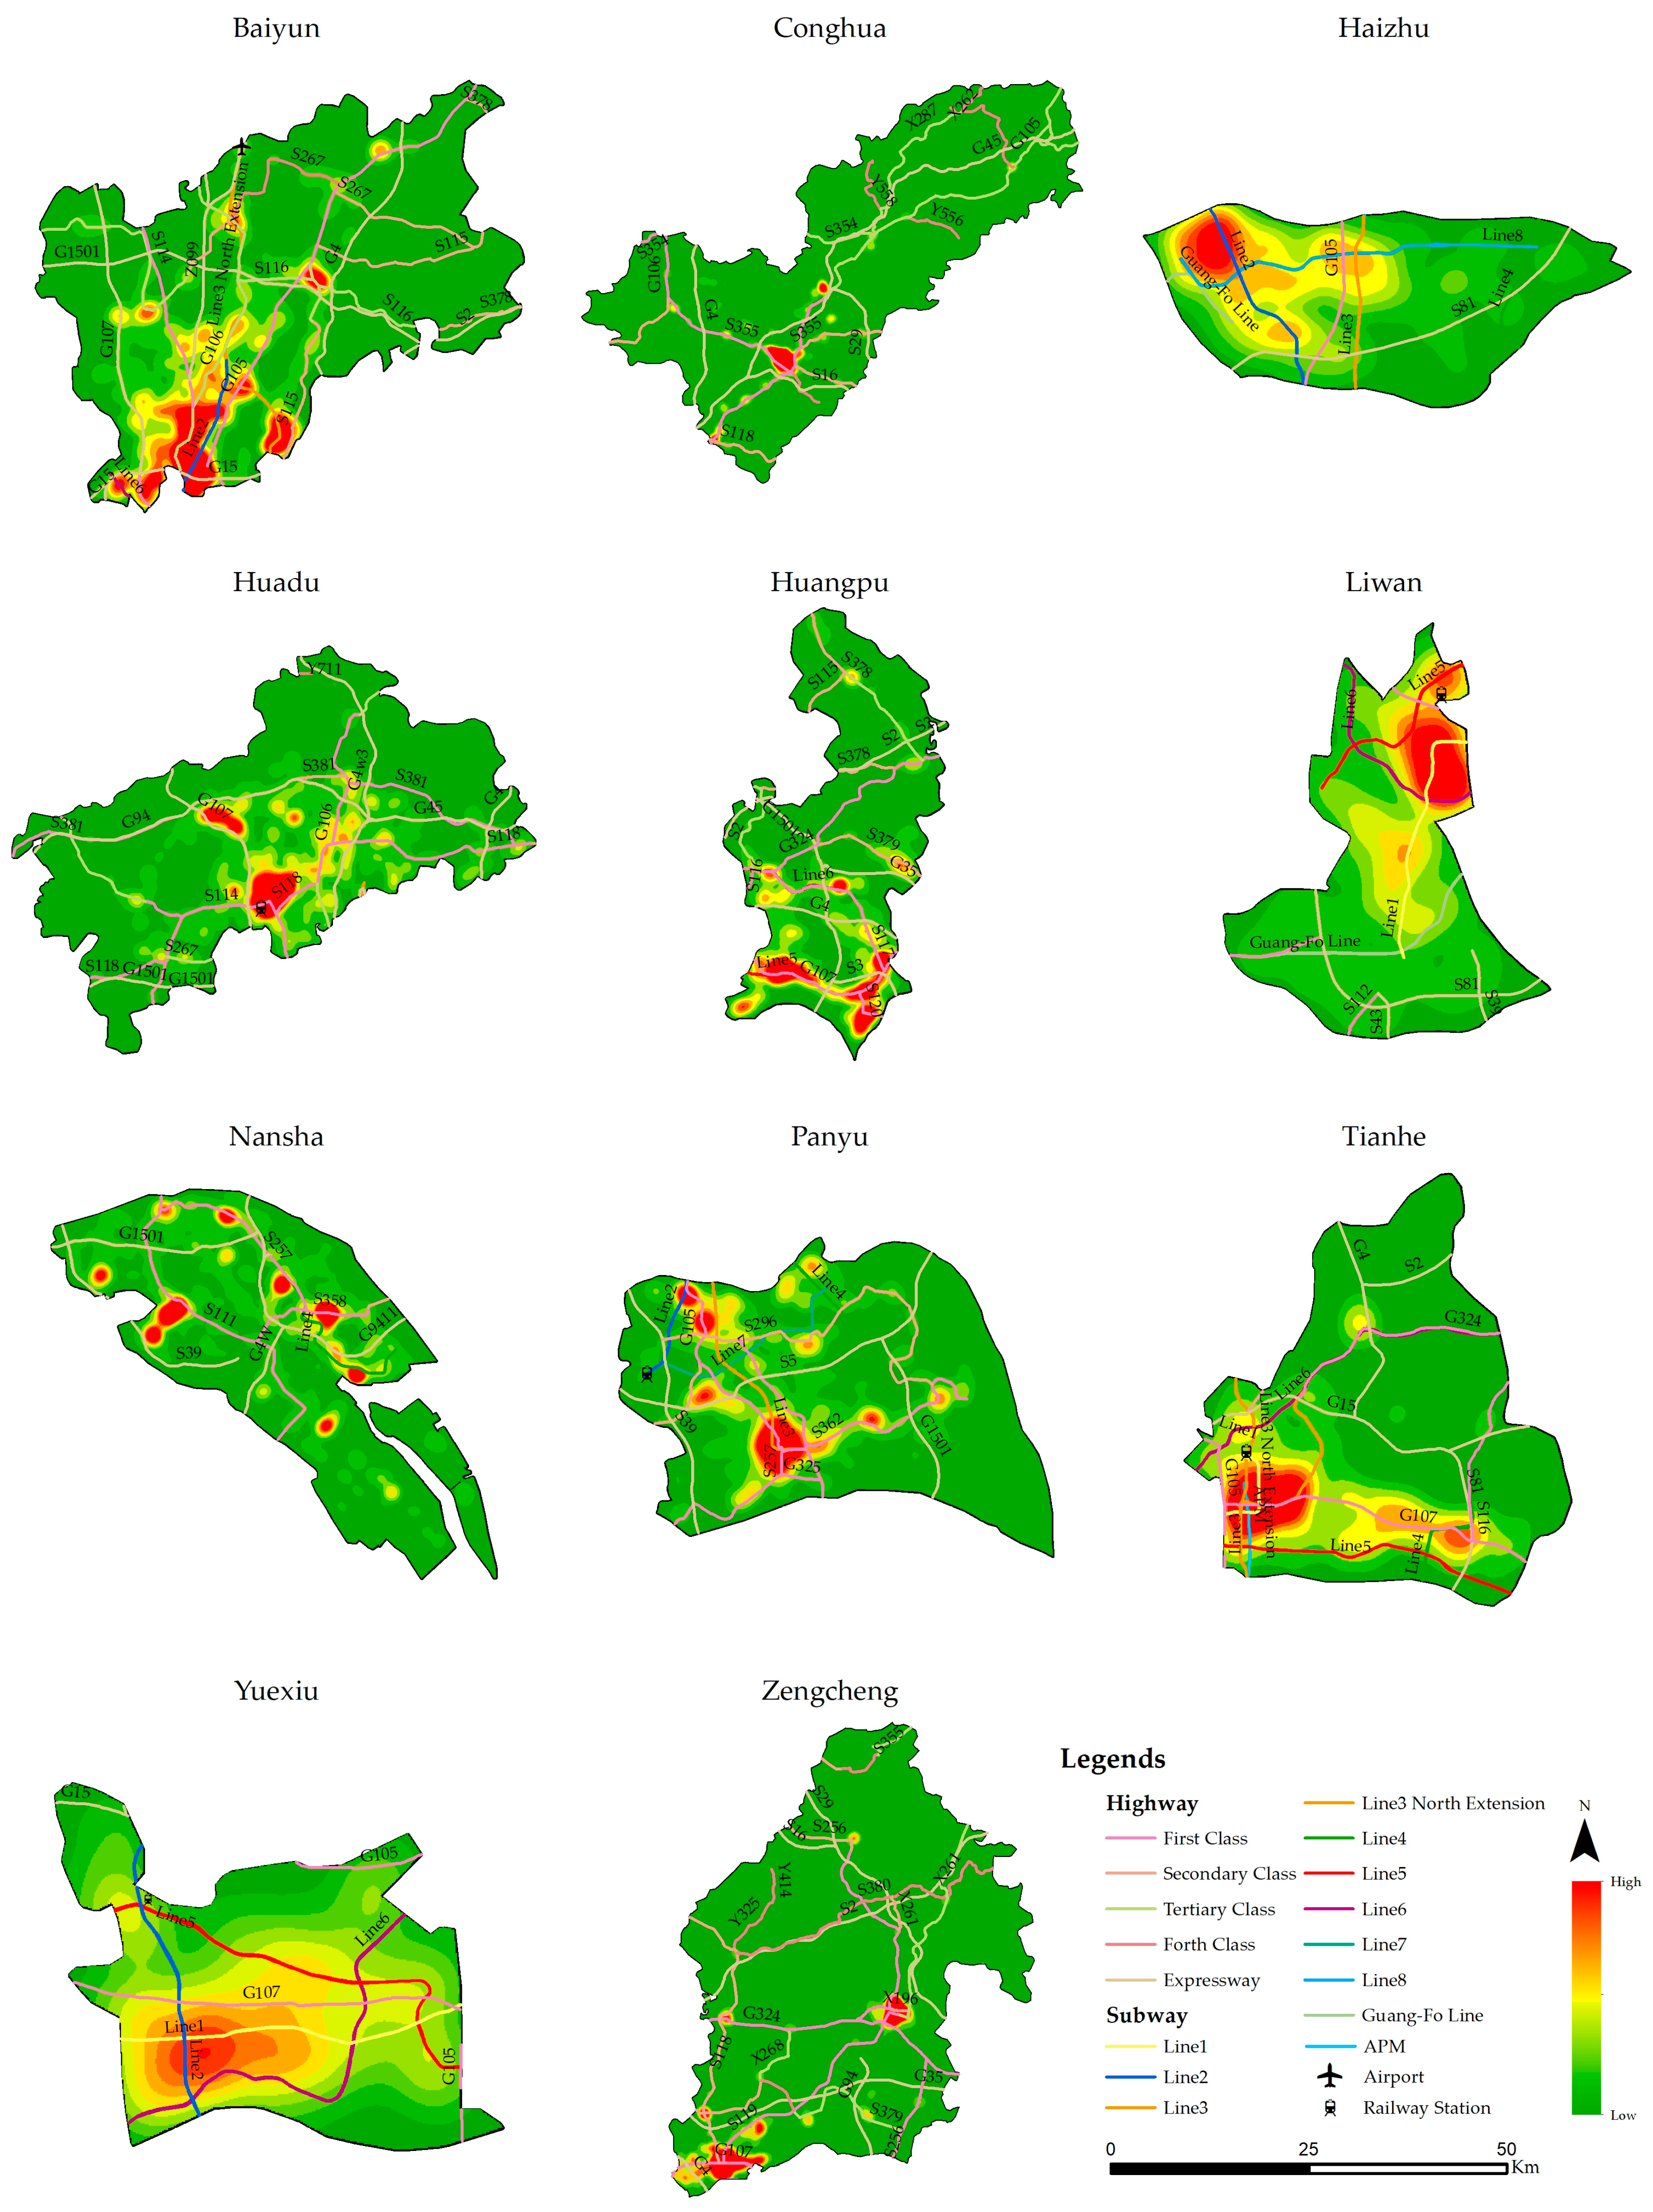
The current study utilized density maps and trends to present the spatiotemporal investigation of gender-based human check-in behavior to explore hourly and daily check-in patterns, as well as patterns during weekdays and weekends. Results show that, in almost all districts of Guangzhou, females are more inclined toward using Weibo as compared to males during the weekdays. However, during the weekend, almost the same check-in trend is observed by both males and females. Furthermore, the center of the city has a comparatively high density of check-in near the subway and highways.
With a supplement to the prior research on check-in behavior, we also consider LBSN data as a supplement rather than a substitute for traditional data sources to observe (i.e., human mobility, activity analysis, and defining city boundary and social issues in a city). Additionally, compared to other traditional data sources, the LBSN dataset has some advantages (low cost and high spatial precision) and disadvantages (i.e., the gender prejudice, a low frequency in sampling, and location type prejudice).
Lastly, based on the results, we consider the LBSN dataset as a novel source of big data with the potential to offer a new viewpoint as an add-on to observe the gender-based check-in density in space and time. The information from KDE can facilitate studying the dynamic evolution of check-in across both space and time. Additionally, the KDE results verify that the check-in behavior varies at fine temporal (i.e., a day) and spatial (i.e., a city) scales. The results also show that the check-in data can reflect more refined phenomena and results other than traditional data with fine time and spatial granularity. Despite the difference of methodologies being used with different types of LBSN and datasets, both early studies [16,18] and the current study based on gender-based check-in behavior on LBSN, draw a similar conclusion that the female users are more likely to use LBSN than male users. Additionally, it can be helpful for policymakers to define policies regarding the supply of services (i.e., transport, health, and entertainment) by highlighting the check-in hotspots in the city. The SDEs indicate the difference of trajectories by males and females in the district of Guangzhou and the trajectory of the SDEs center by males and females in districts of Guangzhou represents the differences in check-in behavior patterns in those districts.
In the future, we will tend to study the use of LBSN data to explore the activities associated with the check-ins and study the motivation toward those activities. Moreover, we will also tend to examine the aspects that bring change in the check-in behavior toward those activities in space and time.

Author Contributions

R.M. and Y.Z. conceived and designed the research; R.M. and F.L. performed the simulations; R.M. and Y.Z. wrote the article; R.M. and Y.Z. proof read the article for language editing. All authors read and approved the final manuscript.

Funding

This work is supported by the National Natural Science Foundation of China (No. 41871292), the Science and Technology Program of Guangzhou, China (No: 201803030034, 201802030008), and the Project of the Science and Technology Foundation of Guangdong Province (No. 2018B020207002).

Conflicts of Interest

The authors declare no conflicts of interest.

References

  1. Zeng, D.; Chen, H.; Lusch, R.; Li, S.-H. Social media analytics and intelligence. IEEE Intell. Syst. 2010, 25, 13–16. [Google Scholar] [CrossRef]
  2. Moser, C.A.; Kalton, G. Survey Methods in Social Investigation; Routledge: London, UK, 2017. [Google Scholar]
  3. Edwards, A.; Housley, W.; Williams, M.; Sloan, L.; Williams, M. Digital social research, social media and the sociological imagination: Surrogacy, augmentation and re-orientation. Int. J. Soc. Res. Methodol. 2013, 16, 245–260. [Google Scholar] [CrossRef]
  4. Schatzki, T.R.; Schatzki, T.R. Social Practices: A Wittgensteinian Approach to Human Activity and the Social; Cambridge University Press: Cambridge, UK, 1996. [Google Scholar]
  5. Eagle, N.; Pentland, A. Reality mining: Sensing complex social systems. Pers. Ubiquitous Comput. 2006, 10, 255–268. [Google Scholar] [CrossRef]
  6. Hasan, S.; Ukkusuri, S.V.; Zhan, X. Understanding social influence in activity location choice and lifestyle patterns using geolocation data from social media. Front. ICT 2016, 3, 10. [Google Scholar] [CrossRef]
  7. Lenhart, A.; Purcell, K.; Smith, A.; Zickuhr, K. Social Media & Mobile Internet Use among Teens and Young Adults. Millennials; Pew Internet & American Life Project: Washington, DC, USA, 2010. [Google Scholar]
  8. Kheiri, A.; Karimipour, F.; Forghani, M. Intra-urban movement flow estimation using location based social networking data. Int. Arch. Photogramm. Remote Sens. Spat. Inf. Sci. 2015, 40, 781. [Google Scholar] [CrossRef]
  9. Smith, A. Why Americans Use Social Media; Pew Internet & American Life Project: Washington, DC, USA, 2011; pp. 1–11. [Google Scholar]
  10. Zhang, L.; Pentina, I. Motivations and usage patterns of weibo. Cyberpsychol. Behav. Soc. Netw. 2012, 15, 312–317. [Google Scholar] [CrossRef]
  11. Li-Barber, K.T. Self-disclosure and student satisfaction with facebook. Comput. Hum. Behav. 2012, 28, 624–630. [Google Scholar]
  12. Pentina, I.; Basmanova, O.; Zhang, L. A cross-national study of twitter users’ motivations and continuance intentions. J. Mark. Commun. 2016, 22, 36–55. [Google Scholar] [CrossRef]
  13. Shao, W.; Ross, M.; Grace, D. Developing a motivation-based segmentation typology of facebook users. Mark. Intell. Plan. 2015, 33, 1071–1086. [Google Scholar] [CrossRef]
  14. Kim, H.-S. A study on use motivation of sns and communication behavior. J. Korea Acad. -Ind. Coop. Soc. 2012, 13, 548–553. [Google Scholar]
  15. Muscanell, N.L.; Guadagno, R.E. Make new friends or keep the old: Gender and personality differences in social networking use. Comput. Hum. Behav. 2012, 28, 107–112. [Google Scholar] [CrossRef]
  16. Hwang, H.S.; Choi, E.K. Exploring gender differences in motivations for using sina weibo. Ksii Trans. Internet Inf. Syst. (TIIS) 2016, 10, 1429–1441. [Google Scholar]
  17. Rossi, L.; Musolesi, M. It’s the way you check-in. In Proceedings of the Second Edition of the ACM Conference on Online Social Networks, COSN’14, Dublin, Ireland, 1–2 October 2014; ACM: New York, NY, USA, 2014; pp. 215–226. [Google Scholar]
  18. Chun, M.-h. The affective/cognitive involvement and satisfaction according to the usage motivations of social network services. Manag. Inf. Syst. Rev. 2012, 31. [Google Scholar] [CrossRef]
  19. Traynor, D.; Curran, K. Location-based social networks. In Mobile Services Industries, Technologies, and Applications in the Global Economy; IGI Global: Hershey, PA, USA, 2013; pp. 243–253. [Google Scholar]
  20. Symeonidis, P.; Ntempos, D.; Manolopoulos, Y. Location-based social networks. In Recommender Systems for Location-Based Social Networks; Springer: Berlin, Germany, 2014; pp. 35–48. [Google Scholar]
  21. Zheng, Y. Location-based social networks: Users. In Computing with Spatial Trajectories; Zheng, Y., Zhou, X., Eds.; Springer: New York, NY, USA, 2011; pp. 243–276. [Google Scholar]
  22. Valverde-Rebaza, J.C.; Roche, M.; Poncelet, P.; de Andrade Lopes, A. The role of location and social strength for friendship prediction in location-based social networks. Inf. Process. Manag. 2018, 54, 475–489. [Google Scholar] [CrossRef] [Green Version]
  23. Reddy, R.; Kim, R.S.-H. Social Discovery of User Activity for Media Content. Available online: https://patents.google.com/patent/US8661550B2/en (accessed on 1 January 2019).
  24. Lu, E.H.-C.; Chen, C.-Y.; Tseng, V.S. Personalized trip recommendation with multiple constraints by mining user check-in behaviors. In Proceedings of the 20th International Conference on Advances in Geographic Information Systems, Redondo Beach, CA, USA, 6–9 November 2012; ACM: New York, NY, USA, 2012; pp. 209–218. [Google Scholar]
  25. Weibo. Available online: http://www.weibo.com (accessed on 2 April 2019).
  26. Sina Weibo q4 2017 Financial Report. Available online: http://ir.weibo.com/financial-information/quarterly-results (accessed on 7 January 2019).
  27. The 41st Statistical Report on Internet Development in China. Available online: https://cnnic.com.cn/IDR/ReportDownloads/201807/P020180711391069195909.pdf (accessed on 7 January 2019).
  28. Liu, Y.; Zhang, F.; Wu, F.; Liu, Y.; Li, Z. The subjective wellbeing of migrants in guangzhou, china: The impacts of the social and physical environment. Cities 2017, 60, 333–342. [Google Scholar] [CrossRef]
  29. De Mauro, A.; Greco, M.; Grimaldi, M. A formal definition of big data based on its essential features. Libr. Rev. 2016, 65, 122–135. [Google Scholar] [CrossRef]
  30. Gandomi, A.; Haider, M. Beyond the hype: Big data concepts, methods, and analytics. Int. J. Inf. Manag. 2015, 35, 137–144. [Google Scholar] [CrossRef] [Green Version]
  31. Tsou, M.-H. Research challenges and opportunities in mapping social media and big data. Cartogr. Geogr. Inf. Sci. 2015, 42, 70–74. [Google Scholar] [CrossRef]
  32. Sabrina. Sina Weibo User Demographics Analysis in 2013. Available online: https://www.chinainternetwatch.com/5568/what-weibo-can-tell-you-about-chinese-netizens-part-1/ (accessed on 15 March 2019).
  33. Daily, C. Special: Micro Blog’s Macro Impact. China Daily, 2 March 2011. [Google Scholar]
  34. Statistical Report on Internet Development in China. Available online: https://cnnic.com.cn/IDR/ReportDownloads/201411/P020141102574314897888.pdf (accessed on 17 March 2019).
  35. Deng, S.; Yang, L.; Zhang, Y. Social q&as or library virtual reference service: What is behind the choices of chinese information seekers? Libri 2014, 64, 327–340. [Google Scholar]
  36. Miller, H.J.; Goodchild, M.F. Data-driven geography. GeoJournal 2015, 80, 449–461. [Google Scholar] [CrossRef]
  37. Luo, F.; Cao, G.; Mulligan, K.; Li, X. Explore spatiotemporal and demographic characteristics of human mobility via twitter: A case study of chicago. Appl. Geogr. 2016, 70, 11–25. [Google Scholar] [CrossRef]
  38. Hasan, S.; Zhan, X.; Ukkusuri, S.V. Understanding urban human activity and mobility patterns using large-scale location-based data from online social media. In Proceedings of the 2nd ACM SIGKDD International Workshop on urban Computing, Chicago, IL, USA, 11 August 2013; ACM: New York, NY, USA, 2013; p. 6. [Google Scholar]
  39. Bao, M.; Yang, N.; Zhou, L.; Lao, Y.; Zhang, Y.; Tian, Y. The spatial analysis of weibo check-in data: The case study of wuhan. In Geo-Informatics in Resource Management and Sustainable Ecosystem; Springer: New York, NY, USA, 2013; pp. 480–491. [Google Scholar]
  40. Cao, J.; Hu, Q.; Li, Q. A study of users’ movements based on check-in data in location-based social networks. In Proceedings of the International Symposium on Web and Wireless Geographical Information Systems, Seoul, Korea, 29–30 May 2014; Springer: New York, NY, USA, 2014; pp. 54–66. [Google Scholar]
  41. Feng, Y.; Yu, Z.; Lu, X.; Tian, J. Understanding human dynamics of check-in behavior in lbsns. In Proceedings of the 2013 IEEE International Conference on Green Computing and Communications and IEEE Internet of Things and IEEE Cyber, Physical and Social Computing, Beijing, China, 20–23 August 2013; IEEE: New York, NY, USA, 2013; pp. 923–930. [Google Scholar]
  42. Preoţiuc-Pietro, D.; Cohn, T. Mining user behaviours: A study of check-in patterns in location based social networks. In Proceedings of the 5th Annual ACM Web Science Conference, Paris, France, 2–4 May 2013; ACM: New York, NY, USA, 2013; pp. 306–315. [Google Scholar]
  43. Sina Corporation. Available online: http://www.sina.com.cn/ (accessed on 2 April 2019).
  44. Charalabidis, Y.; Loukis, E. Participative public policy making through multiple social media platforms utilization. Int. J. Electron. Gov. Res. (IJEGR) 2012, 8, 78–97. [Google Scholar] [CrossRef]
  45. Rost, M.; Barkhuus, L.; Cramer, H.; Brown, B. Representation and communication: Challenges in interpreting large social media datasets. In Proceedings of the 2013 Conference on Computer Supported Cooperative Work, San Antonio, TX, USA, 23–27 February 2013; ACM: New York, NY, USA, 2013; pp. 357–362. [Google Scholar]
  46. He, W.; Wang, F.-K.; Akula, V. Managing extracted knowledge from big social media data for business decision making. J. Knowl. Manag. 2017, 21, 275–294. [Google Scholar] [CrossRef]
  47. Afzalan, N.; Evans-Cowley, J. Planning and social media: Facebook for planning at the neighbourhood scale. Plan. Pract. Res. 2015, 30, 270–285. [Google Scholar] [CrossRef]
  48. Gao, X.; Yu, W.; Rong, Y.; Zhang, S. Ontology-based social media analysis for urban planning. In Proceedings of the 2017 IEEE 41st Annual Computer Software and Applications Conference (COMPSAC), Turin, Italy, 4–8 July 2017; IEEE: New York, NY, USA, 2017; pp. 888–896. [Google Scholar]
  49. Shelton, T.; Poorthuis, A.; Zook, M. Social media and the city: Rethinking urban socio-spatial inequality using user-generated geographic information. Landsc. Urban Plan. 2015, 142, 198–211. [Google Scholar] [CrossRef]
  50. Reed, P.J.; Khan, M.R.; Blumenstock, J. Observing gender dynamics and disparities with mobile phone metadata. In Proceedings of the Eighth International Conference on Information and Communication Technologies and Development, Ann Arbor, MI, USA, 3–6 June 2016; ACM: New York, NY, USA, 2016; p. 48. [Google Scholar]
  51. Abbasi, M.-A.; Chai, S.-K.; Liu, H.; Sagoo, K. Real-world behavior analysis through a social media lens. In Proceedings of the International Conference on Social Computing, Behavioral-Cultural Modeling, and Prediction, College Park, MD, USA, 3–5 April 2012; Springer: Berlin, Germany, 2012; pp. 18–26. [Google Scholar]
  52. Chen, H.; Beaudoin, C.E. An empirical study of a social network site: Exploring the effects of social capital and information disclosure. Telemat. Inform. 2016, 33, 432–435. [Google Scholar] [CrossRef]
  53. Alonso, G.; Casati, F.; Kuno, H.; Machiraju, V. Web services. In Web Services; Springer: New York, NY, USA, 2004; pp. 123–149. [Google Scholar]
  54. Bendler, J.; Brandt, T.; Neumann, D. Does social media reflect metropolitan attractiveness? Behavioral information from twitter activity in urban areas. In Analytics and Data Science; Springer: New York, NY, USA, 2018; pp. 119–142. [Google Scholar]
  55. Ellison, N.B.; Steinfield, C.; Lampe, C. The benefits of facebook “friends:” social capital and college students’ use of online social network sites. J. Comput. Mediat. Commun. 2007, 12, 1143–1168. [Google Scholar] [CrossRef]
  56. Boyd, D.M.; Ellison, N.B. Social network sites: Definition, history, and scholarship. J. Comput. Mediat. Commun. 2007, 13, 210–230. [Google Scholar] [CrossRef]
  57. Chen, S.; Shao, B.; Zhi, K. Predictors of chinese users’ location disclosure behavior: An empirical study on wechat. Information 2018, 9, 219. [Google Scholar] [CrossRef]
  58. Lacohée, H.; Wakeford, N.; Pearson, I. A social history of the mobile telephone with a view of its future. Bt Technol. J. 2003, 21, 203–211. [Google Scholar] [CrossRef]
  59. Bellavista, P.; Küpper, A.; Helal, S. Location-based services: Back to the future. IEEE Pervasive Comput. 2008, 7, 85–89. [Google Scholar] [CrossRef]
  60. Kwon, O.; Wen, Y. An empirical study of the factors affecting social network service use. Comput. Hum. Behav. 2010, 26, 254–263. [Google Scholar] [CrossRef]
  61. Erl, T.; Khattak, W.; Buhler, P. Big Data Fundamentals; Prentice Hall: Englewood Cliffs, NJ, USA, 2016. [Google Scholar]
  62. Vastardis, N.; Kun, Y. Mobile social networks: Architectures, social properties, and key research challenges. IEEE Commun. Surv. Tutor. 2013, 15, 1355–1371. [Google Scholar] [CrossRef]
  63. Li, N.; Chen, G. Analysis of a location-based social network. In Proceedings of the 2009 International Conference on Computational Science and Engineering, Vancouver, BC, Canada, 29–31 August 2009; IEEE: New York, NY, USA, 2009; pp. 263–270. [Google Scholar]
  64. Ahmed, A.M.; Tie, Q.; Feng, X.; Jedari, B.; Abolfazli, S. Event-based mobile social networks: Services, technologies, and applications. IEEE Access 2014, 2, 500–513. [Google Scholar] [CrossRef]
  65. Grabowicz, P.A.; Ramasco, J.J.; Goncalves, B.; Eguiluz, V.M. Entangling mobility and interactions in social media. PLoS ONE 2014, 9, e92196. [Google Scholar] [CrossRef]
  66. Andreassen, C.S. Online social network site addiction: A comprehensive review. Curr. Addict. Rep. 2015, 2, 175–184. [Google Scholar] [CrossRef]
  67. Borgatti, S.P.; Everett, M.G.; Johnson, J.C. Analyzing Social Networks; Sage: New York, NY, USA, 2018. [Google Scholar]
  68. Bao, J.; Zheng, Y.; Wilkie, D.; Mokbel, M. Recommendations in location-based social networks: A survey. GeoInformatica 2015, 19, 525–565. [Google Scholar] [CrossRef]
  69. Furini, M.; Tamanini, V. Location privacy and public metadata in social media platforms: Attitudes, behaviors and opinions. Multimed. Tools Appl. 2015, 74, 9795–9825. [Google Scholar] [CrossRef]
  70. Li, H.; Zhu, H.; Du, S.; Liang, X.; Shen, X.S. Privacy leakage of location sharing in mobile social networks: Attacks and defense. IEEE Trans. Dependable Secur. Comput. 2018, 15, 646–660. [Google Scholar] [CrossRef]
  71. Kumar, S.; Saravanakumar, K.; Deepa, K. On privacy and security in social media—A comprehensive study. Procedia Comput. Sci. 2016, 78, 114–119. [Google Scholar]
  72. Ruths, D.; Pfeffer, J. Social sciences. Social media for large studies of behavior. Science 2014, 346, 1063–1064. [Google Scholar] [CrossRef]
  73. Vicente, C.R.; Freni, D.; Bettini, C.; Jensen, C.S. Location-related privacy in geo-social networks. IEEE Internet Comput. 2011, 15, 20–27. [Google Scholar] [CrossRef]
  74. Li, J.; Yan, H.; Liu, Z.; Chen, X.; Huang, X.; Wong, D.S. Location-sharing systems with enhanced privacy in mobile online social networks. IEEE Syst. J. 2017, 11, 439–448. [Google Scholar] [CrossRef]
  75. Fuchs, C. Social Media: A Critical Introduction; Sage: New York, NY, USA, 2017. [Google Scholar]
  76. Benson, V.; Saridakis, G.; Tennakoon, H. Information disclosure of social media users: Does control over personal information, user awareness and security notices matter? Inf. Technol. People 2015, 28, 426–441. [Google Scholar] [CrossRef]
  77. Strater, K.; Richter, H. Examining privacy and disclosure in a social networking community. In Proceedings of the 3rd Symposium on Usable Privacy and Security, Pittsburgh, PA, USA, 18–20 July 2007; ACM: New York, NY, USA, 2007; pp. 157–158. [Google Scholar]
  78. Stefanone, M.A.; Huang, Y.C.; Lackaff, D. Negotiating social belonging: Online, offline, and in-between. In Proceedings of the 2011 44th Hawaii International Conference on System Sciences, Kauai, HI, USA, 4–7 January 2011; pp. 1–10. [Google Scholar]
  79. Resch, B.; Summa, A.; Sagl, G.; Zeile, P.; Exner, J.-P. Urban emotions—Geo-semantic emotion extraction from technical sensors, human sensors and crowdsourced data. In Progress in Location-Based Services 2014; Springer: New York, NY, USA, 2015; pp. 199–212. [Google Scholar]
  80. Varughese, B.M.; Joseph, M.S.; Thomas, P.E.; Sherly, K. Analyzing the behavior of youth to sociality using social media mining. In Proceedings of the 2017 International Conference on Intelligent Computing and Control Systems (ICICCS), Madurai, India, 15–16 June 2017; IEEE: New York, NY, USA, 2017; pp. 1231–1235. [Google Scholar]
  81. Yuan, Y.; Wang, X. Exploring the effectiveness of location-based social media in modeling user activity space: A case study of weibo. Trans. GIS 2018, 22, 930–957. [Google Scholar] [CrossRef]
  82. Shaw, S.L.; Sui, D. Giscience for human dynamics research in a changing world. Trans. GIS 2018, 22, 891–899. [Google Scholar] [CrossRef]
  83. Chan, H.K.; Lacka, E.; Yee, R.W.; Lim, M.K. The role of social media data in operations and production management. Int. J. Prod. Res. 2017, 55, 5027–5036. [Google Scholar] [CrossRef]
  84. Benevenuto, F.; Rodrigues, T.; Cha, M.; Almeida, V. Characterizing user behavior in online social networks. In Proceedings of the 9th ACM SIGCOMM Conference on Internet Measurement, Chicago, IL, USA, 4–6 November 2009; ACM: New York, NY, USA, 2009; pp. 49–62. [Google Scholar]
  85. Chang, J.; Sun, E. Location 3: How users share and respond to location-based data on social networking sites. In Proceedings of the Fifth International AAAI Conference on Weblogs and Social Media, Barcelona, Spain, 17–21 July 2011; AAAI Press: Menlo Park, CA, USA, 2011; pp. 74–80. [Google Scholar]
  86. Lei, C.; Zhang, A.; Qi, Q.; Su, H.; Wang, J. Spatial-temporal analysis of human dynamics on urban land use patterns using social media data by gender. ISPRS Int. J. Geo-Inf. 2018, 7, 358. [Google Scholar] [CrossRef]
  87. Hu, Q.; Zhang, Y. An effective selecting approach for social media big data analysis—Taking commercial hotspot exploration with weibo check-in data as an example. In Proceedings of the 2018 IEEE 3rd International Conference on Big Data Analysis (ICBDA), Shanghai, China, 9–12 March 2018; IEEE: New York, NY, USA, 2018; pp. 28–32. [Google Scholar]
  88. Saleem, M.A.; Kumar, R.; Calders, T.; Xie, X.; Pedersen, T.B. Location influence in location-based social networks. In Proceedings of the Tenth ACM International Conference on Web Search and Data Mining, Cambridge, UK, 6–10 February 2017; ACM: New York, NY, USA, 2017; pp. 621–630. [Google Scholar]
  89. Humphreys, L. Mobile social networks and urban public space. New Media Soc. 2010, 12, 763–778. [Google Scholar] [CrossRef]
  90. Roche, S. Geographic information science i. Prog. Hum. Geogr. 2014, 38, 703–711. [Google Scholar] [CrossRef]
  91. Anthopoulos, L.G.; Vakali, A. Urban Planning and Smart Cities: Interrelations and Reciprocities. In The Future Internet Assembly; Springer: New York, NY, USA, 2012; pp. 178–189. [Google Scholar]
  92. Scellato, S.; Noulas, A.; Lambiotte, R.; Mascolo, C. Socio-spatial properties of online location-based social networks. ICWSM 2011, 11, 329–336. [Google Scholar]
  93. Li, N.; Chen, G. Sharing location in online social networks. IEEE Netw. 2010, 24, 20–25. [Google Scholar] [CrossRef] [Green Version]
  94. Chen, C.; Ma, J.; Susilo, Y.; Liu, Y.; Wang, M. The promises of big data and small data for travel behavior (aka human mobility) analysis. Transp. Res. Part C Emerg. Technol. 2016, 68, 285–299. [Google Scholar] [CrossRef] [Green Version]
  95. Hesse, B.W.; Moser, R.P.; Riley, W.T. From big data to knowledge in the social sciences. Ann. Am. Acad. Pol. Soc. Sci. 2015, 659, 16–32. [Google Scholar] [CrossRef]
  96. Gao, H.; Liu, H. Mining human mobility in location-based social networks. Synth. Lect. Data Min. Knowl. Discov. 2015, 7, 1–115. [Google Scholar] [CrossRef]
  97. Yang, C.; Xiao, M.; Ding, X.; Tian, W.; Zhai, Y.; Chen, J.; Liu, L.; Ye, X. Exploring human mobility patterns using geo-tagged social media data at the group level. J. Spat. Sci. 2018, 1–18. [Google Scholar] [CrossRef]
  98. Cheng, Y.; Park, J.; Sandhu, R. Relationship-based access control for online social networks: Beyond user-to-user relationships. In Proceedings of the 2012 International Conference on Privacy, Security, Risk and Trust (PASSAT), Amsterdam, The Netherlands, 3–6 September 2012; IEEE: New York, NY, USA, 2012; pp. 646–655. [Google Scholar]
  99. Kaltenbrunner, A.; Scellato, S.; Volkovich, Y.; Laniado, D.; Currie, D.; Jutemar, E.J.; Mascolo, C. Far from the eyes, close on the web: Impact of geographic distance on online social interactions. In Proceedings of the 2012 ACM Workshop on Workshop on Online Social Networks, Helsinki, Finland, 17 August 2012; ACM: New York, NY, USA, 2012; pp. 19–24. [Google Scholar]
  100. Rzeszewski, M.; Beluch, L. Spatial characteristics of twitter users—Toward the understanding of geosocial media production. ISPRS Int. J. Geo-Inf. 2017, 6, 236. [Google Scholar] [CrossRef]
  101. Guan, W.; Gao, H.; Yang, M.; Li, Y.; Ma, H.; Qian, W.; Cao, Z.; Yang, X. Analyzing user behavior of the micro-blogging website sina weibo during hot social events. Phys. A Stat. Mech. Its Appl. 2014, 395, 340–351. [Google Scholar] [CrossRef]
  102. Feng, Z.; Bo, W.; Yingxue, C. Research on china’s city network based on users’ friend relationships in online social networks: A case study of sina weibo. GeoJournal 2016, 81, 937–946. [Google Scholar] [CrossRef]
  103. Cui, L.; Shi, J. Urbanization and its environmental effects in shanghai, china. Urban Clim. 2012, 2, 1–15. [Google Scholar] [CrossRef]
  104. Han, B.; Cook, P.; Baldwin, T. Geolocation prediction in social media data by finding location indicative words. Proc. COLING 2012 2012, 2012, 1045–1062. [Google Scholar]
  105. Schoen, H.; Gayo-Avello, P.T.M.D.; Gayo-Avello, D.; Takis Metaxas, P.; Mustafaraj, E.; Strohmaier, M.; Gloor, P. The power of prediction with social media. Internet Res. 2013, 23, 528–543. [Google Scholar] [CrossRef] [Green Version]
  106. Backstrom, L.; Sun, E.; Marlow, C. Find me if you can. In Proceedings of the 19th International Conference on World Wide Web—WWW ’10, Raleigh, NC, USA, 26–30 April 2010; ACM: New York, NY, USA, 2010; pp. 61–70. [Google Scholar]
  107. Sun, Y.; Li, M. Investigation of travel and activity patterns using location-based social network data: A case study of active mobile social media users. ISPRS Int. J. Geo-Inf. 2015, 4, 1512–1529. [Google Scholar] [CrossRef]
  108. Gu, Z.; Zhang, Y.; Chen, Y.; Chang, X. Analysis of attraction features of tourism destinations in a mega-city based on check-in data mining: A case study of shenzhen, china. ISPRS Int. J. Geo-Inf. 2016, 5, 210. [Google Scholar] [CrossRef]
  109. Yin, J.; Lampert, A.; Cameron, M.; Robinson, B.; Power, R. Using social media to enhance emergency situation awareness. IEEE Intell. Syst. 2012, 27, 52–59. [Google Scholar] [CrossRef]
  110. Yates, D.; Paquette, S. Emergency knowledge management and social media technologies: A case study of the 2010 haitian earthquake. Int. J. Inf. Manag. 2011, 31, 6–13. [Google Scholar] [CrossRef]
  111. Cervone, G.; Schnebele, E.; Waters, N.; Moccaldi, M.; Sicignano, R. Using social media and satellite data for damage assessment in urban areas during emergencies. In Seeing Cities through Big Data; Springer: Berlin, Germany, 2017; pp. 443–457. [Google Scholar]
  112. Pernici, B.; Francalanci, C.; Scalia, G.; Corsi, M.; Grandoni, D.; Biscardi, M.A. Geolocating social media posts for emergency mapping. arXiv 2018, arXiv:1801.06861. [Google Scholar]
  113. Sims, K.M.; Weber, E.M.; Bhaduri, B.L.; Thakur, G.S.; Resseguie, D.R. Application of social media data to high-resolution mapping of a special event population. In Advances in Geocomputation; Springer: Berlin, Germany, 2017; pp. 67–74. [Google Scholar]
  114. Wang, Y.; Wang, T.; Ye, X.; Zhu, J.; Lee, J. Using social media for emergency response and urban sustainability: A case study of the 2012 beijing rainstorm. Sustainability 2015, 8, 25. [Google Scholar] [CrossRef]
  115. Hong, I. Spatial analysis of location-based social networks in seoul, korea. J. Geogr. Inf. Syst. 2015, 7, 259. [Google Scholar] [CrossRef]
  116. Mazumdar, P.; Patra, B.K.; Babu, K.S.; Lock, R. Hidden location prediction using check-in patterns in location-based social networks. Knowl. Inf. Syst. 2018, 57, 571–601. [Google Scholar] [CrossRef]
  117. Dokuz, A.S.; Celik, M. Discovering socially important locations of social media users. Expert Syst. Appl. 2017, 86, 113–124. [Google Scholar] [CrossRef]
  118. Fiorio, L.; Zagheni, E.; Abel, G.; Hill, J.; Pestre, G.; Letouzé, E.; Cai, J. Understanding patterns of human mobility at different time scales. PAA 2018 Annual Meeting. April 26–28, Denver. 2017, pp. 1–24. Available online: https://paa.confex.com/paa/2018/meetingapp.cgi/Paper/21412 (accessed on 2 April 2019).
  119. Wu, C.; Ye, X.; Ren, F.; Du, Q. Check-in behaviour and spatio-temporal vibrancy: An exploratory analysis in shenzhen, china. Cities 2018, 77, 104–116. [Google Scholar] [CrossRef]
  120. Vikat, A.; Jones, C. Indicators of Gender Equality; United Nations Economic Commission for Europe: Geneva, Switzerland, 2014; pp. 1–130. [Google Scholar]
  121. O’Dorchai, S.; Meulders, D.; Crippa, F.; Margherita, A. She Figures 2009–Statistics and Indicators on Gender Equality in Science; Publications Office of the European Union: Copenhagen, Denmark, 2009. [Google Scholar]
  122. Li, S.-M.; Siu, Y.-M. Residential mobility and urban restructuring under market transition: A study of guangzhou, china. Prof. Geogr. 2001, 53, 219–229. [Google Scholar] [CrossRef]
  123. Dinsa, G.D.; Goryakin, Y.; Fumagalli, E.; Suhrcke, M. Obesity and socioeconomic status in developing countries: A systematic review. Obes. Rev. 2012, 13, 1067–1079. [Google Scholar] [CrossRef]
  124. McMurray, R.G.; Harrell, J.S.; Deng, S.; Bradley, C.B.; Cox, L.M.; Bangdiwala, S.I. The influence of physical activity, socioeconomic status, and ethnicity on the weight status of adolescents. Obes. Res. 2000, 8, 130–139. [Google Scholar] [CrossRef]
  125. Yang, Y.; Li, D.; Mu, D. Levels, seasonal variations and sources of organochlorine pesticides in ambient air of guangzhou, china. Atmos. Environ. 2008, 42, 677–687. [Google Scholar] [CrossRef]
  126. Dong, Z.; Liu, J.; Sha, S.; Li, X.; Dong, J. Regional disparity of real estate investment in china: Characteristics and empirical study in the context of population aging. Eurasia J. Math. Sci. Technol. Educ. 2017, 13, 7799–7811. [Google Scholar] [CrossRef]
  127. Wan, Q.; Ma, G.; Li, J.; Wang, X.; Fan, J.; Li, Q.; Lu, W. A comparison of gps-tec with iri-tec at low latitudes in china in 2006. Adv. Space Res. 2017, 60, 250–256. [Google Scholar] [CrossRef]
  128. Xiong, X.; Jin, C.; Chen, H.; Luo, L. Using the fusion proximal area method and gravity method to identify areas with physician shortages. PLoS ONE 2016, 11, e0163504. [Google Scholar] [CrossRef]
  129. Shen, J.; Kee, G. Shanghai: Urban development and regional integration through mega projects. In Development and Planning in Seven Major Coastal Cities in Southern and Eastern China; Springer: New York, NY, USA, 2017; pp. 119–151. [Google Scholar]
  130. Shen, J.; Kee, G. Development and Planning in Seven Major Coastal Cities in Southern and Eastern China; Springer: New York, NY, USA, 2017; Volume 120. [Google Scholar]
  131. Campagna, M. Social media geographic information: Why social is special when it goes spatial. In European Handbook of Crowdsourced Geographic Information; Ubiquity Press: London, UK, 2016; pp. 45–54. [Google Scholar]
  132. Littman, J.; Chudnov, D.; Kerchner, D.; Peterson, C.; Tan, Y.; Trent, R.; Vij, R.; Wrubel, L. Api-based social media collecting as a form of web archiving. Int. J. Digit. Libr. 2018, 19, 21–38. [Google Scholar] [CrossRef]
  133. Weibo api. Available online: http://open.weibo.com/wiki/API (accessed on 9 December 2018).
  134. Fernandes, R.; D’Souza, R. Analysis of product twitter data though opinion mining. In Proceedings of the 2016 IEEE Annual India Conference (INDICON), Bangalore, India, 16–18 Decmeber 2016; IEEE: New York, NY, USA, 2016; pp. 1–5. [Google Scholar]
  135. Batrinca, B.; Treleaven, P.C. Social media analytics: A survey of techniques, tools and platforms. Ai Soc. 2015, 30, 89–116. [Google Scholar] [CrossRef]
  136. McCoy, J.; Johnston, K. Using Arcgis Spatial Analyst; Esri Redlands: Redlands, CA, USA, 2001. [Google Scholar]
  137. Shen, Y.; Karimi, K. Urban function connectivity: Characterisation of functional urban streets with social media check-in data. Cities 2016, 55, 9–21. [Google Scholar] [CrossRef] [Green Version]
  138. Schwartz, R.; Halegoua, G.R. The spatial self: Location-based identity performance on social media. New Media Soc. 2015, 17, 1643–1660. [Google Scholar] [CrossRef]
  139. Johnson, I.L.; Sengupta, S.; Schöning, J.; Hecht, B. The geography and importance of localness in geotagged social media. In Proceedings of the 2016 CHI Conference on Human Factors in Computing Systems, San Jose, CA, USA, 7–12 May 2016; ACM: New York, NY, USA, 2016; pp. 515–526. [Google Scholar]
  140. Silverman, B.W. Algorithm as 176: Kernel density estimation using the fast fourier transform. J. R. Stat. Soc. Ser. C (Appl. Stat.) 1982, 31, 93–99. [Google Scholar] [CrossRef]
  141. Bowman, A.W. An alternative method of cross-validation for the smoothing of density estimates. Biometrika 1984, 71, 353–360. [Google Scholar] [CrossRef]
  142. Silverman, B.W. Density Estimation for Statistics and Data Analysis; Routledge: New York, NY, USA, 2018. [Google Scholar]
  143. Wu, C.; Ye, X.; Ren, F.; Wan, Y.; Ning, P.; Du, Q. Spatial and social media data analytics of housing prices in shenzhen, china. PLoS ONE 2016, 11, e0164553. [Google Scholar] [CrossRef]
  144. Lichman, M.; Smyth, P. Modeling human location data with mixtures of kernel densities. In Proceedings of the 20th ACM SIGKDD International Conference on Knowledge Discovery and Data Mining—KDD ’14, New York, NY, USA, 24–27 August 2014; ACM: New York, NY, USA, 2014; pp. 35–44. [Google Scholar]
  145. Silverman, B.W. Density Estimation for Statistics and Data Analysis; CRC Press: New York, NY, USA, 1986; Volume 26. [Google Scholar]
  146. King, T.L.; Bentley, R.J.; Thornton, L.E.; Kavanagh, A.M. Using kernel density estimation to understand the influence of neighbourhood destinations on bmi. BMJ Open 2016, 6, e008878. [Google Scholar] [CrossRef]
  147. Li, L.; Goodchild, M.F.; Xu, B. Spatial, temporal, and socioeconomic patterns in the use of twitter and flickr. Cartogr. Geogr. Inf. Sci. 2013, 40, 61–77. [Google Scholar] [CrossRef]
  148. Sun, Y.; Fan, H.; Li, M.; Zipf, A. Identifying the city center using human travel flows generated from location-based social networking data. Environ. Plan. B Plan. Des. 2016, 43, 480–498. [Google Scholar] [CrossRef]
  149. Yuan, N.J.; Zheng, Y.; Xie, X.; Wang, Y.; Zheng, K.; Xiong, H. Discovering urban functional zones using latent activity trajectories. IEEE Trans. Knowl. Data Eng. 2015, 27, 712–725. [Google Scholar] [CrossRef]
  150. Li, H.; Ge, Y.; Hong, R.; Zhu, H. Point-of-interest recommendations: Learning potential check-ins from friends. In Proceedings of the 22nd ACM SIGKDD International Conference on Knowledge Discovery and Data Mining, San Jose, CA, USA, 13–17 August 2016; ACM: New York, NY, USA, 2016; pp. 975–984. [Google Scholar]
  151. Xie, Z.; Yan, J. Kernel density estimation of traffic accidents in a network space. Comput. Environ. Urban Syst. 2008, 32, 396–406. [Google Scholar] [CrossRef]
  152. Pardoux, E.; Peng, S. Adapted solution of a backward stochastic differential equation. Syst. Control Lett. 1990, 14, 55–61. [Google Scholar] [CrossRef]
  153. Hahn, K.; Pflug, P. On a minimal complex norm that extends the real euclidean norm. Mon. Für Math. 1988, 105, 107–112. [Google Scholar] [CrossRef]
  154. Sun, J.; Wang, G.; Cheng, X.; Fu, Y. Mining affective text to improve social media item recommendation. Inf. Process. Manag. 2015, 51, 444–457. [Google Scholar] [CrossRef]
  155. Bao, J.; Liu, P.; Yu, H.; Xu, C. Incorporating twitter-based human activity information in spatial analysis of crashes in urban areas. Accid Anal Prev 2017, 106, 358–369. [Google Scholar] [CrossRef]
  156. Fotheringham, A.S.; Brunsdon, C.; Charlton, M. Geographically Weighted Regression; John Wiley & Sons, Limited West Atrium: New York, NY, USA, 2013. [Google Scholar]
  157. Baojun, W.; Bin, S.; Inyang, H.I. Gis-based quantitative analysis of orientation anisotropy of contaminant barrier particles using standard deviational ellipse. Soil Sediment Contam. 2008, 17, 437–447. [Google Scholar] [CrossRef]
  158. Loo, B.P.; Lam, W. A multilevel investigation of differential individual mobility of working couples with children: A case study of hong kong. Transp. A Transp. Sci. 2013, 9, 629–652. [Google Scholar] [CrossRef]
  159. Liu, Y.; Wang, F.; Xiao, Y.; Gao, S. Urban land uses and traffic ‘source-sink areas’: Evidence from gps-enabled taxi data in shanghai. Landsc. Urban Plan. 2012, 106, 73–87. [Google Scholar] [CrossRef]
  160. Peng, J.; Chen, S.; Lü, H.; Liu, Y.; Wu, J. Spatiotemporal patterns of remotely sensed pm2. 5 concentration in china from 1999 to 2011. Remote Sens. Environ. 2016, 174, 109–121. [Google Scholar] [CrossRef]
  161. Shi, Y.; Matsunaga, T.; Yamaguchi, Y.; Li, Z.; Gu, X.; Chen, X. Long-term trends and spatial patterns of satellite-retrieved pm2.5 concentrations in south and southeast asia from 1999 to 2014. Sci. Total Environ. 2018, 615, 177–186. [Google Scholar] [CrossRef]
  162. Lefever, D.W. Measuring geographic concentration by means of the standard deviational ellipse. Am. J. Sociol. 1926, 32, 88–94. [Google Scholar] [CrossRef]
  163. Nara, A.; Tsou, M.-H.; Yang, J.-A.; Huang, C.-C. The opportunities and challenges with social media and big data for research in human dynamics. In Human Dynamics Research in Smart and Connected Communities; Springer: Berlin, Germany, 2018; pp. 223–234. [Google Scholar]
  164. Nikolaidou, A.; Papaioannou, P. Utilizing social media in transport planning and public transit quality: Survey of literature. J. Transp. Eng. Part A Syst. 2018, 144, 04018007. [Google Scholar] [CrossRef]
  165. Zhou, C.; Xu, X.; Sylvia, S. Population distribution and its change in guangzhou city. Chin. Geogr. Sci. 1998, 8, 193–203. [Google Scholar] [CrossRef]
  166. National Bureau of Statistics of China; National Bureau of Statistics of China: Beijing, China, 2016.
  167. Guangzhou Statistical Yearbook 2013; China Statistics Press: Beijing, China, 2013.
Figure 1. Map of Guangzhou, China.
Sustainability 11 02822 g001
Figure 2. Check-in behavior analytics framework.
Sustainability 11 02822 g002
Figure 3. (a) Land use map of Guangzhou and (b) kernel density of check-in in Guangzhou.
Sustainability 11 02822 g003
Figure 4. (a) Weekly check-in trend. (b) Weekdays and weekend check-in distributions.
Sustainability 11 02822 g004
Figure 5. Gender wise check-in distribution in Guangzhou.
Sustainability 11 02822 g005
Figure 6. Temporal trend of check-in during (a) weekdays and (b) weekend.
Sustainability 11 02822 g006
Figure 7. Check-in distribution in districts of Guangzhou.
Sustainability 11 02822 g007
Figure 8. Weekly check-in distribution of check-ins in districts of Guangzhou.
Sustainability 11 02822 g008
Figure 9. Gender wise check-in distribution in Guangzhou during (a) weekdays (b) and weekend.
Sustainability 11 02822 g009
Figure 10. Gender wise weekly check-in distribution in Guangzhou (a) male and (b) female.
Sustainability 11 02822 g010
Figure 11. Temporal trend of check-in in Guangzhou (a) average daily (b), average daily male (c), and average daily female.
Sustainability 11 02822 g011
Figure 12. Kernel densities of check-in in the districts of Guangzhou.
Sustainability 11 02822 g012
Figure 13. Spatial distribution of check-ins by males and females in Guangzhou.
Sustainability 11 02822 g013
Figure 14. Spatial distribution of check-ins by males and females during weekdays and weekends in Guangzhou.
Sustainability 11 02822 g014
Figure 15. SDEs for check-in distribution by males and females in Guangzhou.
Sustainability 11 02822 g015
Figure 16. SDEs for check-in distribution by males and females during weekdays and weekends in Guangzhou.
Sustainability 11 02822 g016
Figure 17. SDEs for check-in distribution by male and female users in districts of Guangzhou.
Sustainability 11 02822 g017
Figure 18. The trajectory of SDEs center by male users and female users in districts of Guangzhou.
Sustainability 11 02822 g018
Table 1. Estimated GWR parameters for weekdays and weekends by males and females.
WeekdaysWeekend
MinMeanMaxSDp-ValueMinMeanMaxSDp-Value
Male025.7371266.66892.9910.000 ***015.1331206.00158.9040.000 ***
Female031.0781437.804112.4340.001 ***015.117670.30254.2610.000 ***
Diagnostic information: Diagnostic information:
Moran’s I0.2082Moran’s I0.1999
R20.9288R20.9157
AIC10010.62AIC10002.32
Bandwidth0.3000Bandwidth0.3010
*** represents a significance level of 1%.
Table 2. Estimated GWR parameters for weekdays and weekends in districts of Guangzhou.
WeekdaysWeekend
MinMeanMaxSDp-ValueMinMeanMaxSDp-Value
Baiyun068.6881500.464142.1250.010 ***074.8171571.392159.7270.000 ***
Conghua04.7441372.07335.8850.000 ***05.6521727.26345.2940.000 ***
Haizhu0367.8241799.977380.6810.001 ***0418.0282112.234440.1470.010 ***
Huadu031.0901310.87189.0610.000 ***036.4351580.608105.4500.000 ***
Huangpu031.306703.26367.1240.000 ***033.854825.09475.1910.000 ***
Liwan0329.5032092.561413.8530.010 ***0368.5402470.301478.3300.001 ***
Nansha015.854712.00742.4820.000 ***017.645876.95750.1110.010 ***
Panyu067.9061363.761130.8170.001 ***075.2831593.028150.9510.001 ***
Tianhe0334.9863318.354477.3920.001 ***0361.4323778.293519.7510.000 ***
Yuexiu01145.8533011.301664.7190.001 ***01246.4943353.170748.7940.001 ***
Zengcheng09.4961089.74751.3240.000 ***015.4281734.16183.1370.000 ***
Diagnostic information: Diagnostic information:
Moran’s I0.0628Moran’s I0.0600
R20.9203R20.9212
AIC10128.92AIC1010.515
Bandwidth0.3317Bandwidth0.3204
*** represents a significance level of 1%.
Table 3. Estimated GWR parameters for males and females in districts of Guangzhou during weekdays.
MaleFemale
MinMeanMaxSDp-ValueMinMeanMaxSDp-Value
Baiyun043.528937.59888.6740.001 ***050.3391076.319107.0960.000 ***
Conghua03.024902.96823.3230.000 ***03.7451121.84929.5130.000 ***
Haizhu0227.9861108.790236.4940.001 ***0280.0481416.303295.5930.001 ***
Huadu019.686793.07354.6640.000 ***024.2621046.88169.6080.000 ***
Huangpu019.937423.18742.1000.000 ***022.920534.04750.2880.000 ***
Liwan0206.1221395.648258.4720.001 ***0245.6381677.278319.2130.001 ***
Nansha09.984444.81926.7690.000 ***011.908575.09432.8350.010 ***
Panyu043.531824.87081.6600.000 ***050.3231030.00499.9770.010 ***
Tianhe0211.8952112.353304.6140.010 ***0245.4882567.303353.0420.000 ***
Yuexiu0734.6561907.466429.4450.000 ***0845.2722254.169504.6120.010 ***
Zengcheng06.380762.06834.4710.000 ***010.7651222.44557.7400.001 ***
Diagnostic information: Diagnostic information:
Moran’s I0.0665Moran’s I0.0529
R20.9024R20.9186
AIC11334.555AIC11275.415
Bandwidth0.3554Bandwidth0.3138
*** represents a significance level of 1%.
Table 4. Estimated GWR parameters for males and females in districts of Guangzhou during the weekend.
MaleFemale
MinMeanMaxSDp-ValueMinMeanMaxSDp-Value
Baiyun025.160562.86753.8210.010 ***024.478500.14552.8780.000 ***
Conghua01.720483.89912.6870.000 ***01.908605.41515.8490.000 ***
Haizhu0139.838691.187145.2290.001 ***0137.981695.931145.1940.001 ***
Huadu011.405517.79734.9040.000 ***012.173533.72636.2290.000 ***
Huangpu011.369290.52025.5400.000 ***010.935291.04725.1600.000 ***
Liwan0123.381751.988156.6790.010 ***0122.901806.843159.5330.010 ***
Nansha05.871267.18816.0190.010 ***05.736301.86217.5330.000 ***
Panyu024.375538.89249.5670.001 ***024.960563.02451.2920.000 ***
Tianhe0123.0911206.001173.3880.000 ***0115.9431210.991167.1070.001 ***
Yuexiu0411.1971103.834237.5920.001 ***0401.2221108.737245.1310.001 ***
Zengcheng03.115327.67917.0240.000 ***04.663511.71625.6040.000 ***
Diagnostic information: Diagnostic information:
Moran’s I0.0367Moran’s I0.0580
R20.9264R20.9020
AIC10511.428AIC10050.409
Bandwidth0.3315Bandwidth0.3449
*** represents a significance level of 1%.
Table 5. SDE features on the major axis, minor axis, area, azimuth, and flattering in Guangzhou.
Major Axis (km)Minor Axis (km)Area (km2)Azimuth°Flattering
Male49.1137.755823.191791.301
Female49.4140.866343.1231.209
Table 6. SDE features on the major axis, minor axis, area, azimuth, and flattering during weekdays and weekends in Guangzhou.
Major Axis (km)Minor Axis (km)Area (km2)Azimuth°Flattering
WeekdaysMale49.1541.205888.831791.1931
Female49.3038.146381.8951.2927
WeekendsMale49.0340.135705.791741.2218
Female49.6437.046258.4611.3403
Table 7. SDE features on the major axis, minor axis, area, azimuth, and flattering in districts of Guangzhou.
Major Axis (km)Minor Axis (km)Area (km2)Azimuth°Flattering
BaiyunMale10.765.68191.87291.8951
Female10.755.62189.80311.9130
ConghuaMale8.3918.50487.26512.2056
Female8.0916.94430.80502.0933
HaizhuMale2.044.6229.54992.2675
Female2.015.5835.30982.7727
HuaduMale5.9610.15190.00721.7041
Female5.909.91183.82711.6793
HuangpuMale11.266.45227.9761.7464
Female11.066.38221.6491.7328
LiwanMale4.071.7422.21132.3412
Female3.991.7221.53142.3191
NanshaMale6.3313.18262.131222.0810
Female6.3012.98290.501222.0612
PanyuMale6.427.93143.031201.2347
Female6.437.96160.781211.2389
TianheMale3.265.5859.99971.7093
Female3.244.6247.06981.4253
YuexiuMale1.792.7215.32941.5149
Female1.812.7215.44941.5073
ZengchengMale20.497.85505.09422.6103
Female20.3711.81661.52371.7252

